Hepatitis C Virus (HCV) Infection and Neurocognitive Impairment in Subjects with Mild Liver Disease

 ,
,
Abstract
:1. Introduction
2. Materials and Methods
2.1. Study Design
2.2. Settings and Participants (Patients and Controls)
2.3. Procedures
2.3.1. Depression Screening
2.3.2. Liver Fibrosis Assessment
2.3.3. Blood Tests
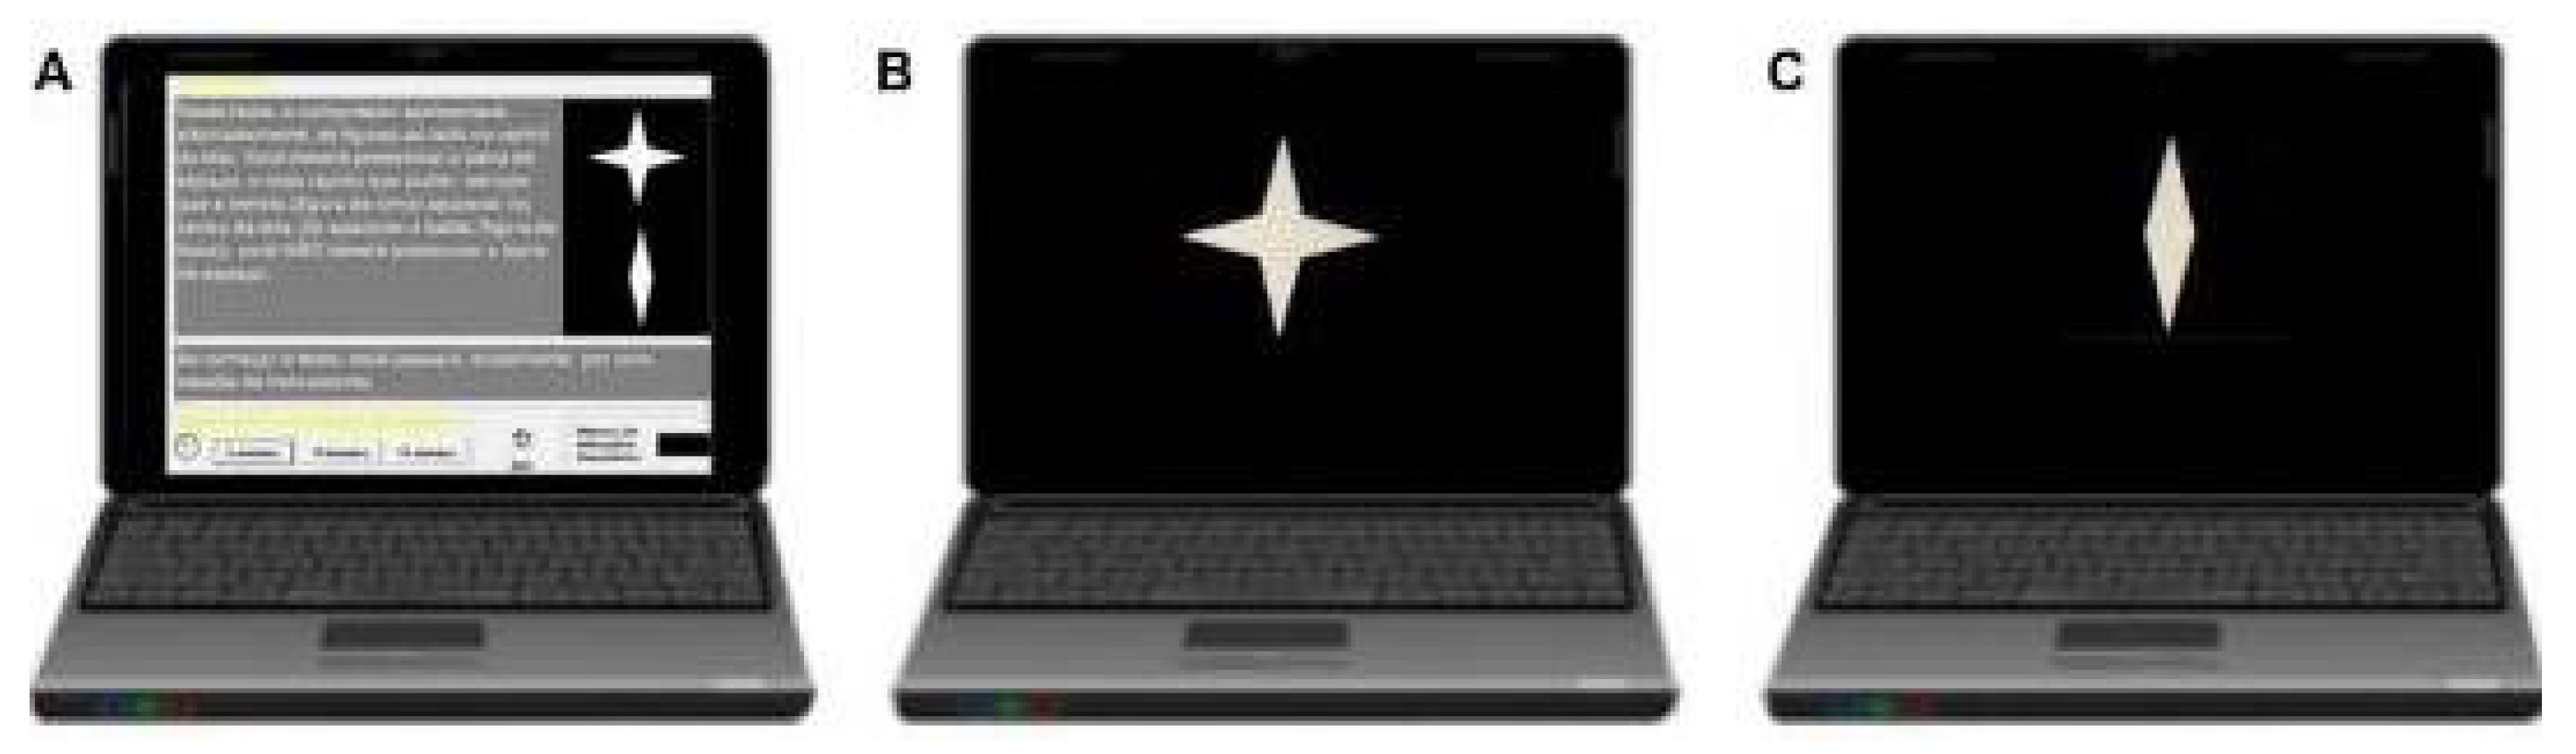
2.3.4. Neuropsychological Instruments
2.3.5. Variables of the Study
2.4. Statistical Analysis
2.4.1. Definition of Cognitive Impairment
2.4.2. Sample Size Calculation (Power Analysis)
2.4.3. Descriptive Analysis: Demographics, Laboratory Findings, and Clinical Data
2.4.4. Main Objective: Quantitative Analysis of the Differences in Cognitive Performance between Untreated and Asymptomatic HCV Carriers (n = 28) and Healthy Controls (n = 18)
3. Results
3.1. Demographic and Clinical Data (Table 1, Table 2 and Table 3)

| Demographic Characteristics | HCV Whole Sample (n = 48) | HCV Eliminated Group (n = 20) | HCV Mild Hepatitis Group (n = 28) | Control Group (n = 18) |
|---|---|---|---|---|
| Age (mean ± SD) | 53.89 ± 12.64 | 57.85 ± 13.17 | 51.07 ± 11.69 | 42.83 ± 15.86 |
| Female (n/%) | 26 (54.16%) | 9 (45%) | 17 (60.71%) | 17 (94.44%) |
| Years of Formal Education (mean ± SD) | 11.77 ± 5.03 | 10.75 ± 5.32 | 12.5 ± 4.78 | 15 ± 3.37 |
| HDI (mean ± SD) | 0.81± 0.07 | 0.80 ± 0.07 | 0.81 ± 0.07 | 0.78 ± 0.05 |
| Characteristics | HCV Whole Sample (n = 48) | HCV Eliminated Group (n = 20) | HCV-Mild Hepatitis Group (n = 28) | |
|---|---|---|---|---|
| Disease Evolution Time | Years (mean ± SD) | 12.08 ± 7.64 | 13.05 ± 7.78 | 11.39 ± 7.60 |
| Transmission | Transfusion | 25 (52.08%) | 10 (50%) | 15 (53.57%) |
| Sporadic | 12 (25%) | 7 (35%) | 5 (17.85%) | |
| Others | 2 (4.16%) | - | 2 (7.14%) | |
| Sexual | 3 (6.25%) | 1 (5%) | 2 (7.14%) | |
| Illicit drugs | 6 (12.5%) | 2 (10%) | 4 (14.28%) | |
| Viral genotype | Genotype (1:non 1) | 41:7 | 18:2 | 23:5 |
| Grade of Fibrosis | Fibrosis (F0–F2) | 36 (75%) | 13 (65%) | 23 (82.14%) 5 (17.85%) |
| Fibrosis (F3) | 6 (12.5%) | 1 (5%) | ||
| Fibrosis (F4) | 6 (12.5%) | 6 (30%) | ||
| Laboratory Value (mean ± SEM) | AST | 50.21 ± 5.25 | 42.13 ± 5.55 | 55.73 ± 8.03 |
| ALT | 61 ± 7.56 | 49.90 ± 6.96 | 67.77 ± 11.84 | |
| GGT | 73.28 ± 12.07 | 75.66 ± 16.92 | 72.04 ± 16.89 | |
| TB | 0.66 ± 0.04 | 0.66 ± 0.06 | 0.67 ± 0.06 | |
| Albumin | 4.23 ± 0.15 | 4.17 ± 0.12 | 4.26 ± 0.24 | |
| Platelets | 214,068 ± 10,361.22 | 188,333 ± 18,440.04 | 231,885 ± 11,070.85 | |
| INR | 1.03 ± 0.02 | 1.01 ± 0.01 | 1.04 ± 0.04 | |
| Leukocytes | 5470 ± 237.97 | 5427 ± 390.62 | 5499 ± 304.61 | |
| Hemoglobin | 13.91 ± 0.38 | 14.07 ± 0.43 | 13.80 ± 0.57 | |
| Glucose | 99.27 ± 5.40 | 116.35 ± 12.30 | 88.51 ± 2.29 | |
| Urea | 27.35 ± 1.29 | 31.07 ± 1.76 | 25.14 ± 1.65 | |
| Creatinine | 0.81 ± 0.02 | 0.84 ± 0.03 | 0.80 ± 0.03 | |
| Neuropsychological Battery (Mean ± SEM) | HCV—Initial Sample (n = 48) | HCV Eliminated Group (n = 20) | Mild Hepatitis HCV Group (n = 28) | Control Group (n = 18) | |
|---|---|---|---|---|---|
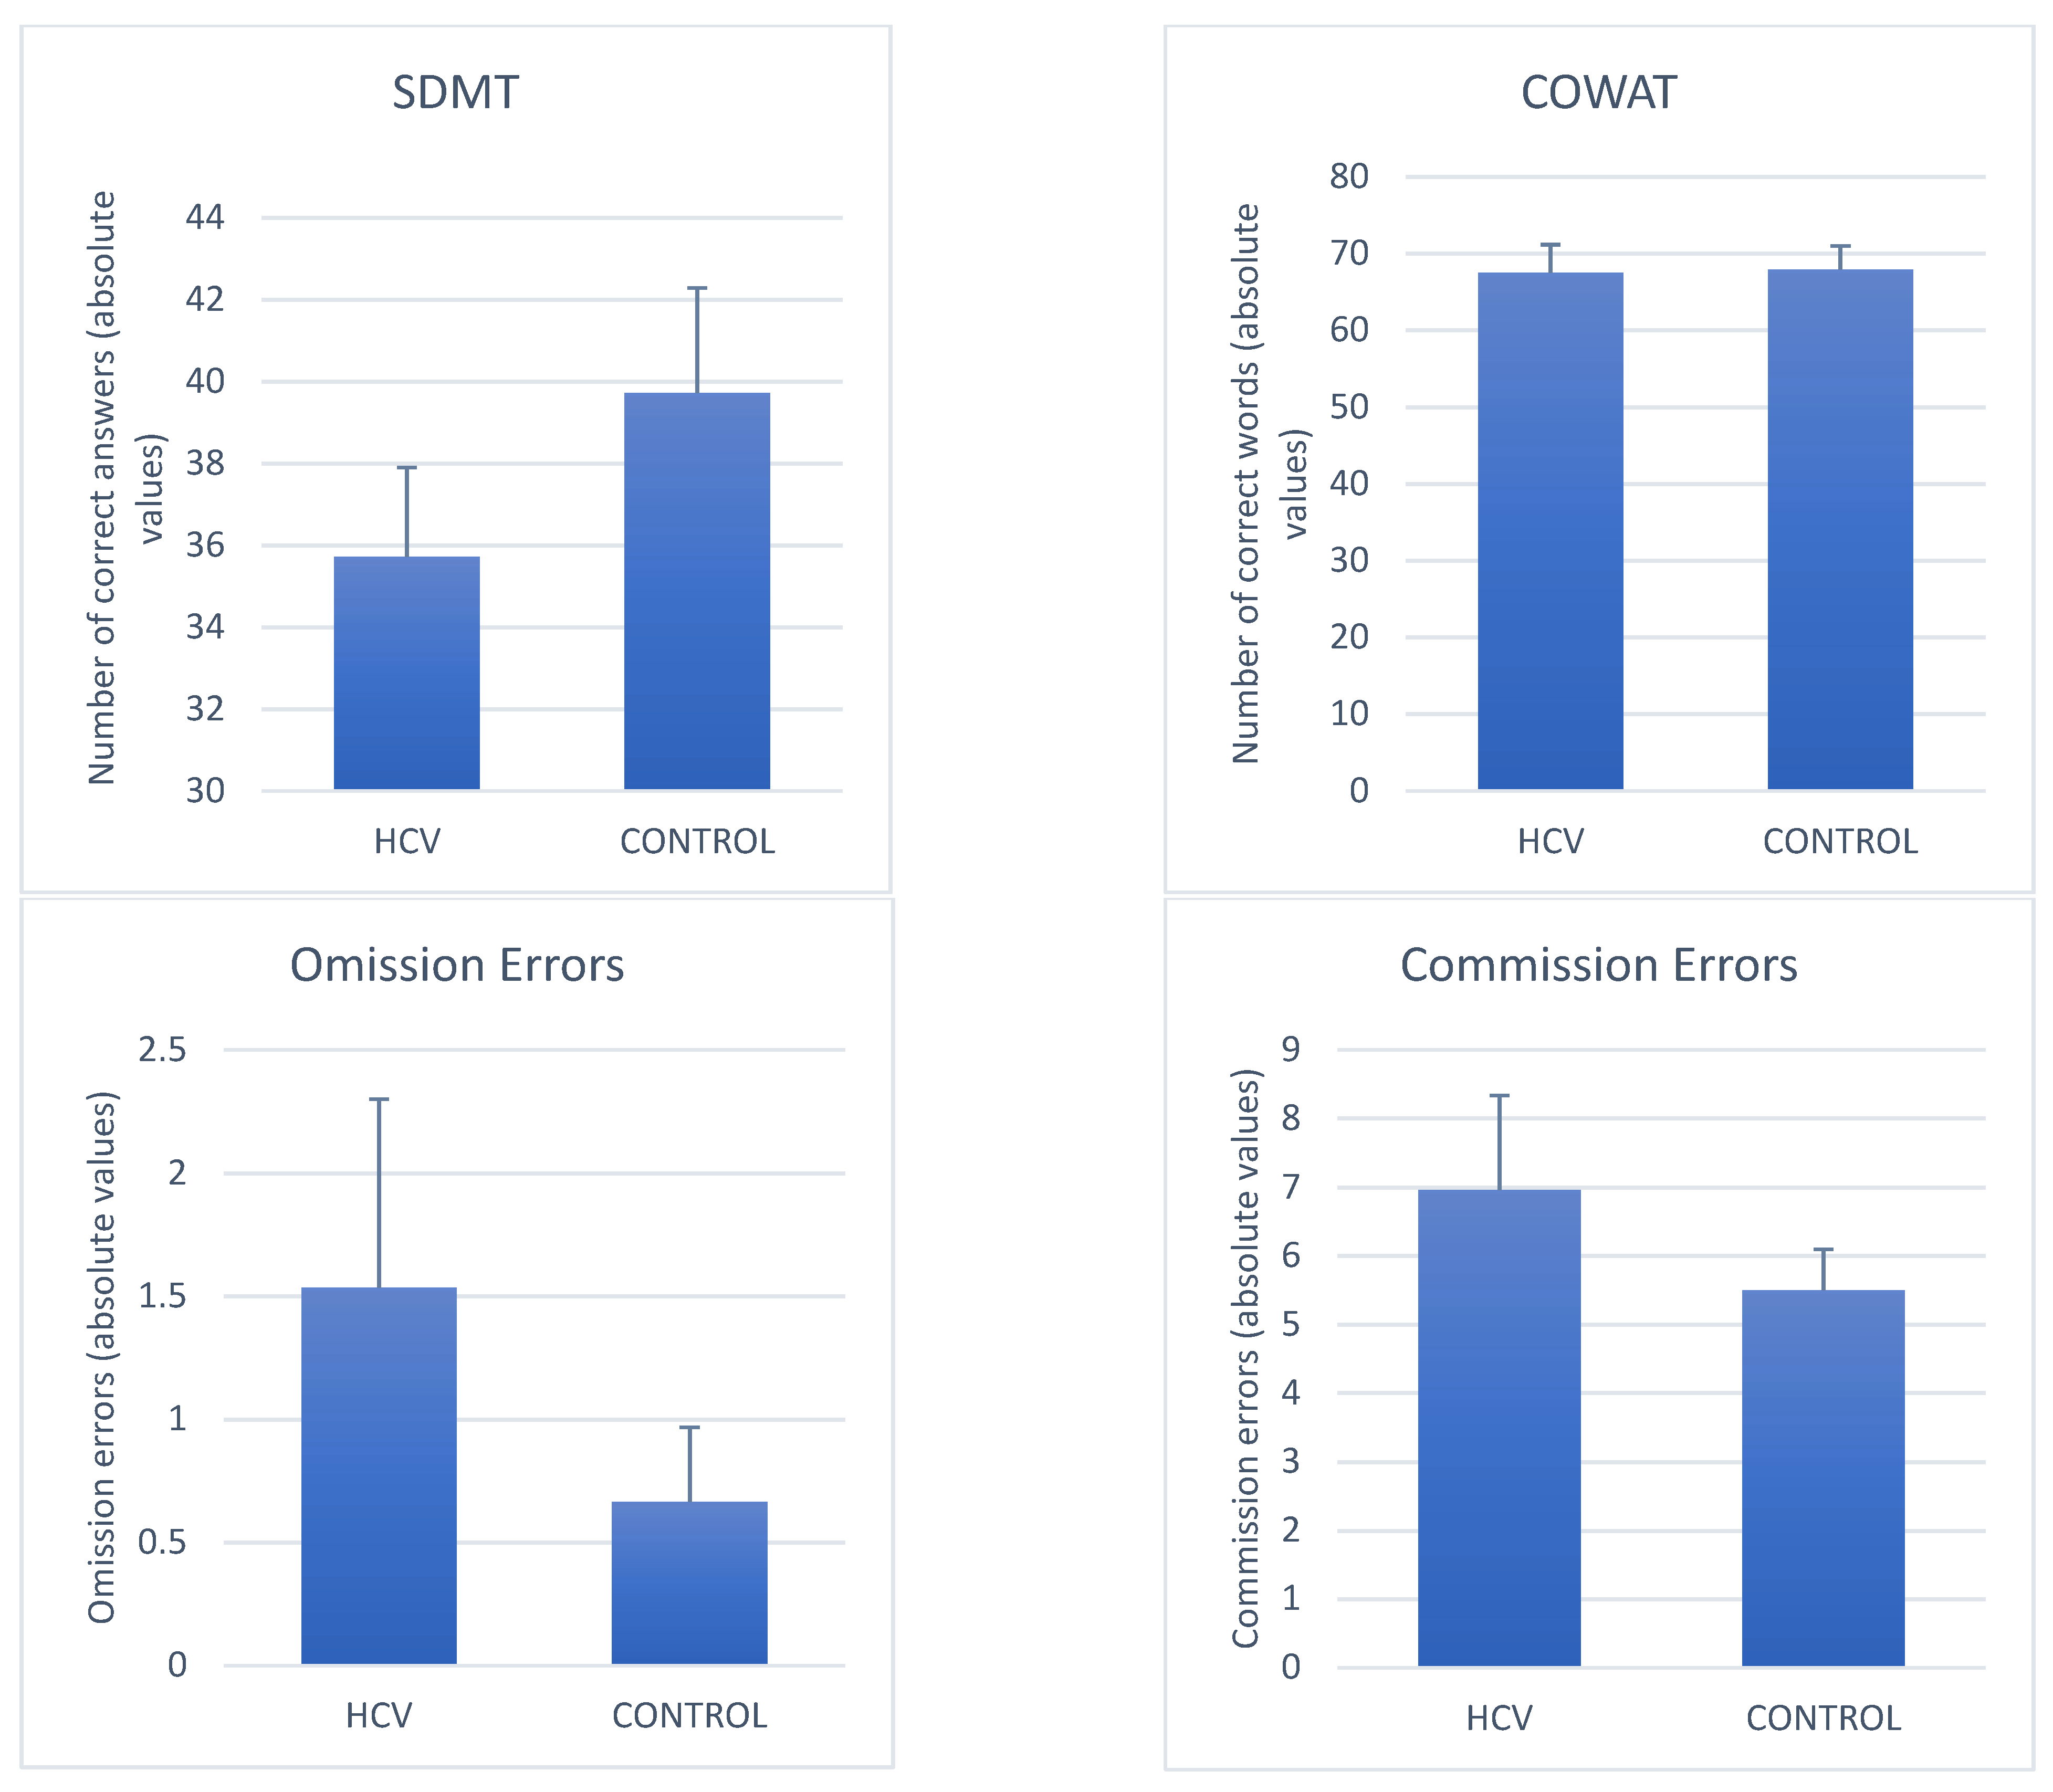
| COWAT | FL (Animal + Fruit) + FAS | 66.2 ± 2.80 | 64.5 ± 4.48 | 67.5 ± 3.63 | 67.9 ± 3.08 |
| SDMT | Number of correct answers | 32.35 ± 1.82 | 27.65 ± 2.85 | 35.71 ± 2.18 | 39.72 ± 2.56 |
| OE | 2.87± 0.91 | 4.75 ± 1.88 | 1.54 ± 0.76 | 0.67 ± 0.30 | |
| CVAT | CE | 6.14 ± 0.89 | 5.00 ± 0.95 | 6.96 ± 1.36 | 5.50 ± 0.59 |
| RT (ms) | 453.83 ± 9.67 | 463.35 ± 16.90 | 448.18 ± 11.14 | 408.33 ± 6.84 | |
| VRT (ms) | 93.0 ± 5.54 | 99.05 ± 12.47 | 88.71 ± 3.46 | 78.94 ± 3.39 | |
3.2. Quantitative Analyses (Controls vs. Mild HCV)
3.2.1. Average Differences in Neuropsychological Performance between Mild HCV and Controls (Figure 2)

3.2.2. Variables That Discriminated Mild HCV from Controls
3.3. Clinical Significance of the Differences
4. Discussion
4.1. Verbal Fluency (COWAT)
4.2. SDMT
4.3. CVAT
4.4. Limitations and Strengths
5. Conclusions
Author Contributions
Funding
Institutional Review Board Statement
Informed Consent Statement
Data Availability Statement
Acknowledgments
Conflicts of Interest
References
- Choo, Q.L.; Kuo, G.; Weiner, A.J.; Overby, L.R.; Bradley, D.W.; Houghton, M. Isolation of a cDNA clone derived from a blood-borne Non-A, Non-B viral hepatitis genome. Science 1989, 244, 359–362. [Google Scholar] [CrossRef] [Green Version]
- Craxi, A.; Laffi, G.; Zignego, A.L. Hepatitis C Virus (HCV) infection: A systemic disease. Mol. Asp. Med. 2008, 29, 85–95. [Google Scholar] [CrossRef]
- Blach, S.; Zeuzem, S.; Manns, M.; Ibrahim, A. Global prevalence and genotype distribution of hepatitis C virus infection in 2015: A modelling study. Lancet Gastroenterol. Hepatol. 2017, 2, 161–176. [Google Scholar] [CrossRef] [PubMed] [Green Version]
- The Polaris Observatory HCV Collaborators. Global change in hepatitis C virus prevalence and cascade of care between 2015 and 2020: A modelling study. Lancet Gastroenterol. Hepatol. 2022, 7, 396–415. [Google Scholar] [CrossRef] [PubMed]
- Brazilian Ministry of Health. Clinical Protocol and Therapeutic Guidelines for Hepatitis C and Co-Infections; Brazilian Ministry of Health: Brasilia, Brazil, 2018.
- Zignego, A.L.; Bréchot, C. Extrahepatic manifestations of HCV infection: Facts and controversies. J. Hepatol. 1999, 31, 369–376. [Google Scholar] [CrossRef] [PubMed]
- Zignego, A.L.; Ferri, C.; Pileri, S.A.; Caini, P.; Bianchi, F.B. Extrahepatic manifestations of hepatitis C virus infection: A general overview and guidelines for a clinical approach. Dig. Liver Dis. 2007, 39, 2–17. [Google Scholar] [CrossRef] [PubMed]
- Zignego, A.L.; Craxi, A. Extrahepatic manifestations of hepatitis C virus infection. Clin. Liver Dis. 2008, 12, 611–636. [Google Scholar] [CrossRef] [PubMed]
- Cacoub, P.; Gragnani, L.; Comarmond, C.; Zignego, A.L. Extrahepatic manifestations of chronic hepatites C vírus infection. Dig. Liver Dis. 2014, 46 (Suppl. S5), S165–S173. [Google Scholar] [CrossRef] [Green Version]
- Jacobson, I.M.; Cacoub, P.; Dal Maso, L.; Harrison, S.A.; Younossi, Z.M. Manifestations of chronic hepatitis C virus infection beyond the liver. Clin. Gastroenterol. Hepatol. 2010, 8, 1017–1029. [Google Scholar] [CrossRef]
- Negro, F.; Forton, D.; Craxi, A.; Sulkowski, M.S. Extrahepatic Morbidity and Mortality of Chronic Hepatitis C. Gastroenterology 2015, 149, 1345–1360. [Google Scholar] [CrossRef] [Green Version]
- Sherlock, S.; Summerskill, W.H.; White, L.P.; Phear, E.A. Portal-systemic encephalopathy. Neurological complications of liver disease. Lancet 1954, 267, 454–457. [Google Scholar] [CrossRef] [PubMed]
- Ferenci, P.; Lockwood, A.; Mullen, K.; Tarter, R.; Weissenborn, K.; Blei, A.T. Hepatic encephalopathy-definition, nomenclature, diagnosis, and quantifcation: Final report of the working party at the 11th World Congresses of Gastroenterology, Vienna, 1998. Hepatology 2002, 35, 716–721. [Google Scholar] [CrossRef] [PubMed]
- Rose, C.F.; Amodio, P.; Bajaj, J.S.; Dhiman, R.K.; Montagnese, S.; Taylor-Robinson, S.D.; Vilstrup, H.; Jalan, R. Hepatic encepalopathy: Novel insights into classification, pathophysiology and therapy. J. Hepatol. 2020, 73, 1526–1547. [Google Scholar] [CrossRef] [PubMed]
- Torres, D.S.; Abrantes, J.; Brandão-Mello, C.E. Cognitive and neurophysiological assessment of patients with minimal hepatic encephalopathy in Brazil. Sci. Rep. 2020, 10, 8610. [Google Scholar] [CrossRef] [PubMed]
- Radkowski, M.; Wilkinson, J.; Nowicki, M.; Adair, D.; Vargas, H.; Ingui, C.; Rakela, J.; Laskus, T. Search for hepatitis C virus negative-strand RNA sequences and analysis of viral sequences in the central nervous system: Evidence of replication. J. Virol. 2002, 76, 600–608. [Google Scholar] [CrossRef] [PubMed] [Green Version]
- Vargas, H.E.; Laskus, T.; Radkowski, M.; Wilkinson, J.; Balan, V.; Douglas, D.D.; Harrison, M.E.; Mulligan, D.C.; Olden, K.; Adair, D.; et al. Detection of hepatitis C virus sequence in brain tissue obtained in recurrent hepatitis C after liver transplantation. Liver Transplant. 2002, 8, 1014–1019. [Google Scholar] [CrossRef]
- Wilkinson, J.; Radkowski, M.; Eschbacher, J.M.; Laskus, T. Activation of brain macrophages/microglia cells in hepatitis C infection. Gut 2010, 59, 1394–1400. [Google Scholar] [CrossRef]
- Wilkinson, J.; Radkowski, M.; Laskus, T. Hepatitis C virus neuroinvasion: Identification of infected cells. J. Virol. 2009, 83, 1312–1319. [Google Scholar] [CrossRef] [Green Version]
- Forton, D.M.; Thomas, H.C.; Murphy, C.A.; Allsop, J.M.; Foster, G.R.; Main, J.; Wesnes, K.A.; Taylor-Robinson, S.D. Hepatitis C and cognitive impairment in a cohort of patients with mild liver disease. Hepatology 2002, 35, 433–439. [Google Scholar] [CrossRef]
- Hilsabeck, R.C.; Perry, W.; Hassanein, T.I. Neuropsychological impairment in patients with chronic hepatitis C. Hepatology 2002, 35, 440–446. [Google Scholar] [CrossRef]
- Hilsabeck, R.C.; Hassenein, T.I.; Carlson, M.D.; Ziegler, E.A.; Perry, W. Cognitive function and psychiatric symptomatology in patients with chronic hepatitis C. J. Int. Neuropsychol. Soc. 2003, 9, 847–854. [Google Scholar] [CrossRef]
- Hilsabeck, R.C.; Anstead, G.M.; Webb, A.L.; Hoyumpa, A.; Ingmundson, P.; Holliday, S.; Zhang, Q.; Casas, A.M.; Jovel, M.; Stern, S.L. Cognitive efficiency is associated with endogenous cytokine levels in patients with chronic hepatitis C. J. Neuroimmunol. 2010, 221, 53–61. [Google Scholar] [CrossRef]
- Weissenborn, K.; Krause, J.; Bokemeyer, M.; Hecker, H.; Schüler, A.; Ennen, J.C.; Ahl, B.; Manns, M.P.; Böker, K.W. Hepatitis C virus infection affects the brain-evidence from psychometric studies and magnetic resonance spectroscopy. J. Hepatol. 2004, 41, 845–851. [Google Scholar] [CrossRef]
- Weissenborn, K.; Bokemeyer, M.; Krause, J.; Ennen, J.; Ahl, B. Neurological and Neuropsychiatric syndromes associated with liver disease. AIDS 2005, 19 (Suppl. S3), S93–S98. [Google Scholar] [CrossRef]
- Weissenborn, K.; Ennen, J.C.; Bokemeyer, M.; Ahl, B.; Wurster, U.; Tillmann, H.; Trebst, C.; Hecker, H.; Berding, G. Monoaminergic neurotransmission is altered in hepatitis C virus infected patients with chronic fatigue and cognitive impairment. Gut 2006, 55, 1624–1630. [Google Scholar] [CrossRef] [Green Version]
- Córdoba, J.; Flavià, M.; Jacas, C.; Sauleda, S.; Esteban, J.I.; Vargas, V.; Esteban, R.; Guardia, J. Quality of life and cognitive function in hepatitis C at different stages of liver disease. J. Hepatol. 2003, 39, 231–238. [Google Scholar] [CrossRef] [PubMed]
- Abrantes, J.; Torres, D.S.; Brandão-Mello, C.E. Patients with hepatitis C infection and normal liver function: An evaluation of cognitive function. Postgrad. Med. J. 2013, 89, 433–439. [Google Scholar] [CrossRef] [Green Version]
- Abrantes, J.; Torres, D.S.; Brandão-Mello, C.E. The many difficulties and subtleties in the cognitive assessment of chronic hepatitis C infection. Int. J. Hepatol. 2020, 2020, 9675235. [Google Scholar] [CrossRef] [PubMed] [Green Version]
- Abrantes, J.; Torres, D.S.; Brandão-Mello, C.E. Patients with hepatitis C infection and normal liver function: A neuropsychological and neurophysiological assessment of cognitive functions. Int. J. Hepatol. 2021, 2021, 8823676. [Google Scholar] [CrossRef]
- Tan, C.-H.; Chang, M.-C.; Tsai, W.-F.; Chuang, W.-L.; Huang, J.-F.; Lin, Z.-Y.; Dai, C.-Y.; Yeh, M.-L.; Li, C.-T.; Yu, R.-L. Different profiles of neurocognitive impairment in patients with hepatitis B and C virus infections. Sci. Rep. 2022, 12, 10625. [Google Scholar] [CrossRef] [PubMed]
- Fletcher, N.F.; Mckeating, A. Hepatitis C virus and the brain. J. Viral Hepat. 2012, 19, 301–306. [Google Scholar] [CrossRef] [PubMed]
- Fletcher, N.F.; Wilson, G.K.; Murray, J.; Hu, K.; Lewis, A.; Reynolds, G.M.; Stamataki, Z.; Meredith, L.W.; Rowe, I.A.; Luo, G.; et al. Hepatitis C Virus Infects the Endothelial Cells of the Blood-Brain Barrier. Gastroenterology 2012, 142, 634–643.e6. [Google Scholar] [CrossRef] [PubMed] [Green Version]
- Schmidt, S.L.; Correa, P.L.; Tolentino, J.C.; Manhães, A.C.; Felix, R.M.; Azevedo, J.C.; Barbirato, G.B.; Mendes, M.H.F.; Boechat, Y.; Cabral, H.; et al. Value of combining activated brain FDG-PET and cardiac MIBG for the differential diagnosis of dementia: Differentiation of dementia with Lewy bodies and Alzheimer disease when the diagnoses based on clinical and neuroimaging criteria are difficult. Clin. Nucl. Med. 2008, 33, 398–401. [Google Scholar] [CrossRef]
- Mulert, C.; Gallinat, J.; Dorn, H.; Herrmann, W.M.; Winterer, G. The relationship between reaction time, error rate and anterior cingula córtex activity. Int. J. Psychophysiol. 2003, 47, 175–183. [Google Scholar] [CrossRef] [PubMed]
- Do Carmo Filho, A.; Van Duinkerken, E.; Tolentino, J.C.; Schmidt, S.L. Attention profile of physically recovered COVID-19 inpatients on the day of discharge. J. Psychiatr. Res. 2022, 150, 189–196. [Google Scholar] [CrossRef]
- Schmidt, S.L.; Boechat, Y.E.; Schmidt, G.J.; Nicaretta, D.H.; van Duinkerken, E.; Schmidt, J.J. Clinical utility of reaction-time attention task in the evaluation of cognitive impairment in elderly with high educational dispairity. J. Alzheimers Dis. 2021, 81, 691–697. [Google Scholar] [CrossRef]
- Simões, E.N.; Carvalho, A.L.N.; Schmidt, S.L. What does handedness reveal about ADHD? An analysis based on CPT performance. Res. Dev. Disabil. 2017, 65, 46–56. [Google Scholar] [CrossRef]
- Simões, E.N.; Carvalho, A.L.N.; Schmidt, S.L. The role of visual and of auditory stimuli in continuos performance tests: Differential Effects on Children With ADHD. J. Atten. Disord. 2021, 25, 53–62. [Google Scholar] [CrossRef] [Green Version]
- Simões, E.N.; Padilla, C.S.; Bezerra, M.S.; Schmidt, S.L. Analysis of attention subdomains in obstrutive sleep apnea patients. Front. Psychiatry 2018, 9, 435. [Google Scholar] [CrossRef] [Green Version]
- Unesco. Global Education Monitoring Report: Education for People and Planet. 2016. Available online: https://unesdoc.unesco.org/images/0024/002457/245752e.pdf (accessed on 8 October 2022).
- IBGE.PNAD Continua. 2019. Available online: https://biblioteca.ibge.gov.br/visualizacao/livros/live101657_informativo.pdf (accessed on 8 October 2022).
- American Psychiatric Association. DSM-V. In Diagnostic and Statistical Manual of Mental Disorders, 5th ed.; American Psychiatric Association: Washington, DC, USA, 2015. [Google Scholar]
- Bedossa, P.; Poynard, T. An algorithm for grading of activity in chronic hepatitis C. Hepatology 1996, 24, 289–293. [Google Scholar] [CrossRef]
- Lin, Z.-H.; Xin, Y.-N.; Dong, Q.-J.; Wang, Q.; Jiang, X.-J.; Zhan, S.-H.; Sun, Y.; Xuan, S.-Y. Performance of the aspartate aminotransferase-to-platelet ratio index for the staging of hepatitis C-related fibrosis: An update meta-analysis. Hepatology 2011, 53, 726–736. [Google Scholar] [CrossRef] [PubMed]
- Lesak, M.D. Neuropsichological Assessment, 4th ed.; Oxford Unit Press: New York, NY, USA, 2012. [Google Scholar]
- Vanotti, S.; Cores, E.V.; Eizaguirre, B.; Angeles, M.; Rey, R.; Villa, A.; Caceres, F. Normatization of the symbol digit modalities test-oral version in a Latin American Country. Appl. Neuropsychol. Adult 2015, 22, 46–53. [Google Scholar] [CrossRef] [PubMed]
- Schmidt, G.J.; Boechat, Y.E.M.; van Duinkerken, E.; Schmidt, J.J.; Moreira, T.B.; Nicaretta, D.H.; Schmidt, S.L. Detection of cognitive disfunction in elderly with a low educational level using a rection-time attention task. J. Alzheimers Dis. 2020, 78, 1197–1205. [Google Scholar] [CrossRef]
- Jaywant, A.; Vanderlind, W.M.; Alexopoulos, G.S.; Fridman, C.B.; Perlis, R.H.; Gunning, F.M. Frequency and profile of objective cognitive deficits in hospitalized patients recovering from COVID-19. Neuropsychopharmacology 2021, 46, 2235–2240. [Google Scholar] [CrossRef]
- Miskowiak, K.; Johnsen, S.; Sattler, S.; Nielsen, S.; Kunalan, K.; Rungby, J.; Lapperre, T.; Porsberg, C. Cognitive impairments four months after COVID-19 hospital discharge: Pattern, severity and association with illness variables. Eur. Neuropsychopharmacol. 2021, 46, 39–48. [Google Scholar] [CrossRef]
- Henneghan, A.M.; Lewis, K.A.; Gill, E.; Kesler, S.R. Kesler-Cognitive Impairment in Non-critical, Mild-to-Moderate COVID-19 Survivors. Front. Psychol. 2022, 13, 365. [Google Scholar] [CrossRef] [PubMed]
- Jak, A.J.; Bondi, M.W.; Delano-Wood, L.; Wierenga, C.; Corey-Bloom, J.; Salmon, D.P.; Delis, D.C. Quantification of five neuropsychological approaches to defining mild cognitive impairment. Am. J. Geriatr. Psychiatry 2009, 17, 368–375. [Google Scholar] [CrossRef] [Green Version]
- STROBE Statement–checklist of items that should be included in reports of observational studies1 (© STROBE Initiative). Int. J. Public Health 2008, 53, 3–4. [CrossRef]
- Cohen, J. Statistical Power Analysis for the Behavioral Sciences; Eribaum Associates, L., Ed.; Academic Press: Hillsdale, MI, USA, 1988. [Google Scholar]
- Pearce, N. Analysis of matched case-control studies. BMJ 2016, 352, i969. [Google Scholar] [CrossRef] [Green Version]
- Karaivazoglou, K.; Assimakopoulos, K.; Thomopoulos, K.; Theocharis, G.; Messinis, L.; Sakellaropoulos, G.; Labropoulou-Karatza, C. Neuropsychological function in Greek patients with chronic hepatitis C. Liver Int. 2007, 27, 798–805. [Google Scholar] [CrossRef]
- Huckans, M.; Seelye, A.; Parcel, T.; Mull, L.; Woodhouse, J.; Bjornson, D.; Fuller, B.E.; Loftis, J.M.; Morasco, B.J.; Sasaki, A.W.; et al. The cognitive effect of hepatitis C in the presence and absence of a history of substance use disorder. J. Int. Neuropsychol. Soc. 2009, 15, 69–82. [Google Scholar] [CrossRef] [Green Version]
- Ibrahim, I.; Salah, H.; El Sayed, H.; Mansour, H.; Eissa, A.; Wood, J.; Fathi, W.; Tobar, S.; Gur, R.C.; Gur, R.E.; et al. Hepatitis C virus antibody titers associated with cognitive dysfunction in an asymptomatic community-based sample. J. Clin. Exp. Neuropsychol. 2016, 38, 861–868. [Google Scholar] [CrossRef] [Green Version]
- Ramchurn, A.; de Fockert, J.W.; Mason, L.; Darling, S.; Bunce, D. Intraindividual reaction time variability affects P300 amplitude rather than latency. Front. Hum. Neurosci. 2014, 8, 557. [Google Scholar] [CrossRef] [PubMed]
- Bakker, A.; Cai, J.; English, L.; Kaiser, G.; Mesa, V.; Van Dooren, W. Beyond small, medium, or large: Points of consideration when interpreting effect sizes. Educ. Stud. Math. 2019, 102, 1–8. [Google Scholar] [CrossRef] [Green Version]
- Lowndes, G.J.; Saling, M.M.; Ames, D.; Chiu, E.; Gonzalez, L.M.; Savage, G.R. Recall and recognition of verbal paired associates in early Alzheimer’s disease. J. Int. Neuropsychol. Soc. 2008, 14, 591–600. [Google Scholar] [CrossRef] [PubMed] [Green Version]
- Pauline, E.J. Spaan|Cornelia Duregger (Reviewing Editor) Episodic and semantic memory impairments in (very) early Alzheimer’s disease: The diagnostic accuracy of paired-associate learning formats. Cogent. Psychol. 2016, 3, 1125076. [Google Scholar] [CrossRef]

Disclaimer/Publisher’s Note: The statements, opinions and data contained in all publications are solely those of the individual author(s) and contributor(s) and not of MDPI and/or the editor(s). MDPI and/or the editor(s) disclaim responsibility for any injury to people or property resulting from any ideas, methods, instructions or products referred to in the content. |
© 2023 by the authors. Licensee MDPI, Basel, Switzerland. This article is an open access article distributed under the terms and conditions of the Creative Commons Attribution (CC BY) license (https://creativecommons.org/licenses/by/4.0/).
Share and Cite
Amendola-Pires, M.M.; Fakoury, M.K.; Salazar, H.; De Oliveira, S.B.; Brandão-Mello, C.E.; Schmidt, S.L. Hepatitis C Virus (HCV) Infection and Neurocognitive Impairment in Subjects with Mild Liver Disease. J. Clin. Med. 2023, 12, 3910. https://doi.org/10.3390/jcm12123910
Amendola-Pires MM, Fakoury MK, Salazar H, De Oliveira SB, Brandão-Mello CE, Schmidt SL. Hepatitis C Virus (HCV) Infection and Neurocognitive Impairment in Subjects with Mild Liver Disease. Journal of Clinical Medicine. 2023; 12(12):3910. https://doi.org/10.3390/jcm12123910
Chicago/Turabian StyleAmendola-Pires, Marcia Maria, Max K. Fakoury, Hellen Salazar, Silvia B. De Oliveira, Carlos Eduardo Brandão-Mello, and Sergio L. Schmidt. 2023. "Hepatitis C Virus (HCV) Infection and Neurocognitive Impairment in Subjects with Mild Liver Disease" Journal of Clinical Medicine 12, no. 12: 3910. https://doi.org/10.3390/jcm12123910
APA StyleAmendola-Pires, M. M., Fakoury, M. K., Salazar, H., De Oliveira, S. B., Brandão-Mello, C. E., & Schmidt, S. L. (2023). Hepatitis C Virus (HCV) Infection and Neurocognitive Impairment in Subjects with Mild Liver Disease. Journal of Clinical Medicine, 12(12), 3910. https://doi.org/10.3390/jcm12123910