Article

Prognostic Significance of Chromogranin A Expression in the Initial and Second Biopsies in Metastatic Prostate Cancer

1
Department of Pathology, West China Hospital, Sichuan University, Chengdu 610041, China
2
Department of Pathology, The First Affiliated Hospital of Chengdu Medical College, Chengdu 610500, China
*
Authors to whom correspondence should be addressed.
These authors contributed equally to this work.
J. Clin. Med. 2023, 12(10), 3362; https://doi.org/10.3390/jcm12103362
Submission received: 31 January 2023 / Revised: 27 March 2023 / Accepted: 6 May 2023 / Published: 9 May 2023

Abstract

:
Neuroendocrine differentiation (NED) characterized by the expression of neuroendocrine markers, such as chromogranin A (CgA), is frequently observed in advanced prostate cancer (PCa), the prognostic significance of which is still controversial. Here we specifically addressed the issue of the potential prognostic value of CgA expression in advanced-stage PCa patients with distant metastases and its change over time from metastatic hormone-sensitive (mHSPC) to metastatic castration-resistant prostate cancer (mCRPC). CgA expression was assessed immunohistochemically in initial biopsies of mHSPC, as well as in second biopsies of mCRPC in sixty-eight patients, and its correlation with prognosis (together with conventional clinicopathologic parameters) was analyzed using the Kaplan–Meier method and Cox proportional hazard model. We found that CgA expression was an independent adverse prognostic factor for both mHSPC (CgA positivity ≥ 1%, HR = 2.16, 95% CI: 1.04–4.26, p = 0.031) and mCRPC (CgA ≥ 10%, HR = 20.19, 95% CI: 3.04–329.9, p = 0.008). CgA positivity generally increased from mHSPC to mCRPC and was a negative prognosticator. The assessment of CgA expression may help with the clinical evaluation of advanced-stage patients with distant metastases.

1. Introduction

Prostate cancer (PCa) is the second most common malignancy in males and the fifth leading cause of death globally [1]. Although PCa incidence is much lower in Asia, it has also been rising rapidly in East and West Asia [2]. Most prostate cancers are adenocarcinomas, initially being hormone-sensitive prostate cancer (HSPC) with the expression of androgen receptor (AR) and prostate-specific antigen (PSA). Typical first-line androgen deprivation therapy (ADT) usually results in the development of castration-resistant prostate cancer (CRPC) [3]. Although potent AR pathway inhibitors (ARPIs), such as enzalutamide, abiraterone acetate and apalutamide, have therapeutic effects on CRPC, these tumors almost inevitably develop AR-independent pathways to sustain tumor growth after the long-term usage of ARPIs [4,5]. Some CRPCs may develop into treatment-related neuroendocrine prostate cancer (t-NEPC), which is characterized by neuroendocrine carcinoma morphology, expression of neuroendocrine markers, loss of AR expression and independence of AR signaling [6,7]. The most recent WHO classification of prostate cancers considered t-NEPC of the prostate as a unique, independent type [6].
However, it was also observed that a considerable number of prostate adenocarcinomas demonstrated variable neuroendocrine marker expression (also known as neuroendocrine differentiation (NED)) and distant metastasis at the time of diagnosis. These patients are considered to have metastatic hormone-sensitive prostate cancer (mHSPC) with NED, which is responsive to androgen-deprivation therapy and may further develop metastatic castration-resistant prostate cancer (mCRPC). Although it has been generally accepted that NED is related to adverse outcomes [8,9,10], the prognosis of advanced prostate cancer with NED may be different from that of NEPC [7,11].
It is, therefore, worthwhile to further evaluate the prognostic effects of NED in advanced-stage prostate cancers, including mHSPCs and mCRPCs. Among the various neuroendocrine markers employed by different groups, chromogranin A (CgA) is the most specific one compared with synaptophysin (Syn), CD56 and neuron-specific enolase (NSE). In the present study, we specifically evaluated the prognostic significance of CgA expression in the initial biopsies obtained from 68 patients with mHSPCs upon diagnosis and the second prostate biopsies obtained when these patients entered the mCRPC stage.

2. Materials and Methods

2.1. Patients and Clinicopathological Data

Cases from West China Hospital between 2009 and 2017 were retrospectively collected and reviewed, and sixty-eight patients were selected according to the following inclusion and exclusion criteria. The inclusion criteria required that the patients (1) were diagnosed for the first time with metastatic acinar adenocarcinoma of the prostate via an initial biopsy; (2) received no previous diagnostic or therapeutic procedures for PCa; (3) received maximum androgen blockade treatment, including surgical or medical castration with ADT; (4) were diagnosed with mCRPC according to the guidelines for CRPC diagnosis from the European Association of Urology [12]; and (5) received a second prostate biopsy of mCRPC. Cases were excluded if (1) no remaining tumor existed in the second biopsy, (2) the patient received treatment before the first biopsy or (3) the second biopsy demonstrated t-NEPC features. Each patient served as his own control in this study. All data were collected according to the guidelines of the Ethics Committee of the authors’ institution.

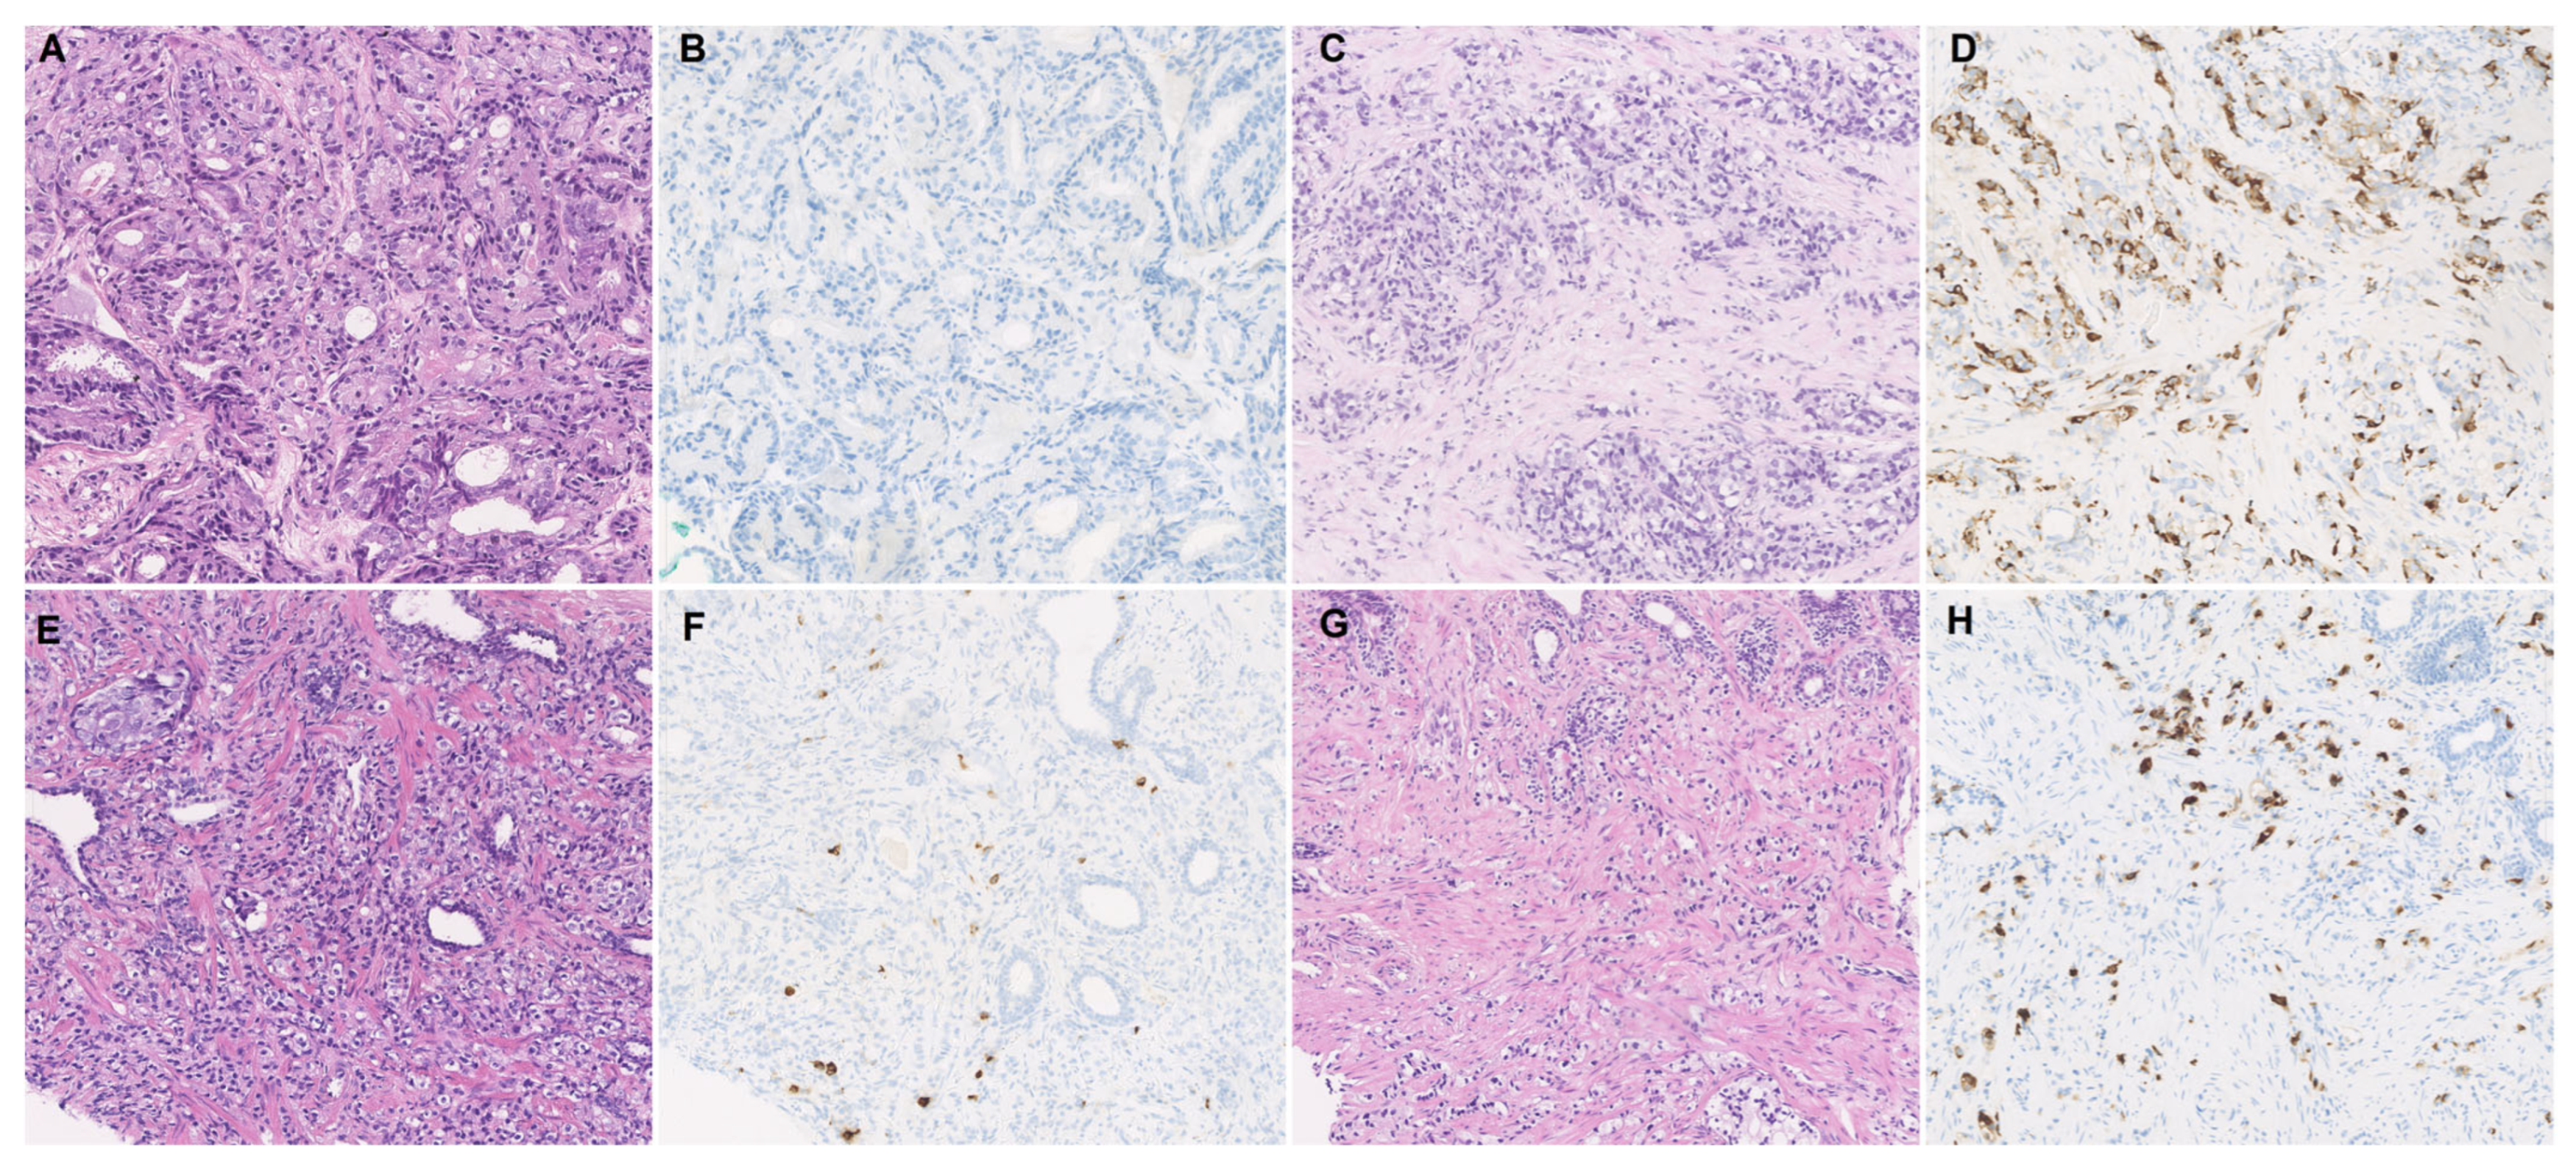
2.2. Biopsy and Histopathologic Review

Prostate biopsies were performed using a standard ultrasound-guided transperineal prostate biopsy technique. The initial and second biopsy sections were reviewed independently by two urological pathologists. Histological features, Gleason score (GS) and differences in CgA expression between initial and second biopsy specimens of each patient were assessed.

2.3. Immunohistochemistry

Standard immunohistochemical staining for CgA (ZSGB-Bio, Beijing, China, ZA0507, 1:200 dilution) was conducted with negative and positive controls. Unequivocal strong cytoplasmic staining was considered positive staining. The percentage of CgA expression was estimated based on the number of positively stained tumor cells compared with all tumor cells in each needle biopsy specimen, and the average of the percentages of CgA-positive cells in all specimens was the final CgA proportion of the case. Cases with CgA expression > 1% were recorded according to our preliminary analysis and published studies [13,14,15]. Two senior pathologists independently reviewed the slides.

2.4. Statistical Analyses

Data on the clinical and pathological variables were summarized using descriptive statistics. The percentages of CgA expression in different GS and ISUP/WHO 2016 grade groups were compared using one-way ANOVA. Overall survival (OS) was defined as the time from HSPC to death (OS1st) or that from mCRPC to death (OS2nd). OS1st and OS2nd were analyzed by using the Kaplan–Meier method with a log-rank test. A chi-square test was employed to detect the baseline differences between cases with and without CgA expression in the first and second biopsies to estimate the correlation between CgA expression and ISUP/WHO 2016 grading in mHSPC and to examine the difference between CgA expression in mHSPC and mCRPC. The Mann–Whitney U test was applied to assess the impact of CgA expression on CRPC-free survival. The Cox proportional hazard model was employed to investigate the prognostic significance of the clinicopathological variables, as shown by hazard ratios (HRs) with 95% confidence intervals (CIs). All statistical analyses were performed by using SPSS 22.0 (SPSS Inc., Chicago, IL, USA). A p-value < 0.05 (two-sided) was considered statistically significant.

3. Results

3.1. The Clinical Characteristics of the Patient Cohort

The ages of this patient cohort upon diagnosis ranged from 54 to 86, with a median age of 70. The patients were in an advanced stage of prostate cancer and had high Gleason scores and serum PSA levels. The majority of patients (47/68, 69.1%) were diagnosed with a Gleason score of 9 or 10 (WHO grade group 5), and 17 had a Gleason score of 8 (WHO grade group 4). Only four had a Gleason score of 7 (4 + 3; WHO grade group 3). In the second biopsy, 22 cases were not scored and grouped after treatment. The positivity of CgA was not found to correlate with the GS or International Society of Urological Pathology (ISUP)/WHO 2016 grade grouping (p = 0.400). In addition, the percentage of CgA expression was also not correlated with the GS or ISUP/WHO 2016 grade groups (p ≥ 0.05).
Ninety-seven percent (66/68) of patients presented with bone metastases; the remaining two patients had visceral metastases. Upon first diagnosis, the primary tumors in 25% (17/68) of patients exhibited CgA expression. Clinical and pathological features in the first biopsy and second biopsy are listed in Table 1. By the end point of follow-up, 40 patients (59%) were deceased. The longest follow-up duration was 142.5 months. The median OS1st was 36.9 months (ranging from 3.6 to 142.5 months). The median OS2nd was 23.5 months (ranging from 0.9 months to 63.9 months). There were no significant differences in median age, ISUP/WHO 2016 grade group, castration method, metastasis or serum PSA level between patients with and without CgA expression at the first or second biopsies.

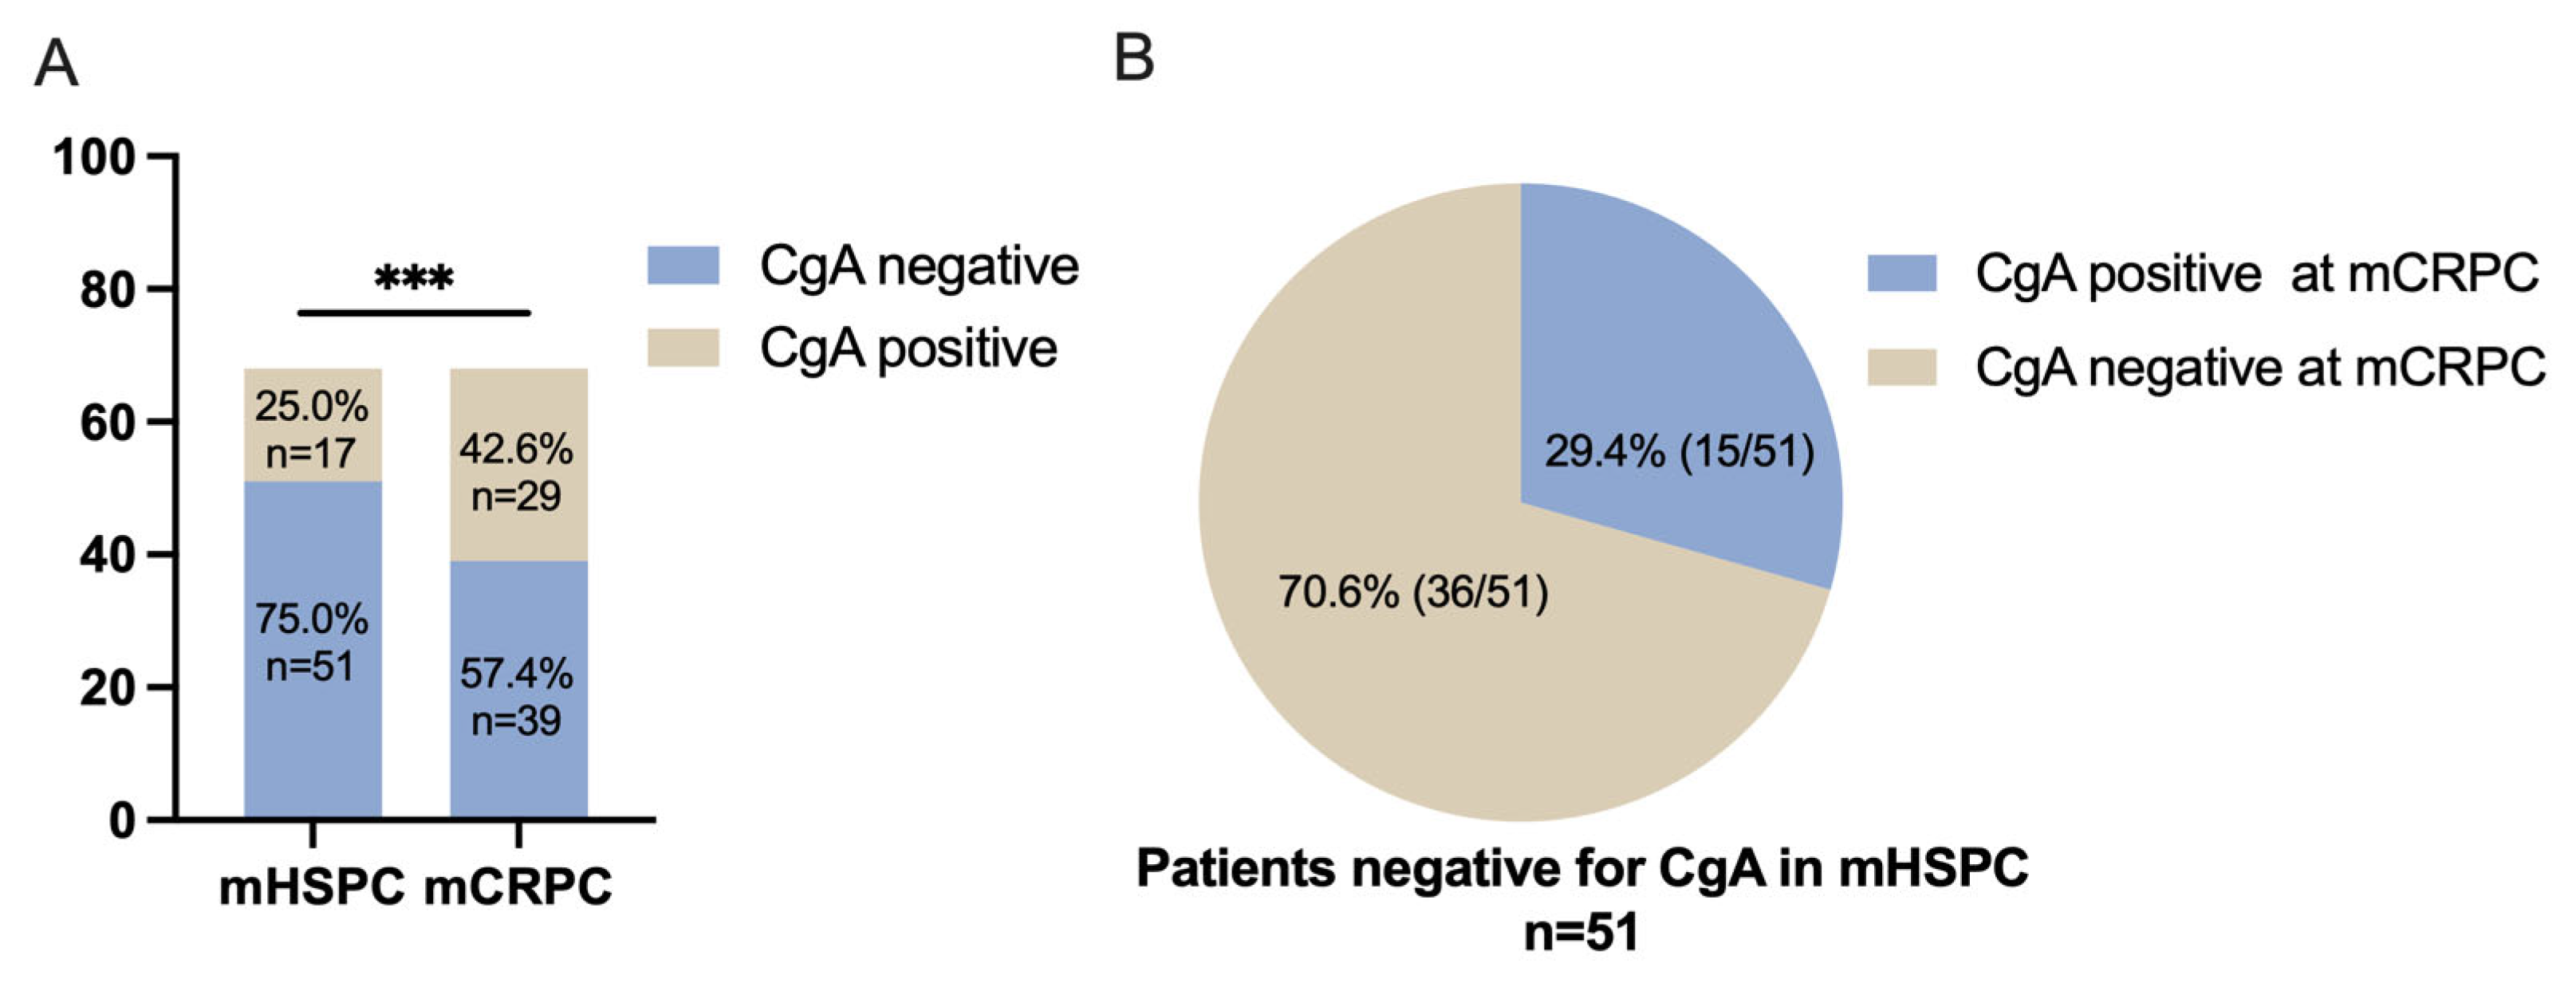
3.2. The Tendency of CgA Expression When Developing from mHSPC to mCRPC

As shown in Table 1 and Figure 1A, CgA expression was found in 25.0% (17/68) of the cases in the initial biopsy at the mHSPC stage. This increased to 42.6% (29/68) in the second biopsy taken at the mCRPC stage (p < 0.001). In the initial biopsy, 75% (51/68) of cases were negative for CgA. When these CgA-negative patients (n = 51) underwent a second biopsy for mCRPC, 29.4% (15/51) presented with CgA expression (Figure 1B). In those cases with CgA expression in the first biopsy, 30.4% (5/17) of the cases exhibited a prominently increased CgA expression (increased ≥5%) in mCRPC, three cases of which had increased by over 10%. The HE staining and immunostaining of CgA are displayed in Figure 2.
Cases negative for CgA in mHSPC often developed CgA-positive expression together with more Gleason 5 or 4 portions of mCRPC (Figure 2A–D). More than half of the cases with CgA expression exhibited an increased proportion of CgA in mCRPC (Figure 2E–H).

3.3. Analysis of the Relationship of Clinicopathological Variables with Survival

Univariate survival analyses using a log-rank test of the clinicopathological variables are summarized in Table 2. The Gleason score and CgA status at the mHSPC and mCRPC stages were significantly associated with both OS1st and OS2nd. The overall survival of patients in the ISUP/WHO 2016 grade groups 3, 4 and 5 showed a descending trend; however, this was without statistical significance.
We also examined the effects of CgA expression on CRPC-free survival. CgA expression at the first biopsy correlated with shortened CRPC-free survival (CFS), with a median CFS of 15.93 months in patients negative for CgA vs. 6.17 months in patients positive for CgA (p = 0.002, Supplementary Figure S1).
Kaplan–Meier survival analyses are shown in Figure 3. The results indicated that CgA expression at initial diagnosis was associated with a shorter OS1st (21.7 ± 6.1 months vs. 58.7 ± 7.4 months, p = 0.017, Figure 3A). CgA expression at the second biopsy was also associated with the median OS1st of this patient cohort (with CgA expression vs. without CgA expression: 33.7 ± 6.1 vs. 58.7 ± 8.8 months, p = 0.039, Figure 3B). Cases with newly developed CgA expression of mCRPC (n = 15/51) also had a shorter OS1st (33.7 ± 2.4 vs. 58.8 ± 13.9 months, p = 0.048, Figure 3C).

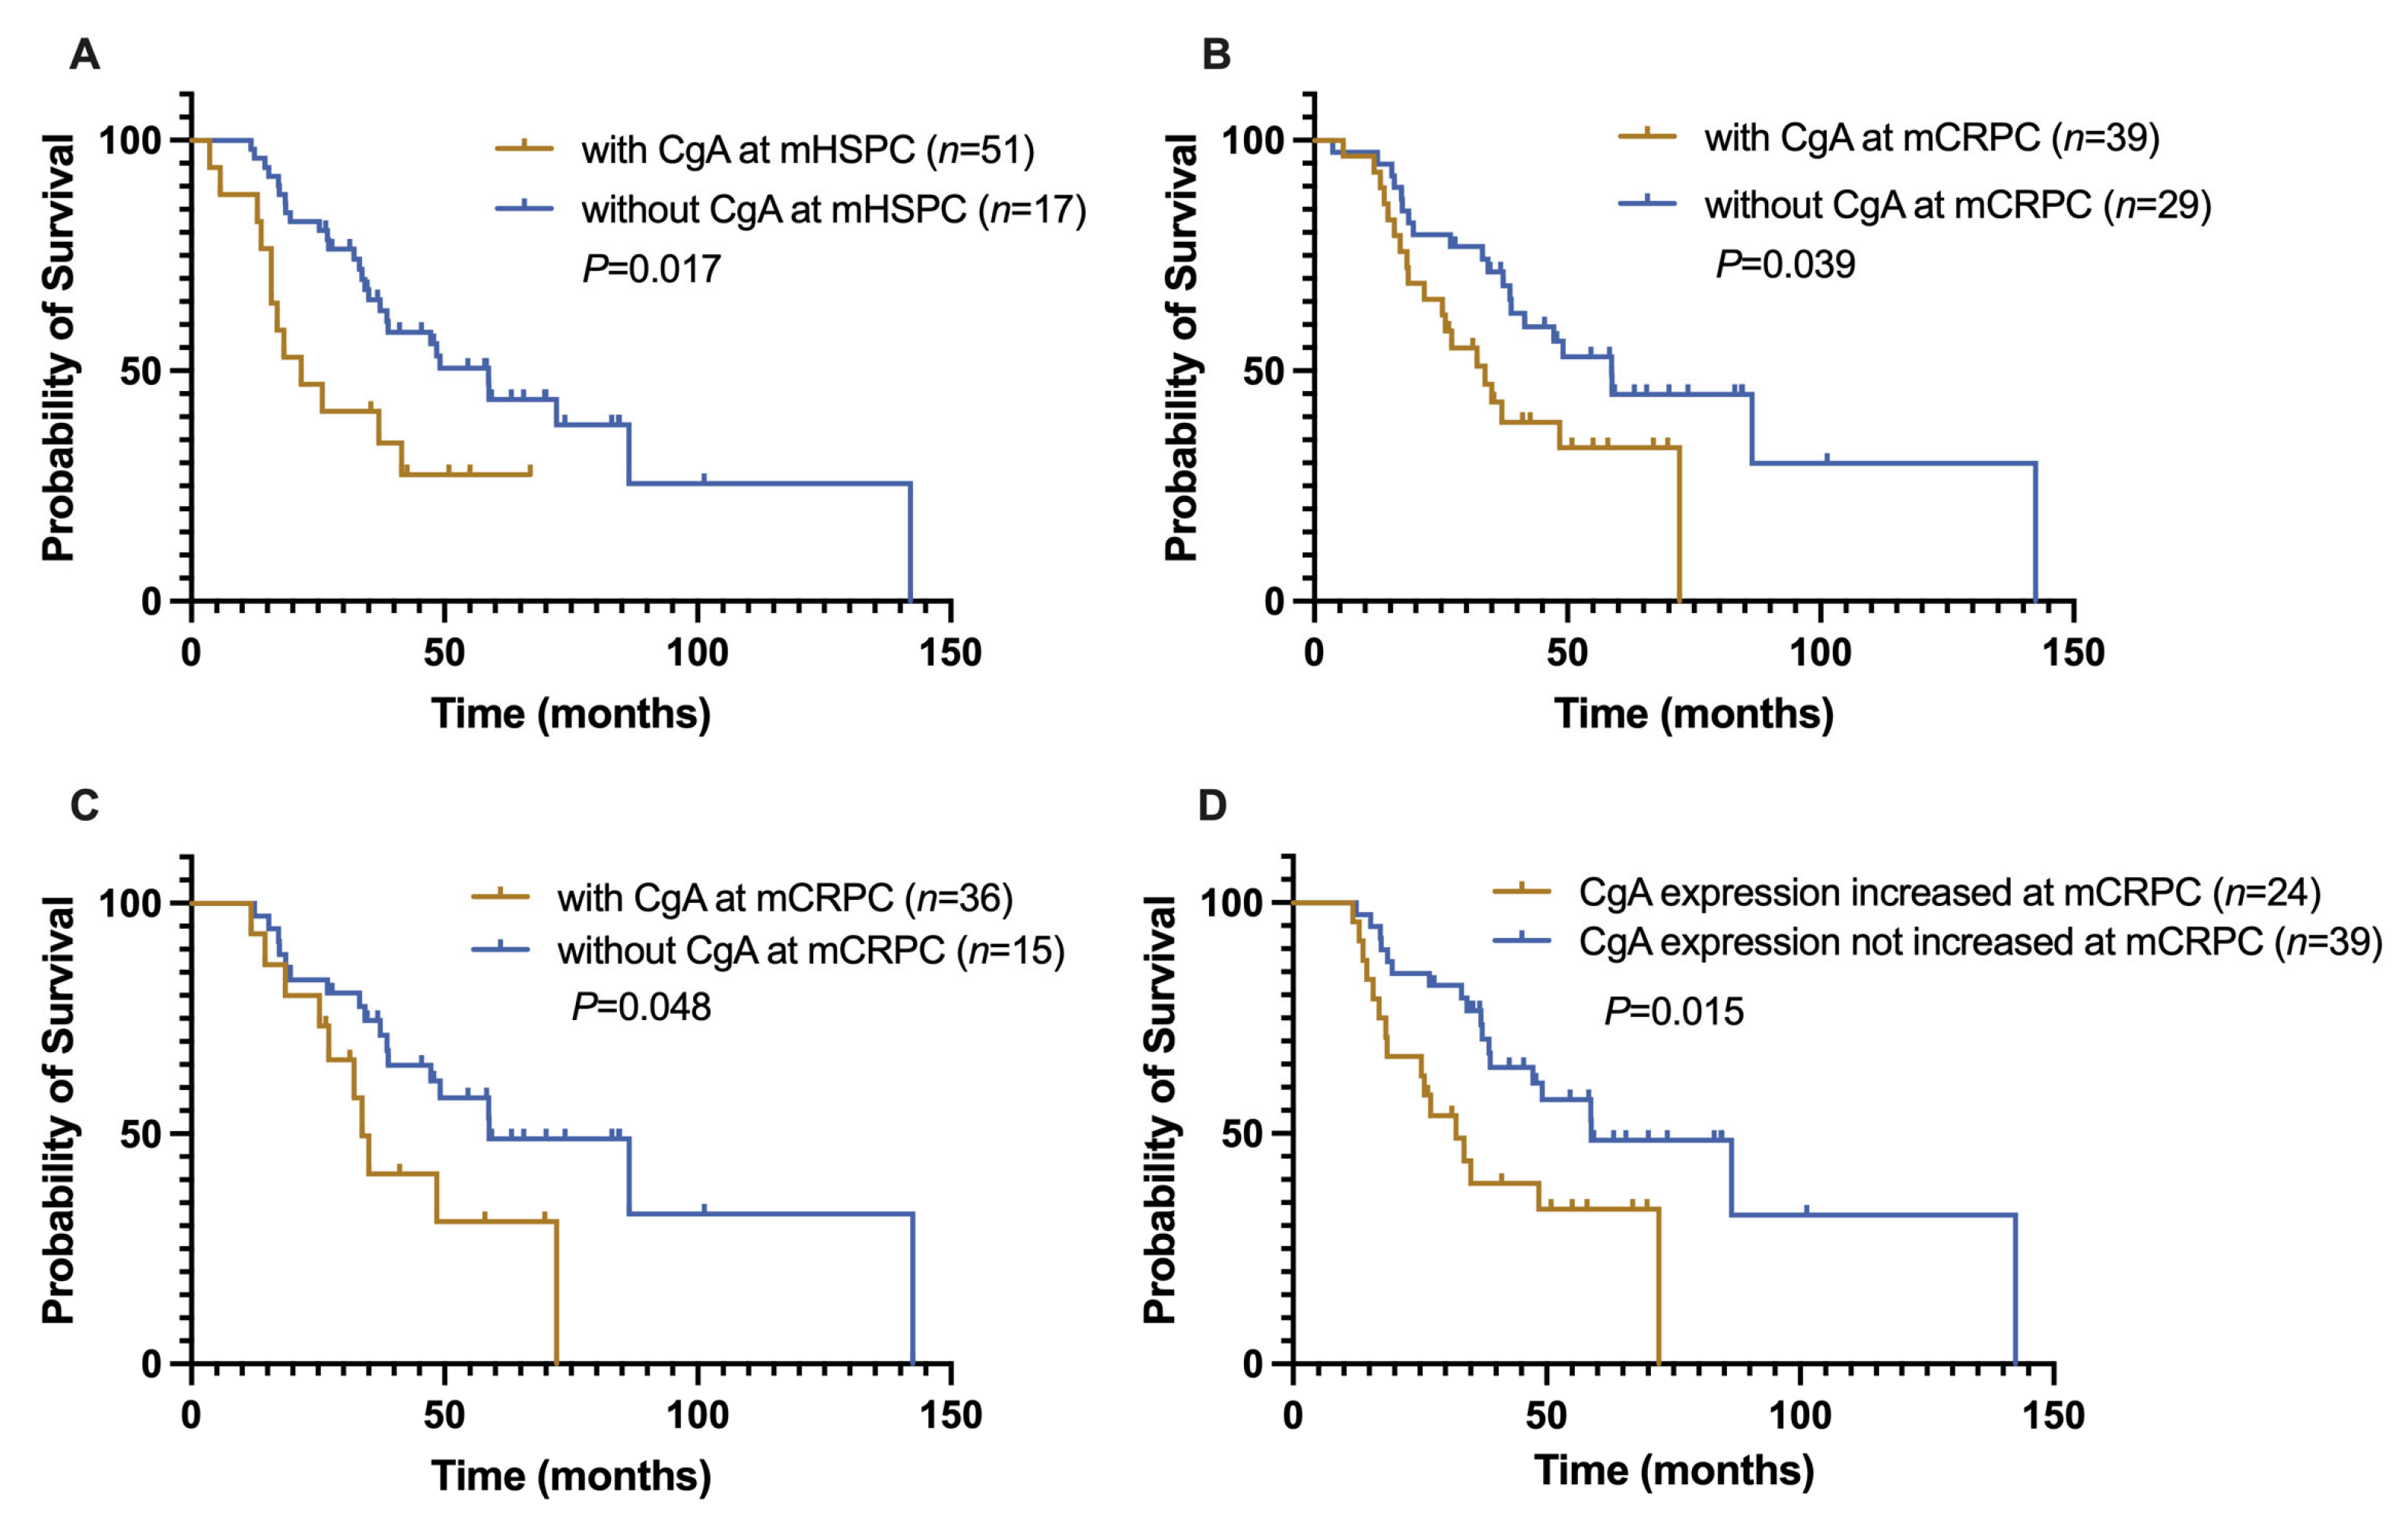
3.4. Prognostic Significance of the Change in CgA Expression Status of Advanced PCa

We further compared the OS1st of patients (n = 24) with increased CgA expression relative to the initial biopsy (n = 9) (defined as at least a 1% increase) or with newly developed CgA expression (n = 15) of mCRPC to that of patients whose CgA expression status had not changed (n = 39). The OS1st of the former was markedly reduced (32.1 ± 5.7 vs. 58.8 ± 13.8 months, p = 0.015, Figure 3D).

3.5. Hazard Ratio Assessment of Risk Factors of Advanced PCa

Univariate Cox regression analyses also identified the status of CgA of mHSPC and mCRPC and the Gleason score of mHSPC as significant risk factors for OS (Table 3). The multivariate analysis used a Cox proportional risk model that incorporated patient age, Gleason score and CgA expression status (Table 4). The analysis showed that CgA positivity or higher CgA expression of mHSPC or mCRPC was significantly associated with a shortened OS1st or OS2nd. The hazard ratio (HR) of CgA expression in the first biopsy for OS1st was 2.16 (95% CI: 1.04–4.26, p = 0.031). In the mCRPC stage, the HRs of CgA expression ≥ 10% for OS1st and OS2nd were 20.19 (95% CI: 3.04–329.99, p = 0.008) and 5.17 (95% CI: 1.10–33.1, p = 0.048), respectively. In addition, the GS was also significantly associated with OS2nd in patients with mHSPC (HR = 2.19, 95% CI: 1.09–4.82, p = 0.037) and OS1st in patients with mCRPC (HR = 7.37, 95% CI: 1.84–54.79, p = 0.020) (Table 4).

4. Discussion

The expression of CgA or other neuroendocrine markers is often observed in prostate adenocarcinomas, particularly after exposure to ADTs. Treatment-related NEPC (t-NEPC) has been adopted as an independent entity characterized by small-cell or large-cell neuroendocrine carcinoma morphology in the most recent WHO classification of prostate cancers [16]. However, the biological features of PCa with the expression of neuroendocrine markers, such as CgA, but not with neuroendocrine carcinoma morphology or t-NEPC features, still needs to be characterized.
The present study of a cohort of 68 typical acinar PCa patients aimed to evaluate the prognostic value of CgA expression and other factors assessed at initial and second biopsies at mHSPC and mCRPC, respectively. Our data indicated that CgA expression (≥1%) was an independent risk factor for shortened OS of those with mHSPC, and the percentage of CgA-positive cells ≥ 10% in biopsy correlated with reduced OS for those with mCRPC. Our results also showed that the percentage of CgA positivity increased as mHSPC progressed to mCRPC, and was also a negative prognosticator.
Among various neuroendocrine markers, CgA showed the highest specificity [17,18]. Studies of CgA expression and its significance in PCa biopsy specimens are limited. Although some investigators did not observe a significant association of CgA expression with OS or disease progression in surgically treated patients with clinically localized PCa [19], other studies showed that the percentage of CgA-positive cells exceeding 1%, 5% or 10% in biopsy specimens of locally advanced PCa was a risk factor for distant metastases, PSA progression-free survival and recurrence [15,20,21]. In a recent study of 35 patients treated with radiotherapy (with or without ADT), an apparently poorer OS and cause-specific survival were observed in cases with focal CgA positivity (>1%), although with marginal statistical significance [13]. The present study specifically addressed the issue of the potential prognostic value of CgA expression in advanced-stage PCa patients with distant metastases and its change over time from mHSPC to mCRPC in a much larger cohort (n = 68), and the results suggested the prognostic value of CgA expression for both mHSPC and mCRPC.
Numerous studies also assessed the prognostic value of serum CgA expression in prostate patients, with controversial results [22,23,24,25]. Elevated serum CgA was reported to be an independent prognostic factor for OS and progression-free survival in CRPC patients treated with abiraterone acetate [26] and was related to advanced tumor stage and higher GS [27]. An elevated serum CgA level over three times the upper normal limit in mCRPC patients was a prognostic factor in patients treated with enzalutamide [28]. Although it is more convenient to assess the serum level of CgA, the circulating CgA level can be affected by many factors, such as renal failure, cardiovascular diseases and the use of proton pump inhibitors [29].
Neuroendocrine differentiation in PCa may arise via lineage plasticity, with clonal evolution from either primary PCa or CRPC cells [30]. Single-cell transcriptome sequencing also demonstrated the existence of ARHIGH/NEHIGH prostate cancer cells in hormone-naïve prostate cancer cohorts [31]. The precise definition of this clinical state is still lacking, but the expression of NE markers usually confers more aggressive clinical behavior [7,32], which typically bears alterations in RB1, TP53, PTEN and AR [33]. PCa with histologic features of adenocarcinoma and the above molecular traits may represent a transition state from typical PCa to PCa with NED [34,35].
In a large single mCRPC dataset, RB1 is the factor that was most strongly associated with poor clinical outcomes [34]. Chromatin binding and transcriptional activity of the RB-repressed E2F1 are highly dependent on lysine-specific demethylase 1A (LSD1) in RB1-deficient CRPC, and RB1 inactivation enables CRPC tumors to be sensitive to LSD1 inhibitor [36].
Dual loss of TP53 and RB1 was reported to promote lineage plasticity and was correlated with worse clinical outcomes in patients with metastatic PCa [34]. In RB1/TP53-silenced LNCAPPTEN−/− cells, epigenetic reprogramming factors, such as EZH2 and SOX2, were repressed, which may provide stem-like status for lineage plasticity [37]. LNCAPTP53−/−; RB1−/− cells exhibited exuberant proliferation, loss of G1/S checkpoint, replication stress, repressed AR signaling and stem-like features without NE activity [38]. RB1 and TP53 dual-knockout (DKO) cell lines also showed a reduced enzalutamide response duration.
PTEN plays a key role in prostate tumorigenesis. PTEN loss was correlated with higher GSs, poorer prognosis and increased metastasis potentials [39]. PTEN deletion induces prostatic intraepithelial neoplasia in mice.
Genome-wide DNA methylation analysis of CRPC and CRPC-NED also revealed significant epigenetic dysregulations that may contribute to NED [30]. Promoter methylation of SAM pointed domain containing ETS transcription factor (SPDEF), which encodes prostate-derived ETS factor (PDEF) and functions as a transcription activator and cell differentiation regulator, was observed in neuroendocrine cancer cell line NCI-H660 [40].
In RB1/TP53-silenced LNCAPPTEN−/− cells, epigenetic reprogramming factors, such as enhancer of zeste 2 polycomb repressive complex 2 subunit (EZH2) and SRY-Box transcription factor 2 (SOX2), are repressed. The suppression of these factors might help provide a stem-like environment for lineage plasticity in the context of genomic alterations involving the loss of RB1, TP53 and PTEN functions [37]. The histone methyltransferase EZH2 is prominently overexpressed in CRPC-NED [30], and the EZH2-repressed target genes are simultaneously downregulated, including WNT signaling and homeobox factor-encoding genes. The roles of EZH2 in prostate cancer with neuroendocrine features were investigated in several studies. In mouse model CRPC with neuroendocrine differentiation, overexpressed N-Myc interacts with the SET domain of EZH2 and SUZ12 subunit of PRC2. EZH2 together with N-Myc interacts with AR to form the N-Myc/AR/EZH2-PRC2 complex, inducing NED and the abrogation of AR signaling [41].
In enzalutamide-induced neuroendocrine differentiation, EZH2 interacts with lncRNA-p21 instead of HOTAIR due to competitive binding. LncRNA-p21 promotes the interaction of EZH2 and Serine/Threonine Kinase 1 (AKT), which phosphorylates EZH2 S21 and activates signal transducer and activator of transcription 3 (STAT3) [42,43]. In addition, EZH2 reverses the inactivation of Forkhead Box O1 (FOXO1) and promotes NED via repressing miR-708 [44]. EZH2 epigenetically represses Thrombospondin 1 (TSP1) to relieve the inhibition of angiogenesis [45]. In vitro and animal studies have indicated that EZH2 inhibitors, such as GSK343, could be a promising therapy for prostate cancer with neuroendocrine differentiation [30,37,41].

5. Conclusions

In summary, our data showed that CgA expression at either the mHSPC or mCRPC stages was correlated with prognosis, and its assessment may help with the clinical evaluation of patients with metastatic PCa.

Supplementary Materials

The following supporting information can be downloaded from https://www.mdpi.com/article/10.3390/jcm12103362/s1, Figure S1: The CRPC-free survival in CgA-positive and CgA-negative patients in the first biopsy.

Author Contributions

Z.H.: experimentation, data analysis and writing of the original draft; Y.T.: experimentation and data analysis; Y.W.: data analysis and visualization; J.Q.: data analysis and visualization; Y.K.: data analysis and visualization; D.W.: data analysis and visualization; M.X.: clinical diagnosis, pathologic review and data analysis; L.N.: clinical diagnosis, pathologic review and data analysis; X.C.: clinical diagnosis, pathologic review and data analysis; N.C.: conceptualization, methodology and writing of the manuscript; Q.Z.: supervision, data analysis and writing of the manuscript. All authors have read and agreed to the published version of the manuscript.

Funding

This study was supported by grants from the National Natural Science Foundation of China (NSFC 82273073, 82273047, 82002721, 81872108, 81872107) and the Sichuan Province Science and Technology Support Program (2020YJ0008, 2021YFS0114).

Institutional Review Board Statement

The study was conducted in accordance with the Declaration of Helsinki and approved by the Ethics Committee of West China Hospital of Sichuan University (protocol code: 1703, 31 December 2021).

Informed Consent Statement

Informed consent was obtained from all subjects involved in the study.

Data Availability Statement

Data of the study are available from the corresponding authors upon reasonable request.

Acknowledgments

We thank all the patients and their families for their support and understanding of this study and the pathologists and urologists of West China Hospital for providing clinicopathological data of the patients.

Conflicts of Interest

The authors declare no conflict of interest.

References

  1. Sung, H.; Ferlay, J.; Siegel, R.L.; Laversanne, M.; Soerjomataram, I.; Jemal, A.; Bray, F. Global Cancer Statistics 2020: Globocan Estimates of Incidence and Mortality Worldwide for 36 Cancers in 185 Countries. CA Cancer J. Clin. 2021, 71, 209–249. [Google Scholar] [CrossRef]
  2. Zhu, Y.; Mo, M.; Wei, Y.; Wu, J.; Pan, J.; Freedland, S.J.; Zheng, Y.; Ye, D. Epidemiology and Genomics of Prostate Cancer in Asian Men. Nat. Rev. Urol. 2021, 18, 282–301. [Google Scholar] [CrossRef] [PubMed]
  3. Watson, P.A.; Arora, V.K.; Sawyers, C.L. Emerging Mechanisms of Resistance to Androgen Receptor Inhibitors in Prostate Cancer. Nat. Rev. Cancer 2015, 15, 701–711. [Google Scholar] [CrossRef] [PubMed]
  4. Seo, E.; Jee, B.; Chung, J.H.; Song, W.; Sung, H.H.; Jeon, H.G.; Jeong, B.C.; Seo, S.I.; Jeon, S.S.; Lee, H.M.; et al. Repression of Slc22a3 by the Ar-V7/Yap1/Taz Axis in Enzalutamide-Resistant Castration-Resistant Prostate Cancer. FEBS J. 2022, 290, 1645–1662. [Google Scholar] [CrossRef] [PubMed]
  5. Bluemn, E.G.; Coleman, I.M.; Lucas, J.M.; Coleman, R.T.; Hernandez-Lopez, S.; Tharakan, R.; Bianchi-Frias, D.; Dumpit, R.F.; Kaipainen, A.; Corella, A.N.; et al. Androgen Receptor Pathway-Independent Prostate Cancer Is Sustained through Fgf Signaling. Cancer Cell 2017, 32, 474–489.e6. [Google Scholar] [CrossRef]
  6. Mohanty, S.K.; Lobo, A.; Cheng, L. The 2022 Revision of the World Health Organization Classification of Tumors of the Urinary System and Male Genital Organs: Advances and Challenges. Hum. Pathol. 2022, 82, 469–482. [Google Scholar] [CrossRef]
  7. Wang, H.T.; Yao, Y.H.; Li, B.G.; Tang, Y.; Chang, J.W.; Zhang, J. Neuroendocrine Prostate Cancer (Nepc) Progressing from Conventional Prostatic Adenocarcinoma: Factors Associated with Time to Development of Nepc and Survival from Nepc Diagnosis-a Systematic Review and Pooled Analysis. J. Clin. Oncol. 2014, 32, 3383–3390. [Google Scholar] [CrossRef]
  8. Mitsui, Y.; Arichi, N.; Hiraki, M.; Harada, Y.; Yasumoto, H.; Shiina, H. Tissue Chromogranin a Expression during Prostate Cancer Progression: Prediction of Chemosensitivity. Urol. J. 2015, 12, 2165–2172. [Google Scholar]
  9. Heck, M.M.; Thaler, M.A.; Schmid, S.C.; Seitz, A.K.; Tauber, R.; Kubler, H.; Maurer, T.; Thalgott, M.; Hatzichristodoulou, G.; Hoppner, M.; et al. Chromogranin a and Neurone-Specific Enolase Serum Levels as Predictors of Treatment Outcome in Patients with Metastatic Castration-Resistant Prostate Cancer Undergoing Abiraterone Therapy. BJU Int. 2017, 119, 30–37. [Google Scholar] [CrossRef]
  10. Sainio, M.; Visakorpi, T.; Tolonen, T.; Ilvesaro, J.; Bova, G.S. Expression of Neuroendocrine Differentiation Markers in Lethal Metastatic Castration-Resistant Prostate Cancer. Pathol. Res. Pract. 2018, 214, 848–856. [Google Scholar] [CrossRef]
  11. Conteduca, V.; Oromendia, C.; Eng, K.W.; Bareja, R.; Sigouros, M.; Molina, A.; Faltas, B.M.; Sboner, A.; Mosquera, J.M.; Elemento, O.; et al. Clinical Features of Neuroendocrine Prostate Cancer. Eur. J. Cancer 2019, 121, 7–18. [Google Scholar] [CrossRef] [PubMed]
  12. Cornford, P.; Bellmunt, J.; Bolla, M.; Briers, E.; De Santis, M.; Gross, T.; Henry, A.M.; Joniau, S.; Lam, T.B.; Mason, M.D.; et al. Eau-Estro-Siog Guidelines on Prostate Cancer. Part Ii: Treatment of Relapsing, Metastatic, and Castration-Resistant Prostate Cancer. Eur. Urol. 2017, 71, 630–642. [Google Scholar] [CrossRef]
  13. Mankuzhy, N.P.; Almahariq, M.F.; Ye, H.; Amin, M.; Stone, B.; Krauss, D.J. Investigation of the Prognostic Significance of Neuroendocrine Differentiation in Gleason Score 7 to 10 Prostate Adenocarcinoma in Patients with Distant Metastasis after Definitive Radiotherapy. Am. J. Clin. Pathol 2021, 155, 879–886. [Google Scholar] [CrossRef] [PubMed]
  14. De Nunzio, C.; Albisinni, S.; Presicce, F.; Lombardo, R.; Cancrini, F.; Tubaro, A. Serum Levels of Chromogranin a Are Not Predictive of High-Grade, Poorly Differentiated Prostate Cancer: Results from an Italian Biopsy Cohort. Urol. Oncol. 2014, 32, 80–84. [Google Scholar] [CrossRef] [PubMed]
  15. Berruti, A.; Bollito, E.; Cracco, C.M.; Volante, M.; Ciccone, G.; Porpiglia, F.; Papotti, M.; Scarpa, R.M.; Dogliotti, L. The Prognostic Role of Immunohistochemical Chromogranin a Expression in Prostate Cancer Patients Is Significantly Modified by Androgen-Deprivation Therapy. Prostate 2010, 70, 718–726. [Google Scholar] [CrossRef]
  16. WHO Classification of Tumours Editorial Board. Urinary and Male Genital Tumours, 5th ed.; IARC: Lyon, France, 2022.
  17. Parimi, V.; Goyal, R.; Poropatich, K.; Yang, X.J. Neuroendocrine Differentiation of Prostate Cancer: A Review. Am. J. Clin. Exp. Urol. 2014, 2, 273–285. [Google Scholar]
  18. Wang, W.; Epstein, J.I. Small Cell Carcinoma of the Prostate. A Morphologic and Immunohistochemical Study of 95 Cases. Am. J. Surg. Pathol. 2008, 32, 65–71. [Google Scholar] [CrossRef] [PubMed]
  19. Cindolo, L.; Cantile, M.; Franco, R.; Chiodini, P.; Schiavo, G.; Forte, I.; Zlobec, I.; Salzano, L.; Botti, G.; Gidaro, S.; et al. Parallel Determination of Neurod1, Chromogranin-a, Ki67 and Androgen Receptor Expression in Surgically Treated Prostate Cancers. Int. Braz. J. Urol. 2011, 37, 57–66. [Google Scholar] [CrossRef] [PubMed]
  20. Krauss, D.J.; Amin, M.; Stone, B.; Ye, H.; Hayek, S.; Cotant, M.; Hafron, J.; Brabbins, D.S. Chromogranin a Staining as a Prognostic Variable in Newly Diagnosed Gleason Score 7-10 Prostate Cancer Treated with Definitive Radiotherapy. Prostate 2014, 74, 520–527. [Google Scholar] [CrossRef]
  21. Kokubo, H.; Yamada, Y.; Nishio, Y.; Fukatsu, H.; Honda, N.; Nakagawa, A.; Saga, S.; Tsuzuki, T.; Hara, K. Immunohistochemical Study of Chromogranin a in Stage D2 Prostate Cancer. Urology 2005, 66, 135–140. [Google Scholar] [CrossRef]
  22. Liu, Y.; Zhao, S.; Wang, J.; Zhu, Z.; Luo, L.; Li, E.; Tang, F.; Zhao, Z. Serum Neuroendocrine Markers Predict Therapy Outcome of Patients with Metastatic Castration-Resistant Prostate Cancer: A Meta-Analysis. Urol. Int. 2019, 102, 373–384. [Google Scholar] [CrossRef] [PubMed]
  23. Giridhar, K.V.; Sanhueza, C.; Hillman, D.W.; Alkhateeb, H.; Carlson, R.; Tan, W.; Costello, B.A.; Quevedo, F.; Pagliaro, L.; Kohli, M. Serum Chromogranin-a-Based Prognosis in Metastatic Castration-Resistant Prostate Cancer. Prostate Cancer Prostatic Dis. 2018, 21, 431–437. [Google Scholar] [CrossRef]
  24. Niedworok, C.; Tschirdewahn, S.; Reis, H.; Lehmann, N.; Szucs, M.; Nyirady, P.; Romics, I.; Rubben, H.; Szarvas, T. Serum Chromogranin a as a Complementary Marker for the Prediction of Prostate Cancer-Specific Survival. Pathol. Oncol. Res. 2017, 23, 643–650. [Google Scholar] [CrossRef] [PubMed]
  25. Khan, M.O.; Ather, M.H. Chromogranin A—Serum Marker for Prostate Cancer. J. Pak. Med. Assoc. 2011, 61, 108–111. [Google Scholar]
  26. Fan, L.; Wang, Y.; Chi, C.; Pan, J.; Xun, S.; Xin, Z.; Hu, J.; Zhou, L.; Dong, B.; Xue, W. Chromogranin a and Neurone-Specific Enolase Variations During the First 3 Months of Abiraterone Therapy Predict Outcomes in Patients with Metastatic Castration-Resistant Prostate Cancer. BJU Int. 2017, 120, 226–232. [Google Scholar] [CrossRef]
  27. Grimaldi, F.; Valotto, C.; Barbina, G.; Visentini, D.; Trianni, A.; Cerruto, M.A.; Zattoni, F. The Possible Role of Chromogranin a as a Prognostic Factor in Organ-Confined Prostate Cancer. Int. J. Biol. Markers 2006, 21, 229–234. [Google Scholar] [CrossRef]
  28. Conteduca, V.; Burgio, S.L.; Menna, C.; Carretta, E.; Rossi, L.; Bianchi, E.; Masini, C.; Amadori, D.; De Giorgi, U. Chromogranin a Is a Potential Prognostic Marker in Prostate Cancer Patients Treated with Enzalutamide. Prostate 2014, 74, 1691–1696. [Google Scholar] [CrossRef] [PubMed]
  29. Bech, P.R.; Martin, N.M.; Ramachandran, R.; Bloom, S.R. The Biochemical Utility of Chromogranin a, Chromogranin B and Cocaine- and Amphetamine-Regulated Transcript for Neuroendocrine Neoplasia. Ann. Clin. Biochem. 2014, 51 Pt 1, 8–21. [Google Scholar] [CrossRef]
  30. Beltran, H.; Prandi, D.; Mosquera, J.M.; Benelli, M.; Puca, L.; Cyrta, J.; Marotz, C.; Giannopoulou, E.; Chakravarthi, B.V.; Varambally, S.; et al. Divergent Clonal Evolution of Castration-Resistant Neuroendocrine Prostate Cancer. Nat. Med. 2016, 22, 298–305. [Google Scholar] [CrossRef]
  31. Su, R.; Chen, L.; Jiang, Z.; Yu, M.; Zhang, W.; Ma, Z.; Ji, Y.; Shen, K.; Xin, Z.; Qi, J.; et al. Comprehensive Analysis of Androgen Receptor Status in Prostate Cancer with Neuroendocrine Differentiation. Front. Oncol. 2022, 12, 955166. [Google Scholar] [CrossRef]
  32. Aggarwal, R.; Huang, J.; Alumkal, J.J.; Zhang, L.; Feng, F.Y.; Thomas, G.V.; Weinstein, A.S.; Friedl, V.; Zhang, C.; Witte, O.N.; et al. Clinical and Genomic Characterization of Treatment-Emergent Small-Cell Neuroendocrine Prostate Cancer: A Multi-Institutional Prospective Study. J. Clin. Oncol. 2018, 36, 2492–2503. [Google Scholar] [CrossRef] [PubMed]
  33. Epstein, J.I.; Amin, M.B.; Beltran, H.; Lotan, T.L.; Mosquera, J.M.; Reuter, V.E.; Robinson, B.D.; Troncoso, P.; Rubin, M.A. Proposed Morphologic Classification of Prostate Cancer with Neuroendocrine Differentiation. Am. J. Surg. Pathol. 2014, 38, 756–767. [Google Scholar] [CrossRef]
  34. Abida, W.; Cyrta, J.; Heller, G.; Prandi, D.; Armenia, J.; Coleman, I.; Cieslik, M.; Benelli, M.; Robinson, D.; Van Allen, E.M.; et al. Genomic Correlates of Clinical Outcome in Advanced Prostate Cancer. Proc. Natl. Acad. Sci. USA 2019, 116, 11428–11436. [Google Scholar] [CrossRef]
  35. Nava Rodrigues, D.; Casiraghi, N.; Romanel, A.; Crespo, M.; Miranda, S.; Rescigno, P.; Figueiredo, I.; Riisnaes, R.; Carreira, S.; Sumanasuriya, S.; et al. Rb1 Heterogeneity in Advanced Metastatic Castration-Resistant Prostate Cancer. Clin. Cancer Res. 2019, 25, 687–697. [Google Scholar] [CrossRef] [PubMed]
  36. Han, W.; Liu, M.; Han, D.; Li, M.; Toure, A.A.; Wang, Z.; Besschetnova, A.; Patalano, S.; Macoska, J.A.; Gao, S.; et al. Rb1 Loss in Castration-Resistant Prostate Cancer Confers Vulnerability to Lsd1 Inhibition. Oncogene 2022, 41, 852–864. [Google Scholar] [CrossRef]
  37. Ku, S.Y.; Rosario, S.; Wang, Y.; Mu, P.; Seshadri, M.; Goodrich, Z.W.; Goodrich, M.M.; Labbe, D.P.; Gomez, E.C.; Wang, J.; et al. Rb1 and Trp53 Cooperate to Suppress Prostate Cancer Lineage Plasticity, Metastasis, and Antiandrogen Resistance. Science 2017, 355, 78–83. [Google Scholar] [CrossRef] [PubMed]
  38. Nyquist, M.D.; Corella, A.; Coleman, I.; De Sarkar, N.; Kaipainen, A.; Ha, G.; Gulati, R.; Ang, L.; Chatterjee, P.; Lucas, J.; et al. Combined Tp53 and Rb1 Loss Promotes Prostate Cancer Resistance to a Spectrum of Therapeutics and Confers Vulnerability to Replication Stress. Cell Rep. 2020, 31, 107669. [Google Scholar] [CrossRef]
  39. Wang, G.; Zhao, D.; Spring, D.J.; DePinho, R.A. Genetics and Biology of Prostate Cancer. Genes Dev. 2018, 32, 1105–1140. [Google Scholar] [CrossRef]
  40. Steffan, J.J.; Koul, S.; Meacham, R.B.; Koul, H.K. The Transcription Factor Spdef Suppresses Prostate Tumor Metastasis. J. Biol. Chem. 2012, 287, 29968–29978. [Google Scholar] [CrossRef]
  41. Dardenne, E.; Beltran, H.; Benelli, M.; Gayvert, K.; Berger, A.; Puca, L.; Cyrta, J.; Sboner, A.; Noorzad, Z.; MacDonald, T.; et al. N-Myc Induces an Ezh2-Mediated Transcriptional Program Driving Neuroendocrine Prostate Cancer. Cancer Cell 2016, 30, 563–577. [Google Scholar] [CrossRef]
  42. Kim, E.; Kim, M.; Woo, D.H.; Shin, Y.; Shin, J.; Chang, N.; Oh, Y.T.; Kim, H.; Rheey, J.; Nakano, I.; et al. Phosphorylation of Ezh2 Activates Stat3 Signaling Via Stat3 Methylation and Promotes Tumorigenicity of Glioblastoma Stem-Like Cells. Cancer Cell 2013, 23, 839–852. [Google Scholar] [CrossRef] [PubMed]
  43. Luo, J.; Wang, K.; Yeh, S.; Sun, Y.; Liang, L.; Xiao, Y.; Xu, W.; Niu, Y.; Cheng, L.; Maity, S.N.; et al. Lncrna-P21 Alters the Antiandrogen Enzalutamide-Induced Prostate Cancer Neuroendocrine Differentiation Via Modulating the Ezh2/Stat3 Signaling. Nat. Commun. 2019, 10, 2571. [Google Scholar] [CrossRef]
  44. Shan, J.; Al-Muftah, M.A.; Al-Kowari, M.K.; Abuaqel, S.W.J.; Al-Rumaihi, K.; Al-Bozom, I.; Li, P.; Chouchane, L. Targeting Wnt/Ezh2/Microrna-708 Signaling Pathway Inhibits Neuroendocrine Differentiation in Prostate Cancer. Cell Death Discov. 2019, 5, 139. [Google Scholar] [CrossRef] [PubMed]
  45. Zhang, Y.; Zheng, D.; Zhou, T.; Song, H.; Hulsurkar, M.; Su, N.; Liu, Y.; Wang, Z.; Shao, L.; Ittmann, M.; et al. Androgen Deprivation Promotes Neuroendocrine Differentiation and Angiogenesis through Creb-Ezh2-Tsp1 Pathway in Prostate Cancers. Nat. Commun. 2018, 9, 4080. [Google Scholar] [CrossRef] [PubMed]
Figure 1. CgA expression status in the present patient cohort. (A) Twenty-five percent (17/68) of the cases were positive for CgA in the first biopsy taken at the mHSPC stage. In the second biopsy taken at the mCRPC stage, the percentage increased to 42.6% (*** p < 0.001). (B) A total of 29.4% (15/51) of cases that were initially negative for CgA at the first biopsy developed a CgA-positive status of mCRPC.
Jcm 12 03362 g001
Figure 2. Histological appearance and immunohistochemical staining of CgA. (A,B) Typical case showing CgA negativity in the initial biopsy of mHSPC, which developed to (C,D) a CgA-positive status of mCRPC. (E,F) Typical case with low CgA expression in the initial biopsy of mHSPC that developed to (G,H) a higher CgA expression status in the second biopsy of mCRPC.
Jcm 12 03362 g002
Figure 3. Kaplan–Meier analyses of CgA expression in different groups. (A) The OS1st of CgA-positive mHSPC patients was significantly reduced compared with CgA-negative cases (21.7 vs. 58.7 months, p = 0.010). (B) The OS1st of patients with CgA expression of mCRPC was also markedly decreased (33.7 ± 5.6 months) compared with CgA-negative cases (58.7 months, p = 0.039). (C) In patients without CgA expression in the first biopsy but with CgA expression of mCRPC (n = 51), the OS1st was also shortened (33.7 vs. 58.8, p = 0.048). (D) In mCRPC patients with increased CgA (increase over 1%) or newly developed CgA expression, the OS1st was prominently reduced compared with those whose CgA expression had not changed (31.1 ± 5.7 vs. 58.8 ± 13.8, p = 0.015).
Jcm 12 03362 g003
Table 1. Clinicopathological features of the patient cohort.
CharacteristicsInitial BiopsyRepeated Biopsy
TotalWith CgA ExpressionWithout CgA Expression TotalWith CgA ExpressionWithout CgA Expression
(n = 68)(n = 17)(n = 51)p(n = 68)(n = 29)(n = 39)p
Median age (range)68 (51–84)67 (51–83)69 (52–84)0.22870 (54–86)67 (54–85)70 (54–86)0.136
ISUP/WHO2016 grade groupn (%)n (%)n (%) n (%)n (%)n (%)
Group 34 (5.9)2 (11.8)2 (3.9)0.4002 (2.9)1 (3.4)1 (2.6)0.977
Group 417 (25)3 (17.6)14 (27.5) 3 (4.4)1 (3.4)2 (5.1)
Group 547 (69.1)12 (70.6)35 (68.6) 41 (60.3)18 (62.1)23 (59.0)
Not grouped 22 (32.4)9 (31.1)13 (33.3)
Gleason score
<921 (30.9)5 (29.4)16 (31.4)0.8805 (7.4)2 (6.9)3 (7.7)0.967
≥947 (69.1)12 (70.6)35 (68.6) 41 (60.3)18 (62.1)23 (59.0)
Not grouped 22 (32.4)9 (31)13 (33.3)
Castration
Surgery22 (32.4)8 (47.1)14 (27.5)0.13422 (32.4)10 (34.5)12 (30.8)0.746
Drugs46 (67.6)9 (52.9)37 (72.5) 46 (67.6)19 (65.5)27 (69.2)
Metastasis
Visceral metastasis2 (2.9)1 (5.9)1 (2.0)0.4402 (2.9)1 (3.4)1 (2.6)1.000
Bone metastasis66 (97.1)16 (94.1)50 (98.0) 66 (97.1)28 (96.6)38 (97.4)
PSA (ng/mL)
≥10043 (63.2)10 (58.8)33 (64.7)0.66343 (63.2)15 (51.7)28 (71.8)0.090
<10025 (36.8)7 (41.2)18 (35.3) 25 (36.8)14 (48.3)11 (28.2)
Abbreviations: ISUP/WHO, International Society of Urological Pathology/the World Health Organization; CgA, chromogranin A; PSA, prostate-specific antigen; n: number of cases; p-values refer to differences in the clinicopathological parameters of enrolled patients.
Table 2. Univariate survival analysis of OS1st and OS2nd.
VariatesOS1st (Months)OS2nd (Months)
Median (95% CI)pMedian (95% CI)p
Residual tumor of mCRPC (%)
≥40% vs. <40%47.8 (25.5–70.0) vs. 58.7 (43.5–73.8)0.48723.6 (11.4–35.8) vs. 36.5 (25.3–47.7)0.100
Age at first diagnosis (y)
≥68 vs. <6849.1 (35.6–62.6) vs. 41.5 (15.1–67.9)0.41525.9 (11.3–40.4) vs. 29.5 (13.3–45.6)0.822
Age at mCRPC status (y)
≥70 vs. <7050.0 (35.5–64.5) vs. 41.5 (22.4–60.6)0.12925.9 (10.8–41.0) vs. 29.5 (19.3–39.6)0.824
GS at mHSPC status
≥9 vs. <941.3 (26.1–56.5) vs. 86.5 (35.1–137.8)0.01522.2 (12.6–31.8) vs. 44.00.004
GS at mCRPC status
≥9 vs. <949.1 (25.3–73.0) vs. 58.7 (0–120.9)0.62532.3 (25.9–38.7) vs. 46.4 (27.4–65.3)0.415
ISUP/WHO 2016 grade group
Group 3 vs. group 4 vs. group 567.3 (38.2–96.4) vs. 64.7 (49.1–80.4) vs. 51.8 (32.9–70.8)0.12850.9 (28.8–72.9) vs. 42.2 (32.2–52.1) vs. 25.8 (20.2–31.3)0.074
CgA status of mHSPC
Positive vs. negative21.7 (9.7–33.7) vs. 58.7 (44.2–73.1)0.01712.1 (7.4–16.8) vs. 33.3 (23.4–43.3)0.103
CgA ≥ 10% vs. CgA < 10%15.8 (4.9–26.8) vs. 48.4 (25.6–71.3)<0.00110.9 (0.7–21.0) vs. 31.9 (21.7–42.1)0.001
CgA status of mCRPC
Positive vs. negative35.0 (11.5–58.5) vs. 58.7 (39.6–77.8)0.02514.7 (8.5–20.8) vs. 37.3 (23.4–51.2)0.023
CgA ≥ 10% vs. CgA < 10%20.5 (14.0–27.0) vs. 51.1 (39.8–62.4)0.00712.1 (9.7–14.5) vs. 31.9 (21.2–42.6)0.001
Castration
Surgical vs. medical47.8 (30.0–66.0) vs. 49.1 (35.4–62.8)0.74325.2 (7.5–43.0) vs. 27.0 (16.6–37.3)0.459
Metastasis at mCRPC
Visceral metastasis vs. bone metastasis only59.9 (14.9–104.9) vs. 48.4 (30.0–66.9)0.84349.2 (22.2–76.2) vs. 25.2 (12.9–37.6)0.600
Serum PSA at mCRPC (ng/mL)
≥100 vs. <10041.5 (25.4–57.6) vs. 58.8 (35.0–82.6)0.33231.3 (7.9–54.8) vs. 25.2 (15.8–34.7)0.697
Abbreviations: OS1st, the OS from first diagnosis to death; OS2nd, the OS from the second biopsy or the diagnosis of mCRPC to death; CI, confidence interval; mCRPC, metastatic castration-resistant prostate cancer; mHSPC, hormone-sensitive prostate cancer; GS, Gleason score; CgA, chromogranin A; PSA, prostate-specific antigen. The p-values < 0.05 are in bold.
Table 3. Univariate Cox regression analyses of OS1st and OS2nd.
VariablesData TypeOS1st (Months)OS2nd (Months)
HR (95% CI)pHR (95% CI)p
Age at mHSPC statusContinuous0.99 (0.96–1.03)0.5881.00 (0.97–1.04)0.754
Age at mCRPC statusContinuous0.97 (0.94–1.00)0.0581.00 (0.96–1.03)0.833
Tumor% at mCRPC statusContinuous1.00 (0.99–1.01)0.7731.00 (1.00–1.01)0.381
Gleason score at mHSPC status≥9 vs. <92.048 (1.02–4.48)0.0552.26 (1.13–4.97)0.015
CgA status of mHSPC≥1% vs. <1%2.28 (1.14–4.58)0.0201.75 (0.89–3.48)0.108
Proportion of CgA at mHSPC status≥10% vs. <10%4.29 (1.89–9.73)<0.0012.81 (1.26–6.26)0.012
CgA status of mCRPC≥1% vs. <1%1.77 (1.07–2.95)0.0281.78 (1.08–2.95)0.025
Proportion of CgA at mCRPC status≥10% vs. <10%2.27 (1.24–4.16)0.0082.84 (1.53–5.29)0.001
Castration methodSurgery vs. medicine1.09 (0.65–1.82)0.7441.21 (0.73–2.01)0.460
Metastasis of mCRPCViscera vs. bone1.11 (0.40–3.08)0.8430.76 (0.27–2.12)0.601
Serum PSA level of mCRPC (ng/mL)≥100 vs. <1001.32 (0.75–2.31)0.3341.15 (0.64–1.93)0.698
Abbreviations: OS1st, the OS from first diagnosis to death; OS2nd, the OS from the second biopsy or the diagnosis of mCRPC to death; mHSPC, metastatic hormone-sensitive prostate cancer; mCRPC, metastatic castration-resistant prostate cancer; CgA, chromogranin A; PSA, prostate-specific antigen. The p-values < 0.05 are in bold.
Table 4. Multivariate Cox proportional hazards regression analyses of OS1st and OS2nd.
VariatesData TypeOS1st (Months)OS2nd (Months)
HR (95% CI)pHR (95% CI)p
For mHSPC
Age at mHSPC statusContinuous1.00 (0.96–1.04)0.8041.00 (0.96–1.04)0.994
GS at first biopsy≥9 vs. <91.97 (0.98–4.33)0.0702.19 (1.09–4.82)0.037
CgA expression≥1% vs. <1%2.16 (1.04–4.26)0.0311.67 (0.81–3.23)0.145
For mCRPC
Age at mCRPC statusContinuous1.05 (0.97–1.17)0.2651.03 (0.95–1.12)0.533
GS at second biopsy≥9 vs. <97.37 (1.84–54.79)0.0204.92 (1.33–31.52)0.054
CgA expression≥10% vs. <10%20.19 (3.04–329.9)0.0085.17 (1.10–33.13)0.048
Abbreviations: OS1st, the OS from first diagnosis to death; OS2nd, the OS from the second biopsy or the diagnosis of mCRPC to death; HR, hazard ratio; mHSPC, metastatic hormone-sensitive prostate cancer; mCRPC, metastatic castration-resistant prostate cancer; CgA, chromogranin A; GS, Gleason score. The p-values < 0.05 are in bold.
Disclaimer/Publisher’s Note: The statements, opinions and data contained in all publications are solely those of the individual author(s) and contributor(s) and not of MDPI and/or the editor(s). MDPI and/or the editor(s) disclaim responsibility for any injury to people or property resulting from any ideas, methods, instructions or products referred to in the content.

