
Predictive Performance of the FRAX Tool Calibrated for Spain vs. an Age and Sex Model: Prospective Cohort Study with 9082 Women and Men Followed for up to 8 Years

 , , ,
, , ,
Abstract
:1. Introduction
2. Methods
2.1. Setting
2.2. Study Design
2.3. Population
2.4. Data Sources
2.5. Covariates and Input Variables
2.6. Outcomes
2.7. Predictive Tool Risk Computation
2.8. Analysis
3. Results
4. Discussion
Supplementary Materials
Author Contributions
Funding
Institutional Review Board Statement
Informed Consent Statement
Data Availability Statement
Conflicts of Interest
References
- Pisani, P.; Renna, M.D.; Conversano, F.; Casciaro, E.; Di Paola, M.; Quarta, E.; Muratore, M.; Casciaro, S. Major osteoporotic fragility fractures: Risk factor updates and societal impact. World J. Orthop. 2016, 7, 171–181. [Google Scholar] [CrossRef] [PubMed]
- Roux, C.; Wyman, A.; Hooven, F.H.; Gehlbach, S.H.; Adachi, J.D.; Chapurlat, R.D.; Compston, J.E.; Cooper, C.; Díez-Pérez, A. Burden of non-hip, non-vertebral fractures on quality of life in postmenopausal women: The Global Longitudinal study of Osteoporosis in Women (GLOW). Osteoporos. Int. 2012, 23, 2863–2871. [Google Scholar] [CrossRef] [PubMed] [Green Version]
- Kanis, J.A.; Odén, A.; McCloskey, E.V.; Johansson, H.; Wahl, D.A.; Cooper, C.; on behalf of the IOF Working Group on Epidemiology and Quality of Life. A systematic review of hip fracture incidence and probability of fracture worldwide. Osteoporos. Int. 2012, 23, 2239–2256. [Google Scholar] [CrossRef] [PubMed] [Green Version]
- Ojeda-Thies, C.; Sáez-López, P.; Currie, C.; Tarazona-Santalbina, F.; Alarcón, T.; Muñoz-Pascual, A.; Pareja, T.; Gómez-Campelo, P.; Montero-Fernández, N. Spanish National Hip Fracture Registry (RNFC): Analysis of its first annual report and international comparison with other established registries. Osteoporos. Int. 2019, 30, 1243–1254. [Google Scholar] [CrossRef] [PubMed]
- Azagra, R.; López-Expósito, F.; Martin-Sánchez, J.C.; Aguyé, A.; Moreno, N.; Cooper, C.; Díez-Pérez, A.; Dennison, E.M. Changing trends in the epidemiology of hip fracture in Spain. Osteoporos. Int. 2014, 25, 1267–1274. [Google Scholar] [CrossRef] [Green Version]
- Lih, A.; Nandapalan, H.; Kim, M.; Yap, C.; Lee, P.; Ganda, K.; Seibel, M.J. Targeted intervention reduces refracture rates in patients with incident non-vertebral osteoporotic fractures: A 4-year prospective controlled study. Osteoporos. Int. 2011, 22, 849–858. [Google Scholar] [CrossRef]
- Baroni, M.; Zampi, E.; Rinonapoli, G.; Serra, R.; Zengarini, E.; Duranti, G.; Ercolani, S.; Conti, F.; Caraffa, A.; Mecocci, P.; et al. Fracture prevention service to bridge the osteoporosis care gap. Clin. Interv. Aging 2015, 10, 1035–1042. [Google Scholar] [CrossRef] [Green Version]
- Kanis, P.J.A.; Delmas, P.; Burckhardt, P.; Cooper, C.; Torgerson, D. Guidelines for diagnosis and management of osteoporosis. Osteoporos. Int. 1997, 7, 390–406. [Google Scholar] [CrossRef]
- Abu-Rajab, R.B.; Watson, W.S.; Walker, B.; Roberts, J.; Gallacher, S.J.; Meek, R.M.D. Peri-prosthetic bone mineral density after total knee arthroplasty. J. Bone Jt. Surg. Br. 2006, 88-B, 606–613. [Google Scholar] [CrossRef]
- Watts, N.B. Is it ethical to use placebos in osteoporosis clinical trials? Curr. Rheumatol. Rep. 2004, 6, 79–84. [Google Scholar] [CrossRef]
- Marques, A.; Ferreira, R.J.D.O.; Santos, E.J.F.; Loza, E.; Carmona, L.; Da Silva, J.A.P. The accuracy of osteoporotic fracture risk prediction tools: A systematic review and meta-analysis. Ann. Rheum. Dis. 2015, 74, 1958–1967. [Google Scholar] [CrossRef] [PubMed]
- Kanis, J.A.; Johansson, H.; Harvey, N.; McCloskey, E.V. A brief history of FRAX. Arch. Osteoporos. 2018, 13, 118. [Google Scholar] [CrossRef]
- Kanis, J.A.; Johnell, O.; De Laet, C.; Jonsson, B.; Oden, A.; Ogelsby, A.K. International Variations in Hip Fracture Probabilities: Implications for Risk Assessment. J. Bone Miner. Res. 2002, 17, 1237–1244. [Google Scholar] [CrossRef] [PubMed]
- Lekamwasam, S. The diversity of Fracture Risk Assessment Tool (FRAX)-based intervention thresholds in Asia. Osteoporos. Sarcopenia 2019, 5, 104–108. [Google Scholar] [CrossRef]
- Grupo de Variaciones en la Práctica Médica de la Red temática de Investigación en Resultados y Servicios de Salud (Grupo VPM-IRYS). Variaciones en cirugía ortopédica y traumatología en el Sistema Nacional de Salud. Atlas Var Pract. Med. SNS 2005, 1, 17–36. [Google Scholar]
- Cordomí, C.T.; del Río, L.M.; Di Gregorio, S.; Casas, L.; Estrada, M.-D.; Kotzeva, A.; Espallargues, M. Validation of the FRAX Predictive Model for Major Osteoporotic Fracture in a Historical Cohort of Spanish Women. J. Clin. Densitom. 2013, 16, 231–237. [Google Scholar] [CrossRef] [PubMed]
- Azagra, R.; Roca, G.; Encabo, G.; Aguyé, A.; Zwart, M.; Güell, S.; Puchol, N.; Gene, E.; Casado, E.; Sancho, P.; et al. FRAX® tool, the WHO algorithm to predict osteoporotic fractures: The first analysis of its discriminative and predictive ability in the Spanish FRIDEX cohort. BMC Musculoskelet. Disord. 2012, 13, 204. [Google Scholar] [CrossRef] [Green Version]
- González-Macías, J.; Marin, F.; Vila, J.; Díez-Pérez, A. Probability of fractures predicted by FRAX® and observed incidence in the Spanish ECOSAP Study cohort. Bone 2012, 50, 373–377. [Google Scholar] [CrossRef]
- Ensrud, K.E.; Liu, L.Y.; Taylor, B.C.; Schousboe, J.T.; Donaldson, M.G.; Fink, H.A.; Cauley, J.A.; Hillier, T.A.; Warren, S.B. Study of Osteoporotic Fractures Research Group. A Comparison of Prediction Models for Fractures in Older Women: Is more better? Arch. Intern. Med. 2009, 169, 2087–2094. [Google Scholar] [CrossRef] [Green Version]
- Donaldson, M.G.; Palermo, L.; Schousboe, J.T.; Ensrud, K.; Hochberg, M.C.; Cummings, S.R. FRAX and Risk of Vertebral Fractures: The Fracture Intervention Trial. J. Bone Miner. Res. 2009, 24, 1793–1799. [Google Scholar] [CrossRef]
- García-Sempere, A.; Sanchez, A.O.; Muñoz-Quiles, C.; Hurtado, I.; Peiró, S.; Sanfélix-Gimeno, G.; Diez-Domingo, J. Data Resource Profile: The Valencia Health System Integrated Database (VID). Int. J. Epidemiol. 2020, 49, 740–741e. [Google Scholar] [CrossRef] [PubMed] [Green Version]
- Sanfelix-Genovés, J.; Peiró, S.; Sanfélix-Gimeno, G.; Giner, V.; Gil, V.; Pascual, M.; Fluixá, C.; Fuertes, A.; Hurtado, I.; Ferreros, I. Development and validation of a population-based prediction scale for osteoporotic fracture in the region of Valencia, Spain: The ESOSVAL-R study. BMC Public Health 2010, 10, 153. [Google Scholar] [CrossRef] [PubMed] [Green Version]
- Sanfelix-Genovés, J.; Peiró, S.; Sanfélix-Gimeno, G.; Hurtado, I.; De La Torre, M.P.; Trillo-Mata, J.L.; Giner-Ruiz, V. Impact of a multifaceted intervention to improve the clinical management of osteoporosis. The ESOSVAL-F study. BMC Health Serv. Res. 2010, 10, 292. [Google Scholar] [CrossRef] [PubMed] [Green Version]
- Sanfélix-Gimeno, G.; Sanfelix-Genovés, J.; Peiró, S.; Hurtado, I.; Trillo, J.L.; Usó, R.; Ruiz, V.G.; De La Torre, M.P.; Ferreros, I. Adherence to and appropriateness of anti-osteoporotic treatments in patients aged 50 and over in the Valencia Region (Spain). The ESOSVAL-AD Study. BMC Musculoskelet. Disord. 2011, 12, 178. [Google Scholar] [CrossRef] [Green Version]
- Sanfélix-Genovés, J.; Sanfélix-Gimeno, G.; Peiró, S.; Hurtado, I.; Fluixá, C.; Fuertes, A.; Campos, J.C.; Giner, V.; Baixauli, C. Prevalence of osteoporotic fracture risk factors and antiosteoporotic treatments in the Valencia region, Spain. The baseline characteristics of the ESOSVAL cohort. Osteoporos. Int. 2013, 24, 1045–1055. [Google Scholar] [CrossRef]
- Sanfélix-Gimeno, G.; Sanfélix-Genovés, J.; Rodriguez-Bernal, C.L.; Peiró, S.; Hurtado, I. Prevalence, determinants, and inappropriateness of calcium supplementation among men and women in a Spanish Mediterranean area: Cross-sectional data from the ESOSVAL cohort. J. Bone Miner. Res. 2013, 28, 2286–2294. [Google Scholar] [CrossRef]
- Hurtado, I.; Sanfélix-Gimeno, G.; Baixauli-Pérez, C.; Peiró, S.; Sanfélix-Genovés, J. Impact on the Population of Different Bone Mineral Density Testing Criteria and Appropriateness of Densitometries in the ESOSVAL Cohort, Spain. J. Clin. Endocrinol. Metab. 2014, 99, 142–150. [Google Scholar] [CrossRef] [Green Version]
- Hurtado-Navarro, I.; García-Sempere, A.; Rodríguez-Bernal, C.; Sanfélix-Genovés, J.; Peiró, S.; Sanfélix-Gimeno, G. Impact of Drug Safety Warnings and Cost-Sharing Policies on Osteoporosis Drug Utilization in Spain: A Major Reduction But With the Persistence of Over and Underuse. Data From the ESOSVAL Cohort From 2009 to 2015. Front. Pharmacol. 2019, 10, 768. [Google Scholar] [CrossRef]
- Moons, K.G.M.; Altman, D.G.; Vergouwe, Y.; Royston, P. Prognosis and prognostic research: Application and impact of prognostic models in clinical practice. BMJ 2009, 338, 1487–1490. [Google Scholar] [CrossRef]
- Altman, D.G.; Vergouwe, Y.; Royston, P.; Moons, K.G.M. Prognosis and prognostic research: Validating a prognostic model. BMJ 2009, 338, 1432–1435. [Google Scholar] [CrossRef]
- Royston, P.; Moons, K.G.M.; Altman, D.G.; Vergouwe, Y. Prognosis and prognostic research: Developing a prognostic model. BMJ 2009, 338, 1373–1377. [Google Scholar] [CrossRef] [PubMed]
- Moons, K.G.M.; Royston, P.; Vergouwe, Y.; E Grobbee, D.; Altman, D.G. Prognosis and prognostic research: What, why, and how? BMJ 2009, 338, 1317–1320. [Google Scholar] [CrossRef] [PubMed]
- Steyerberg, E.W.; Harrell, F.E., Jr.; Borsboom, G.J.; Eijkemans, M.J.; Vergouwe, Y.; Habbema, J.D. Internal validation of predictive models: Efficiency of some procedures for logistic regression analysis. J. Clin. Epidemiol. 2001, 54, 774–781. [Google Scholar] [CrossRef]
- Papaioannou, A.; Morin, S.; Cheung, A.M.; Atkinson, S.; Brown, J.P.; Feldman, S.; Hanley, D.A.; Hodsman, A.; Jamal, S.A.; Kaiser, S.M.; et al. 2010 clinical practice guidelines for the diagnosis and management of osteoporosis in Canada: Summary. Can. Med Assoc. J. 2010, 182, 1864–1873. [Google Scholar] [CrossRef] [PubMed] [Green Version]
- Steyerberg, E.W.; Van Calster, B.; Pencina, M.J. Performance Measures for Prediction Models and Markers: Evaluation of Predictions and Classifications. Rev. Esp. Cardiol. 2011, 64, 788–794. [Google Scholar] [CrossRef]
- Berry, S.D.; Shi, S.; Kiel, D.P. Considering the Risks and Benefits of Osteoporosis Treatment in Older Adults. JAMA Intern. Med. 2019, 179, 1103. [Google Scholar] [CrossRef]
- Kanis, J.A.; Oden, A.; Johansson, H.; McCloskey, E. Pitfalls in the external validation of FRAX. Osteoporos. Int. 2011, 23, 423–431. [Google Scholar] [CrossRef]
- Etxebarria-Foronda, I.; Arrospide, A.; Soto-Gordoa, M.; Caeiro, J.R.; Abecia, L.C.; Mar, J. Regional variability in changes in the incidence of hip fracture in the Spanish population (2000–2012). Osteoporos. Int. 2015, 26, 1491–1497. [Google Scholar] [CrossRef]
- Fraser, L.-A.; CaMos Research Group; Langsetmo, L.; Berger, C.; Ioannidis, G.; Goltzman, D.; Adachi, J.D.; Papaioannou, A.; Josse, R.; Kovacs, C.; et al. Fracture prediction and calibration of a Canadian FRAX® tool: A population-based report from CaMos. Osteoporos. Int. 2011, 22, 829–837. [Google Scholar] [CrossRef]
- Leslie, W.D.; Lix, L.M.; Johansson, H.; Oden, A.; McCloskey, E.; Kanis, J.A. Manitoba Bone Density Program. Independent clinical validation of a Canadian FRAX tool: Fracture prediction and model calibration. J. Bone Miner. Res. 2010, 25, 2350–2358. [Google Scholar] [CrossRef]
- Pressman, A.R.; Lo, J.C.; Chandra, M.; Ettinger, B. Methods for Assessing Fracture Risk Prediction Models: Experience With FRAX in a Large Integrated Health Care Delivery System. J. Clin. Densitom. 2011, 14, 407–415. [Google Scholar] [CrossRef] [PubMed]
- Dagan, N.; Cohen-Stavi, C.; Leventer-Roberts, M.; Balicer, R.D. External validation and comparison of three prediction tools for risk of osteoporotic fractures using data from population based electronic health records: Retrospective cohort study. BMJ 2017, 356, i6755. [Google Scholar] [CrossRef] [PubMed] [Green Version]
- Sanfélix-Genovés, J.; Catalá-López, F.; Sanfélix-Gimeno, G.; Hurtado, I.; Baixauli, C.; Peiró, S. Variability in the recommendations for the clinical management of osteoporosis. Med. Clin. 2014, 142, 15–22. (In Spanish) [Google Scholar] [CrossRef] [PubMed]
- García-Sempere, A.; Hurtado, I.; Sanfélix-Genovés, J.; Rodríguez-Bernal, C.L.; Gil Orozco, R.; Peiró, S.; Sanfélix-Gimeno, G. Primary and secondary non-adherence to osteoporotic medications after hip fracture in Spain. The PREV2FO population-based retrospective cohort study. Sci. Rep. 2017, 7, 11784. [Google Scholar] [CrossRef] [Green Version]

| N | % | |
|---|---|---|
| Gender | ||
| Male | 5403 | 59.5% |
| Female | 3679 | 40.5% |
| Age mean (SD) | ||
| 64.2 | 9.8 | |
| Age (strata) | ||
| <65 | 5274 | 58.1% |
| 65–69 | 1329 | 14.6% |
| 70–74 | 941 | 10.4% |
| 75–79 | 820 | 9.0% |
| ≥80 | 718 | 7.9% |
| Educational level | ||
| Unknown | 641 | 7.1% |
| Primary | 3632 | 40.0% |
| Secondary/University | 2481 | 27.3% |
| No studies | 2328 | 25.6% |
| Weight mean (SD) | ||
| Weight | 77.6 | 14 |
| BMI mean (SD) | ||
| BMI | 29 | 4.7 |
| BMI strata | ||
| <20 | 83 | 0.9% |
| 20–29 | 5711 | 62.9% |
| ≥30 | 3288 | 36.2% |
| Comorbidities | ||
| Osteoporosis | 912 | 10.0% |
| Diabetes | 2210 | 24.3% |
| Chronic obstructive pulmonary disease | 1007 | 11.1% |
| Ischemic disease | 735 | 8.1% |
| Cerebrovascular disease | 379 | 4.2% |
| Other chronic conditions | 646 | 7.1% |
| Smoking | ||
| Current smoker (any quantity) | 1633 | 18.0% |
| Alcohol Intake | ||
| (>17 U/week for women, >28 U/week for men) | 246 | 2.7% |
| Menopause before 40 years old | ||
| Yes | 235 | 2.6% |
| Unknown | 5824 | 64.1% |
| Calcium intake (mg) | ||
| 806.4 | 340.2 | |
| Calcium intake strata | ||
| Less than 500 | 1623 | 17.9% |
| 500–1000 | 5022 | 55.3% |
| 1000 or more | 2321 | 25.6% |
| Unknown | 116 | 1.3% |
| Sedentary life | ||
| Yes | 1501 | 16.5% |
| Unknown | 157 | 1.7% |
| Falls in the previous year (1 or more) | ||
| 1652 | 18.2% | |
| Untreated hypogonadism | ||
| Yes | 247 | 2.7% |
| Unknown | 697 | 7.7% |
| Osteoporosis | ||
| 1840 | 20.3% | |
| Glucocorticoid use | ||
| (prednisolone equivalent > 5 mg/day at least 3 months in previous year) | 79 | 0.9% |
| Densitometry | ||
| Densitometric test in ± 24 months from recruitment date | 1014 | 11.2% |
| Densitometric result | ||
| Normal | 337 | 3.7% |
| Osteopenia | 499 | 5.5% |
| Osteoporosis | 165 | 1.8% |
| Unknown | 8081 | 89.0% |
| Personal history of osteoporotic fracture | ||
| 538 | 5.9% | |
| Family history of hip fracture | ||
| 969 | 10.7% | |
| Calcium and Vit D treatment | ||
| 508 | 5.6% |
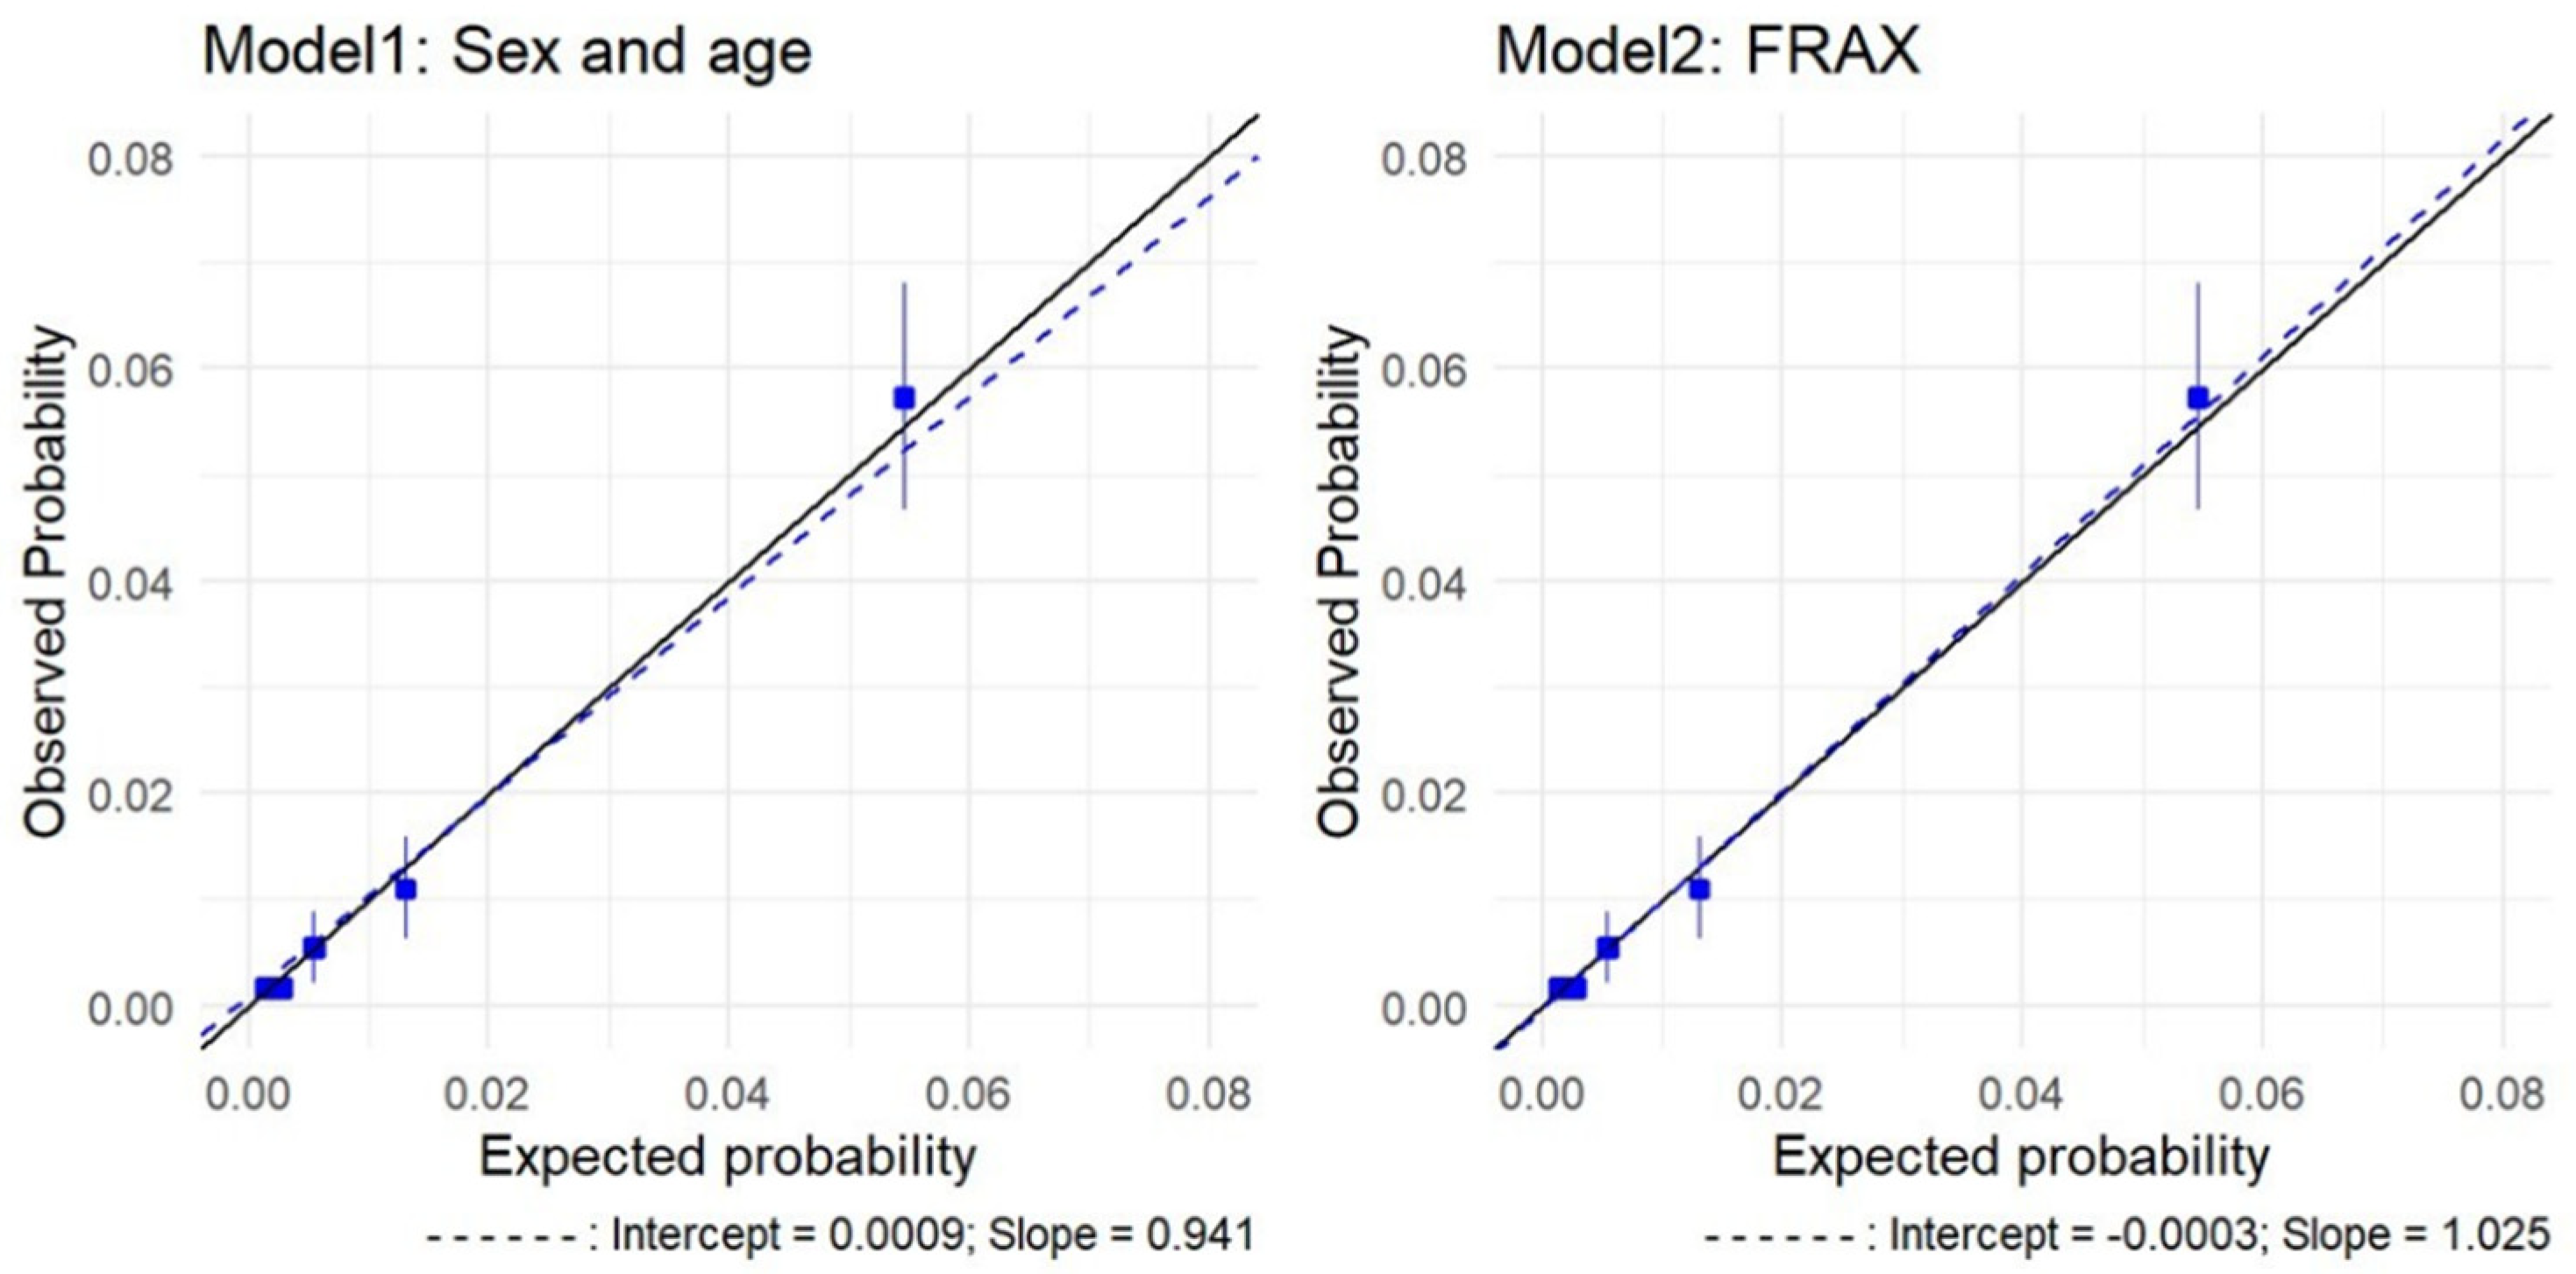
| FRAX | |||||||||||
| N | Rate | Expected Probability | [95% Conf. Interval] | Observed | Expected | [95% Conf. Interval] | O/E | Ratio | |||
| 1 | 1617 | 0.0006 | 0.0013 | 0.0013 | 0.0013 | 1 | 2 | 2.08 | 2.11 | 1/2 | 0.48 (0.47–0.48) |
| 2 | 1487 | 0.0020 | 0.0026 | 0.0026 | 0.0026 | 3 | 4 | 3.89 | 3.89 | 3/4 | 0.77 (0.77–0.77) |
| 3 | 2014 | 0.0055 | 0.0049 | 0.0048 | 0.0049 | 11 | 10 | 9.70 | 9.88 | 11/10 | 1.12 (1.11–1.13) |
| 4 | 2099 | 0.0143 | 0.0126 | 0.0124 | 0.0128 | 30 | 26 | 26.07 | 26.81 | 30/26 | 1.13 (1.12–1.15) |
| 5 | 1865 | 0.0509 | 0.0524 | 0.0507 | 0.0542 | 95 | 98 | 94.55 | 101.03 | 95/98 | 0.97 (0.94–1) |
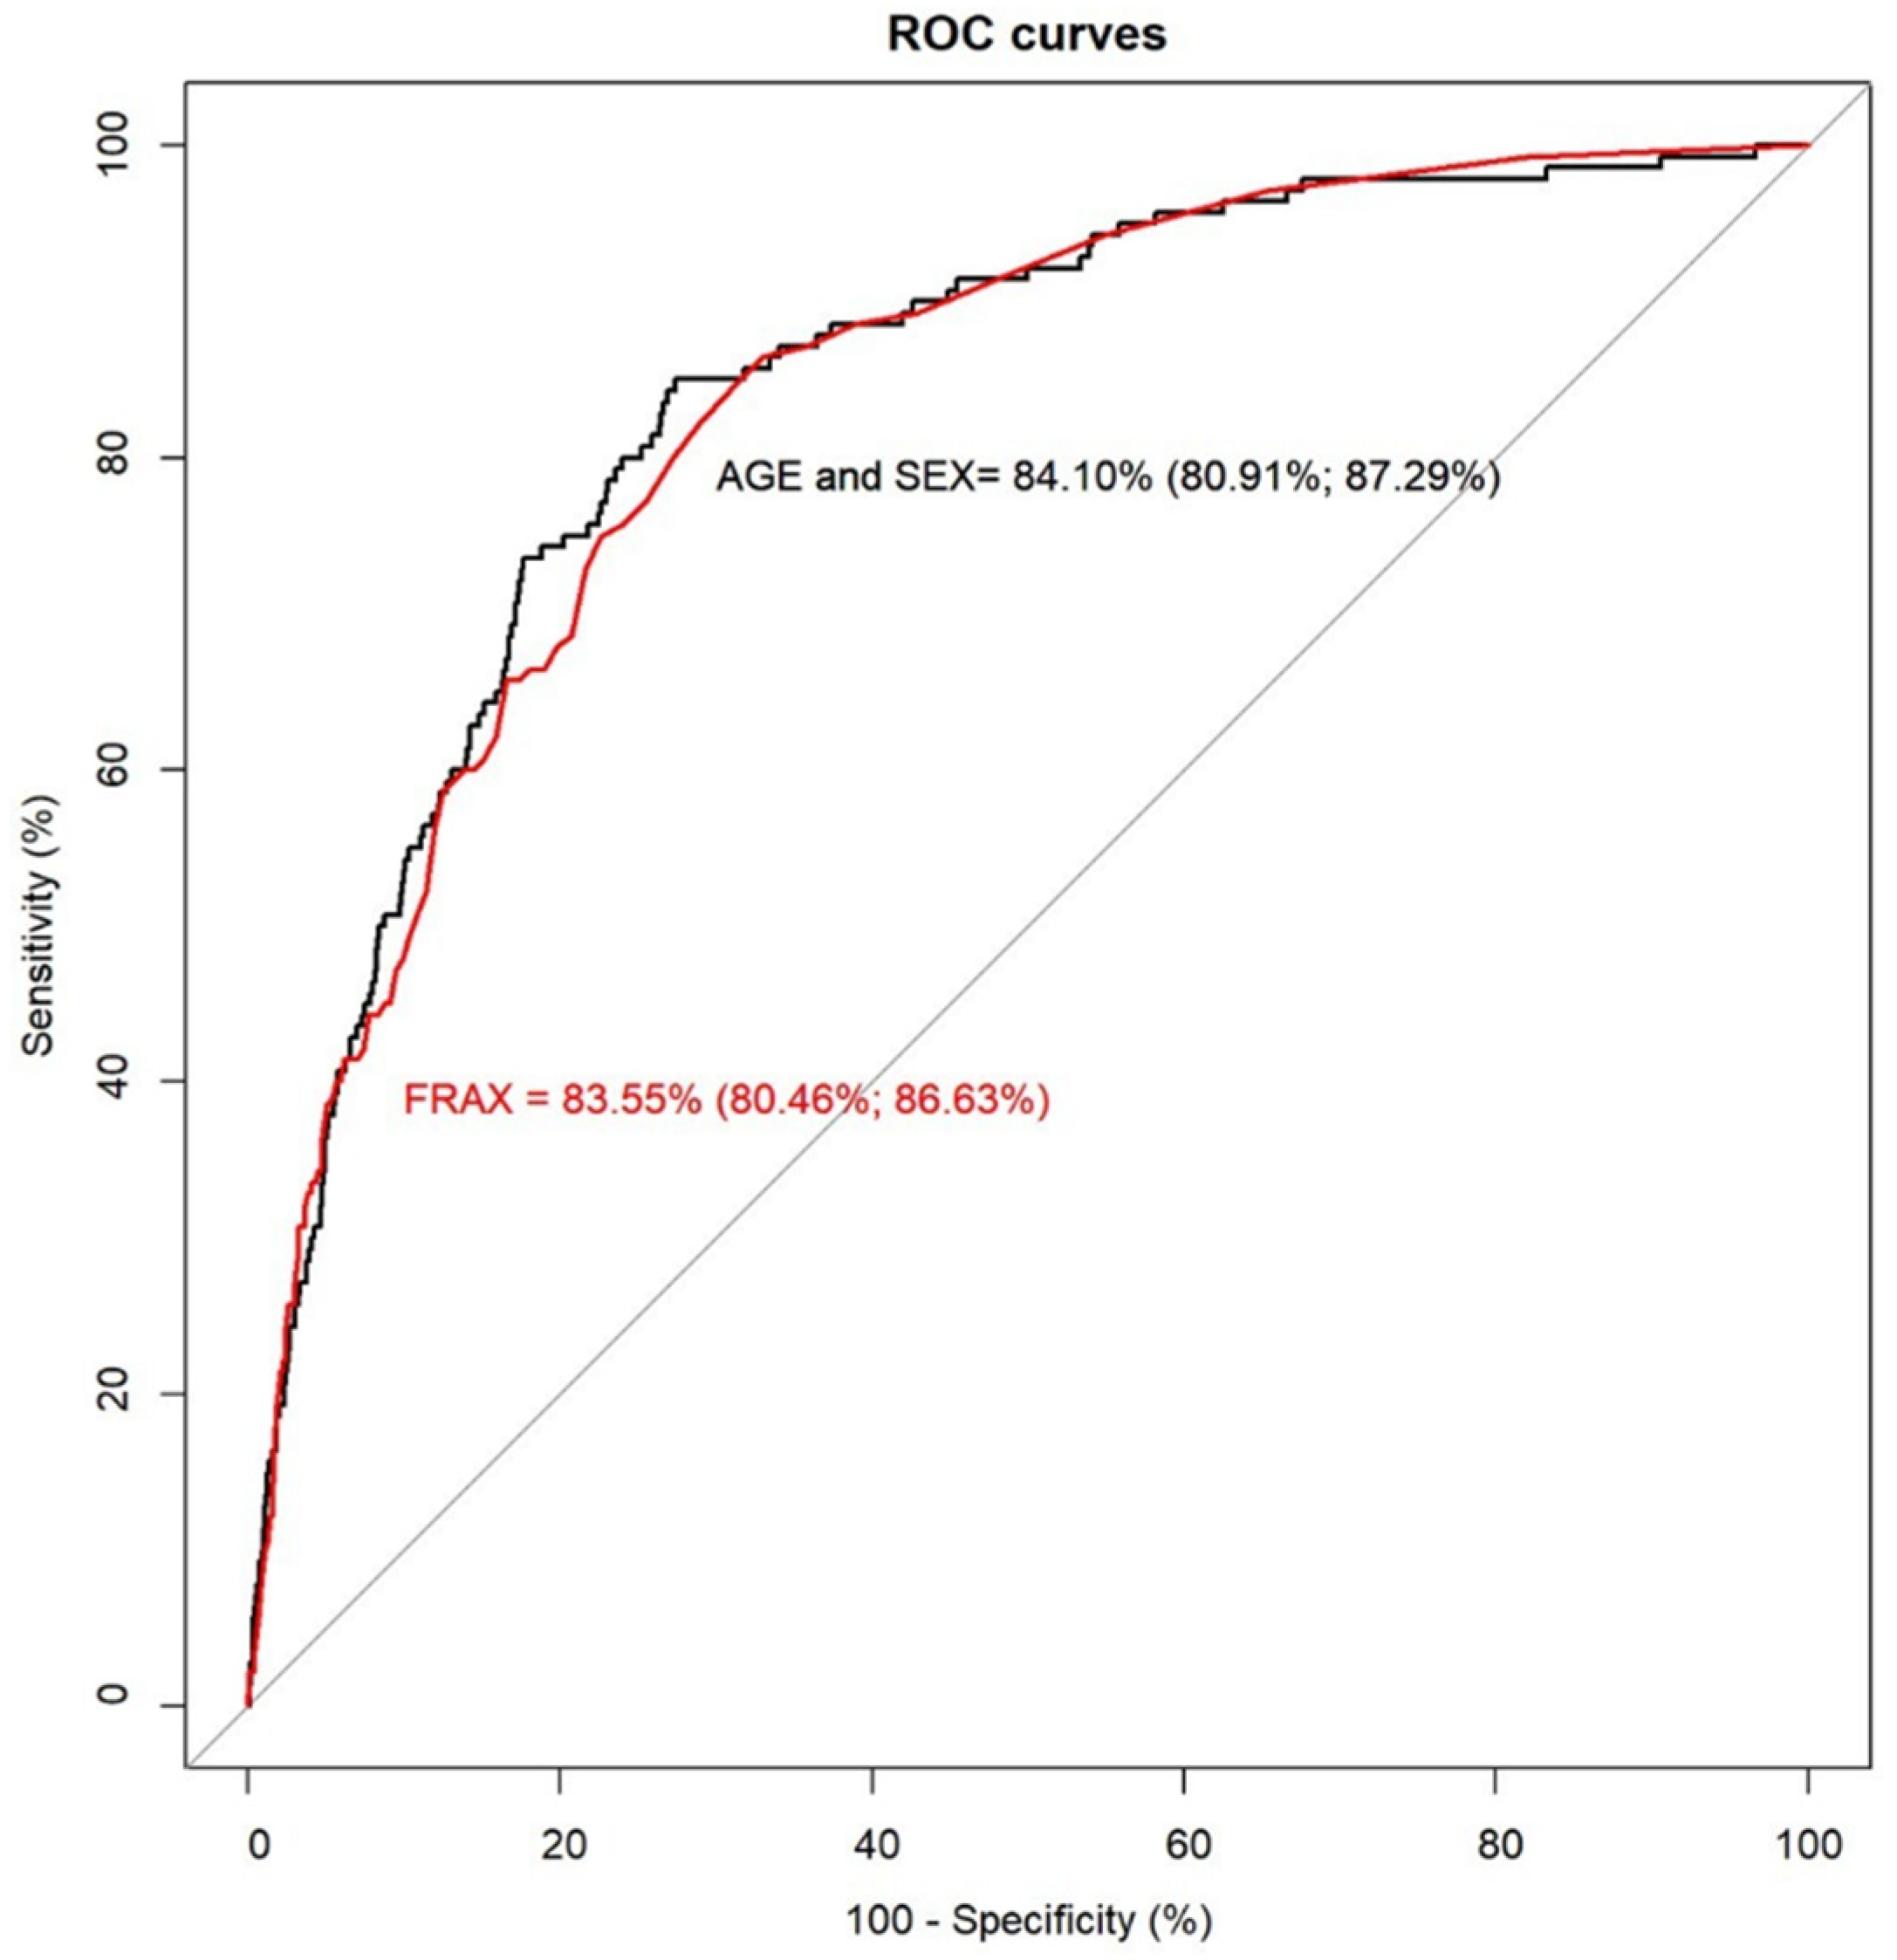
| AGE and SEX | |||||||||||
| N | Rate | Expected Probability | [95% Conf. Interval] | Observed | Expected | [95% Conf. Interval] | O/E | Ratio | |||
| 1 | 1817 | 0.0017 | 0.0014 | 0.0014 | 0.0014 | 3 | 2 | 2.46 | 2.52 | 3/2 | 1.2 (1.19–1.22) |
| 2 | 1817 | 0.0017 | 0.0027 | 0.0027 | 0.0027 | 3 | 5 | 4.85 | 4.93 | 3/5 | 0.61 (0.61–0.62) |
| 3 | 1816 | 0.0055 | 0.0054 | 0.0054 | 0.0055 | 10 | 10 | 9.75 | 9.95 | 10/10 | 1.02 (1.01–1.03) |
| 4 | 1816 | 0.0110 | 0.0131 | 0.0129 | 0.0133 | 20 | 24 | 23.43 | 24.07 | 20/24 | 0.84 (0.83–0.85) |
| 5 | 1816 | 0.0573 | 0.0545 | 0.0527 | 0.0563 | 104 | 99 | 95.71 | 102.32 | 104/99 | 1.05 (1.02–1.09) |
| AGE and SEX Model | FRAX | |||
|---|---|---|---|---|
| Threshold | 3% | 1.54% | 3% | 1.54% |
| Specificity | 85.67% | 75.14% | 85.51% | 74.54% |
| Sensitivity | 62.86% | 80.00% | 60.00% | 77.14% |
| Positive predictive value | 6.43% | 4.80% | 6.09% | 4.53% |
| Negative predictive value | 99.33% | 99.59% | 99.27% | 99.52% |
| Correctly classified | 85.32% | 75.21% | 85.11% | 74.58% |
| NRI [95% CI] | ||
|---|---|---|
| 3% Threshold | 1.54% Threshold | |
| NRI for non-events | −0.17% [−0.67%, 0.34%] | −0.60% [−1.15%, −0.06%] |
| NRI for events | −2.86% [−8.44%, 2.72%] | −2.86% [−7.68%, 1.97%] |
| NRI | −3.02% [−8.63%, 2.58%] | −3.46% [−8.32%, 1.40%] |
Publisher’s Note: MDPI stays neutral with regard to jurisdictional claims in published maps and institutional affiliations. |
© 2022 by the authors. Licensee MDPI, Basel, Switzerland. This article is an open access article distributed under the terms and conditions of the Creative Commons Attribution (CC BY) license (https://creativecommons.org/licenses/by/4.0/).
Share and Cite
García-Sempere, A.; Hurtado, I.; Peiró, S.; Sánchez-Sáez, F.; Santaana, Y.; Rodríguez-Bernal, C.; Sanfélix-Gimeno, G.; Sanfélix-Genovés, J. Predictive Performance of the FRAX Tool Calibrated for Spain vs. an Age and Sex Model: Prospective Cohort Study with 9082 Women and Men Followed for up to 8 Years. J. Clin. Med. 2022, 11, 2409. https://doi.org/10.3390/jcm11092409
García-Sempere A, Hurtado I, Peiró S, Sánchez-Sáez F, Santaana Y, Rodríguez-Bernal C, Sanfélix-Gimeno G, Sanfélix-Genovés J. Predictive Performance of the FRAX Tool Calibrated for Spain vs. an Age and Sex Model: Prospective Cohort Study with 9082 Women and Men Followed for up to 8 Years. Journal of Clinical Medicine. 2022; 11(9):2409. https://doi.org/10.3390/jcm11092409
Chicago/Turabian StyleGarcía-Sempere, Aníbal, Isabel Hurtado, Salvador Peiró, Francisco Sánchez-Sáez, Yared Santaana, Clara Rodríguez-Bernal, Gabriel Sanfélix-Gimeno, and José Sanfélix-Genovés. 2022. "Predictive Performance of the FRAX Tool Calibrated for Spain vs. an Age and Sex Model: Prospective Cohort Study with 9082 Women and Men Followed for up to 8 Years" Journal of Clinical Medicine 11, no. 9: 2409. https://doi.org/10.3390/jcm11092409
APA StyleGarcía-Sempere, A., Hurtado, I., Peiró, S., Sánchez-Sáez, F., Santaana, Y., Rodríguez-Bernal, C., Sanfélix-Gimeno, G., & Sanfélix-Genovés, J. (2022). Predictive Performance of the FRAX Tool Calibrated for Spain vs. an Age and Sex Model: Prospective Cohort Study with 9082 Women and Men Followed for up to 8 Years. Journal of Clinical Medicine, 11(9), 2409. https://doi.org/10.3390/jcm11092409