
Fibrin Strands Will Grow from Soluble Fibrin and Hang Up in an In Vitro Microcirculatory Viscoelastic Model: Is This a Major Cause of COVID-19 Associated Coagulopathy?

Abstract
:1. Introduction
2. Materials and Methods
2.1. Measurement of Soluble Fibrin
2.2. In Vitro Model System for Soluble Fibrin Production and Measurement
2.2.1. Thrombin Preparation
2.2.2. General Method for Soluble Fibrin Production In Vitro
2.2.3. Precipitation of SF: Production, Recovery and Photography of Microclots
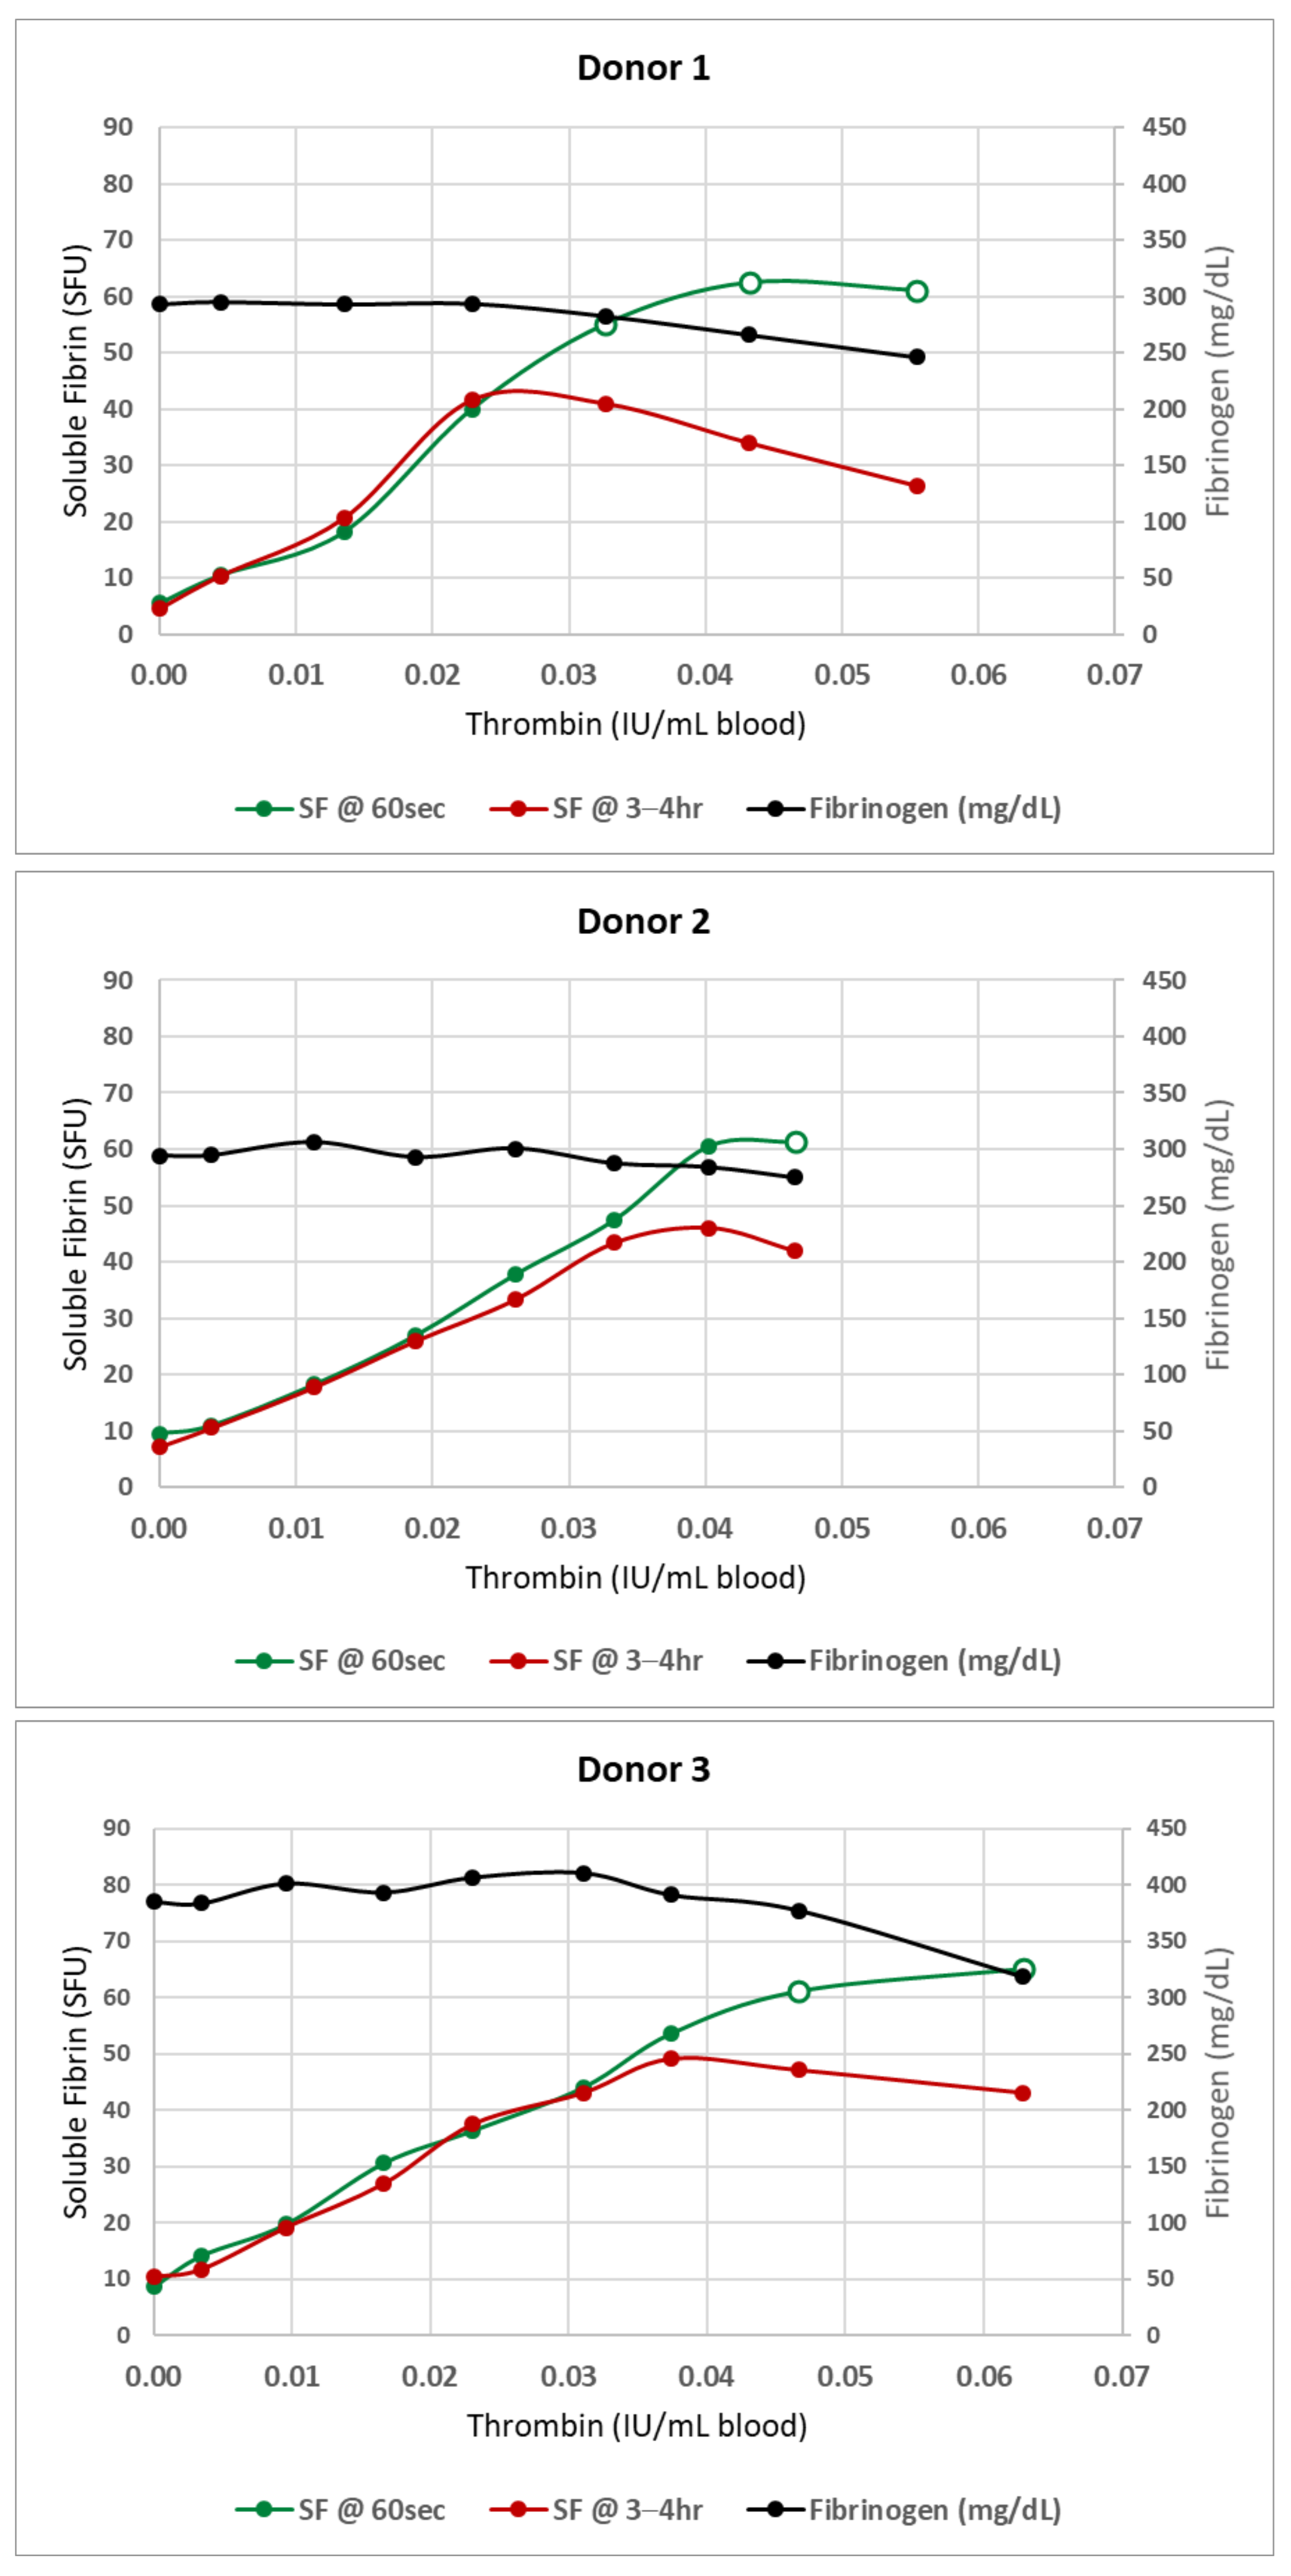
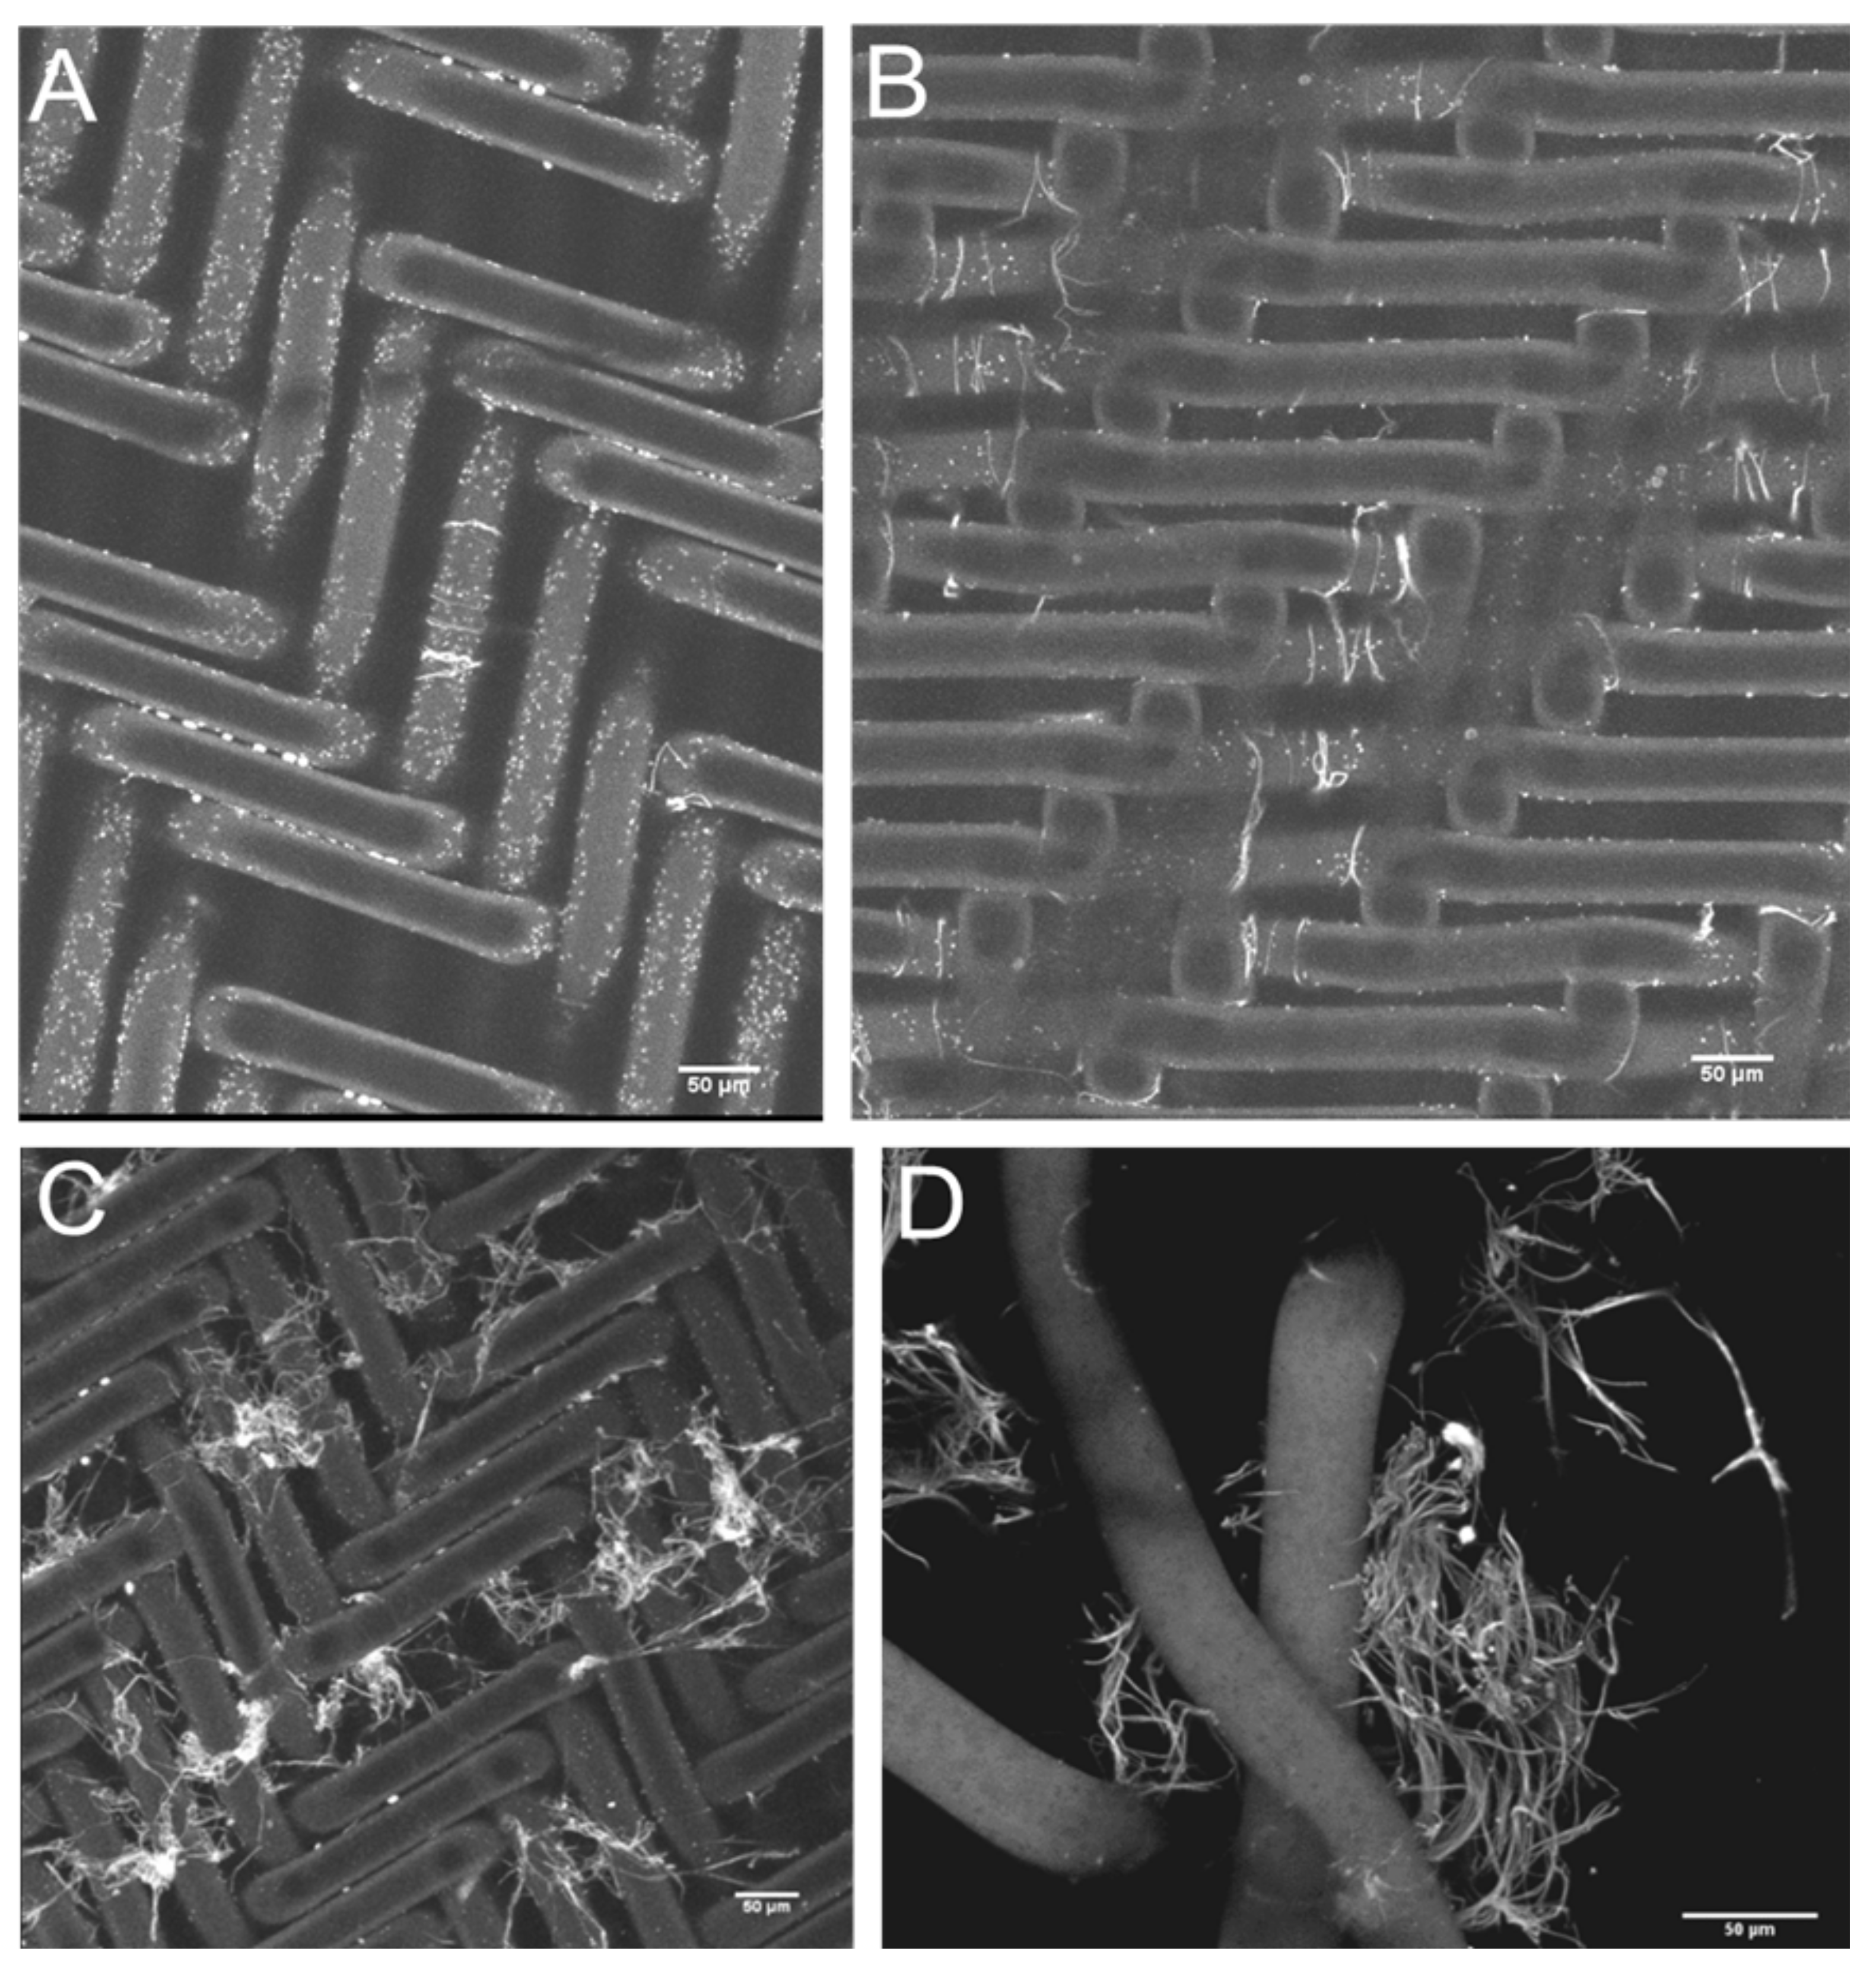
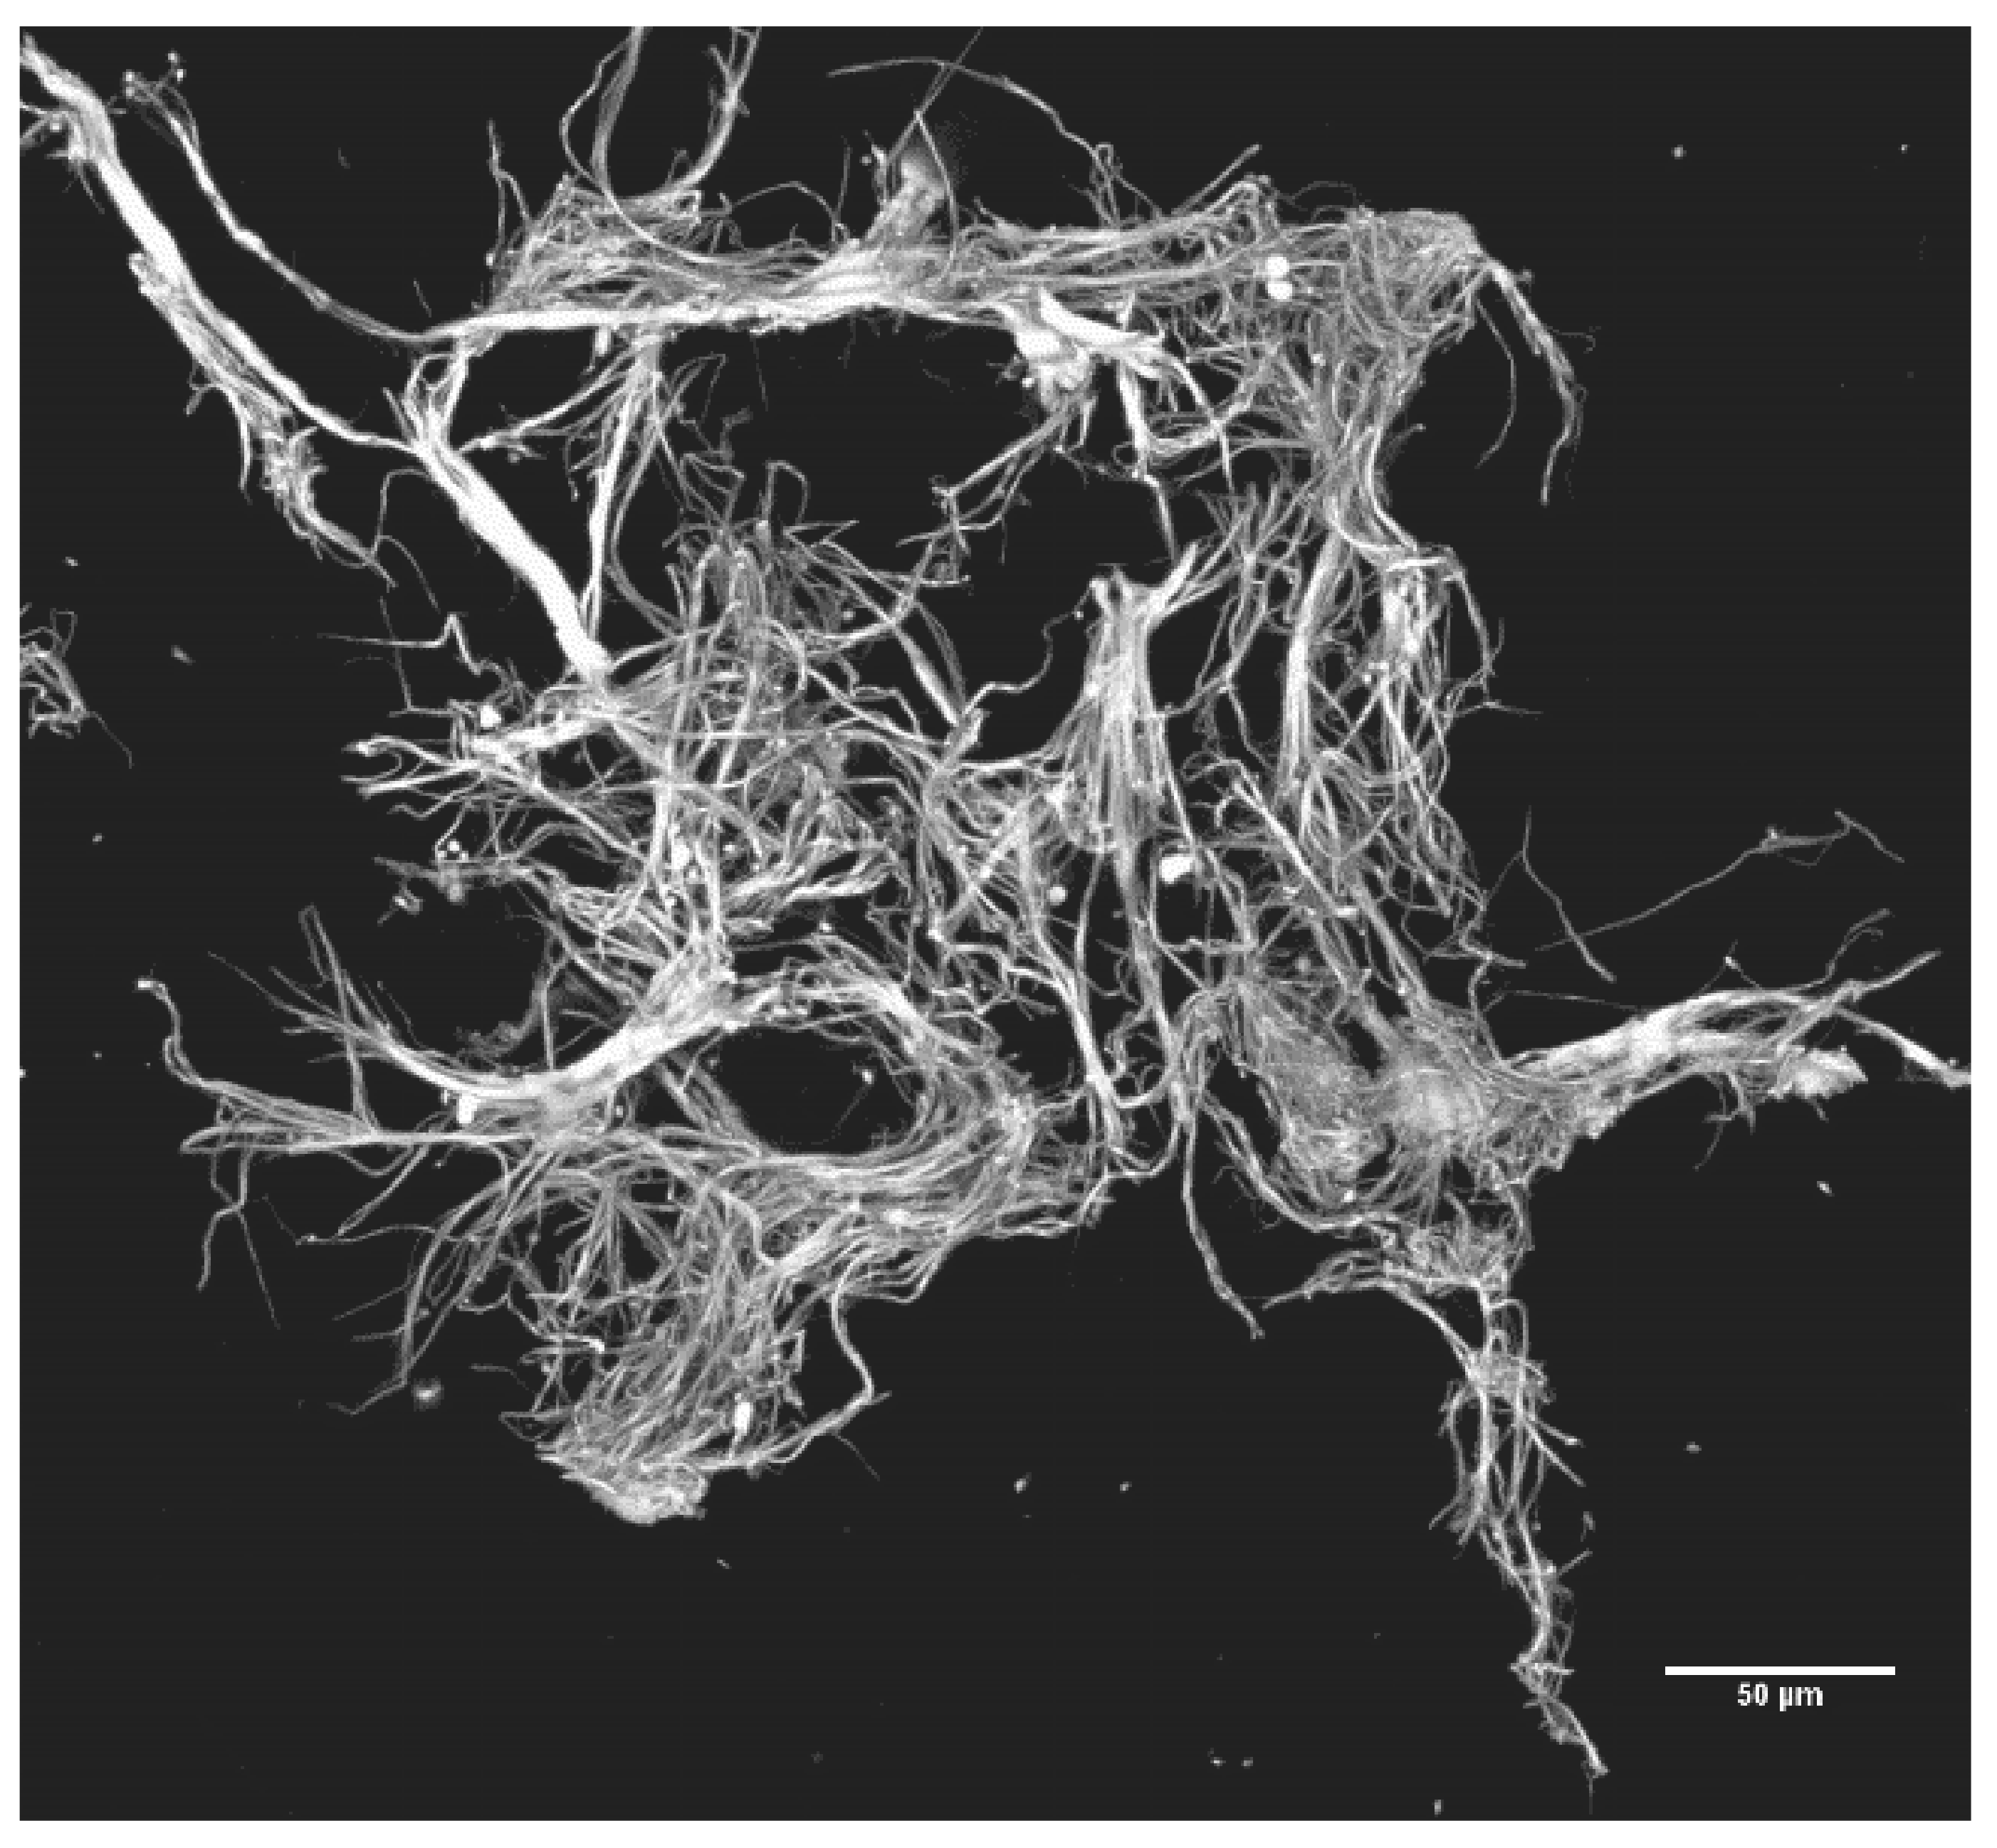
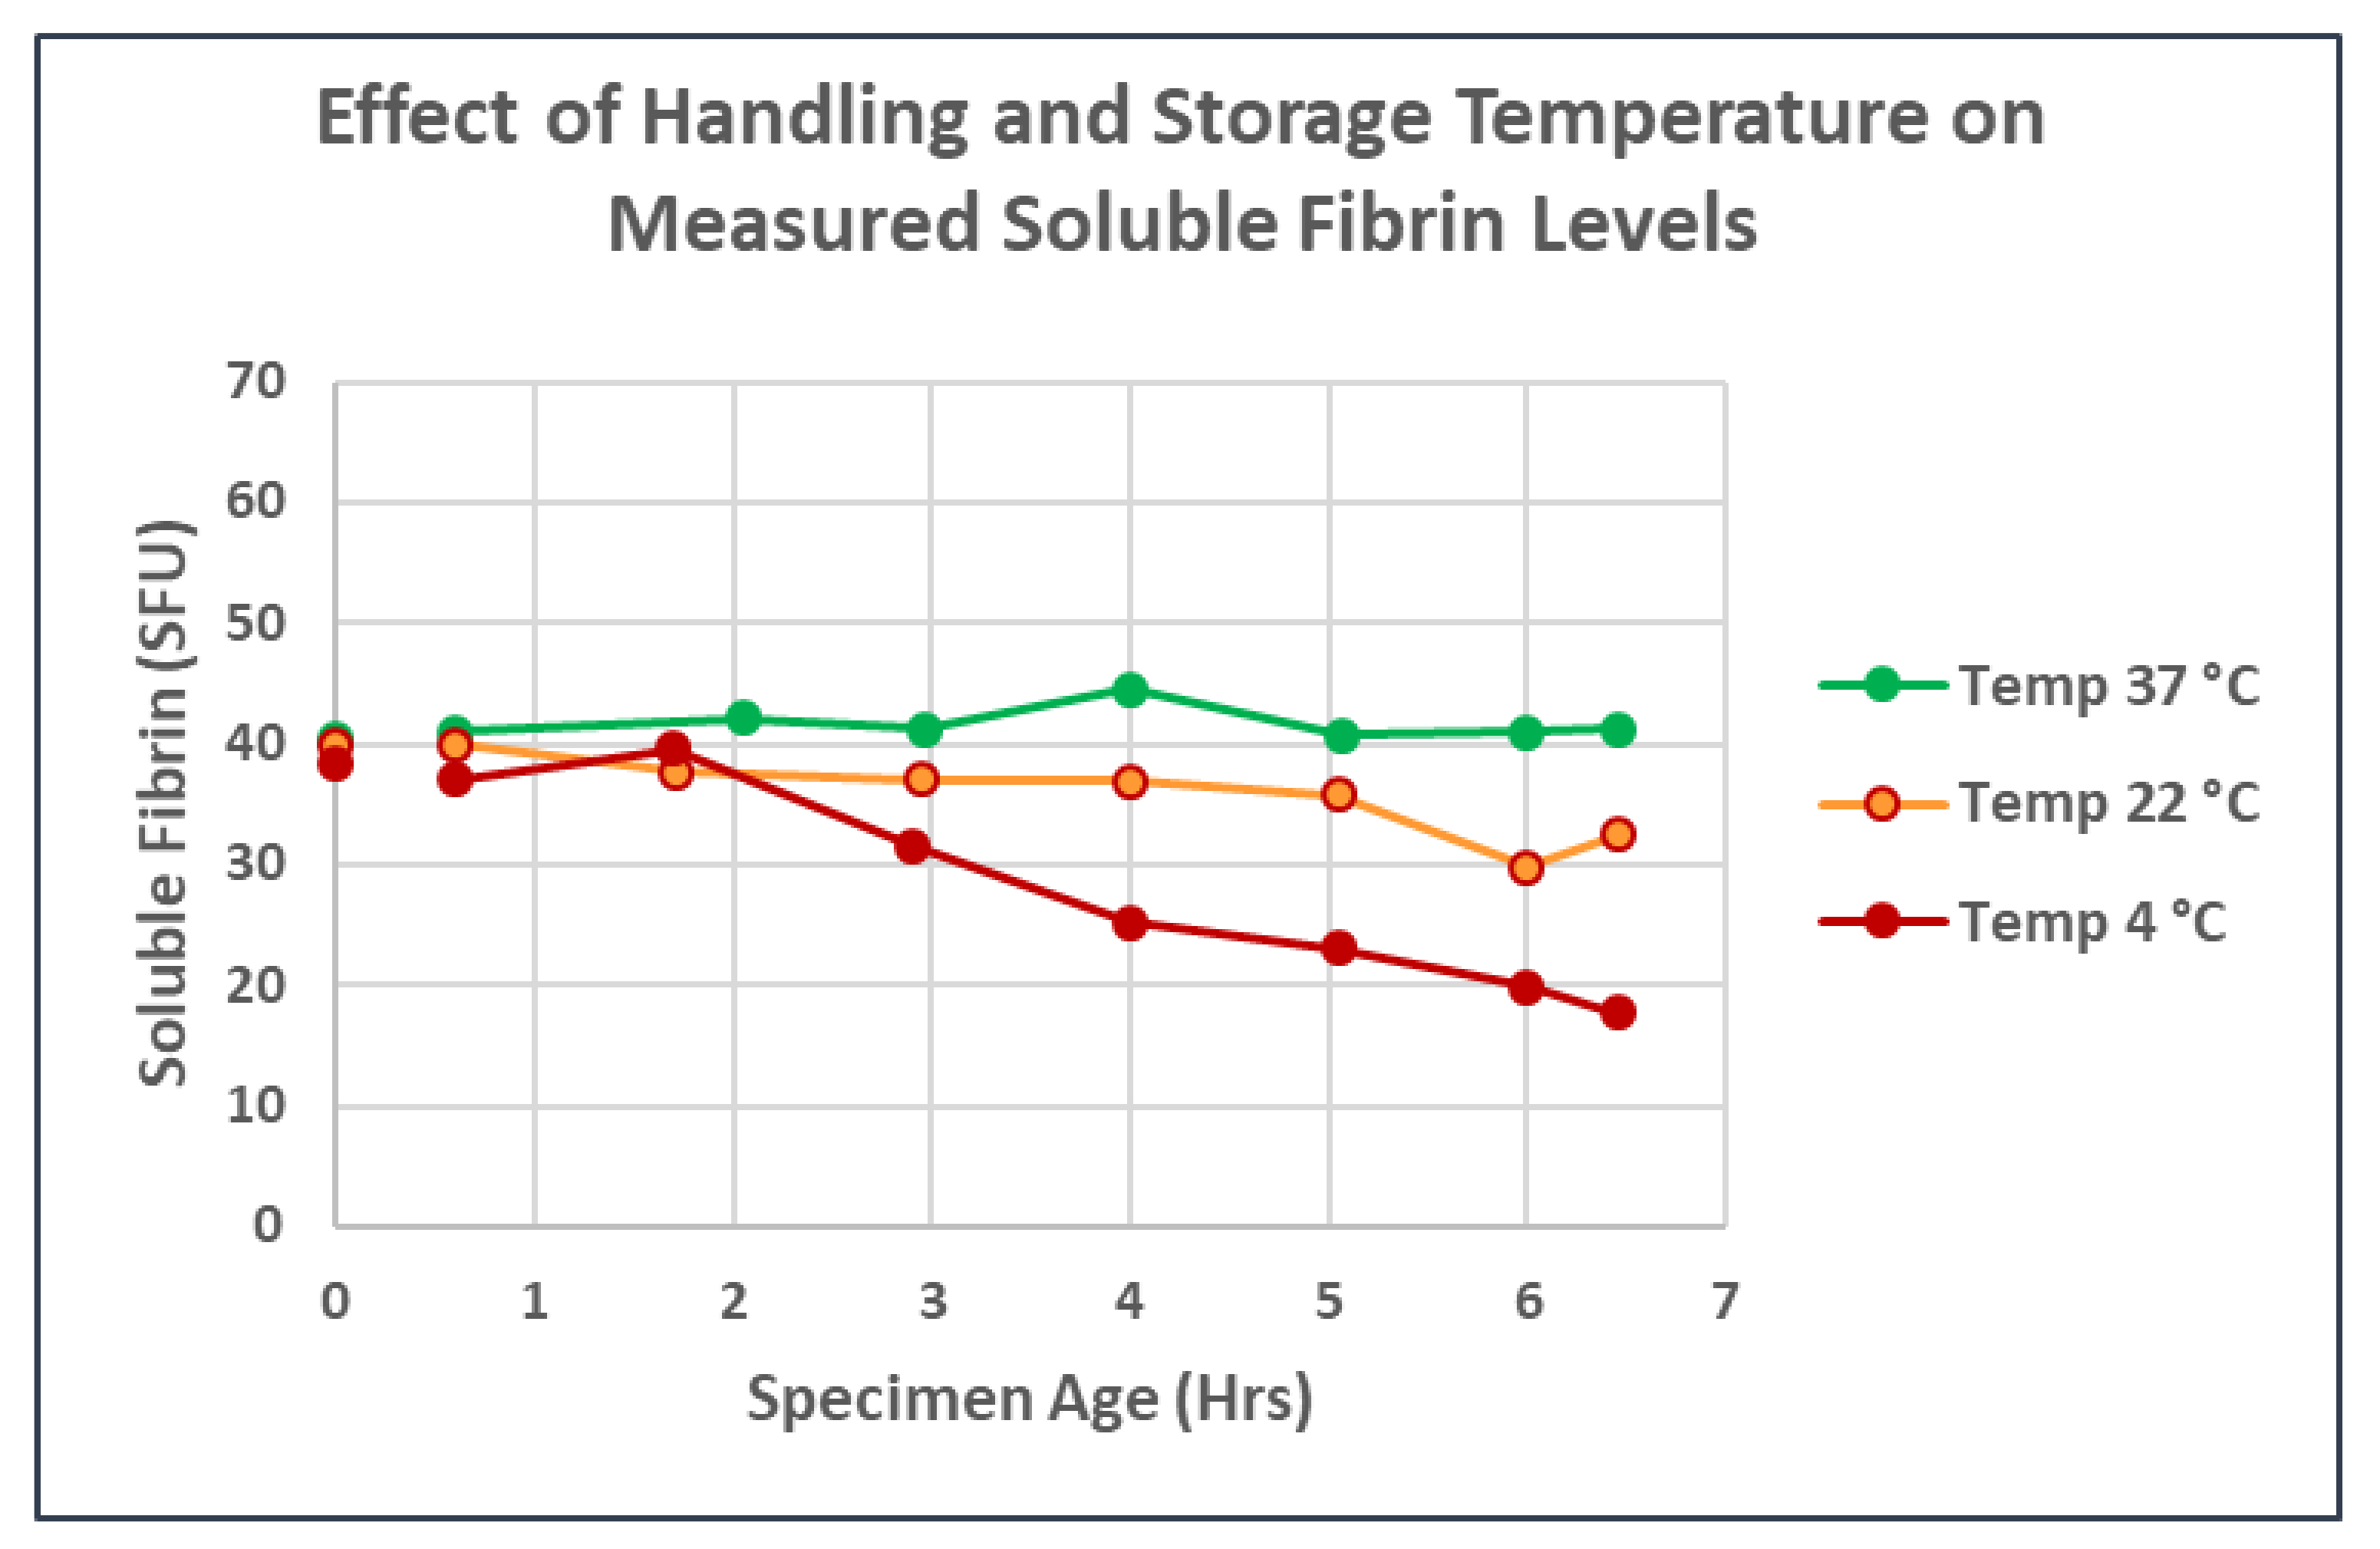
3. Results

4. Conclusions
Author Contributions
Funding
Institutional Review Board Statement
Informed Consent Statement
Data Availability Statement
Acknowledgments
Conflicts of Interest
References
- Wichmann, D.; Sperhake, J.P.; Lutgehetmann, M.; Steurer, S.; Edler, C.; Heinemann, A.; Heinrich, F.; Mushumba, H.; Kniep, I.; Schroder, A.S.; et al. Autopsy Findings and Venous Thromboembolism in Patients with COVID-19: A Prospective Cohort Study. Ann. Intern. Med. 2020, 173, 268–277. [Google Scholar] [CrossRef] [PubMed]
- Asakura, H.; Ogawa, H. COVID-19-associated coagulopathy and disseminated intravascular coagulation. Int. J. Hematol. 2021, 113, 45–57. [Google Scholar] [CrossRef] [PubMed]
- Levi, M.; Thachil, J.; Iba, T.; Levy, J.H. Coagulation abnormalities and thrombosis in patients with COVID-19. Lancet Haematol. 2020, 7, e438–e440. [Google Scholar] [CrossRef]
- Tang, N.; Li, D.; Wang, X.; Sun, Z. Abnormal coagulation parameters are associated with poor prognosis in patients with novel coronavirus pneumonia. J. Thromb. Haemost. 2020, 18, 844–847. [Google Scholar] [CrossRef] [Green Version]
- Bray, M.A.; Sartain, S.E.; Gollamudi, J.; Rumbaut, R.E. Microvascular thrombosis: Experimental and clinical implications. Transl. Res. 2020, 225, 105–130. [Google Scholar] [CrossRef]
- Nahum, J.; Morichau-Beauchant, T.; Daviaud, F.; Echegut, P.; Fichet, J.; Maillet, J.M.; Thierry, S. Venous Thrombosis among Critically Ill Patients with Coronavirus Disease 2019 (COVID-19). JAMA Netw. Open 2020, 3, e2010478. [Google Scholar] [CrossRef]
- Helms, J.; Tacquard, C.; Severac, F.; Leonard-Lorant, I.; Ohana, M.; Delabranche, X.; Merdji, H.; Clere-Jehl, R.; Schenck, M.; Fagot Gandet, F.; et al. High risk of thrombosis in patients with severe SARS-CoV-2 infection: A multicenter prospective cohort study. Intensive Care Med. 2020, 46, 1089–1098. [Google Scholar] [CrossRef]
- Lodigiani, C.; Iapichino, G.; Carenzo, L.; Cecconi, M.; Ferrazzi, P.; Sebastian, T.; Kucher, N.; Studt, J.D.; Sacco, C.; Bertuzzi, A.; et al. Venous and arterial thromboembolic complications in COVID-19 patients admitted to an academic hospital in Milan, Italy. Thromb. Res. 2020, 191, 9–14. [Google Scholar] [CrossRef]
- Bachler, M.; Bosch, J.; Sturzel, D.P.; Hell, T.; Giebl, A.; Strohle, M.; Klein, S.J.; Schafer, V.; Lehner, G.F.; Joannidis, M.; et al. Impaired fibrinolysis in critically ill COVID-19 patients. Br. J. Anaesth. 2021, 126, 590–598. [Google Scholar] [CrossRef]
- Meizoso, J.P.; Moore, H.B.; Moore, E.E. Fibrinolysis Shutdown in COVID-19: Clinical Manifestations, Molecular Mechanisms, and Therapeutic Implications. J. Am. Coll. Surg. 2021, 232, 995–1003. [Google Scholar] [CrossRef]
- Walsh, M.M.; Khan, R.; Kwaan, H.C.; Neal, M.D. Fibrinolysis Shutdown in COVID-19-Associated Coagulopathy: A Crosstalk among Immunity, Coagulation, and Specialists in Medicine and Surgery. J. Am. Coll. Surg. 2021, 232, 1003–1006. [Google Scholar] [CrossRef] [PubMed]
- Creel-Bulos, C.; Auld, S.C.; Caridi-Scheible, M.; Barker, N.A.; Friend, S.; Gaddh, M.; Kempton, C.L.; Maier, C.L.; Nahab, F.; Sniecinski, R. Fibrinolysis Shutdown and Thrombosis in a COVID-19 ICU. Shock 2021, 55, 316–320. [Google Scholar] [CrossRef] [PubMed]
- Hammer, S.; Haberle, H.; Schlensak, C.; Bitzer, M.; Malek, N.P.; Handgretinger, R.; Lang, P.; Horber, S.; Peter, A.; Martus, P.; et al. Severe SARS-CoV-2 Infection Inhibits Fibrinolysis Leading to Changes in Viscoelastic Properties of Blood Clot: A Descriptive Study of Fibrinolysis in COVID-19. Thromb. Haemost. 2021, 121, 1417–1426. [Google Scholar] [CrossRef] [PubMed]
- Laubscher, G.J.; Lourens, P.J.; Venter, C.; Kell, D.B.; Pretorius, E. TEG((R)), Microclot and Platelet Mapping for Guiding Early Management of Severe COVID-19 Coagulopathy. J. Clin. Med. 2021, 10, 5381. [Google Scholar] [CrossRef]
- Iba, T.; Levy, J.H.; Connors, J.M.; Warkentin, T.E.; Thachil, J.; Levi, M. The unique characteristics of COVID-19 coagulopathy. Crit. Care 2020, 24, 360. [Google Scholar] [CrossRef]
- Iba, T.; Warkentin, T.E.; Thachil, J.; Levi, M.; Levy, J.H. Proposal of the Definition for COVID-19-Associated Coagulopathy. J. Clin. Med. 2021, 10, 191. [Google Scholar] [CrossRef]
- Berger, J.S.; Kunichoff, D.; Adhikari, S.; Ahuja, T.; Amoroso, N.; Aphinyanaphongs, Y.; Cao, M.; Goldenberg, R.; Hindenburg, A.; Horowitz, J.; et al. Prevalence and Outcomes of D-Dimer Elevation in Hospitalized Patients with COVID-19. Arter. Thromb. Vasc. Biol. 2020, 40, 2539–2547. [Google Scholar] [CrossRef]
- Gorog, D.A.; Storey, R.F.; Gurbel, P.A.; Tantry, U.S.; Berger, J.S.; Chan, M.Y.; Duerschmied, D.; Smyth, S.S.; Parker, W.A.E.; Ajjan, R.A.; et al. Current and novel biomarkers of thrombotic risk in COVID-19: A Consensus Statement from the International COVID-19 Thrombosis Biomarkers Colloquium. Nat. Rev. Cardiol. 2022, 19, 1–21. [Google Scholar] [CrossRef]
- Adam, S.S.; Key, N.S.; Greenberg, C.S. D-dimer antigen: Current concepts and future prospects. Blood 2009, 113, 2878–2887. [Google Scholar] [CrossRef] [Green Version]
- Vilar, R.; Fish, R.J.; Casini, A.; Neerman-Arbez, M. Fibrin(ogen) in human disease: Both friend and foe. Haematologica 2020, 105, 284–296. [Google Scholar] [CrossRef] [Green Version]
- Simurda, T.; Asselta, R.; Zolkova, J.; Brunclikova, M.; Dobrotova, M.; Kolkova, Z.; Loderer, D.; Skornova, I.; Hudecek, J.; Lasabova, Z.; et al. Congenital Afibrinogenemia and Hypofibrinogenemia: Laboratory and Genetic Testing in Rare Bleeding Disorders with Life-Threatening Clinical Manifestations and Challenging Management. Diagnostics 2021, 11, 2140. [Google Scholar] [CrossRef] [PubMed]
- Sharp, A.A. Pathophysiology of intravascular coagulation and fibrinolysis. J. Clin. Pathol. Suppl. (R. Coll. Pathol.) 1980, 14, 31–34. [Google Scholar] [CrossRef] [Green Version]
- Chernysh, I.N.; Nagaswami, C.; Purohit, P.K.; Weisel, J.W. Fibrin clots are equilibrium polymers that can be remodeled without proteolytic digestion. Sci. Rep. 2012, 2, 879. [Google Scholar] [CrossRef] [Green Version]
- Weisel, J.W.; Litvinov, R.I. Fibrin Formation, Structure and Properties. Subcell. Biochem. 2017, 82, 405–456. [Google Scholar] [CrossRef] [PubMed] [Green Version]
- McDonagh, R.P.; McDonagh, J.; Blomback, B. Isolation and characterization of the S-carboxymethyl derivatives of crosslinked and noncrosslinked human fibrin. Proc. Natl. Acad. Sci. USA 1972, 69, 3648–3652. [Google Scholar] [CrossRef] [Green Version]
- Medved, L.; Tsurupa, G.; Yakovlev, S. Conformational Changes upon Conversion of Fibrinogen into Fibrin. Ann. N. Y. Acad. Sci. 2001, 936, 185–204. [Google Scholar] [CrossRef]
- Simurda, T.; Vilar, R.; Zolkova, J.; Ceznerova, E.; Kolkova, Z.; Loderer, D.; Neerman-Arbez, M.; Casini, A.; Brunclikova, M.; Skornova, I.; et al. A Novel Nonsense Mutation in FGB (c.1421G > A; p.Trp474Ter) in the Beta Chain of Fibrinogen Causing Hypofibrinogenemia with Bleeding Phenotype. Biomedicines 2020, 8, 605. [Google Scholar] [CrossRef]
- Lugovskoy, E.V.; Kolesnikova, I.N.; Gritsenko, P.G.; Zolotareva, E.N.; Gaffney, P.; Nieuwenhuizen, W.; Komisarenko, S.V. A neoantigenic determinant in the D-dimer fragment of fibrin. Thromb. Res. 2002, 107, 151–156. [Google Scholar] [CrossRef]
- Bates, S.M. D-dimer assays in diagnosis and management of thrombotic and bleeding disorders. Semin. Thromb. Hemost. 2012, 38, 673–682. [Google Scholar] [CrossRef] [Green Version]
- Kowalski, E.; Budzynski, A.Z.; Kopec, M.; Latallo, Z.S.; Lipinski, B.; Wegrzynowicz, Z. Studies on the Molecular Pathology and Pathogenesis of Bleeding in Severe Fibrinolytic States in Dogs. Thromb. Diath Haemorrh 1964, 12, 69–86. [Google Scholar] [CrossRef]
- Seaman, A.J. The recognition of intravascular clotting. The plasma protamine paracoagulation test. Arch. Intern. Med. 1970, 125, 1016–1021. [Google Scholar] [CrossRef] [PubMed]
- Hay, K.L.; Bull, B.S. Rapid-SF: A rapid whole-blood screen for soluble fibrin monomer. Thromb. Haemost. 2002, 88, 773–780. [Google Scholar] [CrossRef] [PubMed]
- Draft Guidance for Industry, Food and Drug Administration Staff, and Clinical Laboratories. Available online: https://www.fda.gov/media/89841/download (accessed on 20 February 2022).
- Whitton, C.; Sands, D.; Lee, T.; Chang, A.; Longstaff, C. A reunification of the US ("NIH") and International Unit into a single standard for Thrombin. Thromb. Haemost. 2005, 93, 261–266. [Google Scholar] [CrossRef]
- Bull, B.S.; Hay, K.L. A macrophage attack culminating in microthromboses characterizes COVID 19 pneumonia. Immun. Inflamm. Dis. 2021, 9, 1336–1342. [Google Scholar] [CrossRef]
- Gawaz, A.; Guenova, E. Microvascular Skin Manifestations Caused by COVID-19. Hamostaseologie 2021, 41, 387–396. [Google Scholar] [CrossRef]
- Yilmaz, M.M.; Szabolcs, M.J.; Geskin, L.J.; Niedt, G.W. An Autopsy Review: “COVID Toes”. Am. J. Dermatopathol. 2021, 43, 554–555. [Google Scholar] [CrossRef]
- Do Espirito Santo, D.A.; Lemos, A.C.B.; Miranda, C.H. In vivo demonstration of microvascular thrombosis in severe COVID-19. J. Thromb. Thrombolysis 2020, 50, 790–794. [Google Scholar] [CrossRef]
- Herold, S.; Steinmueller, M.; von Wulffen, W.; Cakarova, L.; Pinto, R.; Pleschka, S.; Mack, M.; Kuziel, W.A.; Corazza, N.; Brunner, T.; et al. Lung epithelial apoptosis in influenza virus pneumonia: The role of macrophage-expressed TNF-related apoptosis-inducing ligand. J. Exp. Med. 2008, 205, 3065–3077. [Google Scholar] [CrossRef]
- D’Antoni, M.L.; Mitchell, B.I.; McCurdy, S.; Byron, M.M.; Ogata-Arakaki, D.; Chow, D.; Mehta, N.N.; Boisvert, W.A.; Lefebvre, E.; Shikuma, C.M.; et al. Cenicriviroc inhibits trans-endothelial passage of monocytes and is associated with impaired E-selectin expression. J. Leukoc. Biol. 2018, 104, 1241–1252. [Google Scholar] [CrossRef]
- Kemme, M.J.; Burggraaf, J.; Schoemaker, R.C.; Kluft, C.; Cohen, A.F. Quantification of heparin-induced TFPI release: A maximum release at low heparin dose. Br. J. Clin. Pharmacol. 2002, 54, 627–634. [Google Scholar] [CrossRef]
- Renne, T.; Schuh, K.; Muller-Esterl, W. Local bradykinin formation is controlled by glycosaminoglycans. J. Immunol. 2005, 175, 3377–3385. [Google Scholar] [CrossRef] [PubMed] [Green Version]


Publisher’s Note: MDPI stays neutral with regard to jurisdictional claims in published maps and institutional affiliations. |
© 2022 by the authors. Licensee MDPI, Basel, Switzerland. This article is an open access article distributed under the terms and conditions of the Creative Commons Attribution (CC BY) license (https://creativecommons.org/licenses/by/4.0/).
Share and Cite
Bull, B.S.; Hay, K.L.; Herrmann, P.C. Fibrin Strands Will Grow from Soluble Fibrin and Hang Up in an In Vitro Microcirculatory Viscoelastic Model: Is This a Major Cause of COVID-19 Associated Coagulopathy? J. Clin. Med. 2022, 11, 2084. https://doi.org/10.3390/jcm11082084
Bull BS, Hay KL, Herrmann PC. Fibrin Strands Will Grow from Soluble Fibrin and Hang Up in an In Vitro Microcirculatory Viscoelastic Model: Is This a Major Cause of COVID-19 Associated Coagulopathy? Journal of Clinical Medicine. 2022; 11(8):2084. https://doi.org/10.3390/jcm11082084
Chicago/Turabian StyleBull, Brian S., Karen L. Hay, and Paul C. Herrmann. 2022. "Fibrin Strands Will Grow from Soluble Fibrin and Hang Up in an In Vitro Microcirculatory Viscoelastic Model: Is This a Major Cause of COVID-19 Associated Coagulopathy?" Journal of Clinical Medicine 11, no. 8: 2084. https://doi.org/10.3390/jcm11082084
APA StyleBull, B. S., Hay, K. L., & Herrmann, P. C. (2022). Fibrin Strands Will Grow from Soluble Fibrin and Hang Up in an In Vitro Microcirculatory Viscoelastic Model: Is This a Major Cause of COVID-19 Associated Coagulopathy? Journal of Clinical Medicine, 11(8), 2084. https://doi.org/10.3390/jcm11082084