Article

The Relevance in the Neutrophil to Lymphocyte Ratio and the SARC-F Score in Gastrointestinal Diseases

1
The Second Department of Internal Medicine, Osaka Medical and Pharmaceutical University, Takatsuki 569-8686, Japan
2
The Premier Departmental Research of Medicine, Osaka Medical and Pharmaceutical University, Takatsuki 569-8686, Japan
*
Author to whom correspondence should be addressed.
J. Clin. Med. 2022, 11(7), 2012; https://doi.org/10.3390/jcm11072012
Submission received: 26 February 2022 / Revised: 28 March 2022 / Accepted: 31 March 2022 / Published: 3 April 2022
(This article belongs to the Section Gastroenterology & Hepatopancreatobiliary Medicine)

Abstract

:
We sought to clarify the relevance in the neutrophil to lymphocyte ratio (NLR) and the SARC-F score in patients with gastrointestinal diseases (G-Ds, n = 672, median age = 73 years). Univariate and multivariate analysis for the SARC-F score were performed. Advanced malignancy was identified in 162 patients (24.1%). The median of NLR for all cases was 2.65. The median of NLR in ECOG-PS 0 (n = 436), 1 (n = 128), 2 (n = 49) and 3 or 4 (n = 59) was 2.26, 2.97, 4.41 and 5.99 (overall p < 0.0001). NLR had a significant correlation with the SARC-F score (r = 0.54, p < 0.0001). The median of NLR in the SARC-F score ≥4 (recommended value for sarcopenia, n = 84) and <4 (n = 588) was 5.87 and 2.48 (p < 0.0001). In all subgroup analyses, similar trends were seen. In the multivariate analysis, ECOG-PS (p < 0.0001) and NLR (p < 0.0001) were independent factors, while age had a trend for significance (p = 0.0686). In conclusion, we would like to emphasize the usefulness of NLR, a simple marker assessed only by blood tests, in predicting the possibility for sarcopenia by the SARC-F in G-Ds.

1. Introduction

Sarcopenia, defined by a decrease in the quantity and quality of skeletal muscle, can be broadly divided into primary sarcopenia, which is associated with aging, and secondary sarcopenia, which is due to malnutrition, physical inactivity, and disease burden itself [1,2,3,4,5,6,7,8,9]. Patients with gastrointestinal diseases (G-Ds) are prone to secondary sarcopenia due to a combination of increased protein catabolism caused by an increased inflammatory response, metabolic abnormalities, and malnutrition caused by poor dietary intake [10,11,12]. On the other hand, SARC-F, which is a screening method on sarcopenia, is a questionnaire with five questions [13,14,15]. Subjects reply to these questions on a scale of 0 to 2, and the total points are assessed (possible range: 0–10 points) [14]. Subjects with a SARC-F score of four points or more are regarded as quite likely being cases of sarcopenia [14]. The higher SARC-F score can be associated with reduced physical function [16,17]. The latest international judging standards on sarcopenia recommend the use of SARC-F as a first screening method on sarcopenia [18,19]. We have reported that elevated SARC-F score can be an adverse predictor in patients with advanced gastrointestinal malignancy [11].
White blood cells are classified into neutrophils, lymphocytes, basophils, eosinophils, and monocytes. Neutrophils and lymphocytes are used not only as indicators of immune function, but also as indicators of inflammation. Neutrophils are mainly involved in acute phase inflammation, while lymphocytes are mainly involved in chronic phase inflammation [20]. The neutrophil to lymphocyte ratio (NLR) has been shown to be a helpful prognostic marker in advanced malignancies, and a recent meta-analysis has reported that elevated NLR is linked to an adverse outcome in numerous solid malignancies [21]. Neutrophils play a significant role in the production of (1) ligands that promote malignant cell proliferation and invasion and (2) cytokines that promote angiogenesis. An increase in neutrophils is therefore closely related to tumor growth and metastasis [22]. On the other hand, lymphocytes are responsible for the immune function of the host, and a decrease in lymphocytes can damage the host’s anti-tumor immunity and worsen the prognosis [23]. Thus, in advanced cancer, NLR reflects the balance between tumor promotion and anti-tumor immune status [24,25].
However, as far as we are aware, there have been no reports regarding the relevance in the NLR and the SARC-F score in patients with G-Ds. We have decided to conduct the current research because we believe that these problems need to be solved.

2. Patients and Methods

2.1. Patients and Our Study

In our department, we have asked each hospitalized patient to respond to the SARC-F questionnaire and to test grip strength (GS) on admission. From October 2020 until November 2021, there were 672 Japanese G-D individuals having both SARC-F score and data for GS in our medical record. Blood test results were the results on admission. First, the relevance in the NLR and baseline features such as ECOG-PS and the SARC-F score was explored. Univariate and multivariate analysis for the SARC-F score were subsequently performed. The analyzed factors in the univariate and multivariate analysis were continuous parameters. We defined advanced cancer as stage III or severer cancer. Decrease in GS was defined as <28 kg (male) and <18 kg (female) as recommended elsewhere [18]. The SARC-F score ≥4 was decided to involve highly possibility for sarcopenia [18]. The relevant ethics committee of our hospital gave an approval of ethics (approval number, 2021-165).

2.2. Statistical Procedure

In analyzing continuous variables, we selected the appropriate method among Student’s t test, Mann–Whitney U test or Pearson correlation coefficient r for comparing 2 groups, and also selected the appropriate method between ANOVA and Kruskal–Wallis test for comparing multiple groups. Variables with statistically significant correlation with the SARC-F score were entered into a multivariate regression analysis by the least square method, and candidate parameters were finally selected. A continuous variable was shown as a median with interquartile range (IQR). A p value of 0.05 was a threshold for significance by the JMP ver. 15 (SAS Institute Inc., Cary, NC, USA).

3. Results

3.1. Patient Baseline Features

Baseline data (at the time of admission) for all analyzed subjects (n = 672, 415 males and 257 females, median (IQR) age = 73 (63–79) years) are summarized in Table 1. The median (IQR) of body mass index (BMI) was 22.0 (19.6–24.4) kg/m2 (missing data, n = 2). ECOG-PS 0 was seen in 436 patients (64.9%), 1 in 128 (19.0%), 2 in 49 (7.3%), 3 in 41 (6.1%) and 4 in 18 (2.7%). Upper gastrointestinal disease (U-G-D) was seen in 161 patients (advanced malignancy, 39 cases (24.2%)), lower gastrointestinal disease (L-G-D) in 178 (advanced malignancy, 30 cases (16.9%)), biliary and pancreatic disease (BP-D) in 236 (advanced malignancy, 65 cases (27.5%)) and liver disease (L-D) in 97 (advanced malignancy, 28 cases (28.9%)). Overall, advanced malignancy was identified in 162 patients (24.1%). Patients with conditions other than advanced cancer included early stage cancer and benign diseases such as benign polyp, biliary tract benign diseases, pancreatitis, inflammatory bowel diseases such as ulcerative colitis, gastrointestinal bleeding lesion, infectious diseases, etc. The median (IQR) of the SARC-F score was 0 (0–2). SARC-F score 0 was seen in 388 cases (57.7%), 1 in 105 (15.6%), 2 in 57 (8.5%), 3 in 38 (5.7%) and ≥4 in 84 (12.5%). The median (IQR) of GS in male and female was 28.9 (23.6–34.2) kg and 17.0 (13.2–20.4) kg. The proportion of decrease in GS in male (<28 kg) and female (<18 kg) was 44.6% (185/415) in male and 56.4% (145/257) in female.

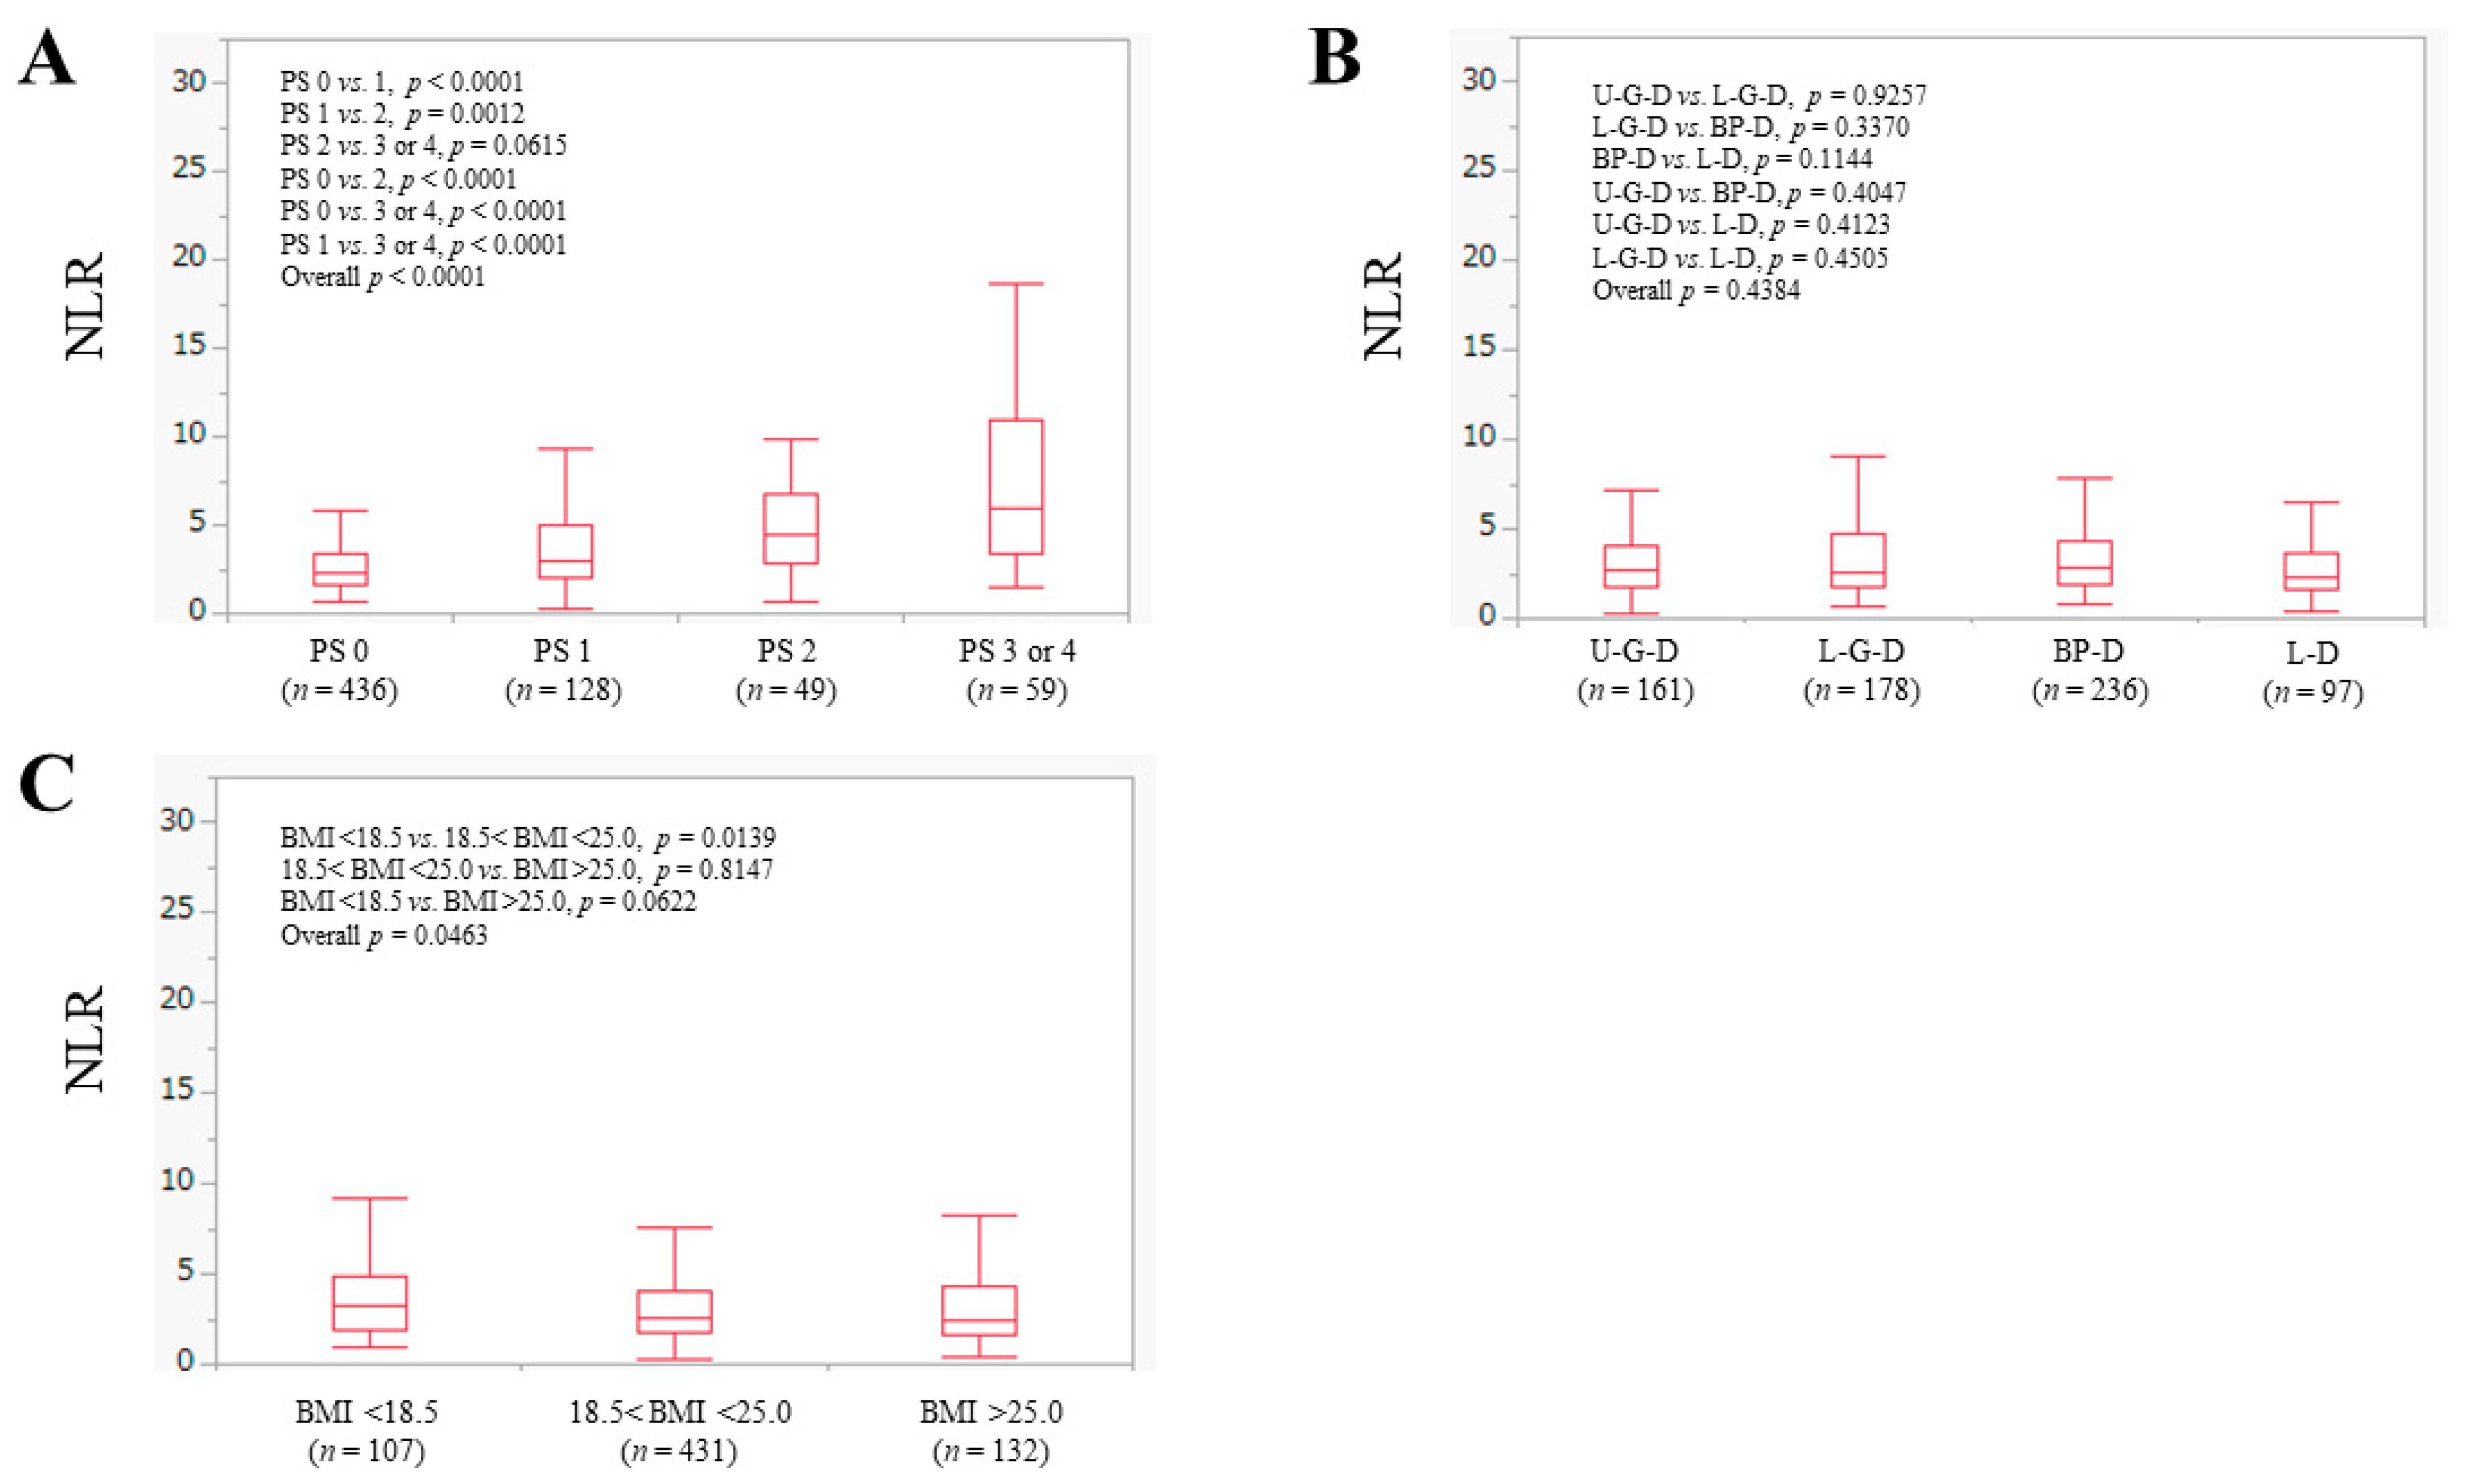
3.2. The NLR according to ECOG-PS, Anatomical Category of Disease and BMI

The median (IQR) of NLR for all cases was 2.65 (1.79–4.31). The median (IQR) of NLR in ECOG-PS 0 (n = 436), 1 (n = 128), 2 (n = 49) and 3 or 4 (n = 59) was 2.26 (1.66–3.36), 2.97 (2.0–4.98), 4.41 (2.85–6.78) and 5.99 (3.33–10.92) (ECOG-PS 0 vs. 1, p < 0.0001; ECOG-PS 1 vs. 2, p = 0.0012; ECOG-PS 2 vs. 3 or 4, p = 0.0615; ECOG-PS 0 vs. 2, p < 0.0001; ECOG-PS 0 vs. 3 or 4, p < 0.0001; ECOG-PS 1 vs. 3 or 4, p < 0.0001; overall p < 0.0001) (Figure 1A).
The median (IQR) of NLR in U-G-D (n = 161), L-G-D (n = 178), BP-D (n = 236) and L-D (n = 97) was 2.65 (1.75–4.0), 2.54 (1.76–4.77), 2.82 (1.93–4.37) and 2.32 (1.66–3.63) (U-G-D vs. L-G-D, p = 0.9257; L-G-D vs. BP-D, p = 0.3370; BP-D vs. L-D, p = 0.1144; U-G-D vs. BP-D, p = 0.4047; U-G-D vs. L-D, p = 0.4123; L-G-D vs. L-D, p = 0.4505; overall p = 0.4384) (Figure 1B).
Our cohort was divided into three categories according to the baseline BMI. The median (IQR) of NLR in patients with BMI < 18.5 kg/m2 (n = 107), 18.5 kg/m2 < BMI < 25 kg/m2 (n = 431) and BMI > 25 kg/m2 (n = 132) was 3.21 (1.96–4.90), 2.59 (1.78–4.09) and 2.48 (1.66–4.38) (BMI < 18.5 kg/m2 vs. 18.5 kg/m2 < BMI < 25 kg/m2, p = 0.0139; 18.5 kg/m2 < BMI < 25 kg/m2 vs. BMI > 25 kg/m2, p = 0.8147; BMI < 18.5 kg/m2 vs. BMI > 25 kg/m2, p = 0.0622; overall p = 0.0463) (Figure 1C).

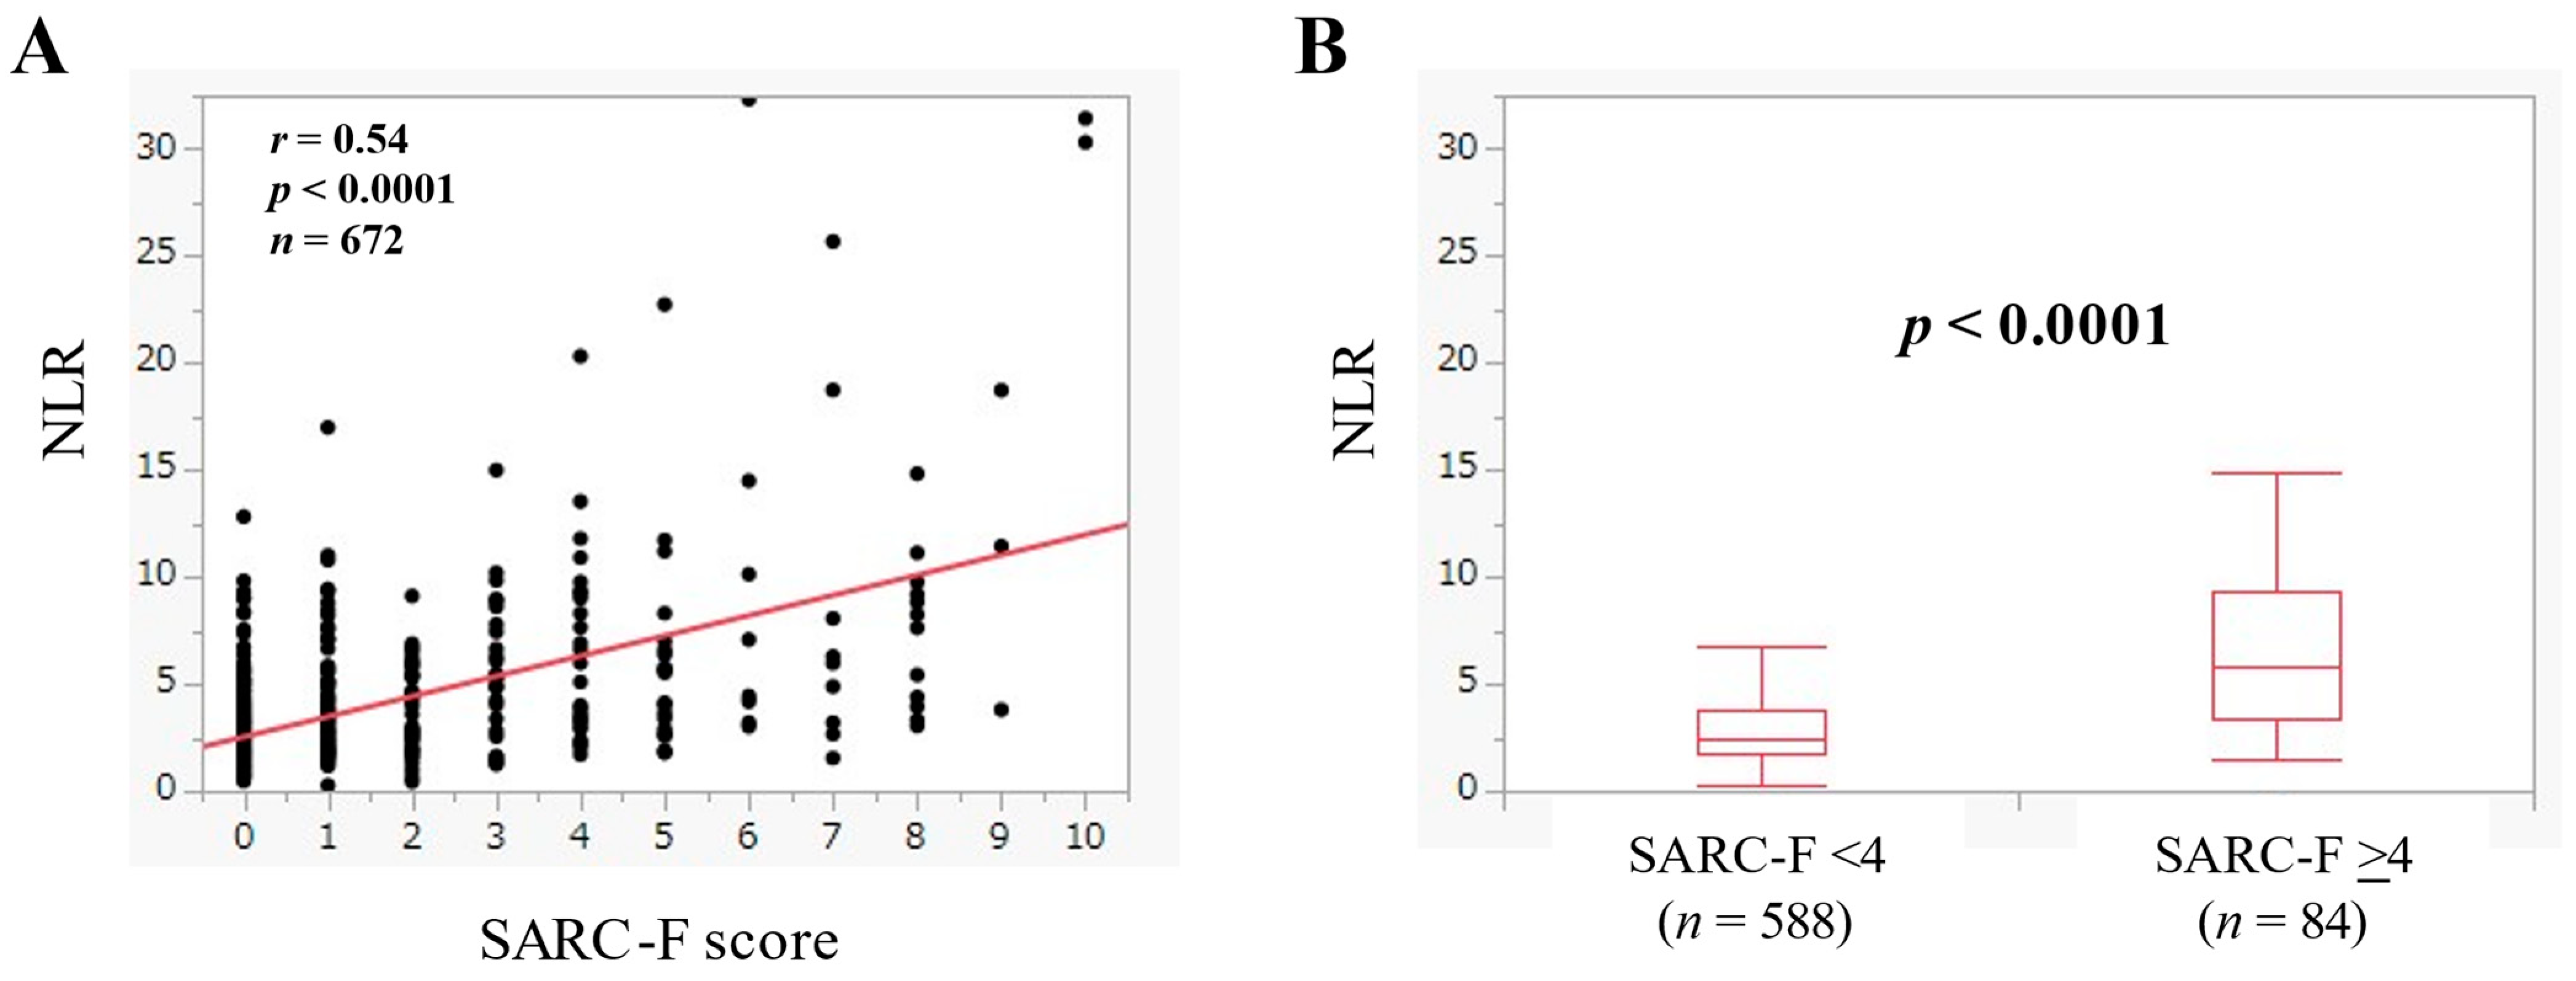
3.3. The Relevance in the NLR and the SARC-F Score

NLR had a significant correlation with the SARC-F score (r = 0.54, p < 0.0001) (Figure 2A). The median (IQR) of NLR in the SARC-F score ≥4 (n = 84) and <4 (n = 588) was 5.87 (3.35–9.41) and 2.48 (1.69–3.73) (p < 0.0001) (Figure 2B).

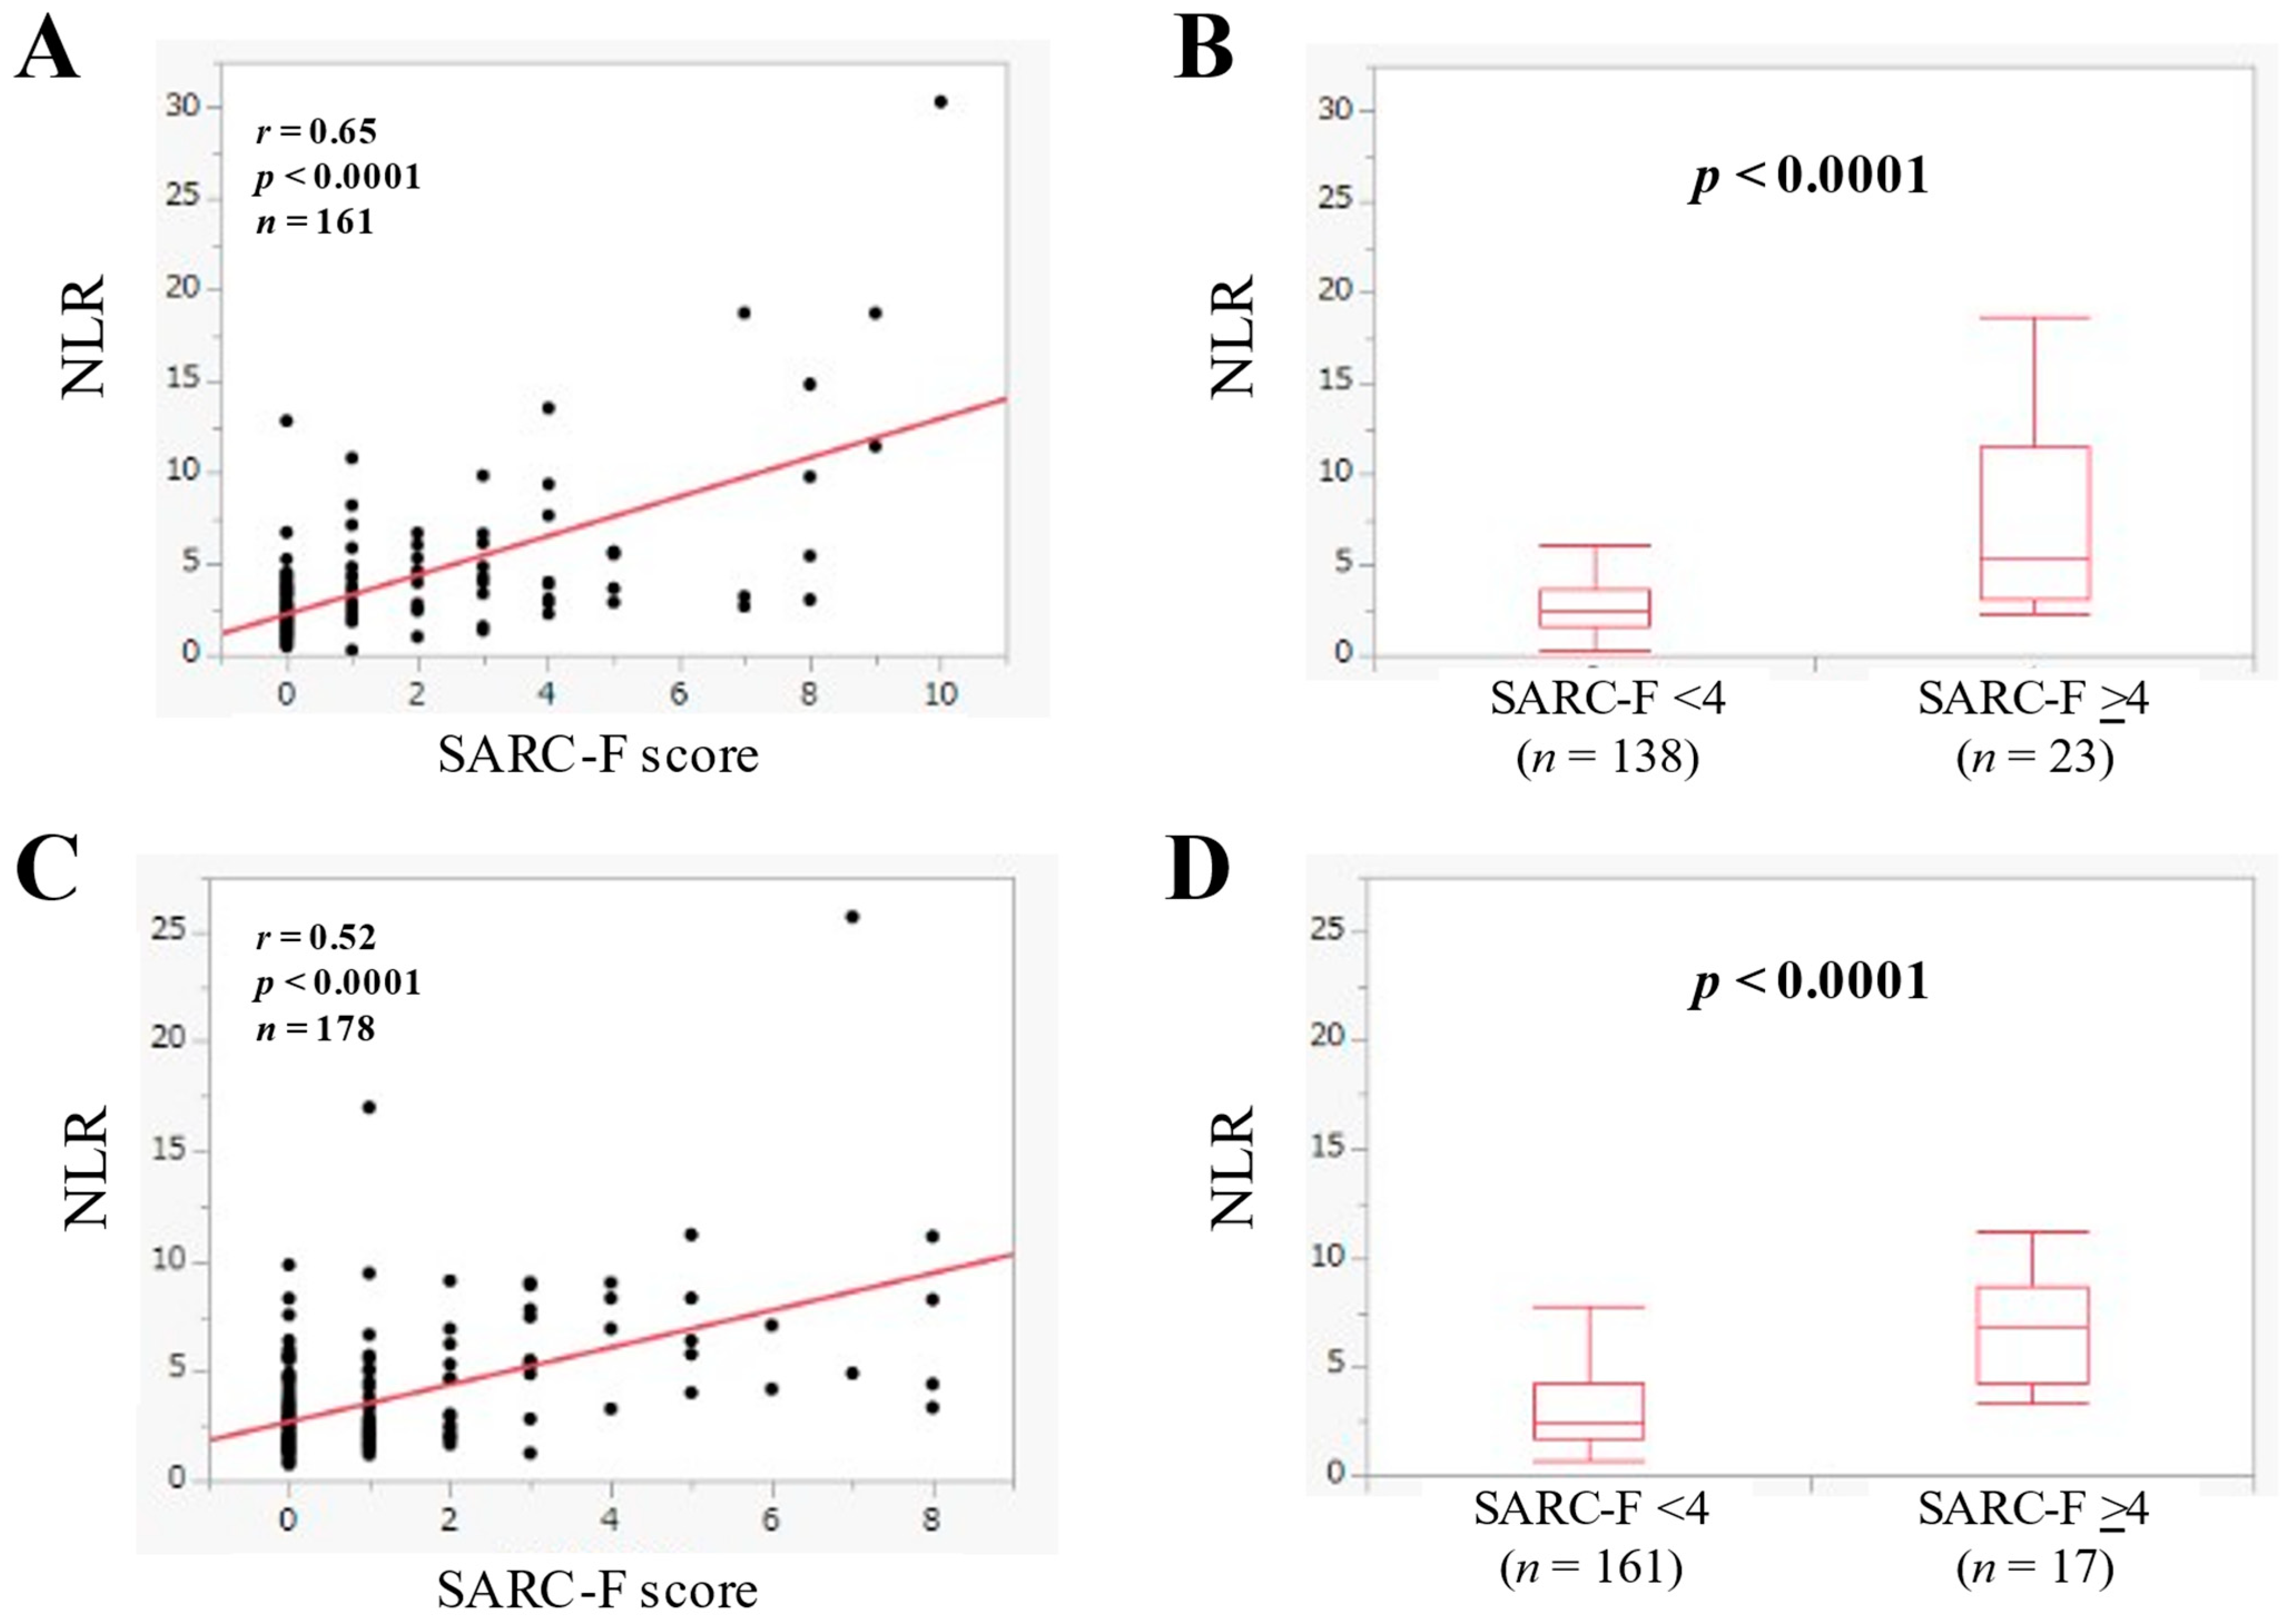
3.4. The Relevance in the NLR and the SARC-F Score according to the Anatomical Category

In U-G-D (n = 161), NLR had a significant correlation with the SARC-F score (r = 0.65, p < 0.0001). (Figure 3A) In U-G-D, the median (IQR) of NLR in the SARC-F score ≥4 (n = 23) and <4 (n = 138) was 5.43 (3.07–11.44) and 2.42 (1.63–3.64) (p < 0.0001) (Figure 3B).
In L-G-D (n = 178), NLR had a significant correlation with the SARC-F score (r = 0.52, p < 0.0001) (Figure 3C). In L-G-D, the median (IQR) of NLR in the SARC-F score ≥4 (n = 17) and <4 (n = 161) was 6.91 (4.29–8.67) and 2.40 (1.69–4.26) (p < 0.0001) (Figure 3D).
In BP-D (n = 236), NLR had a significant correlation with the SARC-F score (r = 0.52, p < 0.0001) (Figure 4A). In BP-D, the median (IQR) of NLR in the SARC-F score ≥4 (n = 27) and <4 (n = 209) was 7.0 (3.81–10.13) and 2.65 (1.84–4.01) (p < 0.0001) (Figure 4B).
In L-D (n = 97), NLR had a significant correlation with the SARC-F score (r = 0.45, p < 0.0001) (Figure 4C). In L-D, the median (IQR) of NLR in the SARC-F score ≥4 (n = 17) and <4 (n = 80) was 3.41 (2.40–7.91) and 2.09 (1.51–3.45) (p = 0.0016) (Figure 4D).

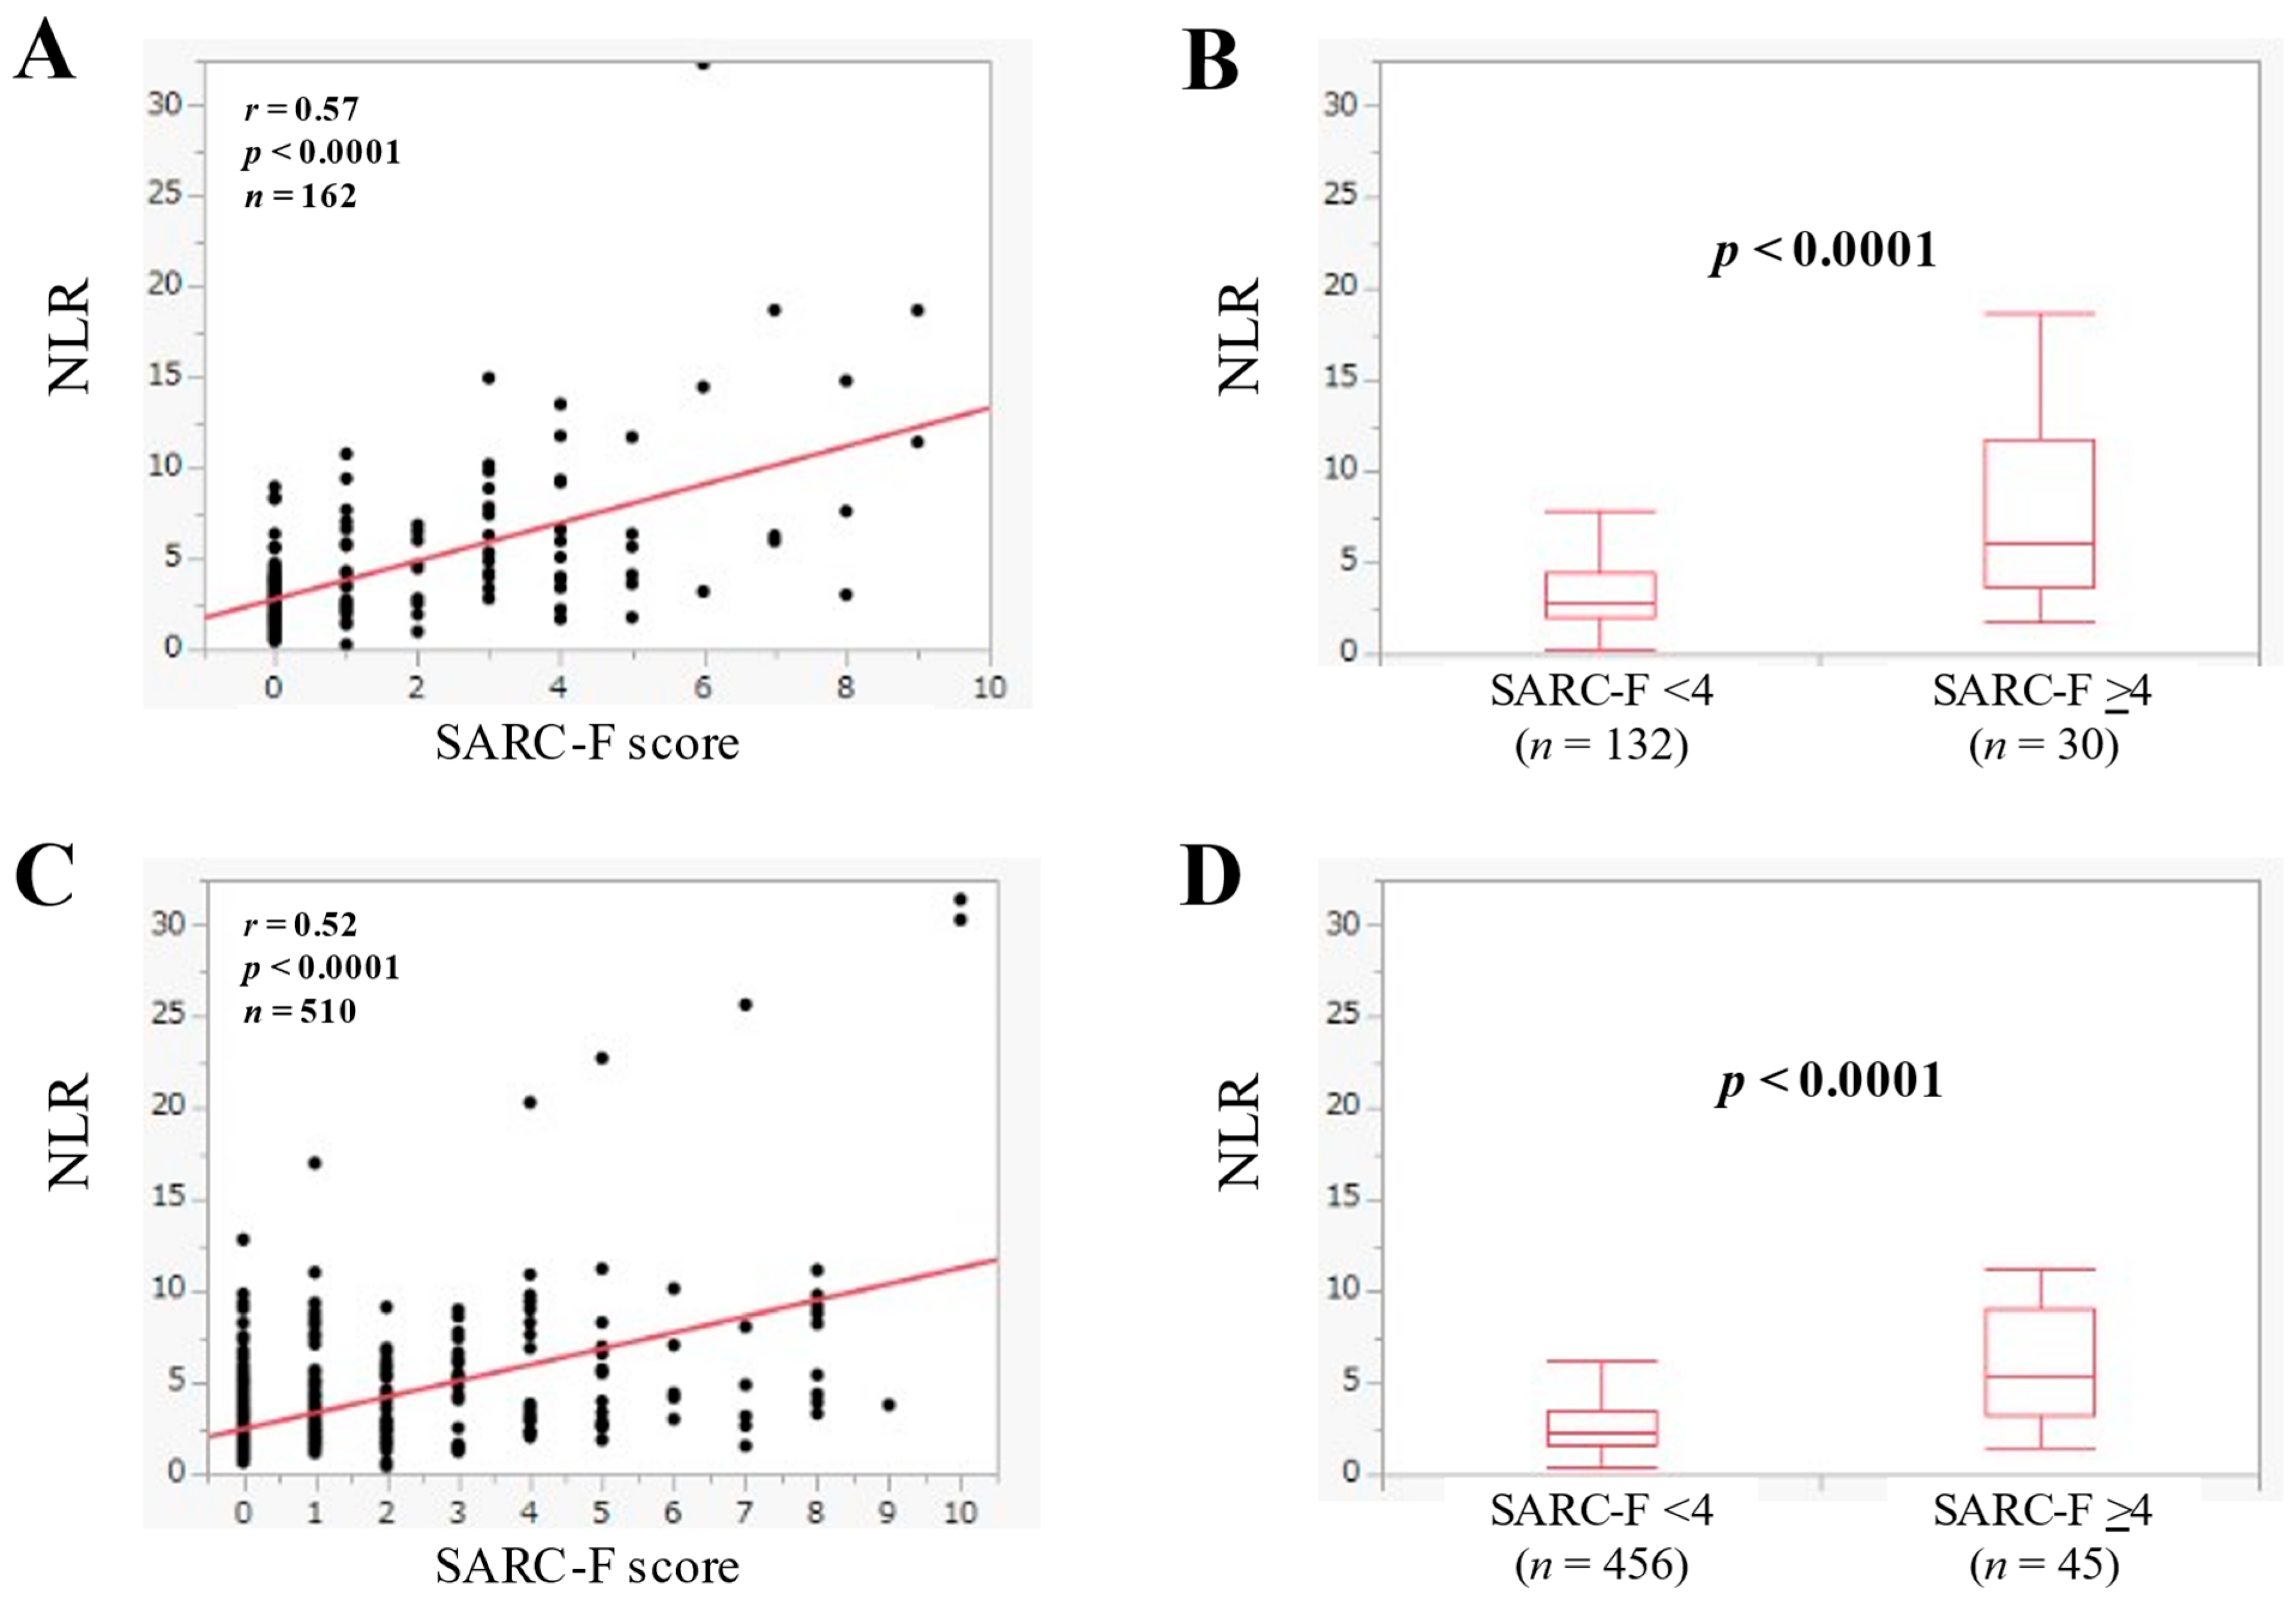
3.5. The Relevance in the NLR and the SARC-F Score in Patients with Advanced Cancer

The median (IQR) of NLR in advanced cancer (n = 162) was 3.33 (2.25–5.69), and NLR was significantly correlated with the SARC-F score (r = 0.57, p < 0.0001) (Figure 5A). In advanced cancer, the median (IQR) of NLR in the SARC-F score ≥4 (n = 30) and <4 (n = 132) was 6.14 (3.60–11.75) and 2.91 (2.04–4.43) (p < 0.0001) (Figure 5B).

3.6. The Relevance in the NLR and the SARC-F Score in Patients without Advanced Cancer

The median (IQR) of NLR in patients without advanced cancer (n = 510) was 2.49 (1.71–4.0), and NLR significantly had a significant correlation the SARC-F score (r = 0.52, p < 0.0001) (Figure 5C). In patients without advanced cancer, the median (IQR) of NLR in the SARC-F score ≥4 (n = 54) and <4 (n = 456) was 5.48 (3.26–9.07) and 2.32 (1.66–3.51) (p < 0.0001) (Figure 5D).

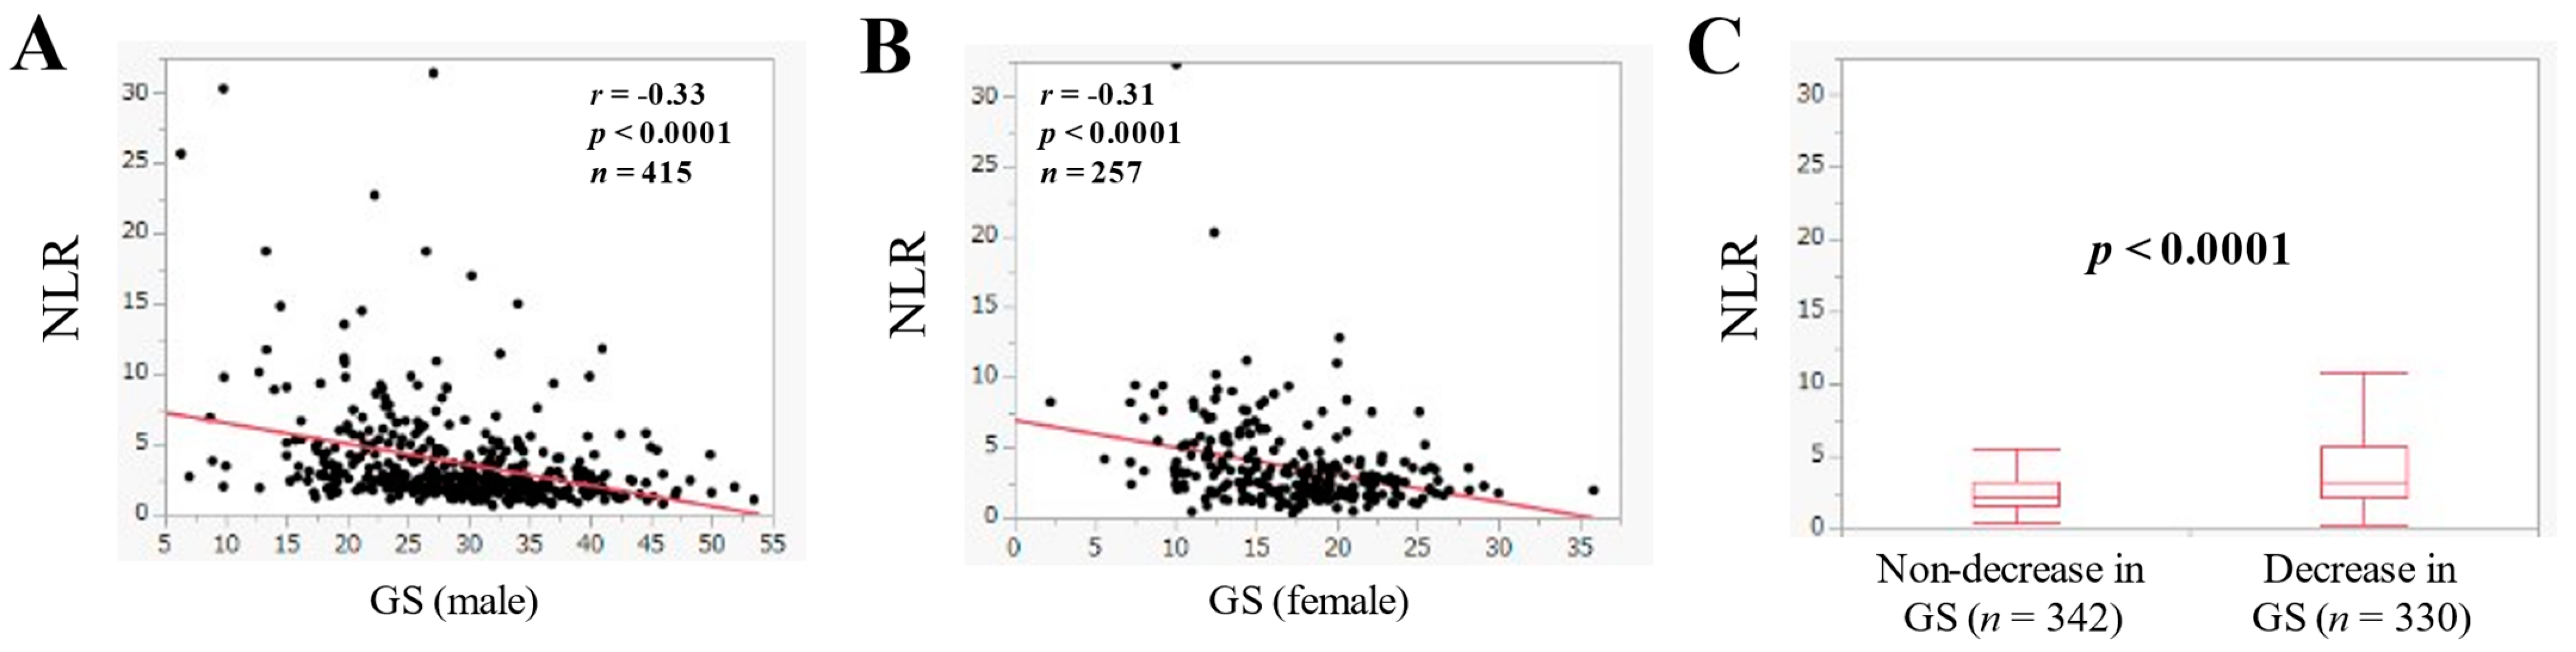
3.7. The Relevance in the NLR and GS

In males, NLR was significantly correlated with GS (r = −0.33, p < 0.0001) (Figure 6A). Likewise, in females, NLR was significantly correlated with GS (r = −0.31, p < 0.0001) (Figure 6B). NLR in patients with decrease in GS (n = 330, median (IQR) = 3.31 (2.23–5.69)) was significantly higher than that without decrease in GS (n = 342, median (IQR) = 2.14 (1.58–3.21) (p < 0.0001) (Figure 6C).

3.8. Univariate and Multivariate Analysis of Factors Linking to the SARC-F Score

In the univariate analysis of factors linking to the SARC-F score, age, ECOG-PS, hemoglobin, serum albumin, NLR, C reactive protein (CRP) and estimated glomerular filtration rate were significant factors (Table 2). In the multiple regression analysis (multivariate analysis), ECOG-PS and NLR were independent factors linking to the SARC-F score, while age had a trend for significance (p = 0.0686) (Table 3).

4. Discussion

Sarcopenia is at the central part of physical frailty, and frailty control is one of the health measure projects promoted by the Ministry of Health, Labor and Welfare in Japan [5]. The number of published papers on sarcopenia research has been also rapidly increasing worldwide [5]. In recent years, the Asian and European sarcopenia assessment criteria have been revised one after another, and the use of the SARC-F (i.e., screening method) has been recommended in the revised guidelines [18,19]. On the other hand, the close relevance in the NLR and prognosis has been reported in various malignancies in recent years. Although the mechanism is still unclear, it has been implied that the cancer-associated inflammatory microenvironment is involved in the process of cancer progression. Neutrophils are involved in tumor promotion, while lymphocytes play a role in anti-tumor immunity. Therefore, elevated NLR may reflect tumor growth and progression, and may be a predictive marker of poor prognosis [26]. NLR is attracting attention as one of the most sensitive indicators of inflammatory status not only in the field of oncology, but also in the fields of cardiovascular disease, diabetes, and infectious diseases [27,28,29]. Recently, the usefulness of NLR in assessing the severity of COVID-19 infection and determining treatment response has also been reported [30,31,32,33]. NLR is inexpensive to measure, can be measured at any facility, and can be measured frequently in daily practice, making it more valuable and clinically applicable than existing markers that are complicated to measure. However, reports on the relevance in the NLR and SARC-F in patients with G-Ds are scarce. Therefore, the results of this study, which analyzed a large number of cases (n = 672), are significant and worth reporting.
The mean value of NLR in healthy subjects has been reported to be 1.65 [34], and our median NLR in the present study was 2.65. In patients with G-Ds, NLR may be elevated due to increased inflammation and decreased immune status. The present study showed a good correlation between the NLR and the SARC-F score in the overall cases and all subgroups, and the relationship between GS and the NLR was similar. These results suggest that NLR can be a marker that well reflects the severity of sarcopenia. Although CRP is a marker of acute inflammation, it was not a significant factor in the multivariate analysis. While NLR is a complex marker of inflammatory and immune status, and the difference in the nature of CRP and NLR as inflammatory markers may have affected the present results. NLR has been reported to be unaffected by cytokines that affect CRP [35]. ECOG-PS was extracted as an independent factor, and a significant positive correlation was seen in ECOG-PS and the NLR (r = 0.48, p < 0.0001). As mentioned earlier, the NLR is easy to measure and correlates well with the SARC-F score and ECOG-PS, so this marker appears to be useful in the daily clinical practice. It is worth mentioning that the strong correlation between ECOG-PS and the SARC-F score (r = 0.79) was found, although it is a little beyond the purpose of this study. The NLR has been reported to be elevated mainly in advanced cancers, and in this study, the median of NLR in advanced cancer cases and non-advanced cancer cases was 3.33 and 2.49 (p < 0.0001), which is consistent with previous reports [21]. The group with BMI < 18.5 kg/m2 showed a tendency to have higher NLR. The median BMI of patients with advanced and non-advanced cancer (21.3 kg/m2 vs. 22.2 kg/m2, p = 0.0160) may also have influenced the current results. Age showed a significant trend in the multivariate analysis. It can be inferred that the development of sarcopenia in G-Ds is a complex interplay of aging and disease pathogenesis. It may also be necessary to evaluate whether primary or secondary factors are more strongly involved in sarcopenia in G-Ds [6].
It is necessary to point out several limitations of this study besides the fact that this study was a single-center and retrospective observational study. Firstly, as data for skeletal muscle mass in our cohort were missing, it is possible that we were missing cases of sarcopenia that are included among cases with a SARC-F score of less than 4. Secondly, the present cohort included a lot of types of G-Ds. Thirdly, in this study, data at the time of admissions were used, which may lead to bias, especially in patients with infectious diseases where data fluctuate widely. Therefore, meticulous care should be paid on interpreting the study results. Nevertheless, our study results implied that NLR in patients with G-Ds well correlates with the SARC-F score. Finally, we would like to emphasize the usefulness of NLR, a simple marker that can be assessed only by blood tests, in predicting the possibility for sarcopenia by the SARC-F in patients with G-Ds.

Author Contributions

Data curation, E.Y., H.N., M.M., A.A., K.U., T.O., T.T., S.N., K.K., T.M., S.F., H.O., K.Y. and H.Y.; formal analysis, E.Y. and H.N.; supervision, M.G. and K.H.; writing—original draft, E.Y. and H.N.; writing—review and editing, H.N. All authors have read and agreed to the published version of the manuscript.

Funding

This research received no external funding.

Institutional Review Board Statement

The study was conducted in accordance with the Declaration of Helsinki, and approved by the Institutional Review Board (or Ethics Committee) of Osaka medical and pharmaceutical university (Approval number, 2021-165: date of approval, 15 January 2022).

Informed Consent Statement

Patient consent was waived due to the retrospective study design.

Data Availability Statement

The data are not publicly available due to personal information of our study cohort.

Acknowledgments

We would like to thank the medical staff of the department for their cooperation in the clinical data collection.

Conflicts of Interest

The authors declare no conflict of interest.

Abbreviation

G-D, gastrointestinal disease; NLR, neutrophil to lymphocyte ratio; GS, grip strength; IQR, interquartile range; BMI, body mass index; U-G-D, upper gastrointestinal disease; L-G-D, lower gastrointestinal disease; BP-D, biliary and pancreatic disease; L-D, liver disease; CRP, C reactive protein.

References

  1. Dunne, R.F.; Loh, K.P.; Williams, G.R.; Jatoi, A.; Mustian, K.M.; Mohile, S.G. Cachexia and Sarcopenia in Older Adults with Cancer: A Comprehensive Review. Cancers 2019, 11, 1861. [Google Scholar] [CrossRef] [PubMed] [Green Version]
  2. Chhetri, J.K.; de Souto Barreto, P.; Fougère, B.; Rolland, Y.; Vellas, B.; Cesari, M. Chronic inflammation and sarcopenia: A regenerative cell therapy perspective. Exp. Gerontol. 2018, 103, 115–123. [Google Scholar] [CrossRef] [PubMed]
  3. Ganapathy, A.; Nieves, J.W. Nutrition and Sarcopenia—What Do We Know? Nutrients 2020, 12, 1755. [Google Scholar] [CrossRef] [PubMed]
  4. Sieber, C.C. Malnutrition and sarcopenia. Aging Clin. Exp. Res. 2019, 31, 793–798. [Google Scholar] [CrossRef]
  5. Nishikawa, H.; Fukunishi, S.; Asai, A.; Yokohama, K.; Nishiguchi, S.; Higuchi, K. Pathophysiology and mechanisms of primary sarcopenia (Review). Int. J. Mol. Med. 2021, 48, 156. [Google Scholar] [CrossRef]
  6. Nishikawa, H.; Shiraki, M.; Hiramatsu, A.; Moriya, K.; Hino, K.; Nishiguchi, S. Japan Society of Hepatology guidelines for sarcopenia in liver disease (1st edition): Recommendation from the working group for creation of sarcopenia assessment criteria. Hepatol. Res. 2016, 46, 951–963. [Google Scholar] [CrossRef]
  7. Balestrieri, P.; Ribolsi, M.; Guarino, M.P.L.; Emerenziani, S.; Altomare, A.; Cicala, M. Nutritional Aspects in Inflammatory Bowel Diseases. Nutrients 2020, 12, 372. [Google Scholar] [CrossRef] [PubMed] [Green Version]
  8. Shaw, C. Management of diet in gastrointestinal cancer. Proc. Nutr. Soc. 2021, 80, 65–72. [Google Scholar] [CrossRef] [PubMed]
  9. Wang, H.; Yang, R.; Xu, J.; Fang, K.; Abdelrahim, M.; Chang, L. Sarcopenia as a predictor of postoperative risk of complications, mortality and length of stay following gastrointestinal oncological surgery. Ann. R. Coll. Surg. Engl. 2021, 103, 630–637. [Google Scholar] [CrossRef] [PubMed]
  10. Meyer, F.; Valentini, L. Disease-Related Malnutrition and Sarcopenia as Determinants of Clinical Outcome. Visc. Med. 2019, 35, 282–291. [Google Scholar] [CrossRef] [PubMed]
  11. Matsui, M.; Nishikawa, H.; Goto, M.; Asai, A.; Ushiro, K.; Ogura, T.; Takeuchi, T.; Nakamura, S.; Kakimoto, K.; Miyazaki, T.; et al. Prognostic Impact of the SARC-F Score in Gastrointestinal Advanced Cancers. Cancers 2021, 14, 10. [Google Scholar] [CrossRef] [PubMed]
  12. Ikegami, T.; Nishikawa, H.; Goto, M.; Matsui, M.; Asai, A.; Ushiro, K.; Ogura, T.; Takeuchi, T.; Nakamura, S.; Kakimoto, K.; et al. The Relationship between the SARC-F Score and the Controlling Nutritional Status Score in Gastrointestinal Diseases. J Clin Med. 2022, 11, 582. [Google Scholar] [CrossRef]
  13. Vellas, B.; Pahor, M.; Manini, T.; Rooks, D.; Guralnik, J.M.; Morley, J.; Studenski, S.; Evans, W.; Asbrand, C.; Fariello, R.; et al. Designing pharmaceutical trials for sarcopenia in frail older adults: EU/US Task Force recommendations. J. Nutr. Health Aging 2013, 17, 612–618. [Google Scholar] [CrossRef] [Green Version]
  14. Malmstrom, T.K.; Miller, D.K.; Simonsick, E.M.; Ferrucci, L.; Morley, J.E. SARC-F: A symptom score to predict persons with sarcopenia at risk for poor functional outcomes. J. Cachexia Sarcopenia Muscle 2016, 7, 28–36. [Google Scholar] [CrossRef] [PubMed]
  15. Ida, S.; Kaneko, R.; Murata, K. SARC-F for Screening of Sarcopenia among Older Adults: A Meta-analysis of Screening Test Accuracy. J. Am. Med. Dir. Assoc. 2018, 19, 685–689. [Google Scholar] [CrossRef] [PubMed]
  16. Kim, S.; Kim, M.; Won, C.W. Validation of the Korean Version of the SARC-F Questionnaire to Assess Sarcopenia: Korean Frailty and Aging Cohort Study. J. Am. Med. Dir. Assoc. 2018, 19, 40–45.e41. [Google Scholar] [CrossRef]
  17. Tanaka, S.; Kamiya, K.; Hamazaki, N.; Matsuzawa, R.; Nozaki, K.; Maekawa, E.; Noda, C.; Yamaoka-Tojo, M.; Matsunaga, A.; Masuda, T.; et al. Utility of SARC-F for Assessing Physical Function in Elderly Patients With Cardiovascular Disease. J. Am. Med. Dir. Assoc. 2017, 18, 176–181. [Google Scholar] [CrossRef]
  18. Chen, L.K.; Woo, J.; Assantachai, P.; Auyeung, T.W.; Chou, M.Y.; Iijima, K.; Jang, H.C.; Kang, L.; Kim, M.; Kim, S.; et al. Asian Working Group for Sarcopenia: 2019 Consensus Update on Sarcopenia Diagnosis and Treatment. J. Am. Med. Dir. Assoc. 2020, 21, 300–307.e2. [Google Scholar] [CrossRef]
  19. Cruz-Jentoft, A.J.; Bahat, G.; Bauer, J.; Boirie, Y.; Bruyère, O.; Cederholm, T.; Cooper, C.; Landi, F.; Rolland, Y.; Sayer, A.A.; et al. Writing Group for the European Working Group on Sarcopenia in Older People 2 (EWGSOP2), and the Extended Group for EWGSOP2. Sarcopenia: Revised European consensus on definition and diagnosis. Age Ageing 2019, 48, 16–31. [Google Scholar] [CrossRef] [Green Version]
  20. Jackaman, C.; Tomay, F.; Duong, L.; Abdol Razak, N.B.; Pixley, F.J.; Metharom, P.; Nelson, D.J. Aging and cancer: The role of macrophages and neutrophils. Ageing Res. Rev. 2017, 36, 105–116. [Google Scholar] [CrossRef] [PubMed]
  21. Templeton, A.J.; McNamara, M.G.; Šeruga, B.; Vera-Badillo, F.E.; Aneja, P.; Ocaña, A.; Leibowitz-Amit, R.; Sonpavde, G.; Knox, J.J.; Tran, B.; et al. Prognostic role of neutrophil-to-lymphocyte ratio in solid tumors: A systematic review and meta-analysis. J. Natl. Cancer Inst. 2014, 106, dju124. [Google Scholar] [CrossRef] [PubMed] [Green Version]
  22. Terzić, J.; Grivennikov, S.; Karin, E.; Karin, M. Inflammation and colon cancer. Gastroenterology 2010, 138, 2101–2114. [Google Scholar] [CrossRef] [PubMed]
  23. Lin, E.Y.; Pollard, J.W. Role of infiltrated leucocytes in tumour growth and spread. Br. J. Cancer 2004, 90, 2053–2058. [Google Scholar] [CrossRef] [PubMed] [Green Version]
  24. Nishikawa, H.; Goto, M.; Fukunishi, S.; Asai, A.; Nishiguchi, S.; Higuchi, K. Cancer Cachexia: Its Mechanism and Clinical Significance. Int. J. Mol. Sci. 2021, 22, 8491. [Google Scholar] [CrossRef]
  25. An, X.; Ding, P.R.; Li, Y.H.; Wang, F.H.; Shi, Y.X.; Wang, Z.Q.; He, Y.J.; Xu, R.H.; Jiang, W.Q. Elevated neutrophil to lymphocyte ratio predicts survival in advanced pancreatic cancer. Biomarkers 2010, 15, 516–522. [Google Scholar] [CrossRef] [PubMed]
  26. Shaul, M.E.; Fridlender, Z.G. Tumour-associated neutrophils in patients with cancer. Nat. Rev. Clin. Oncol. 2019, 16, 601–620. [Google Scholar] [CrossRef] [PubMed]
  27. Chen, J.; Chen, M.H.; Li, S.; Guo, Y.L.; Zhu, C.G.; Xu, R.X.; Zhang, Y.; Sun, J.; Qing, P.; Liu, G.; et al. Usefulness of the neutrophil-to-lymphocyte ratio in predicting the severity of coronary artery disease: A Gensini score assessment. Atheroscler. Thromb. 2014, 21, 1271–1282. [Google Scholar] [CrossRef] [Green Version]
  28. Afsar, B. The relationship between neutrophil lymphocyte ratio with urinary protein and albumin excretion in newly diagnosed patients with type 2 diabetes. Am. J. Med. Sci. 2014, 347, 217–220. [Google Scholar] [CrossRef]
  29. Bekdas, M.; Goksugur, S.B.; Sarac, E.G.; Erkocoglu, M.; Demircioglu, F. Neutrophil/lymphocyte and C-reactive protein/mean platelet volume ratios in differentiating between viral and bacterial pneumonias and diagnosing early complications in children. Saudi Med. J. 2014, 35, 442–447. [Google Scholar]
  30. Lagunas-Rangel, F.A. Neutrophil-to-lymphocyte ratio and lymphocyte-to-C-reactive protein ratio in patients with severe coronavirus disease 2019 (COVID-19): A meta-analysis. J Med. Virol. 2020, 92, 1733–1734. [Google Scholar] [CrossRef] [Green Version]
  31. Ponti, G.; Maccaferri, M.; Ruini, C.; Tomasi, A.; Ozben, T. Biomarkers associated with COVID-19 disease progression. Crit. Rev. Clin. Lab. Sci. 2020, 57, 389–399. [Google Scholar] [CrossRef] [PubMed]
  32. Cai, J.; Li, H.; Zhang, C.; Chen, Z.; Liu, H.; Lei, F.; Qin, J.J.; Liu, Y.M.; Zhou, F.; Song, X.; et al. The Neutrophil-to-Lymphocyte Ratio Determines Clinical Efficacy of Corticosteroid Therapy in Patients with COVID-19. Cell Metab. 2021, 33, 258–269.e3. [Google Scholar] [CrossRef] [PubMed]
  33. Sayah, W.; Berkane, I.; Guermache, I.; Sabri, M.; Lakhal, F.Z.; Yasmine Rahali, S.; Djidjeli, A.; Lamara Mahammed, L.; Merah, F.; Belaid, B.; et al. Interleukin-6, procalcitonin and neutrophil-to-lymphocyte ratio: Potential immune-inflammatory parameters to identify severe and fatal forms of COVID-19. Cytokine 2021, 141, 155428. [Google Scholar] [CrossRef]
  34. Forget, P.; Khalifa, C.; Defour, J.P.; Latinne, D.; Van Pel, M.C.; De Kock, M. What is the normal value of the neutrophil-to-lymphocyte ratio? BMC Res. Notes 2017, 10, 12. [Google Scholar] [CrossRef] [Green Version]
  35. Chandrashekara, S.; Mukhtar Ahmad, M.; Renuka, P.; Anupama, K.R.; Renuka, K. Characterization of neutrophil-to-lymphocyte ratio as a measure of inflammation in rheumatoid arthritis. Int. J. Rheum. Dis. 2017, 20, 1457–1467. [Google Scholar] [CrossRef] [PubMed]
Figure 1. The neutrophil to lymphocyte ratio (NLR) according to (A) ECOG-PS, (B) anatomical category of disease, and (C) body mass index (BMI, kg/m2) in all cases (n = 672). U-G-D, upper gastrointestinal disease; L-G-D, lower gastrointestinal disease; BP-D, biliary and pancreatic disease; and L-D, liver disease.
Jcm 11 02012 g001
Figure 2. (A) The relevance in the NLR and the SARC-F score in all cases. (B) Comparison of NLR between SARC-F <4 (n = 588) and ≥4 (n = 84) in all cases.
Jcm 11 02012 g002
Figure 3. (A) The relevance in the NLR and the SARC-F score in U-G-D cases (n = 161). (B) Comparison of NLR between SARC-F <4 (n = 138) and ≥4 (n = 23) in U-G-D cases. (C) The relevance in the NLR and the SARC-F score in L-G-D cases (n = 178). (D) Comparison of NLR between SARC-F <4 (n = 161) and ≥4 (n = 17) in L-G-D cases.
Jcm 11 02012 g003
Figure 4. (A) The relevance in the NLR and the SARC-F score in BP-D cases (n = 236). (B) Comparison of NLR between SARC-F <4 (n = 209) and ≥4 (n = 27) in BP-D cases. (C) The relevance in the NLR and the SARC-F score in L-D cases (n = 97). (D) Comparison of NLR between SARC-F <4 (n = 80) and ≥4 (n = 17) in L-D cases.
Jcm 11 02012 g004
Figure 5. (A) The relevance in the NLR and the SARC-F score in advanced cancer cases (n = 162). (B) Comparison of NLR between SARC-F <4 (n = 132) and ≥4 (n = 30) in advanced cancer cases. (C) The relevance in the NLR and the SARC-F score in non-advanced cancer cases (n = 510). (D) Comparison of NLR between SARC-F <4 (n = 456) and ≥4 (n = 45) in non-advanced cancer cases.
Jcm 11 02012 g005
Figure 6. The correlation in the NLR and grip strength (GS) in male ((A), n = 415) and female ((B), n = 257). (C) Comparison of NLR in patients with non-decrease in GS (n = 342) and decrease in GS (n = 330).
Jcm 11 02012 g006
Table 1. Baseline characteristics (n = 672).
n or Median (IQR)
Age (years)73 (63–79)
Gender, male/female415/257
ECOG-PS, 0/1/2/3/4436/128/49/41/18
Anatomical disease type
Upper gastrointestinal disease161
Lower gastrointestinal disease178
Biliary and pancreatic disease236
Liver disease97
Advanced cancer, yes/no162/510
Body mass index (kg/m2)22.0 (19.6–24.4)
Alanine aminotransferase (IU/L)19 (12–32)
C reactive protein (mg/dL)0.18 (0.06–0.94)
eGFR (ml/min/1.73 m2)67 (55–81)
Serum albumin (g/dL)3.8 (3.4–4.2)
Hemoglobin (g/dL)12.5 (11.1–13.8)
Platelet count (×104/μL)22.0 (16.7–27.9)
White blood cell (/μL)5910 (4768–7693)
Neutrophil count (/μL)3706 (2809–5408)
Total lymphocyte count (/μL)1397 (1069–1842)
Neutrophil to lymphocyte ratio2.65 (1.79–4.31)
SARC-F score0 (0–2)
Grip strength (male, kg)28.9 (23.6–34.2)
Grip strength (female, kg)17.0 (13.2–20.4)
IQR, interquartile range; eGFR, estimated glomerular filtration rate.
Table 2. Correlation in the SARC-F score and baseline characteristics.
rp Value
Age0.25<0.0001
BMI−0.030.3967
ECOG-PS0.79<0.0001
ALT−0.0090.8207
Hemoglobin−0.27<0.0001
Platelet count0.030.4707
Serum albumin−0.30<0.0001
NLR0.54<0.0001
CRP0.21<0.0001
eGFR−0.100.0074
BMI, body mass index; ALT, alanine aminotransferase; NLR, neutrophil to lymphocyte ratio; CRP, C reactive protein; eGFR, estimated glomerular filtration rate.
Table 3. Multivariate analysis (multiple regression analysis) of factors linking to the SARC-F score.
EstimatesStandard Errorp Value
Age0.00660120.0036190.0686
ECOG-PS1.29922420.050599<0.0001
Hemoglobin−0.0174350.0256680.4972
Serum albumin0.0423630.0958740.6587
NLR0.12575960.016222<0.0001
CRP−0.0097570.0125620.4376
eGFR−0.0013130.0022610.5615
NLR, neutrophil to lymphocyte ratio; CRP, C reactive protein; eGFR, estimated glomerular filtration rate.
Publisher’s Note: MDPI stays neutral with regard to jurisdictional claims in published maps and institutional affiliations.

