Article

Navigating through the Lipid Metabolism Maze: Diagnosis and Prognosis Metabolites of Hepatocellular Carcinoma versus Compensated Cirrhosis

1
3rd Medical Department, “Iuliu Hatieganu” University of Medicine and Pharmacy, 400162 Cluj-Napoca, Romania
2
Regional Institute of Gastroenterology and Hepatology, 400162 Cluj-Napoca, Romania
3
Department of Medical Statistics, “Iuliu Hatieganu” University of Medicine and Pharmacy, 400349 Cluj-Napoca, Romania
4
Center for Applied Biotechnology BIODIATECH, SC Proplanta, 400478 Cluj-Napoca, Romania
5
Department of Physiology, “Iuliu Hatieganu” University of Medicine and Pharmacy, 400006 Cluj-Napoca, Romania
*
Authors to whom correspondence should be addressed.
J. Clin. Med. 2022, 11(5), 1292; https://doi.org/10.3390/jcm11051292
Submission received: 31 January 2022 / Revised: 19 February 2022 / Accepted: 24 February 2022 / Published: 26 February 2022
(This article belongs to the Section Gastroenterology & Hepatopancreatobiliary Medicine)

Abstract

:
(1) Background: The pursuit of finding biomarkers for the diagnosis and prognosis of hepatocellular carcinoma (HCC) has never been so paramount in the days of personalized medicine. The main objective of our study is to identify new biomarkers for diagnosing HCC, and to identify which patients are at risk of developing tumor recurrence, decompensation, or even possesses the risk of cancer-related death. (2) Methods: We have conducted an untargeted metabolomics study from the serum of 69 European patients—32 compensated cirrhotic patients without HCC (controls), and 37 cirrhotic patients with HCC with compensated underlying liver disease (cases), that underwent curative treatment (surgery or ablation), performing ultra-high-performance liquid chromatography coupled with electrospray ionization quadrupole time-of-flight mass spectrometry (UHPLC-QTOF- (ESI+)-MS) with an emphasis on lipid metabolites. (3) Results: 1,25-dihydroxy cholesterol (m/z = 419.281), myristyl palmitate (m/z = 453.165), 25-hydroxy vitamin D2 (m/z = 413.265), 12-ketodeoxycholic acid (m/z = 391.283), lysoPC (21:4) (m/z = 558.291), and lysoPE (22:2) (m/z = 534.286) represent notable biomarkers that differentiate compensated cirrhosis from early HCC, and ceramide species are depleted in the serum of HCC patients. Regarding prognosis, no metabolite identified in our study could determine tumor relapse. To distinguish between the HCC patients that survived curative treatment and those at risk that developed tumor burden, we have identified two notable phosphocholines (PC (30:2); PC (30:1)) with AUROCs of 0.820 and 0.807, respectively, that seem to increase when patients are at risk. In a univariate analysis, arachidonic acid was the only metabolite to predict decompensation (OR = 0.1, 95% CI: 0–0.16, p < 0.005), while in the multivariate analysis, dismally, no variable was associated with decompensation. Furthermore, in the multivariate analysis, we have found out for the first time that the increased expression of 1,25-dihydroxy cholesterol, myristyl palmitate, 12-keto deoxycholic acid, lysoPC (21:4), and lysoPE (22:2) are independent markers of survival. (4) Conclusions: Our study reveals that lipids play a crucial role in discriminating compensated cirrhosis and early hepatocellular carcinoma, and might represent markers of survival and prognosis in personalized and minimally invasive medicine.

1. Introduction

One of the challenges that hepatologists face nowadays is the troublesome occurrence of hepatocellular carcinoma (HCC), the sixth most common cause of cancer worldwide, with an increasing incidence. Moreover, the World Health Organization estimates that more than a million people will die from liver cancer in 2030 [1,2]. In addition, due to late or limiting diagnosis methods, HCC has become more and more frequent on the doctor’s agenda, often diagnosed in advanced stages, with a median overall survival time of 6–8 months [3].
Although α-fetoprotein (AFP) is the most often used screening biomarker in clinical practice for early HCC detection, predicting tumor recurrence, and monitoring the oncological treatment, its poor sensitivity and specificity make it an unsatisfactory marker [4]. For this reason, new biomarkers are needed to identify among cirrhotic patients those at risk of developing liver malignancy, or to monitor treatment efficacy in the case of oncological patients. Along these lines, the concept of liquid biopsy has appeared in oncology for a minimally invasive positive diagnosis, prognosis, and overall disease monitoring. The term liquid biopsy can apply to cancer by-products, including circulating tumor cells (CTC), cell-free DNA (cfDNA), cell-free RNA (cfRNA), microRNA (miRNA), and extracellular vesicles (EVs), and last but not least, to metabolomics as well [5]. Because no organ other than the liver encompasses a myriad of lipids and other metabolites that are constantly interchanging in many biochemical reactions, metabolomics, which represents a compressive fingerprint of cell metabolism, also plays a crucial role in pursuing new diagnostic biomarkers and in identifying biochemical networks involved in prognosis and treatment monitoring [6,7].
Metabolic reprogramming is a hallmark characteristic of all cancer cells [8]. The most well-studied metabolic peculiarity is the Warburg effect, in which cancer cells use aerobic glycolysis instead of mitochondrial oxidative phosphorylation, leading to increased lactate production with a consequent role in cellular proliferation [9,10]. Because the liver is the primary metabolic hub of lipid metabolism through lipid homeostasis and energy balance maintenance, it is plausible to assume that many biochemical pathways involving lipids are disrupted [11]. Indeed, increased lipogenesis and lipolysis promote cancer cell growth, proliferation, and survival [11]. Moreover, fatty acid metabolism is enhanced, and phosphatidyl-choline (PC) and lyso-phosphatidylcholine (LPC) increase, while phosphatidyl-ethanolamine, -serine (PS) and -inositol, and ceramides are markedly reduced in HCC [11,12]. Other lipid metabolites play a double-edged sword role. Sphingolipid metabolism is quite controversial because ceramides induce a proapoptotic effect, whereas their phosphorylated compounds are involved in cancer growth, survival, and motility [13]. There are limited data regarding the involvement of ceramides and sphingosine-1 phosphate (S1P) as significant regulators of hepatocarcinogenesis, and their possible roles as biomarkers in HCC [14]. Some authors report a highly significant upregulation of long and very-long-chain ceramides (C16–C24) in the serum of patients with HCC compared to patients with cirrhosis, while other authors find a ceramide depletion in the serum of HCC patients [15,16]. Bile acids also have a dual role, with both protective and pathogenic roles being a matter of debate in drug-induced liver injury, NAFLD, and colon and liver cancers [17].
The main objective of our study is to identify new serum biomarkers, mainly lipids, and to define prognosis markers of early hepatocellular carcinoma, based on ultra-high-performance liquid chromatography coupled with electrospray ionization quadrupole time-of-flight mass spectrometry (UHPLC-QTOF- (ESI+)-MS). The present study identifies which patients are at risk of developing tumor recurrence, decompensation, and increased mortality.

2. Patients and Methods

2.1. Patient Characteristics and Sample Collection

We have conducted a retrospective analysis of a prospectively collected database. The patients were admitted during 2016–2017 at the “Prof. Octavian Fodor” Regional Institute of Gastroenterology and Hepatology Cluj-Napoca, Romania, as follows: 37 patients with HCC (BCLC stages 0, A, and B) and 32 with compensated cirrhosis were admitted, with a period of three years of follow-up. The diagnosis of HCC was established based on the EASL guidelines for HCC using imaging and/or histopathology, and the stadialisation was performed according to the Barcelona clinic liver cancer (BCLC) score. All patients with compensated cirrhosis, representing the control group, had hepatitis C virus etiology and were referred to interferon-free treatment. The diagnosis of liver cirrhosis was made using non-invasive methods such as abdominal ultrasound, transient elastography, serology, and liver biopsy in certain situations. HCC confirmation included two dynamic imaging examinations according to the EASL guidelines. Clinical characteristics included age, gender, and the etiology of the underlying liver disease. Liver function was determined using the Child-Pugh score, the model for end-stage liver disease (MELD) score, the alpha-fetoprotein (AFP), aspartate aminotransferase (AST), and alanine aminotransferase (ALT) levels, the platelet count, and the gamma-glutamyl transpeptidase (GGT) level.
Hepatic venous pressure gradient (HVPG) was performed to determine the portal hypertension grade, where clinically significant portal hypertension was defined over 10 mmHg [18]. Tumor size and tumor number were assessed via imagistic tools at the time of inclusion, and, for HCC patients, the BCLC stage was determined. Contrast-enhanced CT or contrast-enhanced MRI were performed every three months during the first year and at least every 4–6 months thereafter to monitor disease progression. Independent physicians performed all follow-up examinations without prior knowledge of the study. The development of decompensation events was noted in the HCC group and was defined by the appearance of jaundice, ascites, hepatorenal syndrome, hepatic encephalopathy, and/or variceal bleeding. In the control group, patients with liver nodules or those with a history of decompensation or current symptoms of such were excluded. Patients with HCC developed on the non-cirrhotic liver, patients with advanced HCC (BCLC classes C and D), and those with concomitant cancer other than HCC were also excluded from the study group. Pregnant patients, as well as patients younger than 18 years old were excluded. The patients were followed up until November 2020. The study was performed according to the Declaration of Helsinki, and both groups signed the informed consent of the examination approved by the local ethical guidelines for storing biological samples. The cohort was prospectively studied, and serum lipid parameters were analyzed in retained serum samples, stored previously at −80 °C.

2.2. Metabolomic Analysis

2.2.1. Sample Preparation

The patients included in this study had blood collected by venipuncture in sterile vacutainers anticoagulant, and samples were kept at −80 °C. They were labeled using confidential numerical codes. A volume of 0.6 mL methanol (99%) was added for each volume of 0.2 mL of plasma, and the mixture was vortexed to precipitate proteins for 30 s. Afterward, the composition was kept for 5 min in an ultrasonication instrument, followed by 5 min at −20 °C. The supernatant was collected following centrifugation at 10,000 rpm for 10 min (4 °C).
Afterward, probes were subjected to ultrasound in a water bath for 5 min and left at −20 °C to increase protein precipitation. The samples were centrifuged at 5000 rpm for 10 min to separate the protein supernatant. The supernatant was collected and filtered using nylon filters (0.2 μm). The samples were placed in vials, and then in an autosampler to be injected into the UHPLC MS system.

2.2.2. UHPLC-QTOF-ESI+-MS Analysis

Plasma metabolomic profiling was performed using ultra-high-performance liquid chromatography coupled with electrospray ionization-quadrupole-time of flight-mass spectrometry (UHPLC-QTOF-ESI+-MS) in a ThermoFisher Scientific UHPLC Ultimate 3000 instrument equipped with a quaternary pump, a Dionex delivery system, and MS detection equipment with MaXis Impact (Bruker Daltonics). The metabolites were separated using a Thermo Scientific Acclaim C18 column (3 μm, 2.1 × 50 mm, pore size 30 nm) at 40 °C. The mobile phase consisted of 0.1% formic acid in water (A) and 0.1% formic acid in acetonitrile (B). The flow rate was set at 0.5 mL min−1. The gradient was: 5 to 15% A (0–3 min), 15–50% A (3–6 min), 50–95% (6–9 min), isocratic until 15 min, and afterwards decreased from 95 to 5% (15–20 min). The elution time was set for 20 min. The volume of the injected extract was 5 μL, the column temperature was 40 °C. Several QC samples obtained from each group were used in parallel to calibrate the separations.
Metabolite identification was performed using specific MS parameters: ionization mode ESI+ positive, MS calibration with sodium formate, capillary voltage 3500 V, pressure for the nebulizing gas 2.8 bar, drying gas flow 12 l/min, drying temperature 300 °C. The control of the instrument and the data processing were conducted using the specific software TofControl 3.2, HyStar 3.2, Data Analysis 4.2 (Bruker, Daltonics), and Chromeleon, respectively.

2.3. Data Processing and Statistical Analysis

The base peak chromatograms and all MS spectra were first processed by Compass DataAnalysis 4.2 (Bruker Daltonics, GmbH, Bremen, Germany), using the find molecular feature (FMF) algorithm, and matrix generation was achieved using Profile Analysis 2.1 (Bruker Daltonics, GmbH, Bremen, Germany). The time alignment, spectral background extraction, MS recalibration, normalization by the sum of the bucket values in analysis, and an 80% bucket filter were the chosen parameters.
MetaboAnalyst v5.0 online software was used for univariate and multivariate analyses. The matrices representing the peak intensity versus m/z values for each sample and subgroups of samples were tested using the most relevant statistical parameters to reflect the discrimination between groups, the prediction, and the correlation maps. Therefore, the comparative statistical approaches selected were the volcano test, the variable importance in the projection (VIP) values, the scores and loadings plots of principal component analysis (PCA) and partial least square discriminant analysis (PLSDA) including cross-validation parameters, the random forest-based prediction, and the calculation of p-values by t-test via ANOVA. The same software was applied to build the receiver operating characteristic (ROC) curves and area values under ROC curves (AUC) to evaluate the potential biomarkers’ sensibility and selectivity. Finally, enrichment analysis and pathway matches were established to find the significant metabolites for altered pathways. The relevant molecules, according to statistical analysis, were identified by searches on specialized databases, such as Lipid Maps (http://www.lipidmaps.org (accessed on 20 December 2021)) and the Human Metabolome Database (http://www.hmdb.ca (accessed on 20 December 2021)), and PubChem (https://pubchem.ncbi.nlm.nih.gov/ (accessed on 20 December 2021). The PubChem database codes of each identified metabolite were included.

2.4. Data Processing and Statistical Analysis for Prognosis

Regarding prognosis, the overall survival was defined as the time from treatment until death or the study ending date (November 2020). Disease-free survival was defined as the time from treatment until recurrence or the study’s end date (November 2020). Further, known predictors for survival were added as adjusting variables in multivariate Cox regression models. The proportional hazard assumption was checked with a formal statistical test for all models, while the linear functional form for continuous variables was checked using model residuals plots inspection. For multivariate models, multicollinearity was checked with variance inflation factors. The two-tailed p-value was computed for all statistical tests, and the results were statistically significant for values below 0.05. Data were analyzed using the R environment for statistical computing and graphics (R Foundation for Statistical Computing, Vienna, Austria), version 3.6.3 [R Core Team. R: A Language and Environment for Statistical Computing and IBM SPSS Statistics 25.0.] (IBM, Armonk, NY, USA).

3. Results

3.1. Patient Characteristics

The present study included patients with HCC (group HCC) and patients with compensated cirrhosis as controls (group C). Because all HCV patients from the control group received interferon-free treatment, they were rigorously evaluated clinically and biochemically, and imaging (ultrasound ± CT) was performed. In effect, the national protocol in 2016 banned interferon-free therapy in patients who had cancers, including HCC and decompensated (or a history of decompensated) liver disease. Thus, all of our control patients had compensated hepatitis C cirrhosis. Precisely for this reason, knowing with certainty that the patients from the control group did not have liver tumors, we compared patients with liver cirrhosis with those with HCC to determine different biomarkers of diagnosis and prognosis.
Most patients with HCC had compensated liver disease, with hepatitis C virus (HCV) representing the primary etiology—43.24%, followed by alcoholic cirrhosis (32.4%), and chronic hepatitis B (HBV) infection (16.21%). Only six patients had Child–Pugh B class 7 points with preserved liver function. All 37 HCC patients received curative treatment: 9 (24.32%) underwent surgical resection and 28 (75.67%) received percutaneous ultrasound-guided tumor ablation. The mean duration of follow-up was 29.23 ± 10.74 months. Within the observation time, 13 (35.13%) patients died (group HCd), while 24 survived (group HCs). One patient from the cirrhotic control group died, but without liver-related causes. Regarding tumor relapse, 22 patients (59.45%) were diagnosed with tumor recurrence.
Regarding BCLC class, the HCC patients are classified as follows: 4 BCLC 0, 15 BCLC A, and 18 BCLC B with compensated underlying liver disease. BCLC-B class is characterized by extensive heterogeneity due to the wide range of liver function (Child–Pugh A or B cirrhosis) and variable lesion number and size. Bolondi et al. proposed a sub-classification of intermediate stage HCC so that BCLC B patients might benefit from other treatment options besides transarterial chemoembolization [19]. All 18 BCLC B patients from our study had undergone curative treatment. Of these, 16 correspond to “up to seven criteria” as follows: 9 patients had tumors less than 6.5 cm diameter and underwent surgery, 7 patients had two or three nodules, with a total sum diameter less than 8 cm. The last 2 patients had four nodules, in which surgery and ablation were combined. Unfortunately, liver transplantation is not feasible in our center, so surgical resection or percutaneous ablation were also performed in patients who met the Milan criteria.
None of the patients with HCC and HCV received interferon-free treatment before diagnosis of liver tumors. One had a history of treatment with ribavirin and interferon with no virological response. Subsequently, after the curative treatment, out of the sixteen patients with HCC and HCV, eight underwent DAA treatment with sofosbuvir/ledipasvir. Of these, two had recurrence. Of the six patients with HCC and HBV, one was on lamivudine therapy. Subsequently, none of these were treated with entecavir after curative treatment. All the patients included in this study, including those with HCC and ethanolic cirrhosis, were abstinent.
The baseline characteristics of the study population are depicted in Table 1:

3.2. Univariate and Multivariate Analysis of Metabolic Profile

3.2.1. Analysis of Raw Data Based on UHPLC-QTOF-ESI+-MS Peak Intensities

The data released from the UHPLC-QTOF-ESI+-MS analysis were included in matrices representing the m/z values and peak intensities for each of the more than 300 molecules separated. After eliminating small signals with S/N values < 10 and molecules with peak intensities less than 25,000, the number of peaks remained at around 250. Only metabolites detected in more than 80% of the samples (n = 154) were subsequently included in the statistical analysis. The aligned matrix was converted to a .csv file and processed using the online software Metaboanalyst 5.0.
Table S1 (Supplementary File) includes a list of molecules separated and identified (n = 154), and their average LC-MS peak intensities and standard deviations (SD). The m/z values represent [M + 1] where M is the individual molecular mass. Table S2 (Supplementary File) includes a list of the same molecules and their average intensities for the subgroups HCd (n = 13) vs. HCs (n = 24).
The main classes of molecules are represented by fatty acid derivatives (31), glycerophospholipids and lysoderivates (15 and 27, respectively), diacyl- and monoacyl glycerols and phosphoglycerols (18, 6, and 5 respectively), ceramides and sphingosine derivatives (18), sterols and bile acids (11), and acylcarnitines (11), as well amino acids, choline derivatives (9) and oxylipins as eicosanoid inflammatory mediators (4). Their relative levels in the HCC (HC group) vs. cirrhosis group (C), and their values in the HCd group vs. survivals of the HC group, are presented in Table 2.

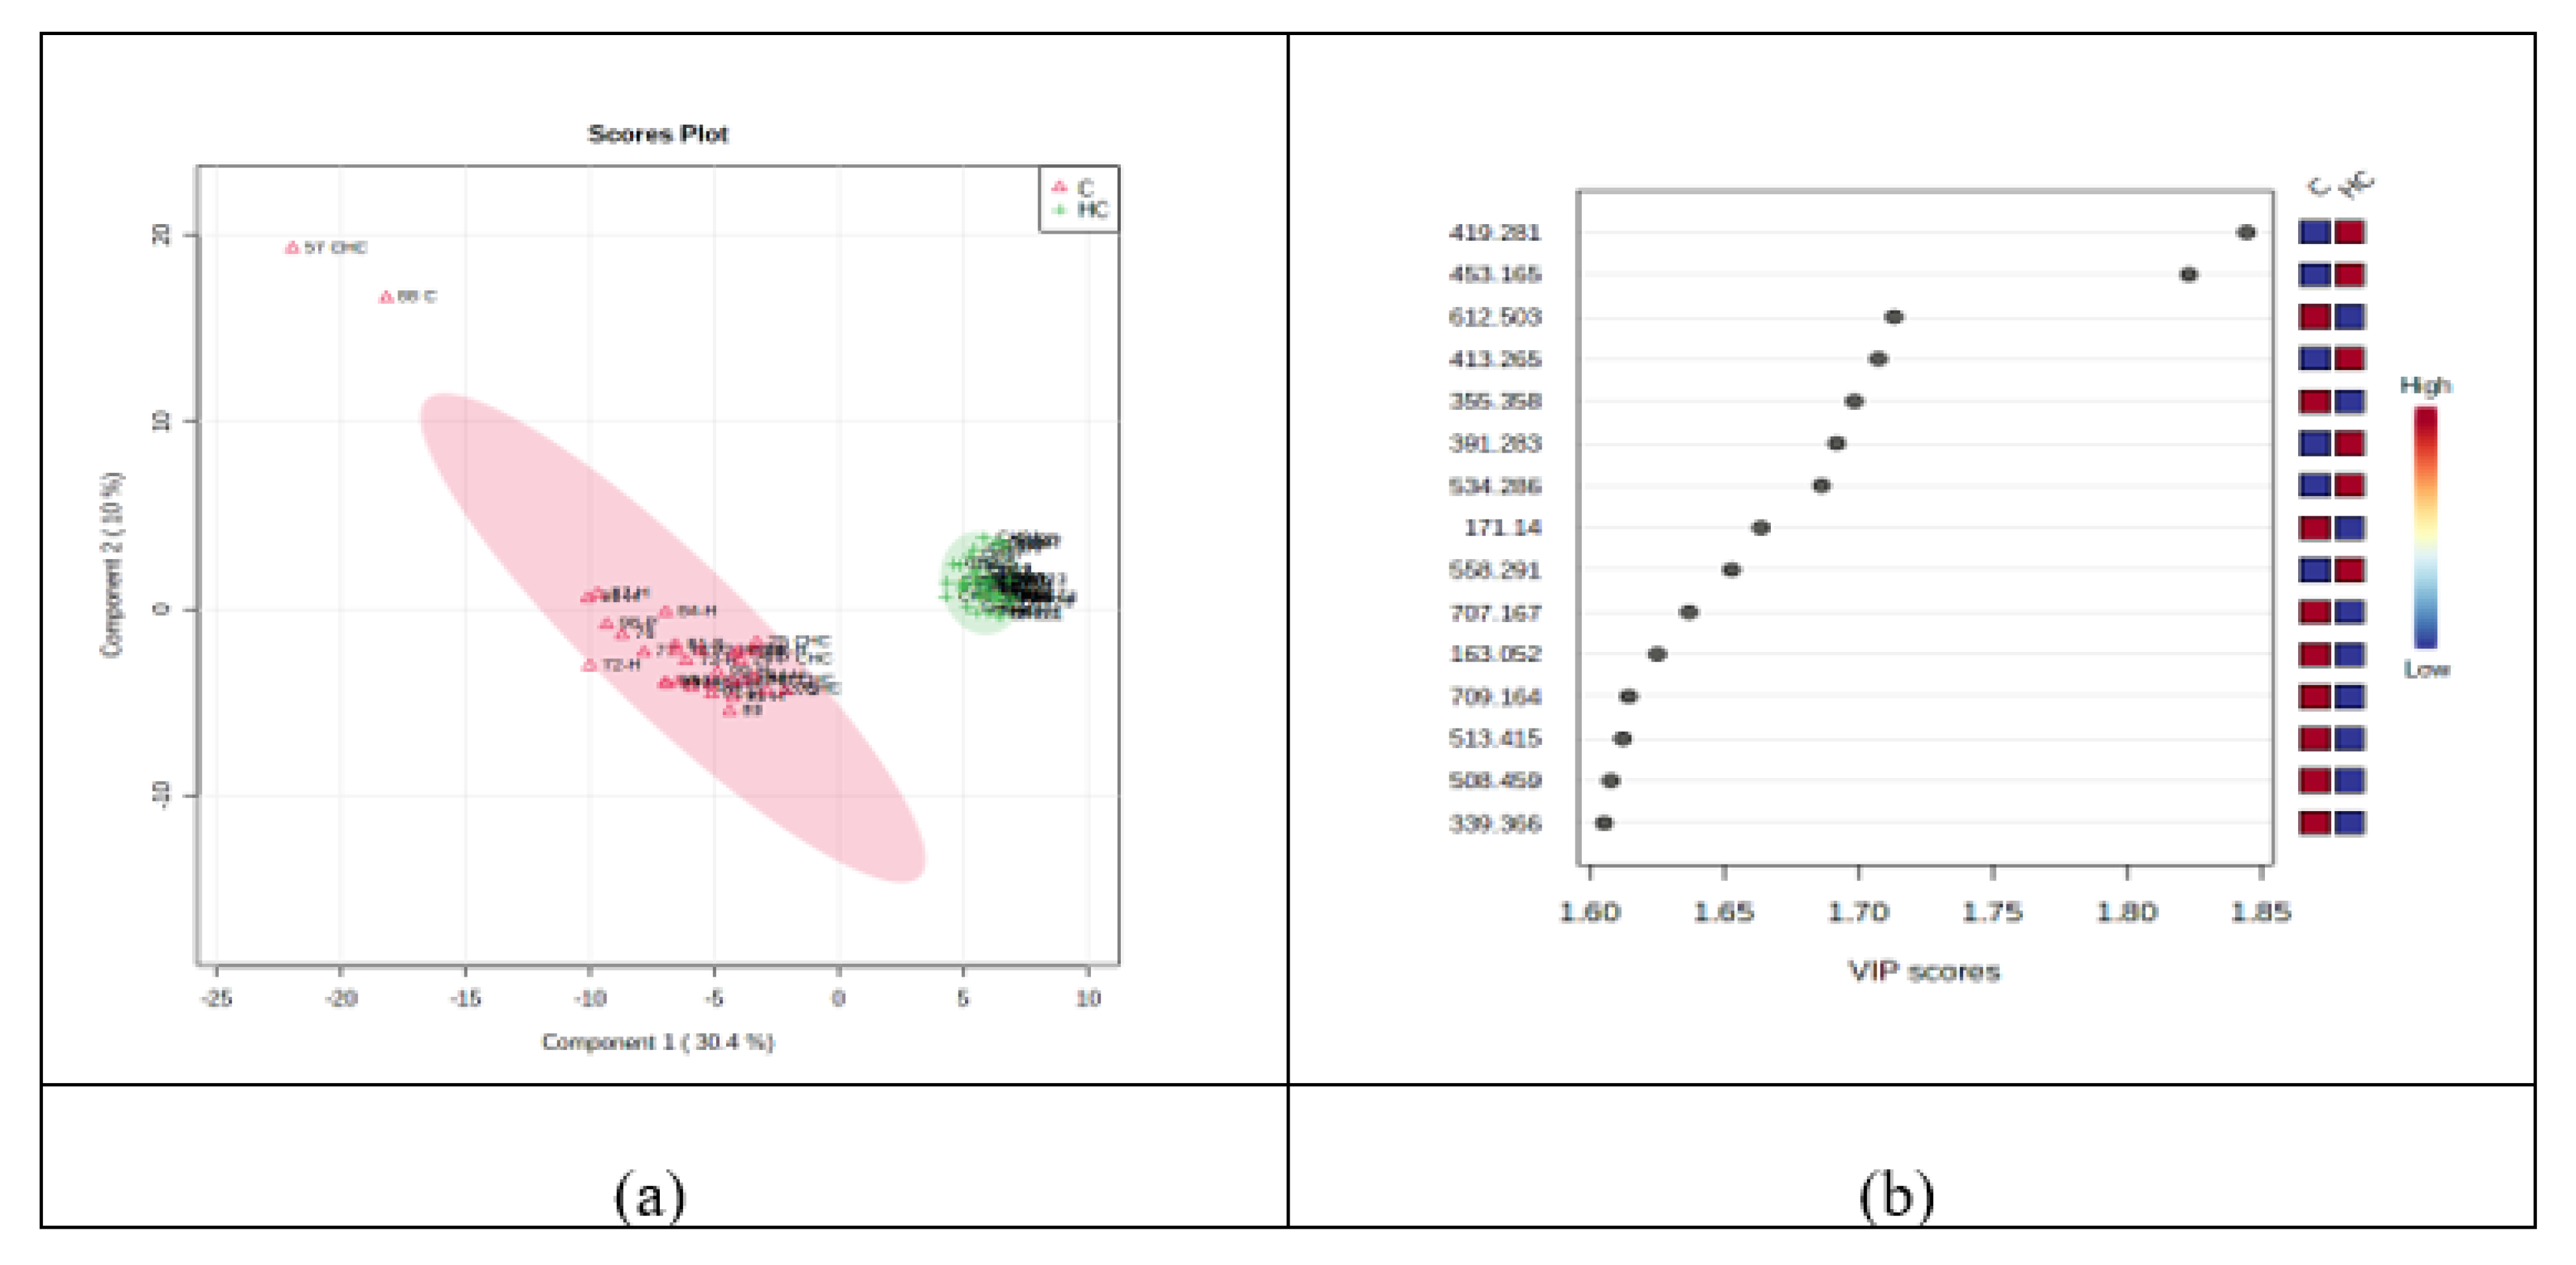
3.2.2. Discrimination Analysis: PCA and PLSDA for HC vs. C Groups

First, the unsupervised PCA was conducted, showing an explained co-variance of 40.6% for the first two components in the HC vs. C groups (data not shown). The discrimination between the HC and C groups was better represented by PLSDA (with a co-variance of 40.1%) (Figure 1a) and the VIP scores derived from the PLSDA loadings showed the first 15 molecules to be considered as putative biomarkers of discrimination between the two groups (Figure 1b). The cross-validation algorithm showed high accuracy (close to one), a high R2 and significantly high Q2 values > 0.95. These data indicated good predictability for this model.
Based on the PLSDA loadings graphic and VIP scores, there were noticeably increased levels of six molecules in the HC group: 1,25-dihydroxy cholesterol (m/z = 419.281), myristyl palmitate (m/z = 453.165), 25-hydroxy vitamin D2 (m/z = 413.265), 12-ketodeoxycholic acid (m/z = 391.283), lysoPC (21:4) (m/z = 558.291), and lysoPE (22:2) (m/z = 534.286). Meanwhile, decreases in the HC group were observed for ceramide (d18:0/20:0 (2OH)) (m/z = 612.503), MG (0:0/18:2/0:0) (m/z = 355.358), decenoic acid C10 (m/z = 171.140), hydroxy adipic acid (m/z = 163.052), PG (O-16:0/16:0) (m/z = 709.164), DG (12:0/16:0/0:0) (m/z = 513.415), lysoPE (20:1) (m/z = 508.459), and dimethyl-2-eicosenoic acid (m/z = 339.366).
Table 3 represents the data released from the t-test and fold-change analysis, showing the tendency of molecules to evolve between HC and C groups.

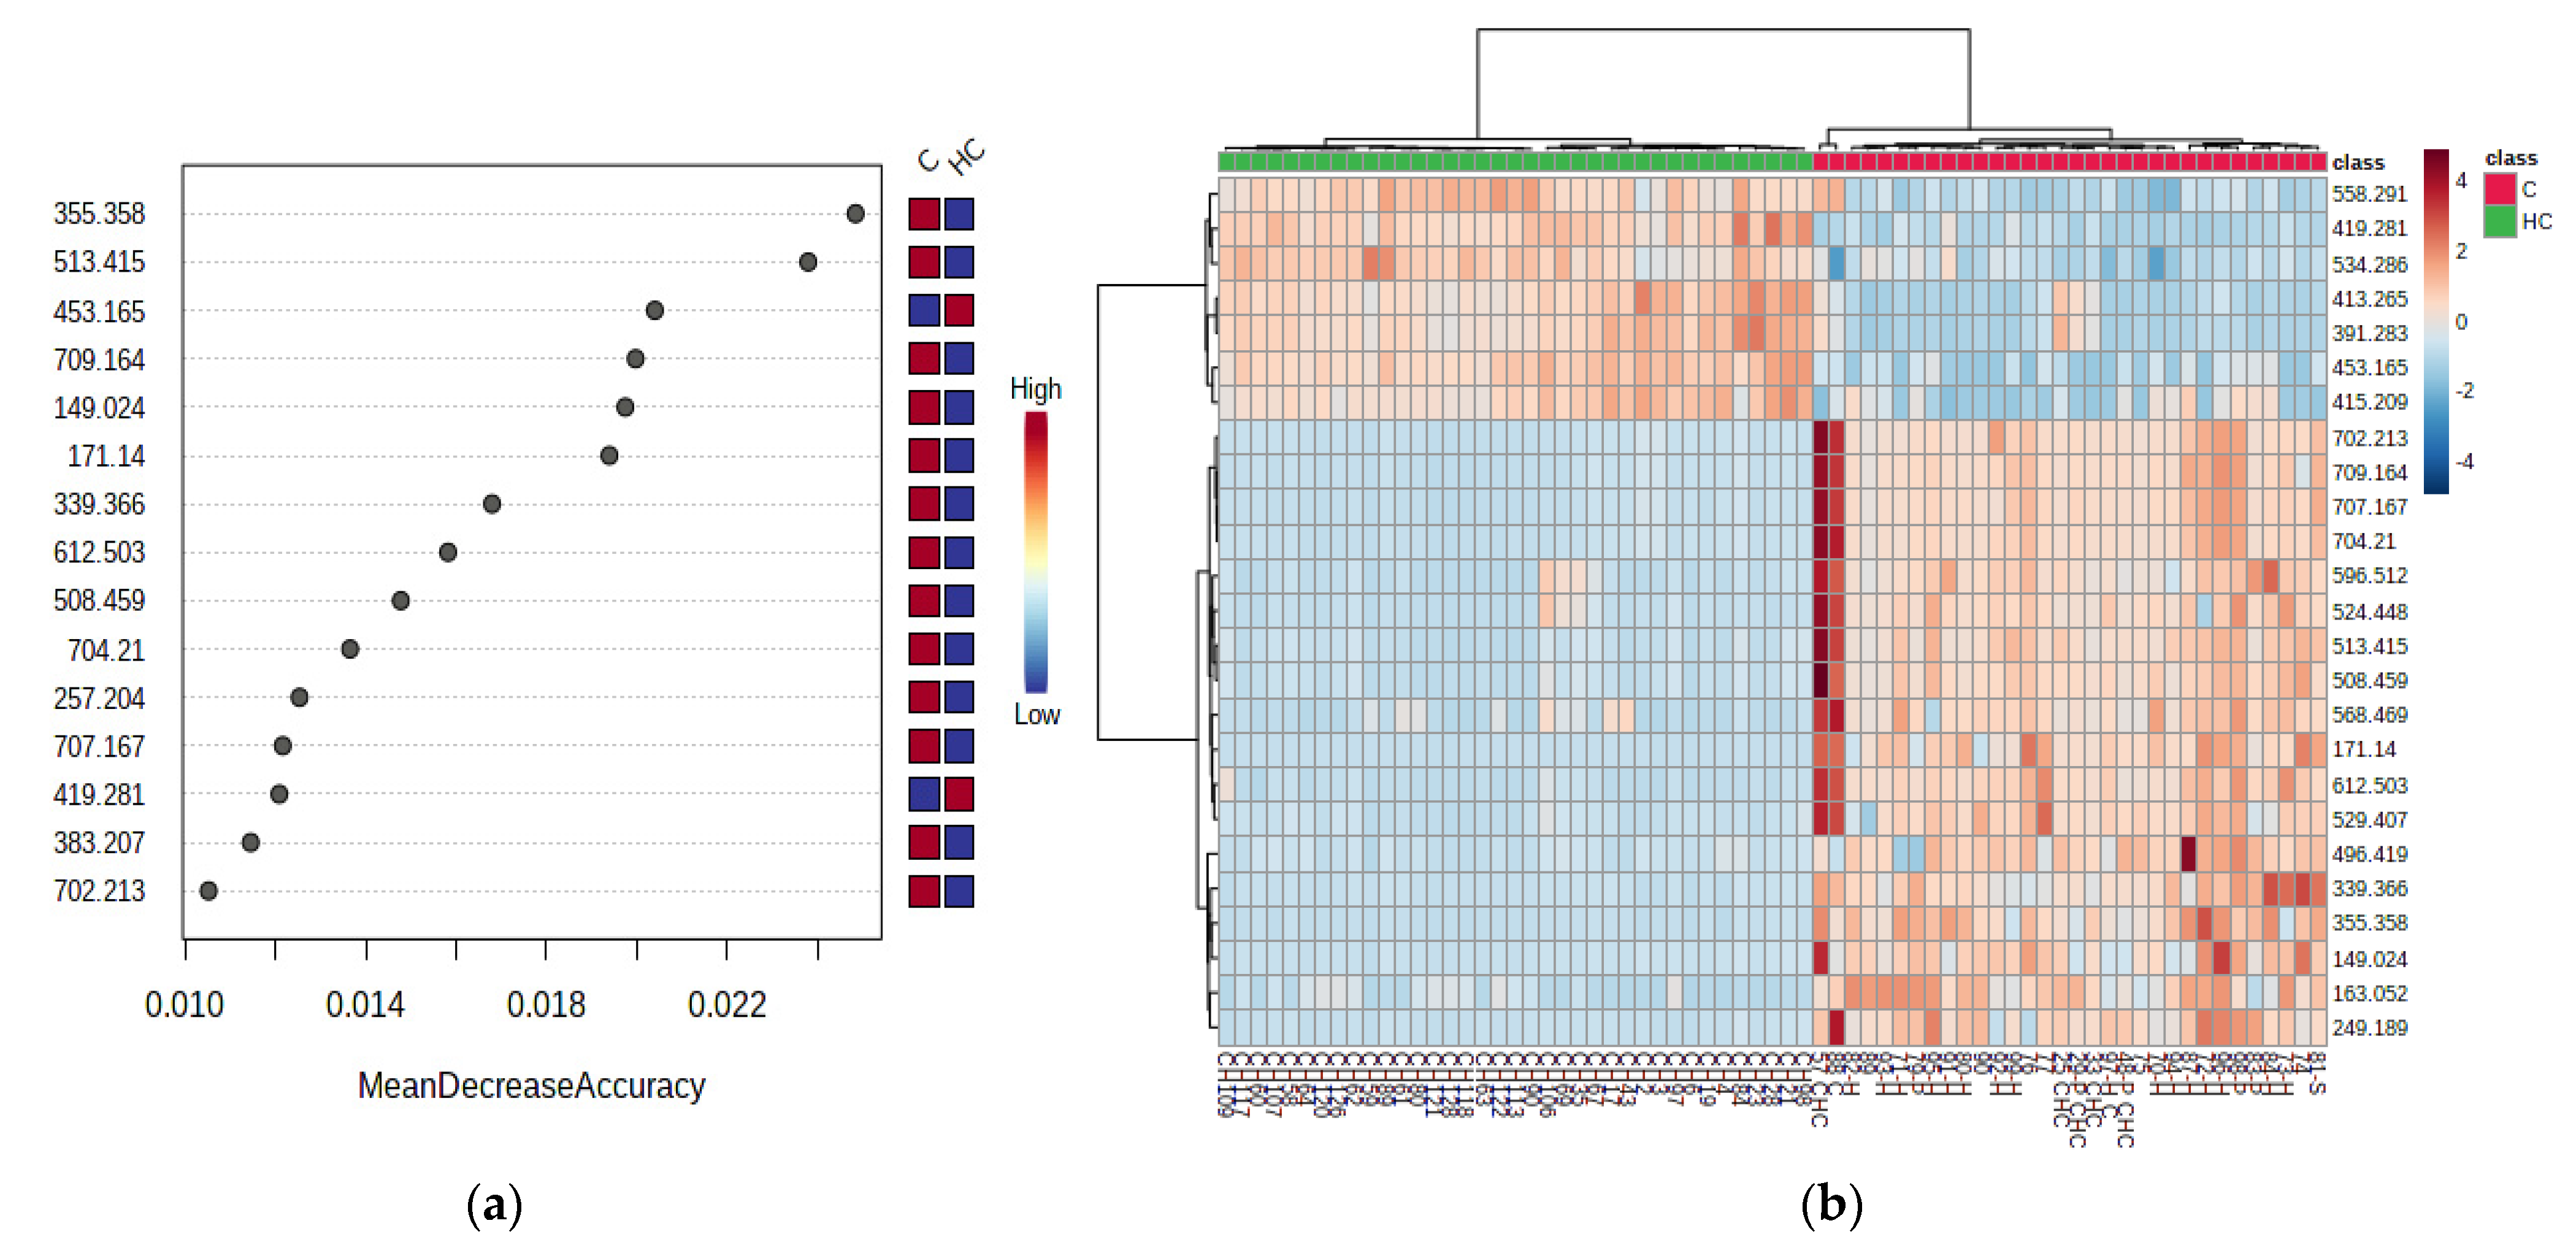
3.2.3. Random Forest Analysis, Heatmaps and Biomarker Analysis for HC vs. C Groups

Figure 2a,b represent the graphics of random forest analysis, and heatmaps showing the illustration of differences between the samples and groups.
Biomarker analysis allowed the calculation of sensitivity versus specificity for each molecule, represented by the AUC values in the ROC curves. Table 4 shows the m/z values and molecule identifications, the AUC values higher than 0.989, the Log2FC and p-values of each molecule considered as a potential biomarker, and their variation in the HC vs. C groups. Simultaneously, Figure 3 illustrates the AUROC values for the six most representative metabolites in our study.

3.2.4. Correlations between Lipid Metabolites, and Clinical and Biological Characteristics

The relation of different lipid metabolites and clinical and biological parameters was assessed using Spearman correlations. For each HCC patient referred for surgery, portal hypertension was measured by hepatic venous portal flow gradient (HVPG). Moreover, it has been established that values above 10 mmHg, equivalent to clinically significant portal hypertension, are associated with post hepatectomy liver failure [19]. Since HVPG measurement is not widely available and is considered an invasive procedure, the pursuit of finding biomarkers to identify patients at risk is paramount. Using Spearman correlations, we have found out that, in HCC patients who underwent surgery, C16 sphingosine tends to predict clinically significant portal hypertension (p = 0.06, R = −0.05), and sphingosine-1 phosphate correlates with HVPG.
A total of 22 out of 37 HCC patients (59.45%) presented tumor recurrence at five year follow-up, after the initial diagnosis and treatment. Dismally, no metabolite could definitively predict tumor relapse. Since C16-sphingosine tends to correlate, and sphingosine-1 phosphate correlates, with HVPG, we can extrapolate and attest that C16-sphingosine and sphingosine-1 phosphate are associated with recurrence and post-hepatectomy liver failure. More mathematical models are needed which include metabolites to determine the patients at risk.
We have pointed out that 1,25-dihydroxy cholesterol (m/z = 419.281), myristyl palmitate (m/z = 453.165), 12-ketodeoxycholic acid (m/z = 391.283), lysoPC (21:4) (m/z = 558.291), and lysoPE (22:2) (m/z = 534.286) are putative biomarkers that differentiate HCC from cirrhosis. Along these lines, we have investigated whether these biomarkers have a role in decompensation and prognosis. The deterioration of liver function in a patient with cirrhosis is characterized by jaundice, ascites, hepatic encephalopathy, hepatorenal syndrome, or variceal bleeding. In total, among the included patients, eight developed ascites, three developed variceal bleeding, and one hepatic encephalopathy. In a univariate analysis among the HVPG (OR = 0.82, 95% CI: 0.8–1.24, p < 0.005) and MELD score (OR = 0.74, 95% CI: 0.54–0.93), arachidonic acid was the only metabolite to predict decompensation (OR = 0.1, 95% CI: 0–0.16, p < 0.005). In the multivariate analysis, unfortunately, no variable was associated with decompensation.

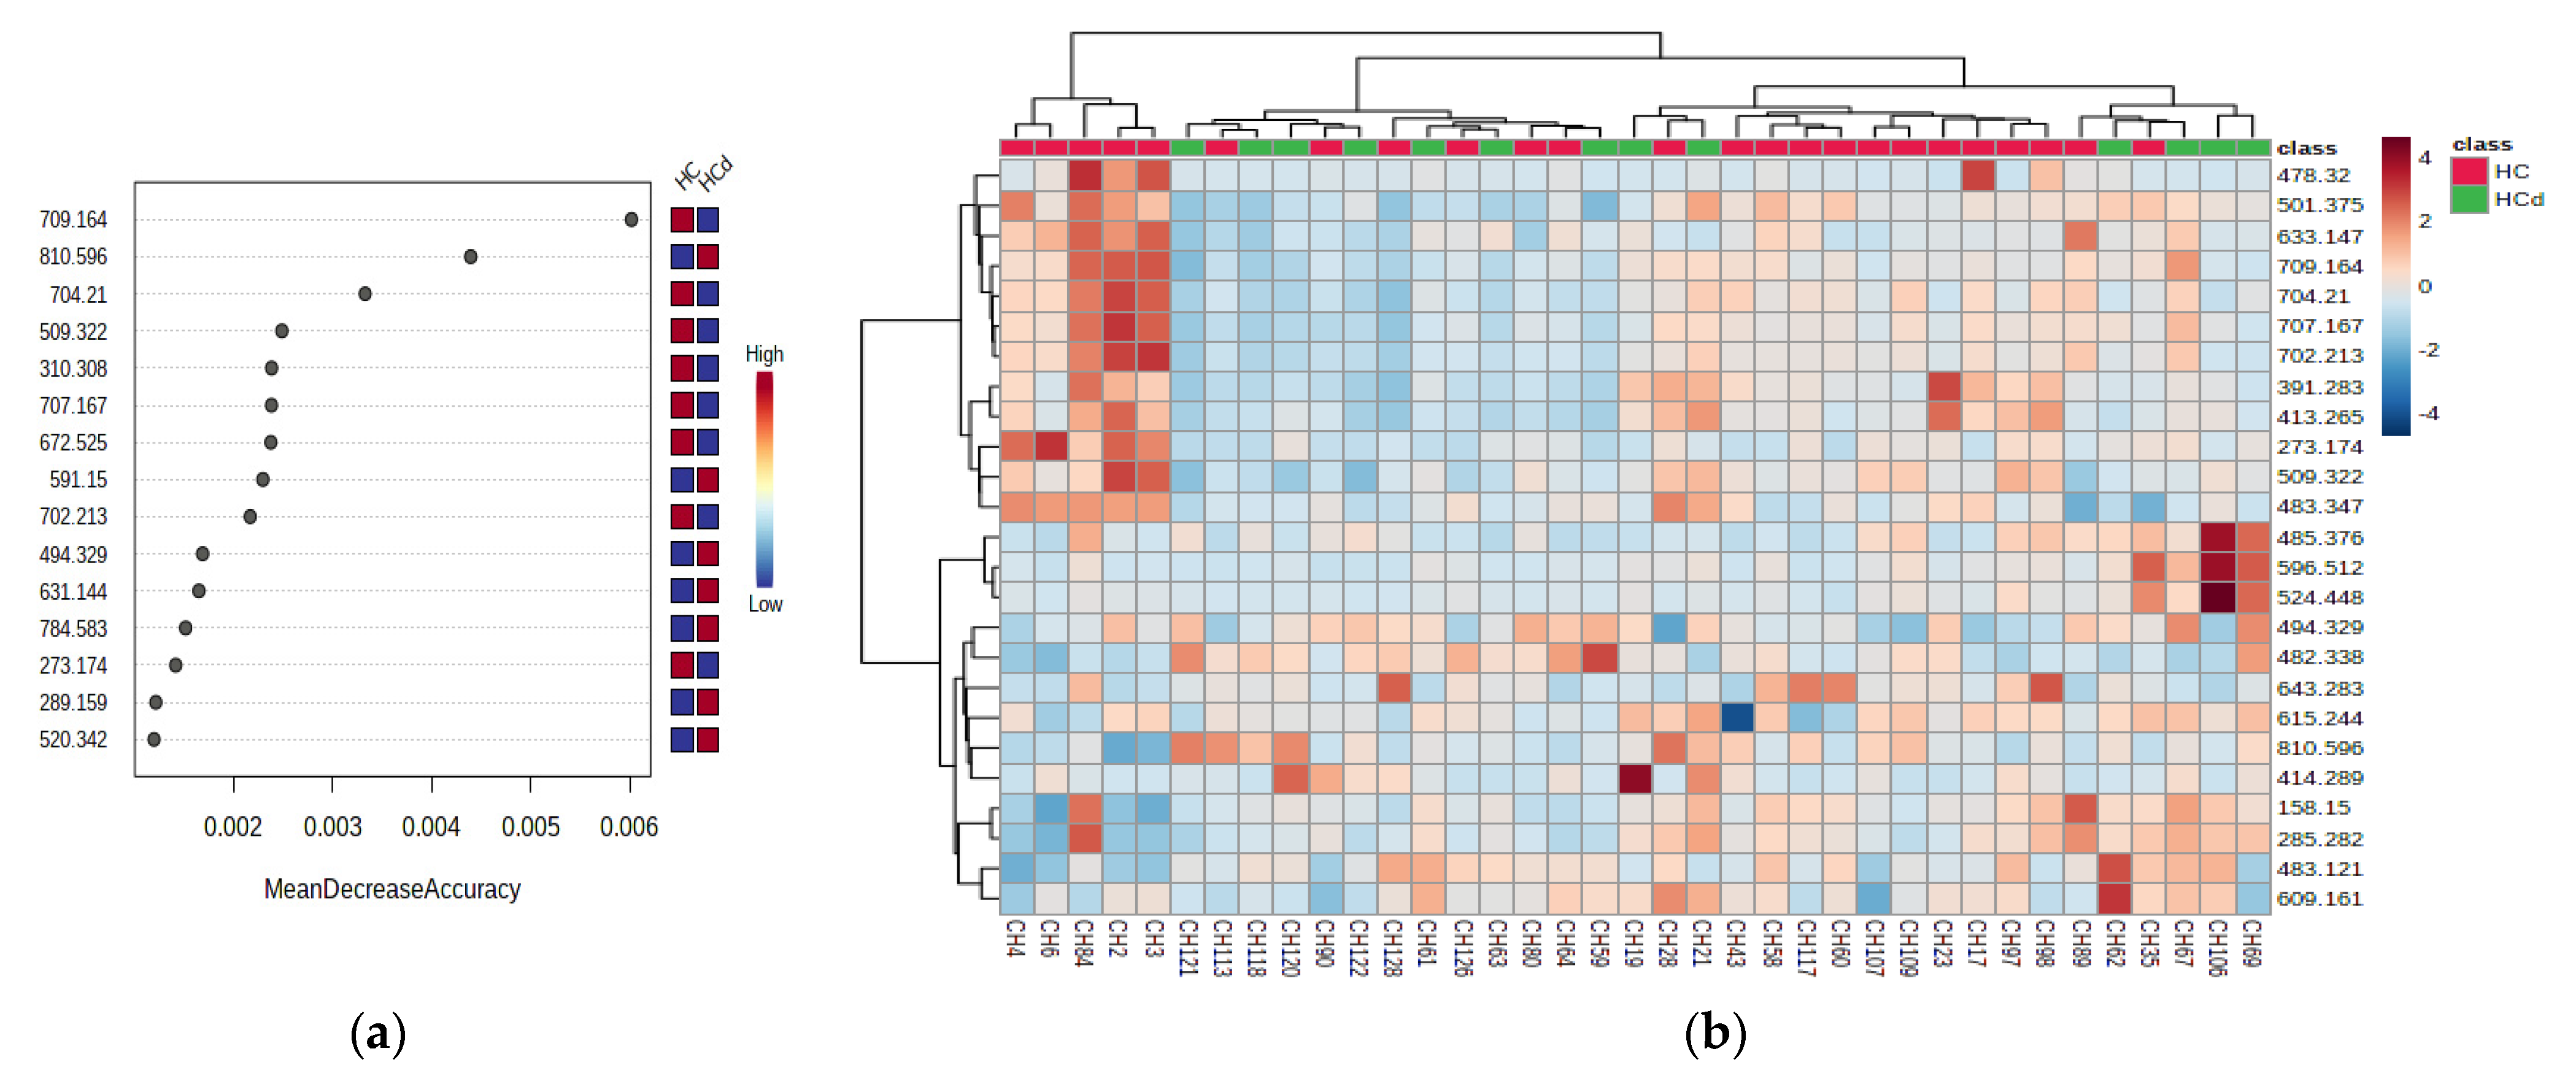
3.2.5. Univariate Analysis to Predict the Death (Comparison of HCd vs. HCs Groups)

To identify which patients were at risk, Cox regression analysis was applied to further evaluate the predictive capacity of critical metabolites and assess the overall survival of HCC patients. During a follow-up period of five years, 13 (35.13%) out of 37 patients died, and, among them, 8 had developed a decompensation episode. The survival of patients with all lipid parameters as single variables was examined, using the Cox proportional hazard method for death. The highest HR for death was found for myristyl palmitate (HR = 16.67), p = 0.005 (Table 3). Furthermore, as adjusting variables in the multivariate Cox regression models, MELD and HVPG were added as predictors for survival. Adjusting for MELD score and HVPG in a multivariate analysis (Table 5) we have found that arachidonic acid (HR = 12.08, 95% CI: 2.95–49.93, p < 0.005), 1,25-dihydroxy cholesterol (HR = 10.61, 95% CI: 1.37–82.3, p < 0.005), myristyl palmitate (HR = 31.63, 95% CI: 1.51–661.66, p < 0.005), 12-keto deoxycholic acid (HR = 21.98, 95% CI: 1.39–121.39, p < 0.005), lysoPC (21:4) (HR = 10.46, 95% CI: 1.41–77.54, p < 0.005), and lysoPE (22:2) (HR = 2.37, 95% CI:1.07–5.24, p < 0.005), are independent markers of survival.

3.2.6. Multivariate Analysis for HCd vs. HC Groups
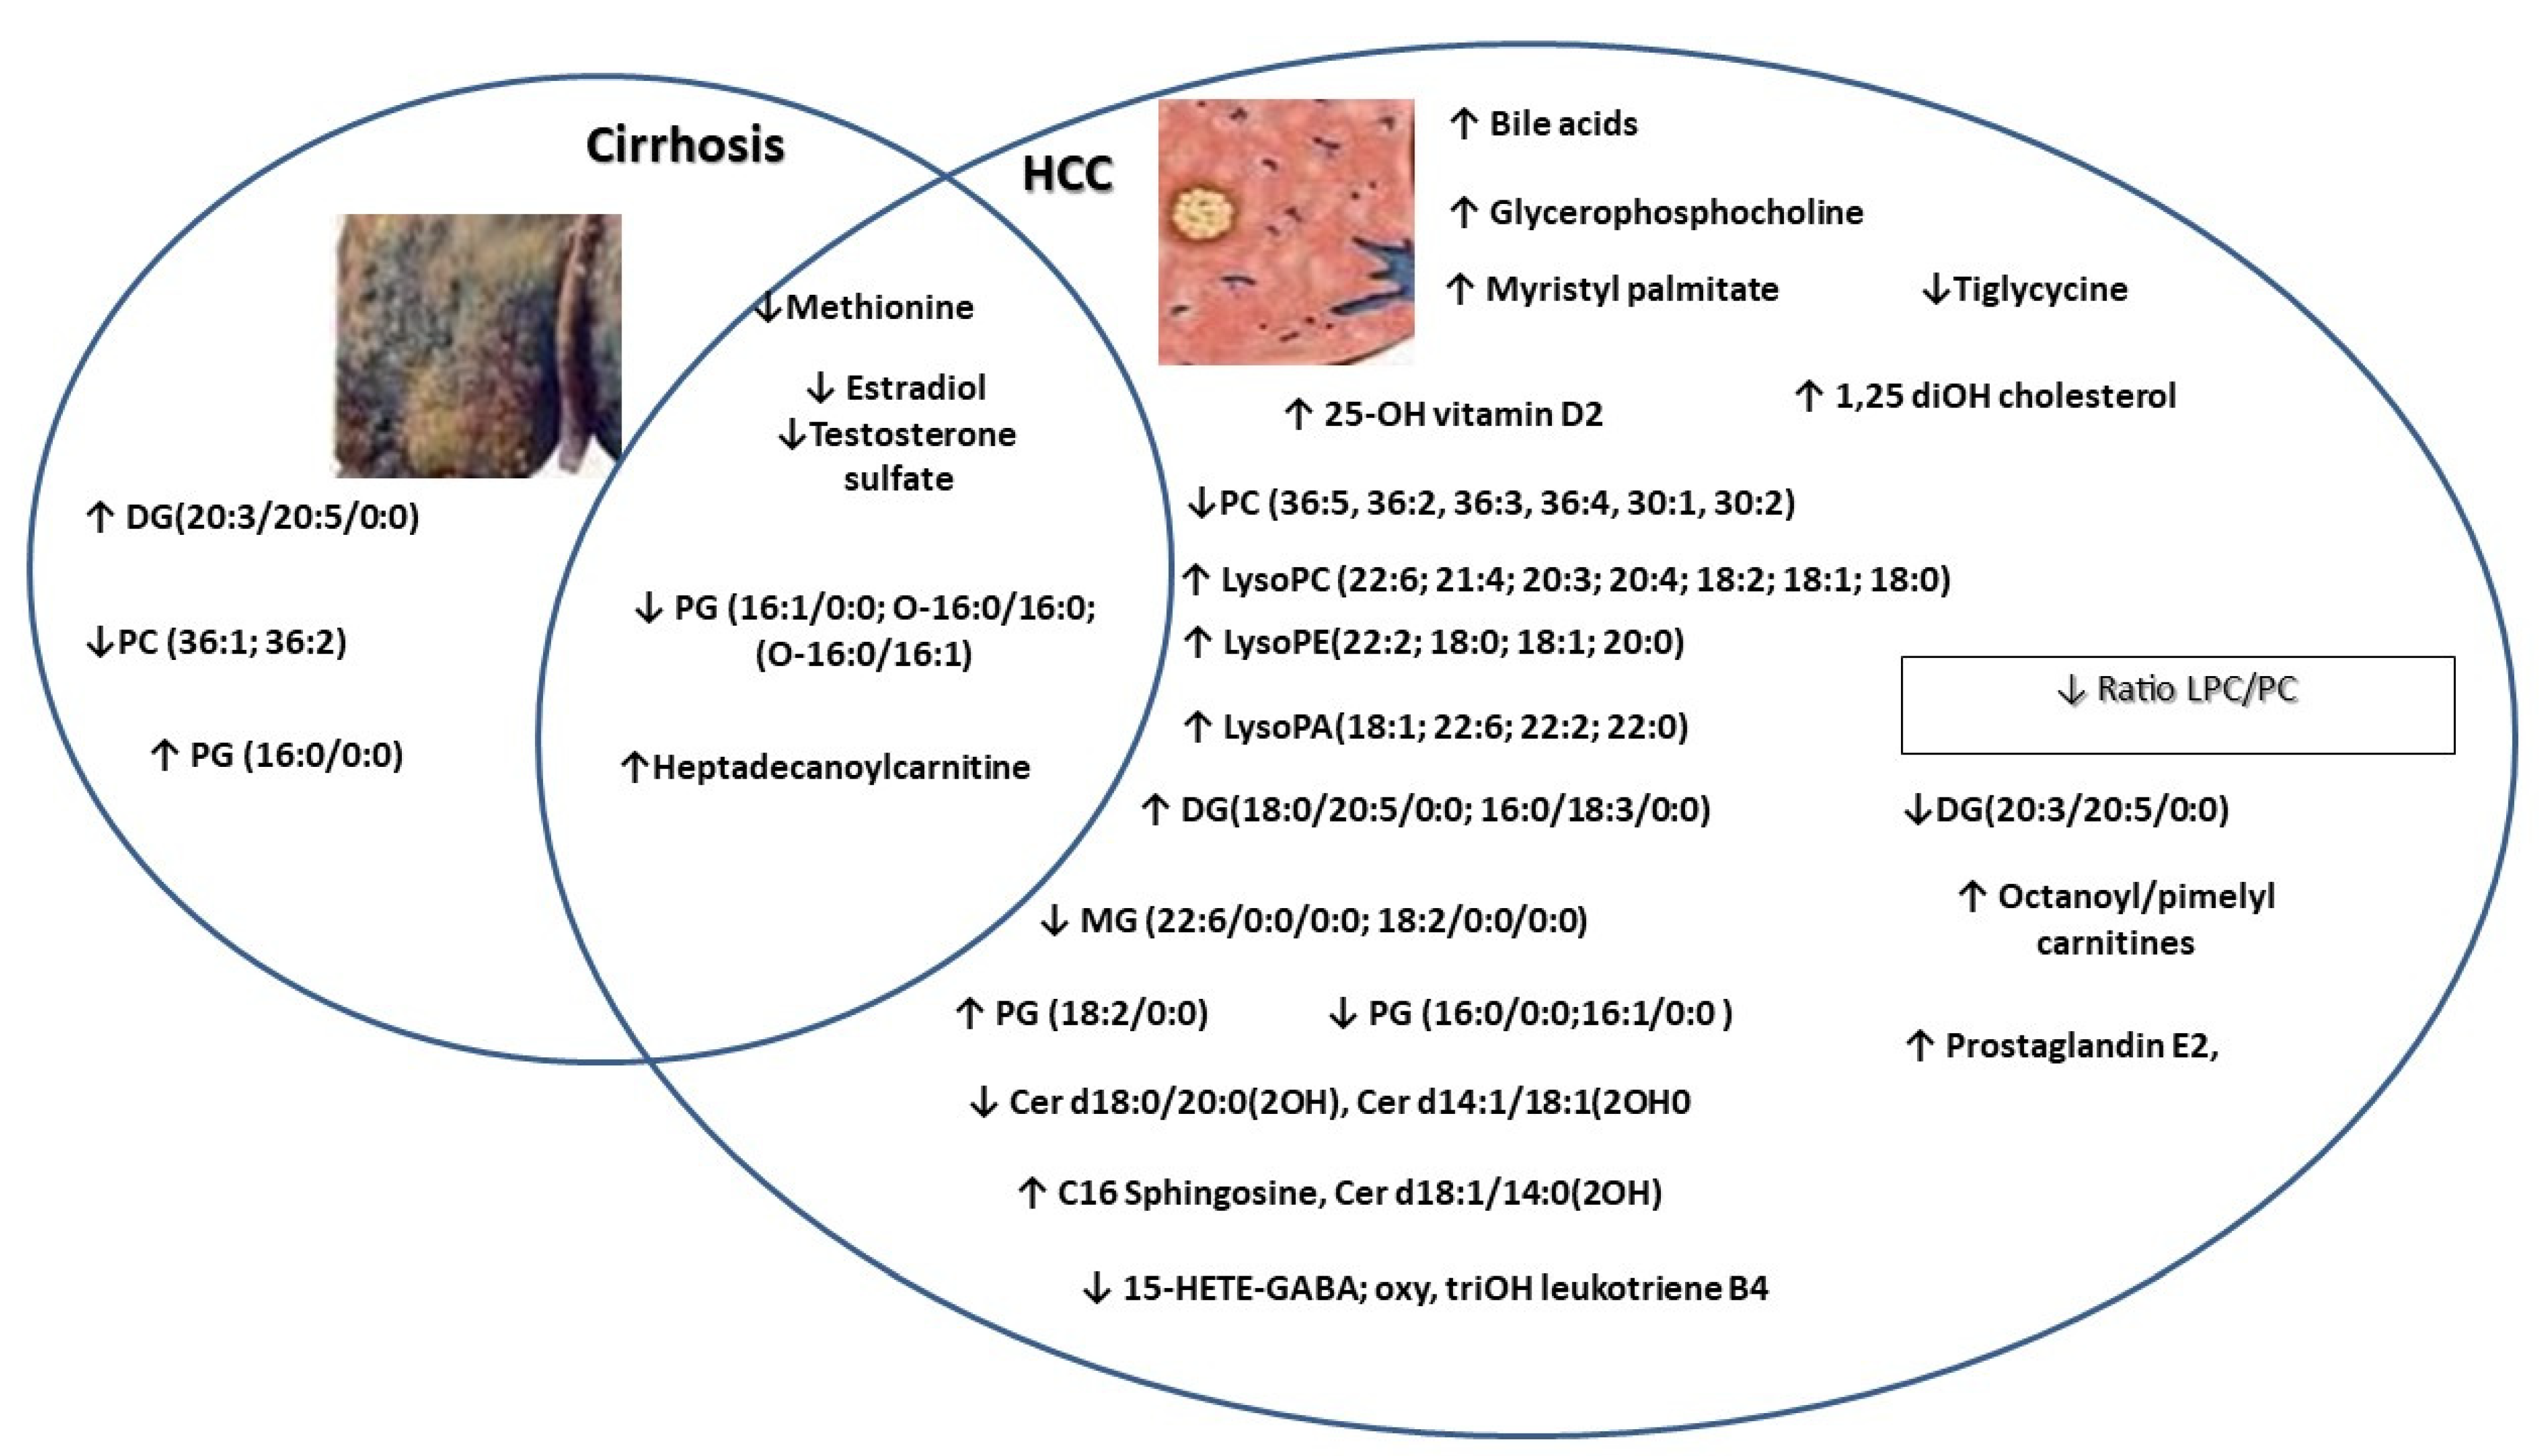
Figure 4 shows the PLSDA plot, which reflects the discrimination between HCd and HCs (marked HC) groups (a), and the molecules with higher VIP scores derived from PLSDA loadings.
Figure 5 represents the graphics of random forest analysis (a), and heatmaps showing the illustration of differences between the groups HCd and HCs.
Table 6 shows the first 20 molecules with VIP scores higher than 1.5 and MDA values higher than 0.01, and the AUC values.
The data obtained highlights that arachidonic acid, 1,25-dihydroxy cholesterol myristyl palmitate, 12-ketodeoxycholic acid, lysoPC (21:4), and lysoPE (22:2) may predict HCC mortality and recurrence, and constitute important biomarkers. Moreover, 12-ketodeoxycholic acid levels seem to decrease for HCC patients at risk of death, and thus might represent an important parameter.

4. Discussion

The early detection of hepatocellular carcinoma and the identification of prognostic factors are key to personalized medicine to improve patient outcomes. Along these lines, the main objective of our study was to identify new biomarkers for diagnosing early hepatocellular carcinoma and to identify which patients are at risk of developing tumor recurrence, or even death. Therefore, we conducted an untargeted metabolomics study emphasizing lipid metabolites in 69 European patients—32 compensated cirrhotic patients without HCC (controls) and 37 compensated cirrhotic patients with early HCC (cases) that underwent curative treatment (surgery or ablation), and have followed up with these patients for almost four years.
The AFP values did not show any differences between HCC and cirrhosis patients, most likely due to both groups’ compensated underlying liver disease. Therefore, AFP is an imperfect surveillance tool making it imperative for the hepatology and oncology community to find a reasonably suitable hepatic cancer biomarker. Ultra-high-performance liquid chromatography coupled with electrospray ionization quadrupole time-of-flight mass spectrometry (UHPLC-ESI+-QTOF-MS) revealed important serum biomarkers that differentiate HCC patients from cirrhotic controls. The present study has identified different lipid molecules involved in fatty acid, glycerophospholipid, sphingolipid, and acylglycerol metabolism as putative biomarkers for differentiating cirrhosis and HCC, with AUC values over 0.900. Moreover, for the first time, we have identified metabolites that differentiate the deceased HCC patient from those who survived. Hence, we report two types of phosphocholines (PC (30:2); PC (30:1)) with AUROCs of 0.820 and 0.807, respectively, that are increased in early HCC, with levels that drop when tumors progress. Indeed, several studies have reported changes in gene expression and enzyme activity that led to altered PC synthesis in cancer, which contributes to tumorigenesis, while other studies have revealed oscillating PC expression in HCC patients [20,21]. To our knowledge, the present study contrasts and compares the expression of PC metabolites for the first time between early HCC patients who survived curative treatment and those who died. An emphasis on PC metabolism in the future might bring new treatment options in oncology.
Based on the PLSDA loadings graphics and VIP scores, our study identified several metabolites increased in the HCC group compared to the cirrhotic controls, depicted in Figure 5. The lipid metabolites with the most increased expression were attributed to 1,25-dihydroxy cholesterol, 25-hydroxy vitamin D, myristyl palmitate, 12-ketodeoxycholic acid, lysoPC (21:4), and lysoPE (22:2). Cholesterol plays an intricate role in liver tumorigenesis and supports the growth of hepatocarcinoma lesions depleted of fatty acid synthase in mice and humans [22]. Moreover, it seems that HMG-CoA reductase, a cornerstone enzyme of cholesterol synthesis and the target of statins, is upregulated in human HCC samples and retrospective studies suggest that the use of statins might be associated with a reduced risk of HCC development [23]. Our study found out that 1,25-dihydroxy cholesterol is upregulated by almost six times relative to cirrhotic controls.
Progressing into the lipid maze, the expression of 25-hydroxy vitamin D is a matter of debate. Undoubtedly, low levels of vitamin D are associated with increased mortality in chronic liver disease. In contrast, its increased expression in HCC serum in some studies has been demonstrated to have an antitumoral role, and, in other studies, was associated with tumor progression [24,25,26]. Bile acids, phosphatidyl-choline, and phosphatidyl-ethanolamine metabolites also play a dual role in cancer biology [17,20,27]. Although our study determines minuscule pieces from the puzzle of lipid biology, 1,25-dihydroxy cholesterol, myristyl palmitate, 12-keto deoxycholic acid, lysoPC (21:4), and lysoPE (22:2) represent important independent markers of survival in multivariate analysis, when adjusting for MELD score and portosystemic gradient. Thus, the next step for our study would be to determine a mathematical model encompassing the metabolites mentioned above, and to apply it to other cohorts of cirrhosis and liver cancer to determine which patients are at risk.
Figure 6 represents the general variations in specific molecules between cirrhosis versus early hepatocellular carcinoma.
In our study, we have revealed that most ceramides are expressed at lower levels compared to cirrhotic patients. This is most likely due to a depletion of ceramide content during transformation into bioactive molecules with protumor roles. Takashima, Y. and Li, Z. have confirmed these arguments and state that ceramide metabolism is deregulated in primary liver cancer [28,29]. Nonetheless, we have conceded that sphingolipid family members discriminate between HCC and cirrhosis, and might represent excellent biomarkers far better than AFP.
Apart from being an essential player in stimulating the apoptosis of tumor cells, chemotherapy and ionizing radiation exert their effects through ceramides, a fact demonstrated by the increased levels of ceramides after exposure to those procedures [30]. Therefore, ceramides constitute crucial cancer treatment targets or adjuvant therapies to existing chemotherapies [31]. Since we have obtained increased levels of many ceramides in cirrhosis and decreased levels in HCC patients, we believe that, in future, it would be a cornerstone to determine the cut-off values of ceramides to pinpoint the high-risk moment of developing primary liver cancer. Along these lines, large cohort studies are needed which focus on this direction. Studies attest that S1P is increased in the serum of HCC patients [13]. There is an S1P axis, which refers to all the molecules involved in its metabolism and its receptors or other intracellular targets. S1P is produced (inside the cell) by the phosphorylation of sphingosine, a reaction catalyzed by two sphingosine kinases: SPHK1 and SPHK2. SPHK1 is of great importance between these two kinases, because its increased activity stimulates cell growth and inhibits apoptosis. Once activated inside the cell, S1P can act on intracellular targets or be secreted in the interstitial area and interact with cell surface receptors, a process known as “inside-out” signaling. The importance of this axis lies in the fact that its components can be therapeutic targets in cancer treatment. For example, monoclonal antibodies directed against S1P have been synthesized (sonepcizumab), alongside SPHK1 inhibitors, and various agonists and antagonists of the S1P receptors (S1PRs), and are in several phases of clinical trials [14]. Although we obtained results in contrast with those in the literature, we consider that the low level of S1P obtained in our patients with HCC is due to the presence of compensated underlying liver disease. It is likely that S1P increases in more advanced stages of cirrhosis or tumor progression.
There is scarce data regarding the role of lipids as prognostic markers in HCC. One study from 2019 from a French group revealed elevated concentrations of phosphatidylcholine (PC) 16:0/16:1 (p = 0.0180), PC 16:0/16:0 (p = 0.0327), PC 16:0/18:1 (p = 0.0264) and sphingomyelin (SM) 18:2/24:1 (p = 0.0379), and low concentrations of lyso-phosphatidylcholine 20:4 (0.0093) and plasmalogen-phosphatidyl-ethanolamine (LysoPE) 16:0/20:4 (p = 0.0463), LysoPE 18:0/20:4 (p = 0.0077), LysoPE 18:0/20:5 (p = 0.0163), and LysoPE 18:0/20:3 (p = 0.0463) as good biomarkers for HCC versus cirrhosis, as well as two ceramides (ceramide d18:1/26:0 and ceramide d18:1/24:1) that were associated with the risk of death in one and/or three years [20]. Moreover, in a Chinese cohort, it seems that changes in polyunsaturated-eicosapentaenoic acid, docosahexaenoic acid, and linolenic acid are associated with early tumor recurrence after hepatectomy. In addition, the researchers also found that 85% of early recurrent HCCs can be predicted with an AUROC equal to 0.95 in a training set with the combination of methionine, GCDCA, and cholesterol sulfate [32]. Another Chinese study identified, after univariate and multivariate Cox regression, the combined retinol and retinal panel as an independent predictor for HCC, and showed that the low expression of the panel was correlated with decreased survival after hepatectomy. Retinol and retinal discriminate HCC from cirrhosis with an AUROC of 0.996 and 0.994 in tissue, and 0.812 and 0.744 in serum, respectively [33]. No metabolite identified in our study could determine tumor relapse. Nevertheless, since C16-sphinganine tends to correlate, and sphingosine-1 phosphate correlates, with HVPG, we can extrapolate and attest that C16-sphinganine and sphingosine-1 phosphate are associated with recurrence and post-hepatectomy liver failure. Arachidonic acid was the only metabolite to predict decompensation. In the multivariate analysis, dismally, no variable was associated with decompensation. When adjusting for MELD score and HVPG in a multivariate analysis, we report for the first time that the increased expression of 1,25-dihydroxy cholesterol, myristyl palmitate, 12-keto deoxycholic acid, lysoPC (21:4), and lysoPE (22:2) are independent markers of survival.
Although most studies emphasize serum metabolites, other authors have performed metabolomics on tissues or other biological fluids as follows. One study from China reported that the retinol metabolic signature determined from liver biopsy and serum had considerable diagnostic and prognostic value for identifying HCC patients who would benefit from prompt therapy. Other authors claim that tissue metabolomics yields a more precise biochemical information pattern when searching for tumoral energy metabolites [33].
In the last few years, the concept of prognostic scores has been reported in oncology. Different mathematical models comprising biochemical analyses were released to assess tumor relapse or identify patients at risk of developing complications. Naturally, metabolomics also gained terrain. In 2020, Wang Q et al. reported a global prognostic index (GPI) score for operated HCC patients that combines a metabolite panel with satellite nodes for assessing overall survival. Compared with the current clinical classification systems, including the Barcelona clinic liver cancer (BCLC) stage, the tumor node metastasis (TNM) stage, and the albumin-bilirubin (ALBI) grade, the GPI score presented a notable performance according to the time-dependent receiver operating, and might stand as a helpful tool to stratify the HCC prognostic risk after surgery [34]. Other scientists used gas chromatography-mass spectrometry (GC-MS)-based metabolomics, identifying phenylalanine and galactose and including them in two mathematical models to predict the risk of mortality, recurrence, and metastasis with essential results. Moreover, some reports attest to different discriminatory biomarkers between HCC and cirrhosis when performing metabolomics protocols from urine or feces [35,36].
Our study presents several limitations. The number of patients was too small to conduct a complete characterization of biomarkers. These results need to be confirmed in a more significant number of patients. Additionally, more studies with European cohorts need to be performed, as we have compared our results with Chinese patients and there may be differences. Another limitation of our study is the inclusion of HCC patients with different etiologies of the underlying liver disease. Although the underlying etiology in most cases is chronic viral hepatitis C as in the control group, patients with other etiologies have been added to include a sufficient number of patients. One final limitation of our study is the inclusion of 18 patients at the BCLC B stage. Although these patients are classified as at an intermediate stage, they have a preserved liver function and have undergone curative treatments, such as surgery and percutaneous ablation.
Overall, while many metabolites appear to display excellent diagnostic performances in HCC, reproducibility stands as a significant issue to address. In the future, it will be paramount to include patients with decompensated cirrhosis, and intermediary and advanced HCC to broaden the metabolite spectrum of liver disease. In addition, in the literature, we have seen that validation cohorts have a minimal number of studies, most of them retrospective and with no statistical adjustments for important confounding variables such as smoking status, alcohol consumption, lifestyle habits, physical activity, body mass index, or waist circumference. With this in mind, given the rise of HCC developed on non-alcoholic fatty liver disease, it would be far-reaching to conduct a different study assessing this matter. Lipid metabolism is the metabolic hub of NAFLD with bioactive sphingolipids, as a hallmark of NAFLD and NAFLD-derived HCC [37].

5. Conclusions

Due to the high incidence of cancer, and particularly hepatocellular carcinoma, the search for non-invasive biomarkers is crucial in modern medicine. Such markers should be useful in the very early diagnosis of the disease, and in determining the prognosis and monitoring of the disease course and treatment. Moreover, it would be interesting to perform a metabolomic study on patients with hepatic cancer that underwent ablation, trans-arterial chemoembolization, or required systemic treatment to find out which are the best candidates for the treatment, and to monitor the patients appropriately.
In conclusion, our study reveals missing pieces of the lipid puzzle that not only differentiate compensated cirrhosis and early hepatocellular carcinoma, but also identify patients at risk. Specifically, it was determined for the first time that arachidonic acid, myristyl-palmitate, and the family members of phosphatidyl-choline are markers of survival, and might constitute future prognostic biomarkers in a personalized and minimally invasive medicine practice. We believe that by navigating the old maze of lipids discovered years ago, we could find answers to current struggles in hepatology and oncology.

Supplementary Materials

The following supporting information can be downloaded at: https://www.mdpi.com/article/10.3390/jcm11051292/s1, Table S1: Molecules separated and identified (n = 154) by LC-MS: average peak intensities, standard deviation (SD). The m/z values represent [M + 1] values where M- molecular mass; Table S2: Molecules separated and identified (n = 154) by LC-MS: average peak intensities (Id, I), standard deviations (SDd, SD)s for group HCd (n = 13) vs HCs (n = 24). The m/z values represent [M + 1] values where M- molecular mass.

Author Contributions

Conceptualization, I.N., B.P. and H.S.; methodology I.N., I.M., T.M., C.M. and C.S.; software, D.L.; validation, M.G., Z.S., B.P., G.A.F. and H.S.; formal analysis, M.G., G.A.F. and Z.S.; investigation, I.N., I.M. and T.M.; resources, C.M. and C.S.; data curation, H.S.; writing—original draft preparation, I.N.; writing—review and editing, I.N., I.M., T.M. and C.S.; visualization, Z.S.; supervision, G.A.F., B.P., H.S. and C.S.; project administration, H.S.; funding acquisition, M.G. and H.S. All authors have read and agreed to the published version of the manuscript.

Funding

The results of this research were partially funded by the University of Medicine and Pharmacy “Iuliu Hatieganu” (Ph.D. study Iuliana Nenu—4322/01.10.2018), L’OREAL Women for Science award and UEFISCDI through the PN-III-P1-1.2-PCCDI-2017-0221/59PCCDI/2018 (IMPROVE) project.

Institutional Review Board Statement

This study was conducted according to the guidelines of the Declaration of Helsinki, and approved by the Institutional Review Board (or Ethics Committee) of the Regional Institute of Gastroenterology and Hepatology, O. Fodor.

Informed Consent Statement

Informed consent was obtained from all subjects involved in the study.

Data Availability Statement

Not applicable.

Acknowledgments

“Iuliu Hatieganu” University of Medicine and Pharmacy, ACAMed, POCU—125171.

Conflicts of Interest

The authors declare no conflict of interest.

References

  1. Fitzmaurice, C.; Akinyemiju, T.F.; Al Lami, F.H.; Alam, T.; Alizadeh-Navaei, R.; Allen, C.; Alsharif, U.; Alvis-Guzman, N.; Amini, E.; Anderson, B.O.; et al. Global, regional, and national cancer incidence, mortality, years of life lost, years lived with disability, and disability-adjusted life-years for 29 cancer groups, 1990 to 2016 a systematic analysis for the global burden of disease study global burden o. JAMA Oncol. 2018, 4, 1553–1568. [Google Scholar] [CrossRef] [PubMed]
  2. Akinyemiju, T.; Abera, S.; Ahmed, M.; Alam, N.; Alemayohu, M.A.; Allen, C.; Al-Raddadi, R.; Alvis-Guzman, N.; Amoako, Y.; Artaman, A.; et al. The Burden of Primary Liver Cancer and Underlying Etiologies from 1990 to 2015 at the Global, Regional, and National Level. JAMA Oncol. 2017, 3, 1683–1691. [Google Scholar] [CrossRef] [PubMed]
  3. Cabibbo, G.; Enea, M.; Attanasio, M.; Bruix, J.; Craxí, A.; Cammà, C. A meta-analysis of survival rates of untreated patients in randomized clinical trials of hepatocellular carcinoma. Hepatology 2010, 51, 1274–1283. [Google Scholar] [CrossRef] [PubMed] [Green Version]
  4. Chaiteerakij, R.; Addissie, B.D.; Roberts, L.R. Update on Biomarkers of Hepatocellular Carcinoma. Clin. Gastroenterol. Hepatol. 2015, 13, 237–245. [Google Scholar] [CrossRef] [Green Version]
  5. Mocan, T.; Simão, A.L.; Castro, R.E.; Rodrigues, C.M.P.; Słomka, A.; Wang, B.; Strassburg, C.; Wöhler, A.; Willms, A.G.; Kornek, M. Liquid biopsies in hepatocellular carcinoma: Are we winning? J. Clin. Med. 2020, 9, 1514. [Google Scholar] [CrossRef]
  6. Wang, X.; Zhang, A.; Sun, H. Power of metabolomics in diagnosis and biomarker discovery of hepatocellular carcinoma. Hepatology 2013, 57, 2072–2077. [Google Scholar] [CrossRef]
  7. Spratlin, J.L.; Serkova, N.J.; Eckhardt, S.G. Clinical applications of metabolomics in oncology: A review. Clin. Cancer Res. 2009, 15, 431–440. [Google Scholar] [CrossRef] [Green Version]
  8. Hanahan, D. Hallmarks of Cancer: New Dimensions. Cancer Discov. 2022, 12, 31–46. [Google Scholar] [CrossRef]
  9. Nenu, I.; Gafencu, G.A.; Popescu, T.; Kacso, G. Lactate-A new frontier in the immunology and therapy of prostate cancer. J. Cancer Res. Ther. 2017, 13, 406–411. [Google Scholar] [CrossRef]
  10. Nagarajan, S.R.; Butler, L.M.; Hoy, A.J. The diversity and breadth of cancer cell fatty acid metabolism. Cancer Metab. 2021, 9, 1–28. [Google Scholar] [CrossRef]
  11. Wang, M.; Han, J.; Xing, H.; Zhang, H.; Li, Z.; Liang, L.; Li, C.; Dai, S.; Wu, M.; Shen, F.; et al. Dysregulated fatty acid metabolism in hepatocellular carcinoma. Hepatic Oncol. 2016, 3, 241–251. [Google Scholar] [CrossRef] [PubMed]
  12. Krautbauer, S.; Meier, E.M.; Rein-Fischboeck, L.; Pohl, R.; Weiss, T.S.; Sigruener, A.; Aslanidis, C.; Liebisch, G.; Buechler, C. Ceramide and polyunsaturated phospholipids are strongly reduced in human hepatocellular carcinoma. Biochim. Biophys. Acta-Mol. Cell Biol. Lipids 2016, 1861, 1767–1774. [Google Scholar] [CrossRef] [PubMed]
  13. Pyne, N.J.; Pyne, S. Sphingosine 1-phosphate and cancer. Nat. Rev. Cancer 2010, 10, 489–503. [Google Scholar] [CrossRef] [Green Version]
  14. Kunkel, G.T.; MacEyka, M.; Milstien, S.; Spiegel, S. Targeting the sphingosine-1-phosphate axis in cancer, inflammation and beyond. Nat. Rev. Drug Discov. 2013, 12, 688–702. [Google Scholar] [CrossRef] [PubMed] [Green Version]
  15. Grammatikos, G.; Schoell, N.; Ferreirós, N.; Bon, D.; Herrmann, E.; Farnik, H.; Köberle, V.; Piiper, A.; Zeuzem, S.; Kronenberger, B.; et al. Serum sphingolipidomic analyses reveal an upregulation of C16-ceramide and sphingosine-1-phosphate in hepatocellular carcinoma. Oncotarget 2016, 7, 18095–18105. [Google Scholar] [CrossRef] [Green Version]
  16. Buechler, C.; Aslanidis, C. Role of lipids in pathophysiology, diagnosis and therapy of hepatocellular carcinoma. Biochim. Biophys. Acta-Mol. Cell Biol. Lipids 2020, 1865, 158658. [Google Scholar] [CrossRef]
  17. Sun, L.; Beggs, K.; Borude, P.; Edwards, G.; Bhushan, B.; Walesky, C.; Roy, N.; Manley, M.W.; Gunewardena, S.; O’Neil, M.; et al. Bile acids promote diethylnitrosamine-induced hepatocellular carcinoma via increased inflammatory signaling. Am. J. Physiol.-Gastrointest. Liver Physiol. 2016, 311, G91–G104. [Google Scholar] [CrossRef] [Green Version]
  18. Cucchetti, A.; Cescon, M.; Golfieri, R.; Piscaglia, F.; Renzulli, M.; Neri, F.; Cappelli, A.; Mazzotti, F.; Mosconi, C.; Colecchia, A.; et al. Hepatic venous pressure gradient in the preoperative assessment of patients with resectable hepatocellular carcinoma. J. Hepatol. 2016, 64, 79–86. [Google Scholar] [CrossRef]
  19. Bolondi, L.; Burroughs, A.; Dufour, J.F.; Galle, P.R.; Mazzaferro, V.; Piscaglia, F.; Raoul, J.L.; Sangro, B. Heterogeneity of patients with intermediate (BCLC B) Hepatocellular Carcinoma: Proposal for a subclassification to facilitate treatment decisions. Semin Liver Dis. 2012, 32, 348–359. [Google Scholar] [CrossRef]
  20. Ismail, I.T.; Elfert, A.; Helal, M.; Salama, I.; El-Said, H.; Fiehn, O. Remodeling lipids in the transition from chronic liver disease to hepatocellular carcinoma. Cancers 2021, 13, 88. [Google Scholar] [CrossRef]
  21. Cotte, A.K.; Cottet, V.; Aires, V.; Mouillot, T.; Rizk, M.; Vinault, S.; Binquet, C.; De Barros, J.P.P.; Hillon, P.; Delmas, D. Phospholipid profiles and hepatocellular carcinoma risk and prognosis in cirrhotic patients. Oncotarget 2019, 10, 2161–2172. [Google Scholar] [CrossRef] [PubMed]
  22. Che, L.; Chi, W.; Qiao, Y.; Zhang, J.; Song, X.; Liu, Y.; Li, L.; Jia, J.; Pilo, M.G.; Wang, J.; et al. Cholesterol biosynthesis supports the growth of hepatocarcinoma lesions depleted of fatty acid synthase in mice and humans. Gut 2020, 69, 177–186. [Google Scholar] [CrossRef] [PubMed] [Green Version]
  23. Singh, S.; Singh, P.P.; Singh, A.G.; Murad, M.H.; Sanchez, W. Statins are associated with a reduced risk of hepatocellular cancer: A systematic review and meta-analysis. Gastroenterology 2013, 144, 323–332. [Google Scholar] [CrossRef] [PubMed] [Green Version]
  24. Finkelmeier, F.; Kronenberger, B.; Köberle, V.; Bojunga, J.; Zeuzem, S.; Trojan, J.; Piiper, A.; Waidmann, O. Severe 25-hydroxyvitamin D deficiency identifies a poor prognosis in patients with hepatocellular carcinoma-A prospective cohort study. Aliment. Pharmacol. Ther. 2014, 39, 1204–1212. [Google Scholar] [CrossRef] [Green Version]
  25. Liu, H.; Jiang, X.; Qiao, Q.; Chen, L.; Matsuda, K.; Jiang, G.; Yu, T.; Wang, Y.; Lin, H.; Liang, X.; et al. Association of circulating 25-Hydroxyvitamin D and its related genetic variations with hepatocellular carcinoma incidence and survival. Ann. Transl. Med. 2020, 8, 1080. [Google Scholar] [CrossRef] [PubMed]
  26. Lai, G.Y.; Wang, J.B.; Weinstein, S.J.; Parisi, D.; Horst, R.L.; McGlynn, K.A.; Männistö, S.; Albanes, D.; Freedman, N.D. Association of 25-Hydroxyvitamin D with Liver Cancer Incidence and Chronic Liver Disease Mortality in Finnish Male Smokers of the ATBC Study. Cancer Epidemiol. Biomarkers Prev. 2018, 27, 1075–1082. [Google Scholar] [CrossRef] [PubMed] [Green Version]
  27. Guan, Y.; Chen, X.; Wu, M.; Zhu, W.; Arslan, A.; Takeda, S.; Nguyen, M.H.; Majeti, R.; Thomas, D.; Zheng, M.; et al. The phosphatidylethanolamine biosynthesis pathway provides a new target for cancer chemotherapy. J. Hepatol. 2020, 72, 746–760. [Google Scholar] [CrossRef]
  28. Takashima, Y.; Horisawa, K.; Udono, M.; Ohkawa, Y.; Suzuki, A. Prolonged inhibition of hepatocellular carcinoma cell proliferation by combinatorial expression of defined transcription factors. Cancer Sci. 2018, 109, 3543–3553. [Google Scholar] [CrossRef]
  29. Li, Z.; Guan, M.; Lin, Y.; Cui, X.; Zhang, Y.; Zhao, Z.; Zhu, J. Aberrant lipid metabolism in hepatocellular carcinoma revealed by liver lipidomics. Int. J. Mol. Sci. 2017, 18, 2550. [Google Scholar] [CrossRef] [Green Version]
  30. Fisher-Wellman, K.H.; Hagen, J.T.; Neufer, P.D.; Kassai, M.; Cabot, M.C. On the nature of ceramide-mitochondria interactions –Dissection using comprehensive mitochondrial phenotyping. Cell. Signal. 2021, 78, 109838. [Google Scholar] [CrossRef]
  31. Morad, S.A.F.; Cabot, M.C. Ceramide-orchestrated signalling in cancer cells. Nat. Rev. Cancer 2013, 13, 51–65. [Google Scholar] [CrossRef] [PubMed]
  32. Zhou, L.; Liao, Y.; Yin, P.; Zeng, Z.; Li, J.; Lu, X.; Zheng, L.; Xu, G. Metabolic profiling study of early and late recurrence of hepatocellular carcinoma based on liquid chromatography-mass spectrometry. J. Chromatogr. B Anal. Technol. Biomed. Life Sci. 2014, 966, 163–170. [Google Scholar] [CrossRef] [PubMed]
  33. Han, J.; Han, M.; Xing, H.; Li, Z.; Yuan, D.; Wu, H.; Zhang, H.; Wang, M.; Li, C.; Liang, L.; et al. Tissue and serum metabolomic phenotyping for diagnosis and prognosis of hepatocellular carcinoma. Int. J. Cancer 2020, 146, 1741–1753. [Google Scholar] [CrossRef] [PubMed]
  34. Wang, Q.; Su, B.; Dong, L.; Jiang, T.; Tan, Y.; Lu, X.; Liu, X.; Lin, X.; Xu, G. Liquid Chromatography-Mass Spectrometry-Based Nontargeted Metabolomics Predicts Prognosis of Hepatocellular Carcinoma after Curative Resection. J. Proteome Res. 2020, 19, 3533–3541. [Google Scholar] [CrossRef]
  35. Osman, D.; Ali, O.; Obada, M.; El-Mezayen, H.; El-Said, H. Chromatographic determination of some biomarkers of liver cirrhosis and hepatocellular carcinoma in Egyptian patients. Biomed. Chromatogr. 2017, 31, e3893. [Google Scholar] [CrossRef]
  36. Cao, H.; Huang, H.; Xu, W.; Chen, D.; Yu, J.; Li, J.; Li, L. Fecal metabolome profiling of liver cirrhosis and hepatocellular carcinoma patients by ultra performance liquid chromatography-mass spectrometry. Anal. Chim. Acta 2011, 691, 68–75. [Google Scholar] [CrossRef]
  37. Simon, J.; Ouro, A.; Ala-Ibanibo, L.; Presa, N.; Delgado, T.C.; Martínez-Chantar, M.L. Sphingolipids in non-alcoholic fatty liver disease and hepatocellular carcinoma: Ceramide turnover. Int. J. Mol. Sci. 2020, 21, 40. [Google Scholar] [CrossRef] [Green Version]
Figure 1. (a) PLSDA plot with samples’ identification, showing the discrimination between C and HC groups. (b) VIP scores derived from PLSDA loadings.
Jcm 11 01292 g001
Figure 2. (a) Random forest graph showing the mean decrease in accuracy for the molecules as putative biomarkers of differentiation between the HC and C groups. (b) Heatmap showing the clusters and molecules responsible for the differentiation between the HC and C group.
Jcm 11 01292 g002
Figure 3. ROC curves of the most significant metabolites: 1,25-dihydroxy cholesterol (m/z = 419.281), 12-ketodeoxycholic acid (m/z = 391.283), myristyl palmitate (m/z = 453.165), lysoPC (21:4) (m/z = 558.291), lysoPE (22:2) (m/z = 534.286), and arachidonic acid (m/z = 305.145).
Jcm 11 01292 g003
Figure 4. (a) PLSDA plot with samples’ identification, showing the discrimination between the HCd and HCs groups. (b) VIP scores derived from PLSDA loadings.
Jcm 11 01292 g004
Figure 5. (a) Random forest graph showing the mean decrease in accuracy for the molecules as putative biomarkers of differentiation between the HCd and HCs groups. (b) Heatmap showing the clusters and molecules responsible for the differentiation between the HCd and HCs groups.
Jcm 11 01292 g005
Figure 6. Common and specific molecules which were found to discriminate between compensated cirrhosis versus early hepatocellular carcinoma.
Jcm 11 01292 g006
Table 1. Baseline characteristics of the study population.
HCC (Group HC)Cirrhosis (Group C)p Value
General Data
Number3732
Age mean SD *64.62 (6.29)55.97 (8.1)<0.001
Sex, no (%) **
Females 10 (27.03)20 (62.5)
Males27 (72.97)11 (37.5)<0.003
Etiology (%) **
HCV16 (43.24)32 (100%)
HVB6 (16.21)
Alcohol12 (32.4)
Cholestatic1 (2.7)
NAFLD2 (5.4) <0.01
Dead (yes), no (%)13 (35.13)1 (3.33)<0.001
Laboratory values
ALAT *37 (21–59)74.5 (46.25–108.25)0.015
ASAT *57 (35–82)72.5 (52.25–97.75)0.76
γGT *61 (33.5–91.5)60 (42–129)0.67
Total bilirubin *1 (0.8–1.6)1.15 (0.9–1.35)0.67
Creatinine *0.73 (0.61–0.95)0.72 (0.58–0.84)0.2
Albumin *3.8 (3.6–4.1)4.1 (4–4.3)<0.01
Hemoglobin *14.2 (12.2–15.2)14.5 (13.7–15.8)0.06
PMN count *3.37 (2.5–4.62)3.11 (2.52–3.95)0.089
Platelet count*117 (82–147)103 (79–144.5)0.725
Na *140 (138–142)140 (139–143.25)0.3
K *4.3 (4.07–4.6)3.9 (3.8–4.3)0.012
AFP *10.1 (5.5–58.8)13.5 (8.33–19.62)0.016
The severity of Liver Disease
Child–Pugh **
A31 (74.1%)32 (100%)<0.01
B6 (22.2%)
MELD **
≤916 (43.24%)19 (59.38%)0.23
10–191 (2.7%)13 (40.62 %)
20 (54.5%)
Portal pressure *
HVPG15 (11–18)14 (11–16)0.448
HCC staging
BCLC **
04 (11%)
A15 (40%)
B18 (49%)
Tumor number **
<334 (91.89%)
3–53 (8.11%)
>50
Milan criteria **
In19 (51.35%)
Out18 (48.65%)
* = values expressed as median IQR; ** = values expressed as absolute value + per cents; AFP = alpha-feto protein; HCC = hepatocellular carcinoma; p = level of significance; HCV = hepatitis C virus; HBV = hepatitis B virus; NAFLD = non-alcoholic fatty liver disease; ALAT = alanine aminotransferase; ASAT = aspartate aminotransferase; Γgt = gamma glutamyl transferase; Na = sodium; K = potassium; MELD = model for end stage liver disease; HVPG = hepatic venous pressure gradient; BCLC = Barcelona clinic liver cancer.
Table 2. Metabolites separated and identified in different patient groups (HC, C, HCd, and HCs) and the ratios of their levels in the groups HC vs. C, and HCd vs. HCs.
m/z HC/CHCd/HCsm/z HC/CHCd/HCs
Steroids, Incl.Bile AcidsFatty Acid Derivatives
419.2811,25 DiOH cholesterol6.900.96453.165Myristyl palmitate4.120.97
391.28312-Ketodeoxycholic acid3.240.89313.255Icosanoic (arahidic) acid C20:02.250.93
413.26525-hydroxy vitamin D23.060.89331.284Docosapentenoic acid (C22:5)2.070.95
409.328Ursocholic acid1.380.9303.181Eicosapentenoic acid (C20:5)1.850.86
473.3273-Sulfodeoxycholic acid1.360.91425.130Lauryl palmitate1.831.09
271.264Estrone1.171.13325.250Methyl-7-eicosenoic acid1.790.92
585.268Cholic acid glucuronide1.141.19318.291N-methyl arachidonoyl amine1.761.07
289.159Testosterone/DHEA1.141.02397.268Hexacosanoic acid (C26:0)1.591.02
421.338Dihomodeoxycholic acid0.600.92427.390N-stearoyl arginine1.231.03
369.295Testosterone sulfate/DHEAS0.550.92326.354Oleoyl Ethanolamide1.171.03
273.174Estradiol0.500.7350.338Dihomo-gamma-linolenoyl (C18:3) Ethanolamine1.101.01
Oxylipins299.1262-hydroxy oleic acid (C18:1)1.061.04
353.271Prostaglandin E22.540.93338.341Docosenamide (C22)1.021.01
267.266Tetranor 12-HETE1.150.96324.325Linoleoyl ethanolamide1.010.95
406.32815-HETE-GABA0.490.77341.298Docosanoic acid (C22:0)0.940.96
383.20712-Oxo-trihydroxy-leukotriene B40.221.06348.319O-Arachidonoyl (C20:4, n-6) Ethanolamine0.861.06
Acyl carnitines269.217Heptadecenoic acid (C17:1)0.651.03
414.289Heptadecanoyl carnitine3.922.47501.375Palmitoleyl linolenate0.550.93
290.261Adipoyl carnitine2.811.09301.142Eicosahexaenoic acid (C20:6)0.450.96
316.317Decanoylcarnitine1.901.1529.407Linoleyl linoleate0.431.04
304.295Pimelyl carnitine1.781.03285.282Stearic acid0.421.06
288.266Octanoyl carnitine1.661.08295.1822-Hydroxy linolenic acid (C16:3)0.400.97
230.24Butenyl carnitine1.281.01279.160Linolenic acid (C18:3)0.330.98
332.3273-hydroxydecanoyl carnitine1.210.99163.052Hydroxy adipic acid0.261.18
312.326Decadienoyl carnitine1.181.01249.189Hexadecatetraenoic acid C16:40.221.05
374.259Dodecanedioylcarnitine1.150.93229.131Myristic acid (C14)0.211.03
388.3553-Hydroxytetradecanoyl carnitine1.091.04257.204Palmitic acid (C16:0)0.200.93
310.308Decatrienoyl carnitine0.980.93339.366Dimethyl-2-eicosenoic acid (C22)0.161.09
Aminoacid and choline derivatives245.077Hydroxy myristic acid (C14)0.141.02
258.265Glycerophosphocholine1.691.02305.145Arahidonic acid (C20:4)2.831.51
166.073Phenyl alanine1.100.94415.209Ascorbyl palmitate2.940.99
183.082Phosphoryl choline0.460.98Sphingolipids
161.1Tryptamine0.430.59274.265C16-Sphingosine1.641.07
149.024Methionine0.270.98526.518Ceramide (d18:1/14:0 (2OH))1.491.05
158.15Tiglylglycine0.121.08554.547Ceramide (d18:1/16:0 (2OH))1.101.04
171.14Glyceraldehyde 3-phosphate0.061.04354.360C16 Sphinganine 1-P0.991.03
364.346a-linolenyl choline (C18:3)0.630.96623.245Ceramide (d18:1/22:0)0.881
366.374a-linoleyl choline (C18:2)0.871.09584.464Ceramide (d18:0/18:0 (2OH))0.630.99
Lyso Phospholipids582.576Ceramide (d18:1/18:0 (2OH))0.611.08
558.291LysoPC (21:4)2.831.07628.495Ceramide (t18:0/20:0 (2OH))0.580.98
522.357LysoPC (18:1)2.111.06540.441Ceramide (d18:0/16:0)0.581
534.286LysoPE (22:2)2.081.09672.525GlycoCeramide (d18:1/14:0)0.580.93
437.191LysoPA (18:1/0:0)1.890.99703.574Sphingomyelin 18:2/16:00.501
524.37LysoPC (18:0)1.681.02496.419Ceramide (d15:1/16:0)0.490.97
482.338LysoPE (18:0)1.541.25596.512Ceramide (d20:0/18:0)0.481.28
483.121LysoPA (22:6/0:0)1.511.23508.459Ceramide (d18:2/14:0) & isom.0.471.05
510.372LysoPE (20:0)1.491.21568.469Ceramide (d18:0/18:0)0.451.23
480.332LysoPE (18:1)1.421.18524.448Ceramide (d14:1/18:1 (2OH)) isomizom0.391.31
520.342LysoPC (18:2)1.411.16612.503Ceramide (d18:0/20:0 (2OH))0.361.08
495.297LysoPA (22:0/0:0)1.380.97Monoacyl glycerols
546.354LysoPC (20:3)1.351.06379.263MG (20:4/0:0/0:0)1.450.83
491.371LysoPA (22:2/0:0)1.251.14359.313MG (18:0/0:0/0:0)1.150.98
494.329LysoPC (16:1)1.221.27381.304MG (20:3/0:0/0:0)1.031.02
544.341LysoPC (20:4)1.221.01357.093MG (18:1/0:0/0:0)0.781.05
568.342LysoPC (22:6)1.111.03403.234MG (22:6/0:0/0:0)0.220.96
502.299LysoPE (20:4)1.090.9355.358MG (0:0/18:2/0:0)0.151.08
454.294LysoPE (16:0)1.080.97Diacyl glycerols
518.325LysoPC (18:3)0.980.98643.283DG (18:0/20:5/0:0)1.960.59
496.342LysoPC (16:0)0.90.91591.15DG (16:0/18:3/0:0)1.61.14
542.323LysoPC (20:5)0.881.04609.161DG (18:1/17:0/0:0)1.61.17
508.359LysoPE (20:1)0.740.93631.144DG (18:4/19:0/0:0)1.231.09
545.402LysoPI (14:0/0:0)0.631.02561.403DG (14:1/18:3/0:0)1.070.93
452.392LysoPE (16:1)0.510.92607.251DG (18:2/17:0/0:0)1.011.03
478.32LysoPE (18:2)0.440.52617.259DG (18:2/18:2/0:0)0.961.16
480.424Lyso PC (O-16:1/0:0)0.431.42663.457DG (20:4/20:5/0:0)0.910.99
Glycerophospholipids599.247DG (18:4/17:2/0:0)0.851.07
780.553PC (36:5) [M + H]2.051.29601.264DG (18:3/17:2/0:0)0.831.09
758.568PC (34:2) [M + H]1.091.01615.244DG (18:2/18:3/0:0)0.771.11
816.59PC (38:2) [M + H]0.991.08603.22DG (18:2/17:2/0:0)0.661.2
744.585PE (36:2)0.961.17589.428DG (16:1/18:3/0:0)0.621.01
784.583PC (36:3) [M + H]0.951.06513.415DG (12:0/16:0/0:0)0.561.04
760.582PC (34:1) [M + H]0.920.98635.143DG (18:2/19:0/0:0)0.480.94
734.569PC (32:0) [M + H]0.901.1633.147DG (18:3/19:0/0:0)0.460.9
810.596PC (36:1) [M + Na]0.831.41579.294DG (16:1/17:1/0:0)0.370.94
808.582PC (36:2) [M + Na]0.801.24665.582DG (20:3/20:5/0:0)0.071.36
633.254PA (O-16:0/16:1)0.791.08Phosphoglycerols
786.602PC (36:2) [M + H]0.781.02509.322PG (18:2/0:0)1.320.78
806.568PC (36:3) [M + Na]0.760.93483.347PG (16:1/0:0)0.880.81
782.564PC (36:4)[M + H]0.691.14485.376PG (16:0/0:0)0.481.2
804.55PC (36:4) [M + Na]0.241709.164PG (O-16:0/16:0)0.260.85
704.21PC (30:1)0.240.83707.167PG (O-16:0/16:1)0.260.84
702.213PC (30:2)0.230.83
Table 3. The m/z values and identification of molecules with the most significant differences between the HC and C groups, based on the p values (from t-tests), fold-change, and Log2FC showing the tendency of evolution in the HC vs. C groups. I—Increase; D—decrease.
m/zIdentificationp ValueFCLog2FCTendency HC vs. C
419.2811,25-dihydroxy cholesterol5.94 × 10−265.982.5805I
453.165Myristyl palmitate1.45 × 10−243.351.7482I
391.28312-keto deoxycholic acid2.36 × 10−182.611.385I
534.286lysoPE (22:2)3.82 × 10−182.031.1245I
558.291LysoPC (21:4)5.62 × 10−172.171.1177I
413.26525-hydroxy vitamin D26.06 × 10−192.481.3153I
355.358MG (18:2/0:0/0:0)1.34 × 10−180.12−3.0437D
612.503Ceramide (d18:0/20:0 (2OH))3.56 × 10−190.28−1.8195D
171.140Decenoic acid (C10:0)2.40 × 10−170.04−4.4131D
707.167PG (O-16:0/16:1)1.83 × 10−160.20−2.3198D
163.052Hydroxy adipic acid4.27 × 10−160.21−2.22D
709.164PG (O-16:0/16:0)8.98 × 10−160.20−2.3214D
513.415PG (18:0/0:0)1.04 × 10−150.44−1.1718D
508.459Ceramide (d18:2/14:0) & isom1.42 × 10−150.37−1.4338D
339.366Dimethyl eicosanoic acid (C20:1)1.67 × 10−150.13−2.8875D
415.209Ascorbyl palmitate3.74 × 10−132.501.3232D
702.213PC (30:2)1.31 × 10−140.17−2.5291D
704.210PC (30:1)6.58 × 10−150.18−2.4645D
596.512Cer (d18:0/20:0) and isom2.41 × 10−130.37−1.3964D
524.448Ceramide (d18:1/15:0)7.40 × 10−130.30−1.6999D
568.459Ceramide (d18:0/18:0)1.37 × 10−120.35−1.4968D
529.407Linoleyl linoleate & isomers1.72 × 10−140.33−1.5771D
496.419Ceramide (d15:1/16:0)1.04 × 10−120.41−1.2777D
149.024Methionine2.63 × 10−130.21−2.2327D
249.189C16:4 fatty acid2.46 × 10−150.18−2.4734D
257.204Palmitic acid C16:04.62 × 10−120.15−2.7155D
383.20716,16-dimethyl-PGE14.46 × 10−40.15−2.6836D
Table 4. The m/z values and molecules with an AUC >0.989, where the most significant p-values show the variations between the HC and C groups. The value and sign of the Log2FC score show the decrease (D) or increase (I) of molecule variation (negative values are associated with increases in molecules in the HC group, and positive values with decreases in the HC group). I—increase; D—decrease.
m/zIdentificationp Value
(t-Tests)
Log2 FCVariation (HC vs. C)
419.2811,25 dihydroxy Cholesterol1.5071 × 10−33−2.138I
453.165Myristyl palmitate1.4840 × 10−29−2.041I
558.291LysoPC (21:4)9.5558 × 10⁻²⁴−1.501I
534.286LysoPE (22:2)7.8846 × 10⁻¹⁸−1.056I
513.415PG (18:0/0:0)5.1513 × 10−280.838D
508.459Ceramide (d18:2/14:0) & isom1.2346 × 10−321.092D
633.147DG (18:3/19:0/0:0)[iso2]5.7123 × 10−131.113D
612.503Ceramide (d18:0/20:0 (2OH))2.3868 × 10−281.481D
709.164PG (O-16:0/16:0)2.9093 × 10−341.953D
707.167PG (O-16:0/16:1)6.0675 × 10−401.953D
704.21PC (30:1)2.3366 × 10−432.079D
702.213PC (30:2)2.4668 × 10−362.142D
339.366Dimethyl eicosanoic acid (C20:1)9.6275 × 10−152.602D
355.358MG (0:0/18:2/0:0)8.10591 × 10−192.750D
171.14Decenoic acid (C10:0)5.9068 × 10−224.051D
Table 5. Unadjusted hazard ratio with Cox proportional hazard method for death in lipid HCC metabolism and multivariate analysis of lipid components when adjusted to MELD and HVPG.
Univariate AnalysisMultivariate Analysis
ParameterHR95% CIpHR95%CIp
Arachidonic acid1.56 (0.52–4.69)0.42912.08 (2.95–49.93)0.027
1,25 dihydroxy Cholesterol5.29 (1.86–15.08)0.00210.61 (1.37–82.3)0.024
Myristyl palmitate16.67 (2.3–120.69)0.00531.63 (1.51–661.66)0.026
12-keto deoxycholic acid4.96 (1.45–17)0.01112.98 (1.39–121.39)0.025
LysoPC (21:4)4.86 (1.81–13.01)0.00210.46 (1.41–77.54)0.022
LysoPE (22:2)1.54 (1.16–2.03)0.0022.37 (1.07–5.24)0.032
MELD = model for end-stage liver disease; HVPG = hepatic venous pressure gradient; lysoPC = lysophosphatidylcholine; lysoPE = lysophosphatidylethanolamine.
Table 6. Molecules with VIP scores > 1.5 (see Figure 3) and MDA values > 0.01 (see Figure 4).
m/zIdentificationAUCp-ValueHCd vs. HCm/zIdentificationAUCp-ValueHCd vs. HC
702.213PC (30:2)0.8200.027D391.28312-Ketodeoxycholic acid0.7140.064D
704.210PC (30:1)0.8070.017D413.26525-hydroxy vitamin D20.6920.072D
707.167PG (O-16:0/16:1)0.8040.025D273.174Estradiol0.6920.061D
709.164PG (O-16:0/16:0)0.7910.025D483.121PG (16:1/0:0)0.6840.064I
509.322PG (18:2/0:0)0.7720.017D501.375Palmitoleyl linolenate0.6820.062D
810.596PC (36:1)0.7620.034I633.254PA (O-16:0/16:1)0.6390.085D
494.329LysoPC (16:1)0.7610.017I591.150DG (16:0/18:3/0:0)0.6370.127I
414.289Heptadecanoyl carnitine0.6420.046I496.342LysoPC (16:0)0.6340.139D
672.525GlycoCeramide (d18:1/14:0)0.6310.160D631.144DG (18:4/19:0/0:0)0.6250.240I
784.583PC (36:3)<0.600>0.05I310.308Decatrienoyl carnitine<0.600>0.05D
Publisher’s Note: MDPI stays neutral with regard to jurisdictional claims in published maps and institutional affiliations.

