
Temporal Trends in Renal Replacement Therapy in Community-Based People with or without Type 2 Diabetes: The Fremantle Diabetes Study

 ,
, 
Abstract
:1. Introduction
2. Patients and Methods
2.1. Study Site, Participants, and Approvals
2.2. Baseline and Annual Assessments
2.3. Ascertainment of Incident Renal Replacement Therapy
2.4. Statistical Analysis
3. Results
3.1. Participant Characteristics
3.2. Incident RRT by Type 2 Diabetes Status and FDS Phase
3.3. Determinants of Incident Renal Replacement Therapy
3.4. Predictors of Outcomes in Pooled FDS1 and FDS2 Type 2 Diabetes Datasets
4. Discussion
Supplementary Materials
Author Contributions
Funding
Institutional Review Board Statement
Informed Consent Statement
Data Availability Statement
Acknowledgments
Conflicts of Interest
References
- Davis, W.; Gregg, E.W.; Davis, T.M.E. Temporal trends in cardiovascular complications in people with or without type 2 diabetes: The Fremantle Diabetes Study. J. Clin. Endocrinol. Metab. 2020, 105, e2471–e2482. [Google Scholar] [CrossRef] [PubMed]
- Gregg, E.; Li, Y.; Wang, J.; Burrows, N.R.; Ali, M.K.; Rolka, D.; Williams, D.E.; Geiss, L. Changes in diabetes-related complications in the United States, 1990–2010. N. Engl. J. Med. 2014, 370, 1514–1523. [Google Scholar] [CrossRef] [Green Version]
- Luk, A.O.; Hui, E.M.; Sin, M.-C.; Yeung, C.-Y.; Chow, W.-S.; Ho, A.Y.; Hung, H.-F.; Kan, E.; Ng, C.-M.; So, W.-Y.; et al. Declining trends of cardiovascular-renal complications and mortality in type 2 diabetes: The Hong Kong Diabetes Database. Diabetes Care 2017, 40, 928–935. [Google Scholar] [CrossRef] [PubMed] [Green Version]
- Harding, J.L.; Pavkov, M.E.; Magliano, D.J.; Shaw, J.E.; Gregg, E.W. Global trends in diabetes complications: A review of current evidence. Diabetologia 2019, 62, 3–16. [Google Scholar] [CrossRef] [PubMed] [Green Version]
- Gregg, E.W.; Cheng, Y.J.; Srinivasan, M.; Lin, J.; Geiss, L.S.; Albright, A.L.; Imperatore, G. Trends in cause-specific mortality among adults with and without diagnosed diabetes in the USA: An epidemiological analysis of linked national survey and vital statistics data. Lancet 2018, 391, 2430–2440. [Google Scholar] [CrossRef]
- Harding, J.L.; Shaw, J.E.; Peeters, A.; Guiver, T.; Davidson, S.; Magliano, D.J. Mortality trends among people with type 1 and type 2 diabetes in Australia: 1997–2010. Diabetes Care 2014, 37, 2579–2586. [Google Scholar] [CrossRef] [Green Version]
- Dodd, A.H.; Colby, M.S.; Boye, K.S.; Fahlman, C.; Kim, S.; Briefel, R.R. Treatment approach and HbA1c control among US adults with type 2 diabetes: NHANES 1999–2004. Curr. Med. Res. Opin. 2009, 25, 1605–1613. [Google Scholar] [CrossRef]
- Ford, E.S. Trends in the control of risk factors for cardiovascular disease among adults with diagnosed diabetes: Findings from the National Health and Nutrition Examination Survey 1999–2008. J. Diabetes. 2011, 3, 337–347. [Google Scholar] [CrossRef]
- Kuznik, A.; Mardekian, J. Trends in utilization of lipid- and blood pressure-lowering agents and goal attainment among the U.S. diabetic population, 1999–2008. Cardiovasc. Diabetol. 2011, 10, 31. [Google Scholar] [CrossRef] [Green Version]
- Gregg, E.W.; Hora, I.; Benoit, S.R. Resurgence in diabetes-related complications. JAMA 2019, 321, 1867–1868. [Google Scholar] [CrossRef] [Green Version]
- Wang, L.; Li, X.; Wang, Z.; Bancks, M.P.; Carnethon, M.R.; Greenland, P.; Feng, Y.-Q.; Wang, H.; Zhong, V.W. Trends in prevalence of diabetes and control of risk factors in diabetes among US adults, 1999–2018. JAMA 2021, 326, 704. [Google Scholar] [CrossRef] [PubMed]
- Pearson-Stuttard, J.; Bennett, J.; Cheng, Y.J.; Vamos, E.P.; Cross, A.J.; Ezzati, M.; Gregg, E.W. Trends in predominant causes of death in individuals with and without diabetes in England from 2001 to 2018: An epidemiological analysis of linked primary care records. Lancet Diabetes Endocrinol. 2021, 9, 165–173. [Google Scholar] [CrossRef]
- Claessen, H.; Narres, M.; Kvitkina, T.; Wilk, A.; Friedel, H.; Günster, C.; Hoffmann, F.; Koch, M.; Jandeleit-Dahm, K.; Icks, A. Renal replacement therapy in people with and without diabetes in Germany, 2010–2016: An analysis of more than 25 million inhabitants. Diabetes Care 2021, 44, 1291–1299. [Google Scholar] [CrossRef] [PubMed]
- Koye, D.N.; Magliano, D.; Reid, C.M.; Pavkov, M.E.; Chadban, S.J.; McDonald, S.P.; Polkinghorne, K.R.; White, S.; Paul, C.; Shaw, J.E. Trends in Incidence of ESKD in People With Type 1 and Type 2 Diabetes in Australia, 2002–2013. Am. J. Kidney Dis. 2019, 73, 300–308. [Google Scholar] [CrossRef] [PubMed]
- Laowahutanon, T.; Nakamura, H.; Tachimori, H.; Nomura, S.; Liabsuetrakul, T.; Lim, A.; Rawdaree, P.; Suchonwanich, N.; Yamamoto, H.; Ishizuka, A.; et al. Hospital admission for type 2 diabetes mellitus under the Universal Coverage Scheme in Thailand: A time- and geographical-trend analysis, 2009–2016. PLoS ONE 2021, 16, e0253434. [Google Scholar] [CrossRef] [PubMed]
- Navarra, S.; Solini, A.; Baroni, M.G.; Frova, L.; Grande, E. A long-term nationwide study on chronic kidney disease-related mortality in Italy: Trends and associated comorbidity. J. Nephrol. 2021, in press. [Google Scholar] [CrossRef] [PubMed]
- Assogba, F.G.; Couchoud, C.; Hannedouche, T.; Villar, E.; Frimat, L.; Fagot-Campagna, A.; Jacquelinet, C.; Stengel, B. Trends in the epidemiology and care of diabetes mellitus-related end-stage renal disease in France, 2007–2011. Diabetologia 2014, 57, 718–728. [Google Scholar] [CrossRef]
- Kukla, A.; Ventura-Aguiar, P.; Cooper, M.; de Koning, E.J.; Goodman, D.J.; Johnson, P.R.; Han, D.J.; Mandelbrot, D.A.; Pavlakis, M.; Saudek, F.; et al. Transplant options for patients with diabetes and advanced kidney disease: A review. Am. J. Kidney Dis. 2021, 78, 418–428. [Google Scholar] [CrossRef]
- Regmi, S.; Rattanavich, R.; Villicana, R. Kidney and pancreas transplant candidacy. Curr. Opin. Organ. Transplant. 2021, 26, 62–68. [Google Scholar] [CrossRef]
- Smart, N.; Dieberg, G.; Ladhani, M.; Titus, T. Early referral to specialist nephrology services for preventing the progression to end-stage kidney disease. Cochrane Database Syst. Rev. 2014, CD007333. [Google Scholar] [CrossRef]
- Clark-Cutaia, M.N.; Rivera, E.; Iroegbu, C.; Squires, A. Disparities in chronic kidney disease-the state of the evidence. Curr. Opin. Nephrol. Hypertens. 2021, 30, 208–214. [Google Scholar] [CrossRef] [PubMed]
- Johansen, K.L.; Chertow, G.M.; Foley, R.N.; Gilbertson, D.T.; Herzog, C.A.; Ishani, A.; Israni, A.K.; Ku, E.; Tamura, M.K.; Li, S.; et al. US Renal Data System 2020 annual data report: Epidemiology of kidney disease in the United States. Am. J. Kidney Dis. 2021, 77, A7–A8. [Google Scholar] [CrossRef] [PubMed]
- Tjaden, L.A.; Noordzij, M.; Van Stralen, K.J.; Kuehni, C.E.; Raes, A.; Cornelissen, E.A.M.; O’Brien, C.; Papachristou, F.; Schaefer, F.; Groothoff, J.W.; et al. Racial disparities in access to and outcomes of kidney transplantation in children, adolescents, and young adults: Results from the ESPN/ERA-EDTA (European Society of Pediatric Nephrology/European Renal Association-European Dialysis and Transplant Association) Registry. Am. J. Kidney Dis. 2016, 67, 293–301. [Google Scholar] [PubMed]
- McDonald, S.P.; Russ, G.R. Burden of end-stage renal disease among indigenous peoples in Australia and New Zealand. Kidney Int. 2003, 63, S123–S127. [Google Scholar] [CrossRef]
- Davis, T.; Bruce, D.; Davis, W. Cohort profile: The Fremantle Diabetes Study. Int. J. Epidemiol. 2013, 42, 412–421. [Google Scholar] [CrossRef] [Green Version]
- Australian Bureau of Statistics. Socio-Economic Indexes for Areas. 2013. Available online: http://www.abs.gov.au/websitedbs/censushome.nsf/home/seifa (accessed on 1 November 2021).
- Davis, T.M.E.; Zimmet, P.; Davis, W.A.; Bruce, D.G.; Fida, S.; Mackay, I.R. Autoantibodies to glutamic acid decarboxylase in diabetic patients from a multi-ethnic Australian community: The Fremantle Diabetes Study. Diabet Med. 2000, 17, 667–674. [Google Scholar] [CrossRef]
- Davis, T.M.; Hunt, K.; McAullay, D.; Chubb, S.A.; Sillars, B.A.; Bruce, D.G.; Davis, W.A. Continuing disparities in cardiovascular risk factors and complications between aboriginal and Anglo-Celt Australians with type 2 diabetes: The Fremantle Diabetes Study. Diabetes Care 2012, 35, 2005–2011. [Google Scholar] [CrossRef] [Green Version]
- Norman, P.E.; Davis, W.A.; Bruce, D.G.; Davis, T.M. Peripheral arterial disease and risk of cardiac death in type 2 diabetes: The Fremantle Diabetes Study. Diabetes Care 2006, 29, 575–580. [Google Scholar] [CrossRef] [Green Version]
- Levey, A.S.; Bosch, J.P.; Lewis, J.B.; Greene, T.; Rogers, N.; Roth, D. A more accurate method to estimate glomerular filtration rate from serum creatinine: A new prediction equation. Modification of Diet in Renal Disease Study Group. Ann. Intern. Med. 1999, 130, 461–470. [Google Scholar] [CrossRef]
- Feldman, E.L.; Stevens, M.J.; Thomas, P.K.; Brown, M.B.; Canal, N.; A Greene, D. A practical two-step quantitative clinical and electrophysiological assessment for the diagnosis and staging of diabetic neuropathy. Diabetes Care 1994, 17, 1281–1289. [Google Scholar] [CrossRef]
- Holman, C.D.J.; A Bass, J.; Rosman, D.L.; Smith, M.B.; Semmens, J.B.; Glasson, E.J.; Brook, E.L.; Trutwein, B.; Rouse, I.L.; Watson, C.R.; et al. A decade of data linkage in Western Australia: Strategic design, applications and benefits of the WA data linkage system. Aust. Health Rev. 2008, 32, 766–777. [Google Scholar] [CrossRef] [PubMed]
- Charlson, M.E.; Pompei, P.; Ales, K.L.; MacKenzie, C.R. A new method of classifying prognostic comorbidity in longitudinal studies: Development and validation. J. Chronic. Dis. 1987, 40, 373–383. [Google Scholar] [CrossRef]
- Grace, B.S.; Clayton, P.; Mcdonald, S.P. Increases in renal replacement therapy in Australia and New Zealand: Understanding trends in diabetic nephropathy. Nephrology 2012, 17, 76–84. [Google Scholar] [CrossRef] [PubMed]
- Sasso, F.C.; Pafundi, P.C.; Simeon, V.; De Nicola, L.; Chiodini, P.; Galiero, R.; Rinaldi, L.; Nevola, R.; Salvatore, T.; Sardu, C.; et al. Efficacy and durability of multifactorial intervention on mortality and MACEs: A randomized clinical trial in type-2 diabetic kidney disease. Cardiovasc. Diabetol. 2021, 20, 145. [Google Scholar] [CrossRef] [PubMed]
- Minutolo, R.; Sasso, F.C.; Chiodini, P.; Cianciaruso, B.; Carbonara, O.; Zamboli, P.; Tirino, G.; Pota, A.; Torella, R.; Conte, G.; et al. Management of cardiovascular risk factors in advanced type 2 diabetic nephropathy: A comparative analysis in nephrology, diabetology and primary care settings. J. Hypertens. 2006, 24, 1655–1661. [Google Scholar] [CrossRef] [PubMed]
- Pagidipati, N.J.; Deedwania, P. A Comprehensive cardiovascular-renal-metabolic risk reduction approach to patients with type 2 diabetes mellitus. Am. J. Med. 2021, 134, 1076–1084. [Google Scholar] [CrossRef]
- Spencer, J.L.; Hoy, W.E.; Silva, D.T.; Snelling, P. An epidemic of renal failure among Australian Aboriginals. Med. J. Aust. 1998, 168, 537–541. [Google Scholar] [CrossRef]
- Hamilton, E.J.; Davis, W.A.; Siru, R.; Baba, M.; Norman, P.E.; Davis, T.M.E. Temporal trends in incident hospitalization for diabetes-related foot ulcer in type 2 diabetes: The Fremantle Diabetes Study. Diabetes Care 2021, 44, 722–730. [Google Scholar] [CrossRef]
- Htike, Z.Z.; Webb, D.; Khunti, K.; Davies, M. Emerging epidemic and challenges of type 2 diabetes in young adults. Diabetes Manag. 2015, 5, 473–483. [Google Scholar] [CrossRef]
- Fox, C.S.; Matsushita, K.; Woodward, M.; Bilo, H.J.; Chalmers, J.; Heerspink, H.J.L.; Lee, B.J.; Perkins, R.M.; Rossing, P.; Sairenchi, T.; et al. Associations of kidney disease measures with mortality and end-stage renal disease in individuals with and without diabetes: A meta-analysis. Lancet 2012, 380, 1662–1673. [Google Scholar] [CrossRef] [Green Version]
- Australian Bureau of Statistics. Aboriginal and Torres Strait Islander Peoples. 2018. Available online: https://www.abs.gov.au/statistics/people/aboriginal-and-torres-strait-islander-peoples (accessed on 1 November 2021).
- Yamada, T.; Wakabayashi, M.; Bhalla, A.; Chopra, N.; Miyashita, H.; Mikami, T.; Ueyama, H.; Fujisaki, T.; Saigusa, Y.; Yamaji, T.; et al. Cardiovascular and renal outcomes with SGLT-2 inhibitors versus GLP-1 receptor agonists in patients with type 2 diabetes mellitus and chronic kidney disease: A systematic review and network meta-analysis. Cardiovasc. Diabetol. 2021, 20, 14. [Google Scholar] [CrossRef] [PubMed]

| FDS1 Type 2 Diabetes | FDS1 No Diabetes | FDS2 Type 2 Diabetes | FDS2 No Diabetes | p-Value | |
|---|---|---|---|---|---|
| Number (%) | 1291 | 5159 | 1509 | 6036 | |
| Age at FDS entry (years) | 64.0 ± 11.2 | 64.0 ± 11.2 | 65.4 ± 11.7 **,††† | 65.4 ± 11.7 ***,††† | <0.001 |
| Sex (% male) | 48.7 | 48.7 | 51.8 | 51.8 †† | 0.005 |
| Aboriginal Australian (%) | 1.5 | - | 7.1 | - | - |
| History of hospitalization for/with RRT a (%) | 0.2 | 0.2 | 0.8 †† | 0.1 ‡‡‡ | <0.001 |
| Charlson Comorbidity Index b (%) | *** | **,††† | ***,‡‡‡ | <0.001 | |
| 0 | 71.6 | 85.6 | 75.1 | 86.5 | |
| 1–2 | 22.0 | 11.1 | 16.8 | 9.8 | |
| ≥3 | 6.4 | 3.3 | 8.0 | 3.7 |
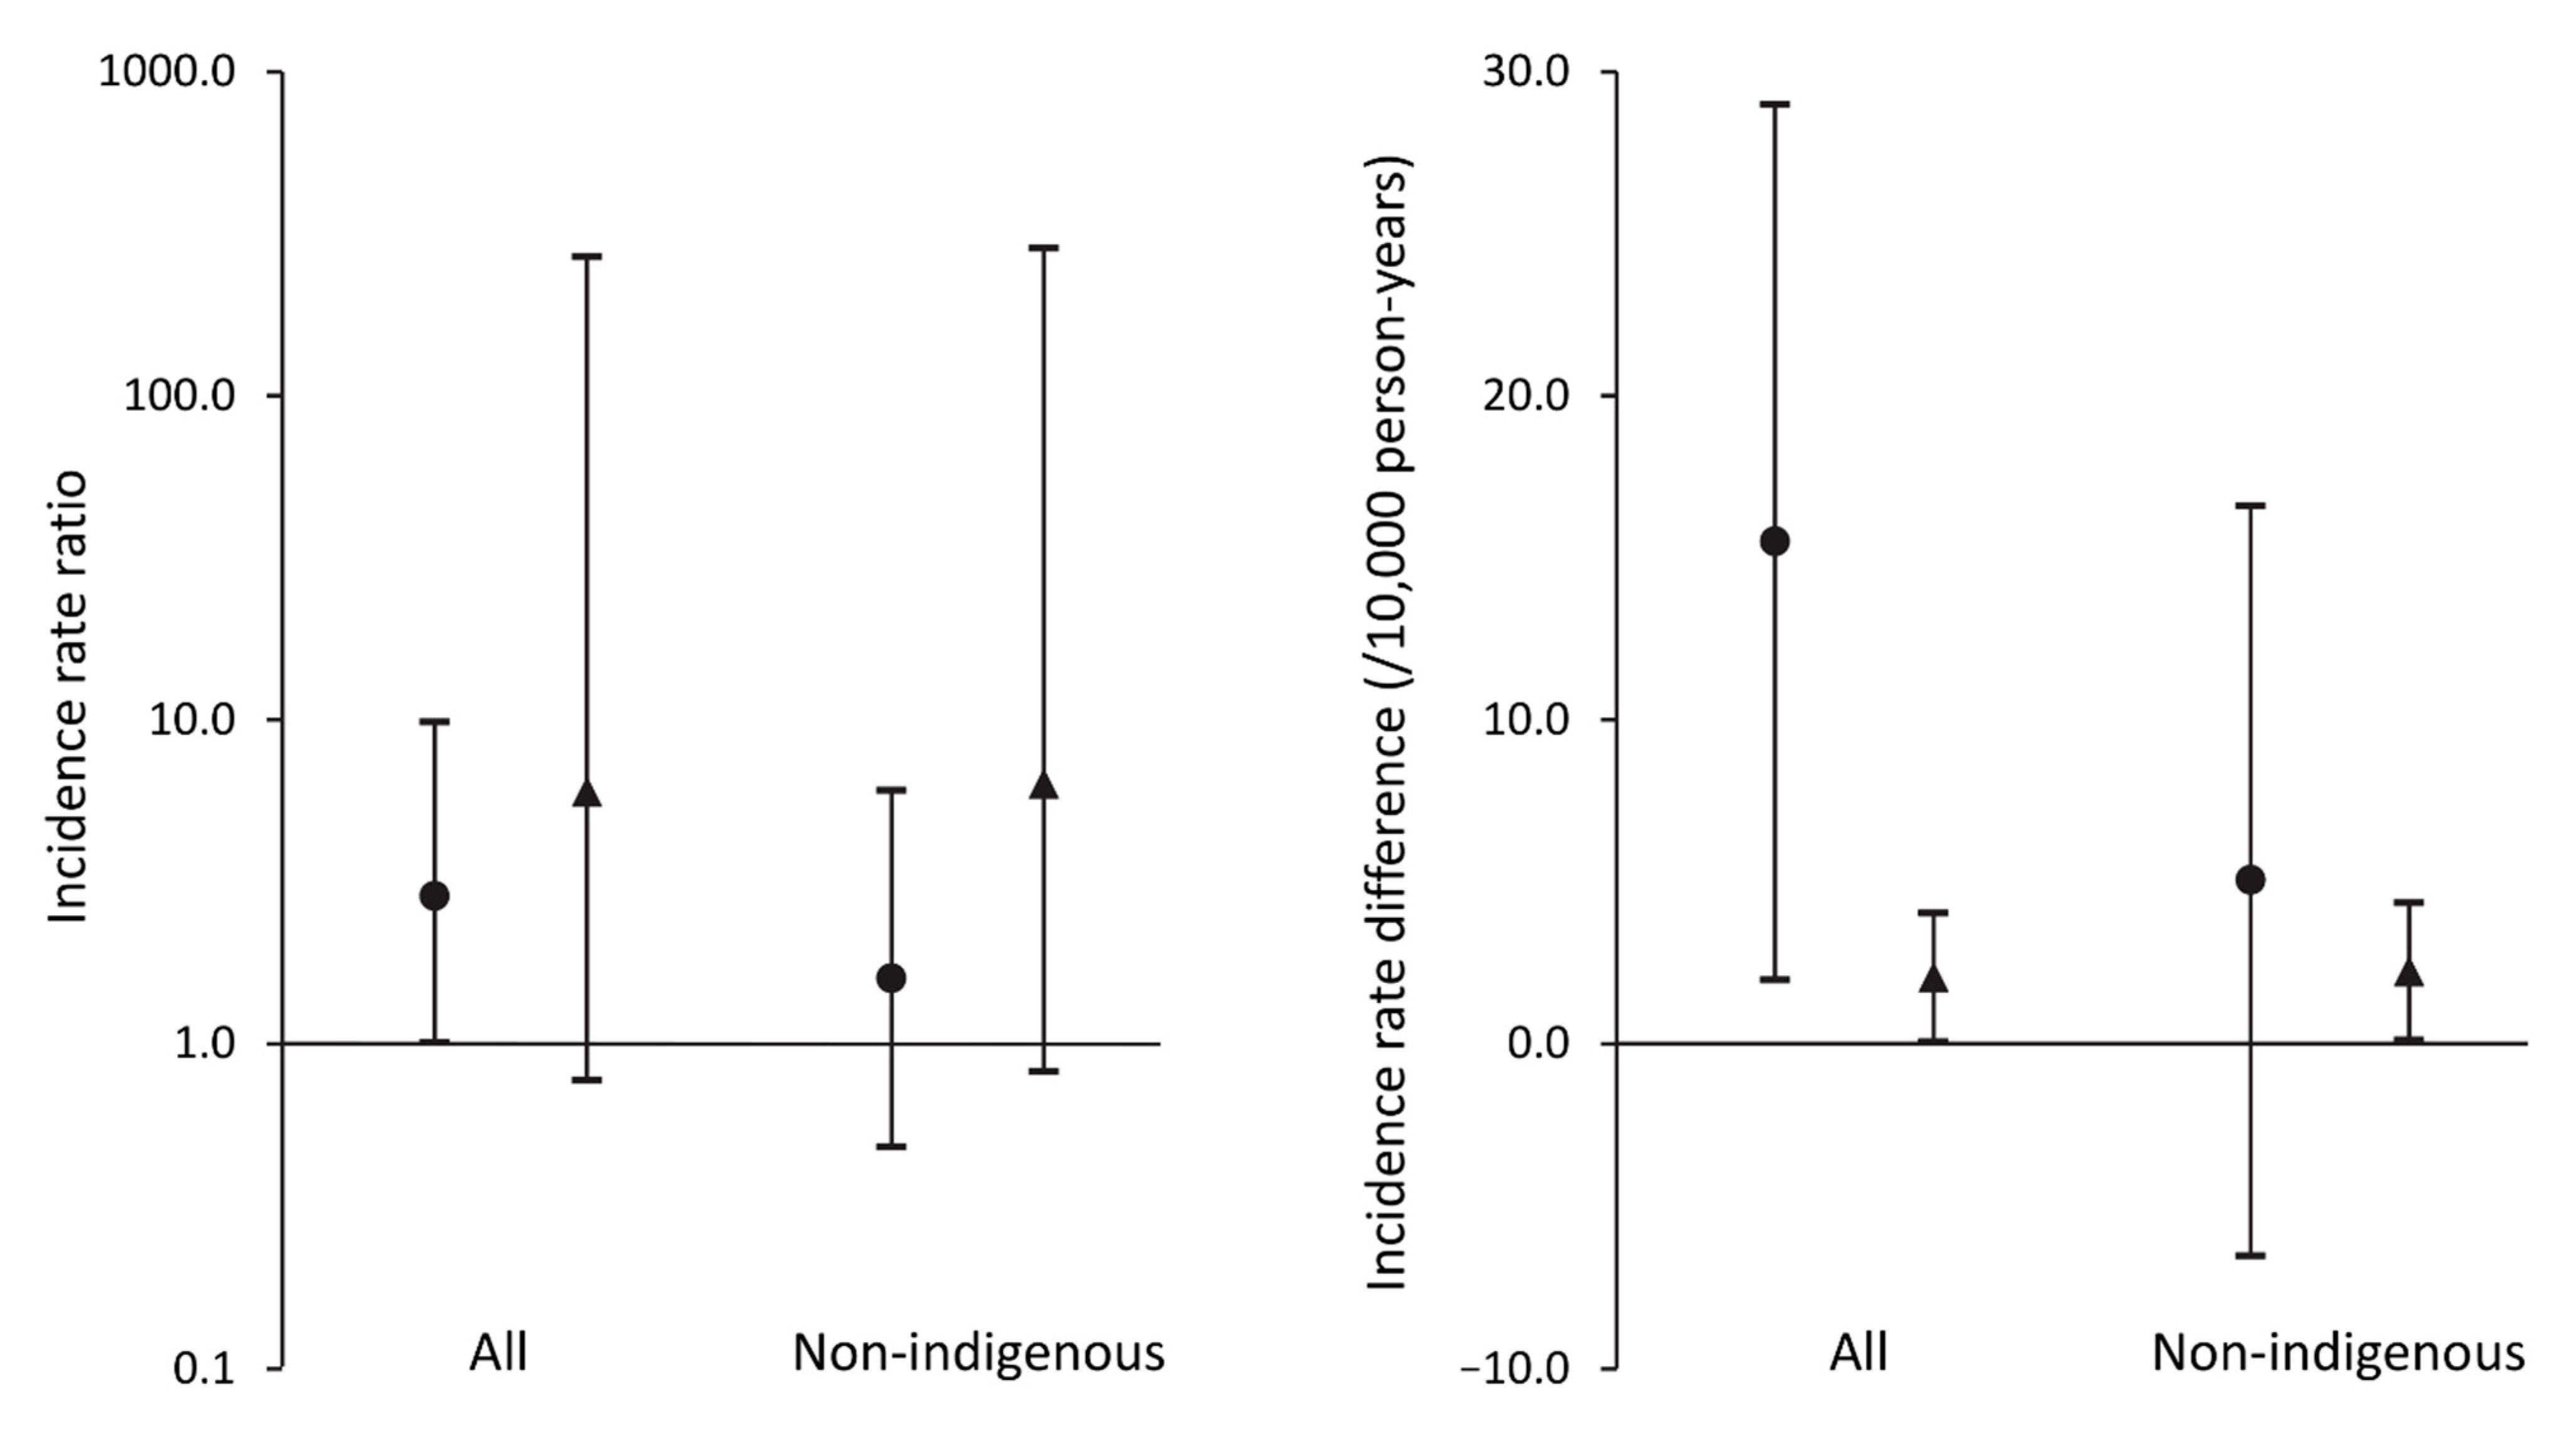
| FDS1 | FDS2 | FDS2:FDS1 | FDS2—FDS1 | |||||
|---|---|---|---|---|---|---|---|---|
| Type 2 Diabetes | N | Follow-Up (Years) | IR | N | Follow-Up (Years) | IR | IRR (95% CI) | IRD (95% CI) |
| Total sample | ||||||||
| Yes | ≤5 * | 5956 | 8.40 (2.73–19.6) | 17 | 7115 | 23.9 (13.9–38.3) | 2.85 (1.01–9.87) | 15.5 (1.97–29.0) |
| No | ≤5 * | 24,376 | 0.41 (0.01–2.29) | 7 | 28,540 | 2.45 (0.99–5.05) | 5.98 (0.77–269) | 2.04 (0.06–4.03) |
| Non-Aboriginal participants | ||||||||
| Yes | ≤5 * | 5872 | 8.52 (2.76–19.9) | 9 | 6636 | 13.6 (6.20–25.7) | 1.59 (0.48–6.05) | 5.05 (−6.54–16.6) |
| No | ≤5 * | 24,009 | 0.42 (0.01–2.32) | 7 | 26,467 | 2.64 (1.06–5.45) | 6.35 (0.82–286) | 2.23 (0.11–4.35) |
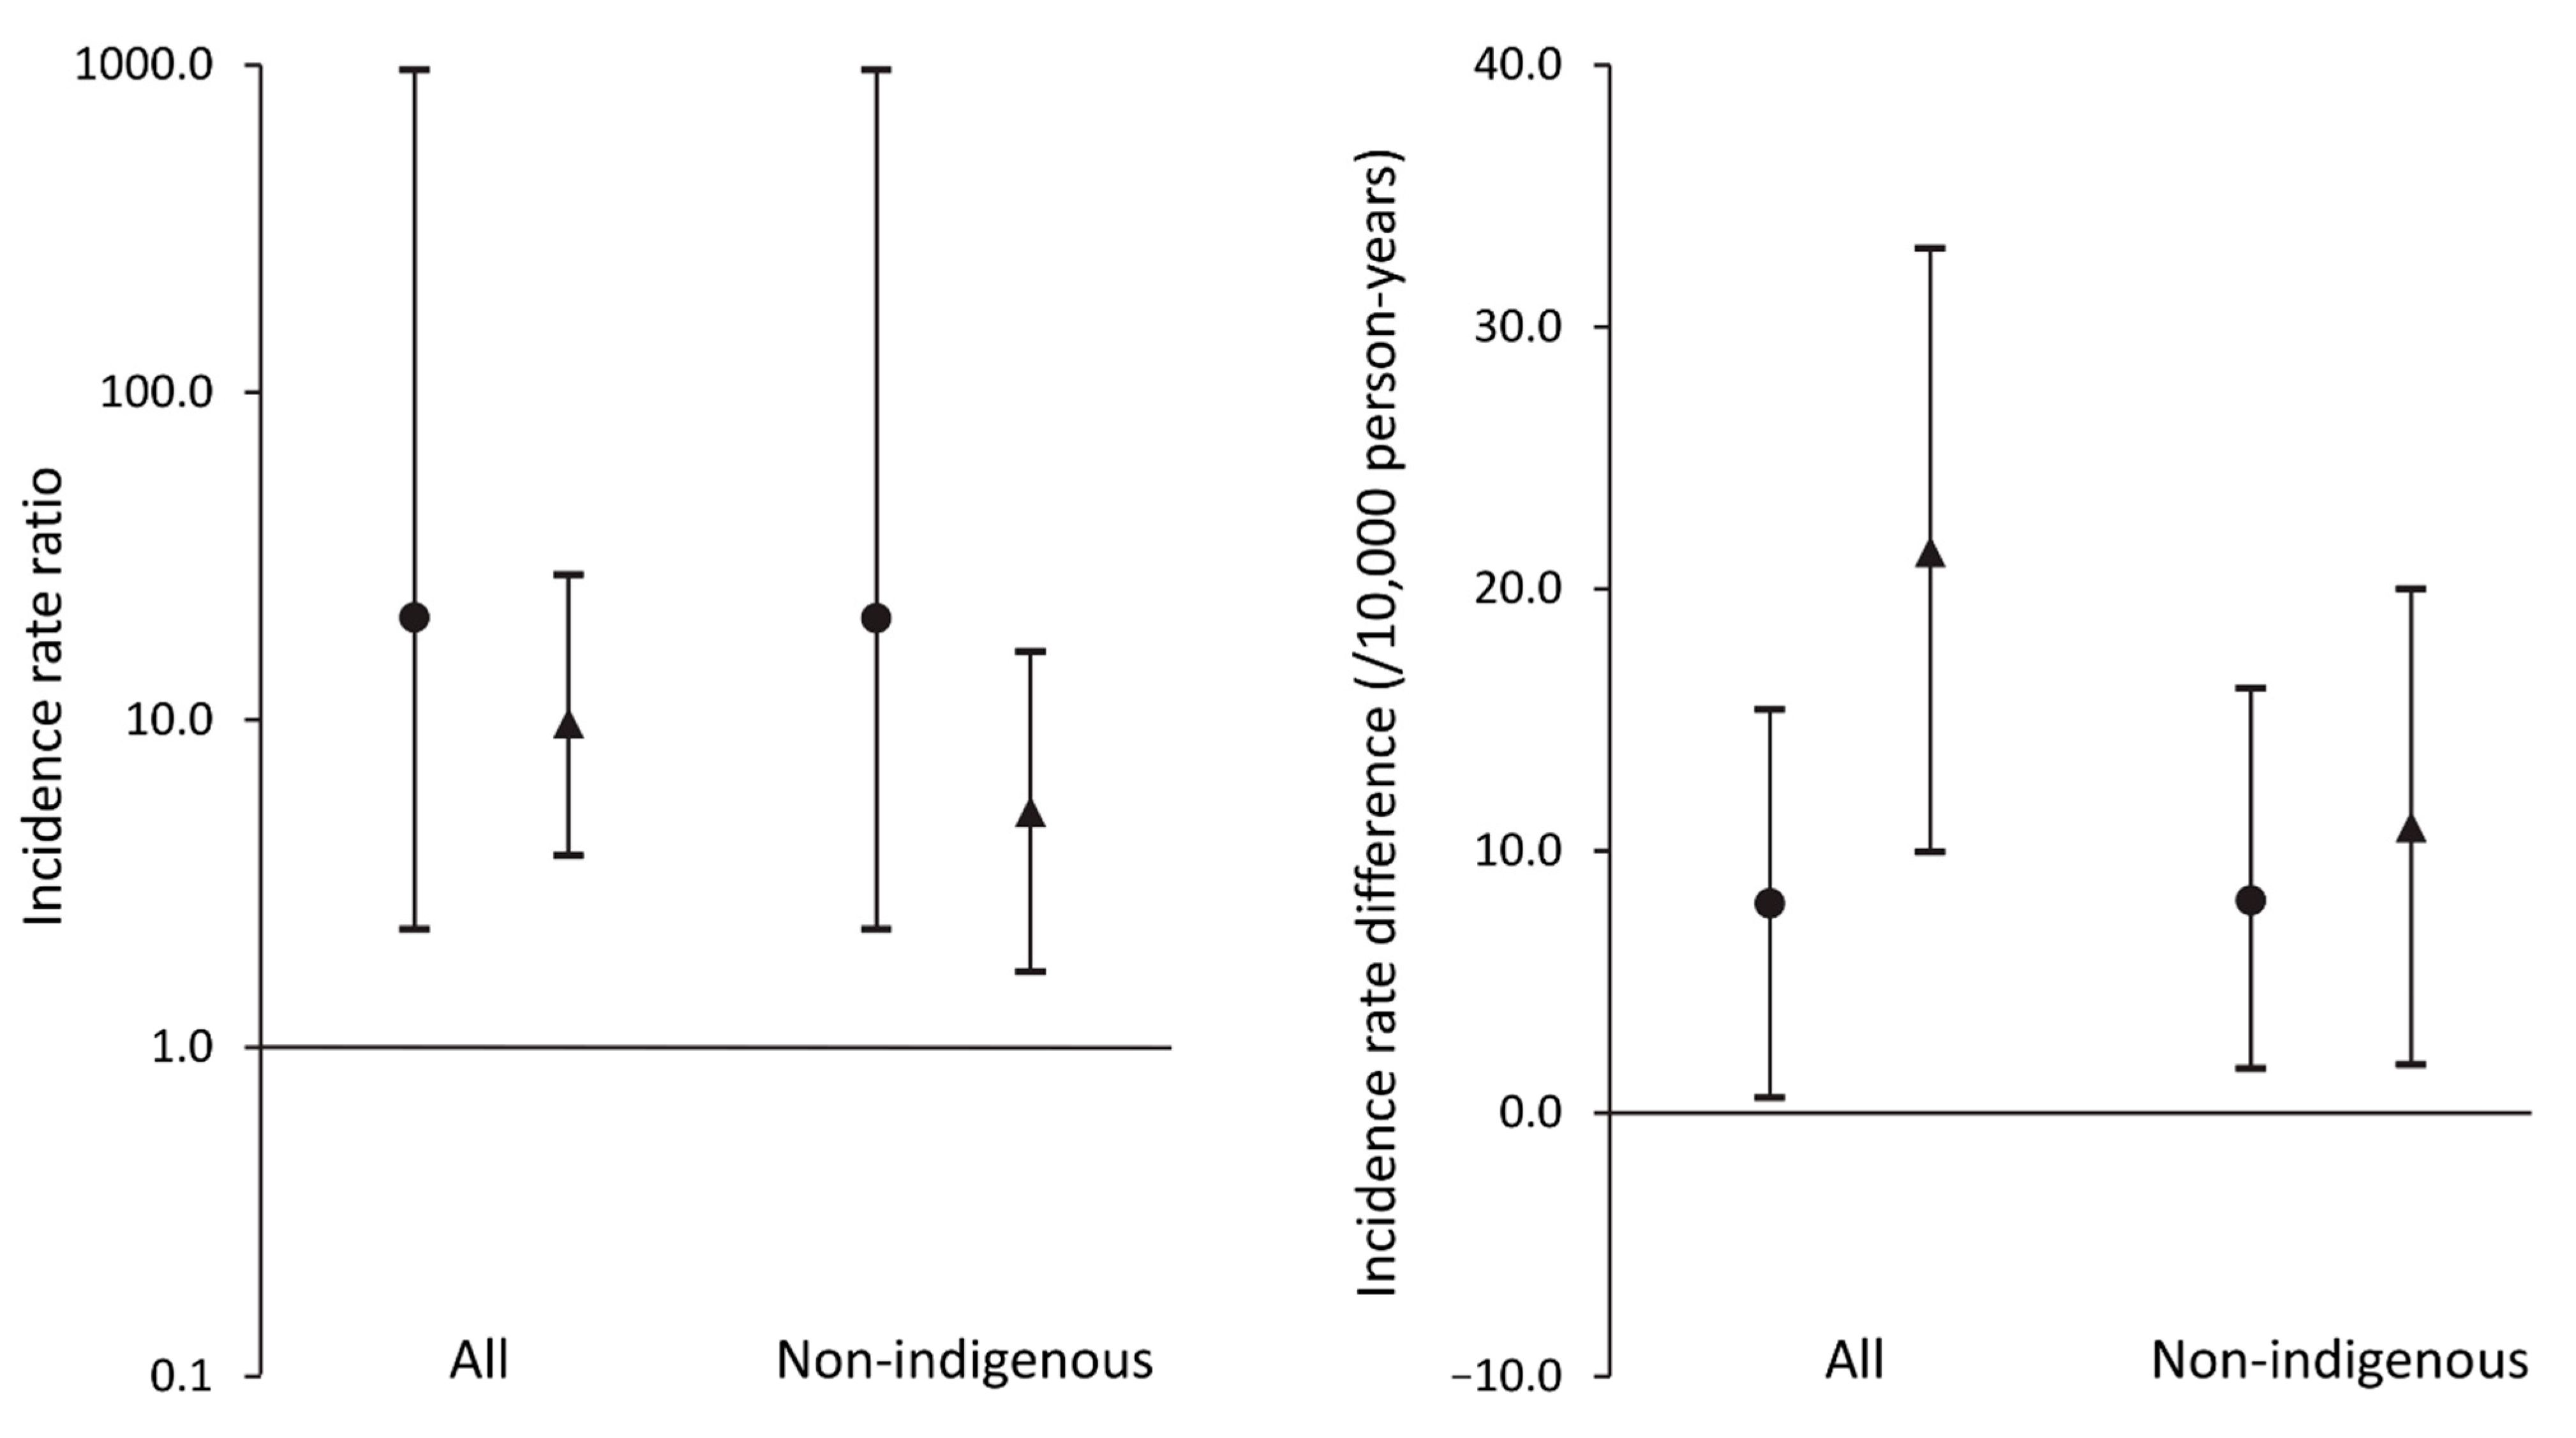
| IRR (95% CI) | IRD (95% CI) | |||
|---|---|---|---|---|
| FDS1 | FDS2 | FDS1 | FDS2 | |
| Total sample | 20.5 (2.29–968) | 9.74 (3.84–27.8) | 7.98 (0.58–15.4) | 21.4 (9.94–33.0) |
| Non-Aboriginal participants | 20.4 (2.29–967) | 5.13 (1.70–16.20) | 8.10 (0.59–15.6) | 10.9 (1.84–20.0) |
| Phase | Type 2 Diabetes | N | Events | CsHR a (95% CI) | CsHR b (95% CI) | SdHR a (95% CI) | SdHR b (95% CI) | Age at Event (Years) |
|---|---|---|---|---|---|---|---|---|
| Total sample | ||||||||
| 2 | No | 6027 | 7 | 1.0 | 1.0 | 1.0 | 1.0 | 67.9 ± 7.6 |
| 2 | Yes | 1497 | 17 | 10.1 (4.20, 24.5) | 7.17 (2.90, 17.7) | 9.89 (4.08, 24.0) | 7.25 (2.88, 18.2) | 61.6 ± 16.0 |
| 1 | No | 5151 | ≤5 * | 0.16 (0.02, 1.28) | 0.16 (0.02, 1.32) | 0.15 (0.02, 1.24) | 0.15 (0.02, 1.26) | 49.4 |
| 1 | Yes | 1289 | ≤5 * | 3.17 (1.01, 10.0) | 2.22 (0.69, 7.27) | 2.97 (0.95, 9.33) | 2.11 (0.58, 7.65) | 62.9 ± 8.9 |
| Non-Aboriginal participants | ||||||||
| 2 | No | 5603 | 7 | 1.0 | 1.0 | 1.0 | 1.0 | 67.9 ± 7.6 (55–75) |
| 2 | Yes | 1397 | 9 | 5.12 (1.91, 13.8) | 3.69 (1.35, 10.1) | 5.03 (1.88, 13.5) | 3.86 (1.44, 10.4) | 74.5 ± 6.4 (63–85) |
| 1 | No | 5075 | ≤5 * | 0.15 (0.02, 1.22) | 0.14 (0.02, 1.17) | 0.14 (0.02, 1.15) | 0.13 (0.02, 1.11) | 49.4 |
| 1 | Yes | 1271 | ≤5 * | 3.06 (0.97, 9.67) | 1.96 (0.60, 6.37) | 2.86 (0.92, 8.89) | 1.86 (0.53, 6.53) | 62.9 ± 8.9 (48–69) |
| FDS1 | FDS2 | p-Value | |
|---|---|---|---|
| Number (%) | 1296 (46.2) | 1509 (53.8) | |
| Time from start of Phase to participant entry (years) | 1.21 ± 0.83 | 1.59 ± 0.93 | <0.001 |
| Age at FDS entry (years) | 64.0 ± 11.3 | 65.4 ± 11.7 | 0.001 |
| Sex (% male) | 48.6 | 51.8 | 0.10 |
| Overseas born (%) | 46.8 | 43.5 | 0.09 |
| Ethnic background (%): Anglo-Celt | 61.4 | 52.6 | |
| Southern European | 17.7 | 12.9 | |
| Other European | 8.5 | 7.4 | <0.001 |
| Asian | 3.4 | 4.3 | |
| Aboriginal Australian | 1.5 | 7.1 | |
| Mixed/other | 7.5 | 15.8 | |
| Not fluent in English (%) | 15.3 | 10.8 | <0.001 |
| Education beyond primary level (%) | 74.0 | 86.8 | <0.001 |
| Currently married/de facto (%) | 65.7 | 62.7 | 0.11 |
| Alcohol (standard drinks/day) | 0 (0–0.8) | 0.1 (0–1.2) | <0.001 |
| Smoking status (%) Never | 44.7 | 45.5 | |
| Ex- | 40.2 | 43.9 | 0.001 |
| Current | 15.1 | 10.7 | |
| Age at diagnosis (years) | 57.9 ± 11.7 | 55.6 ± 12.4 | <0.001 |
| Duration of diabetes (years) | 4.0 (1.0–9.0) | 8.0 (2.7–15.4) | <0.001 |
| Diabetes treatment (%): Diet | 31.9 | 24.6 | |
| Oral agents | 55.7 | 53.4 | <0.001 |
| Insulin ± oral agents | 12.3 | 22.0 | |
| Fasting serum glucose (mmol/L) | 8.0 (6.5–10.3) | 7.2 (6.2–8.9) | <0.001 |
| HbA1c (%) | 7.2 (6.2–8.5) | 6.8 (6.2–7.7) | <0.001 |
| HbA1c (mmol/mol) | 55 (44–69) | 51 (44–61) | <0.001 |
| Self-reported hypoglycemia last year (%): | 22.9 | 33.9 | <0.001 |
| Body mass index (kg/m2) | 29.6 ± 5.4 | 31.3 ± 6.1 | <0.001 |
| Obesity (% by waist circumference) | 64.5 | 70.9 | <0.001 |
| Antihypertensive medication (%) | 50.9 | 73.2 | <0.001 |
| Angiotensin converting enzyme inhibitors/angiotensin receptor antagonists (%) | 21.8 | 64.5 | <0.001 |
| Systolic blood pressure (mm Hg) | 151 ± 24 | 146 ± 22 | <0.001 |
| Diastolic blood pressure (mm Hg) | 80 ± 11 | 80 ± 12 | 0.55 |
| Heart rate (/min) | 70 ± 12 | 70 ± 12 | 0.85 |
| Lipid-modifying medication (%) | 10.5 | 68.2 | <0.001 |
| Total serum cholesterol (mmol/L) | 5.5 ± 1.1 | 4.4 ± 1.1 | <0.001 |
| Serum HDL-cholesterol (mmol/L) | 1.06 ± 0.33 | 1.24 ± 0.34 | <0.001 |
| Serum triglycerides (mmol/L) | 2.2 (1.2–3.9) | 1.5 (0.9–2.5) | <0.001 |
| Serum uric acid (mmol/L) | 0.38 ± 0.11 | 0.34 ± 0.09 | <0.001 |
| Aspirin use (%) | 22.0 | 37.2 | <0.001 |
| Urinary albumin:creatinine (mg/mmol) | 5.2 (1.5–17.8) | 3.3 (0.8–12.7) | <0.001 |
| eGFR categories (%): ≥90 mL/min/1.73 m2 | 32.2 | 38.9 | |
| 60–89 mL/min/1.73 m2 | 49.8 | 44.6 | |
| 45–59 mL/min/1.73 m2 | 11.9 | 8.8 | <0.001 |
| 30–44 mL/min/1.73 m2 | 4.4 | 4.9 | |
| <30 mL/min/1.73 m2 | 1.7 | 2.8 | |
| Hospitalization for/with RRT (%) | 0.2 | 0.8 | 0.016 |
| Atrial fibrillation (%) | 4.9 | 4.6 | 0.72 |
| Hospitalization for/with heart failure (%) | 8.3 | 6.4 | 0.07 |
| Hospitalization for/with myocardial infarction (%) | 8.7 | 8.1 | 0.59 |
| Ischemic heart disease (%) | 29.6 | 28.8 | 0.68 |
| Hospitalization for/with stroke (%) | 0.4 | 3.0 | <0.001 |
| Cerebrovascular disease (%) | 10.0 | 11.2 | 0.30 |
| Hospitalization for lower extremity amputation (%) | 1.2 | 1.1 | 0.86 |
| Peripheral arterial disease (%) | 29.3 | 22.6 | <0.001 |
| Peripheral sensory neuropathy (%) | 30.8 | 58.2 | <0.001 |
| Depressive symptoms (%) | 31.5 | 23.1 | <0.001 |
| ApoE genotype (%): 22 | 0.8 | 0.4 | |
| 23 | 11.8 | 11.4 | |
| 24 | 2.3 | 2.5 | 0.54 |
| 33 | 65.5 | 64.5 | |
| 34 | 18.3 | 19.4 | |
| 44 | 1.2 | 1.8 | |
| ApoE4 allele (%) | 21.9 | 23.7 | 0.27 |
| Charlson Comorbidity Index a (%): | 0.001 | ||
| 0 | 71.5 | 75.1 | |
| 1–2 | 22.1 | 16.8 | |
| ≥3 | 6.4 | 8.0 |
| Model 1 | Model 2 | |
|---|---|---|
| Total sample | ||
| n/N | 22/2787 | 22/2787 |
| Aboriginal | 6.41 (1.02–40.1) | 3.84 (0.56–26.3) |
| Ln(ACR (mg/mmol)) * | 2.52 (1.77–3.58) | 2.57 (1.81–3.65) |
| eGFR (CKD-EPI): | ||
| 45–59 mL/min/1.73 m2 | 22.4 (2.34–214) | 22.1 (2.38–205) |
| 30–44 mL/min/1.73 m2 | 39.3 (4.03–383) | 47.1 (4.59–482) |
| <30 mL/min/1.73 m2 | 221 (23.4–2081) | 230 (26.1–2036) |
| FDS2 | 3.13 (0.81–12.1) | |
| Non-Aboriginal participants | ||
| n/N | 14/2673 | 14/2673 |
| Ln(ACR (mg/mmol)) * | 2.78 (1.84–4.20) | 2.78 (1.85–4.17) |
| eGFR (CKD-EPI) <30 mL/min/1.73 m2 | 22.8 (5.91–87.8) | 24.5 (6.42–93.2) |
| FDS2 | 2.22 (0.59–8.35) |
Publisher’s Note: MDPI stays neutral with regard to jurisdictional claims in published maps and institutional affiliations. |
© 2022 by the authors. Licensee MDPI, Basel, Switzerland. This article is an open access article distributed under the terms and conditions of the Creative Commons Attribution (CC BY) license (https://creativecommons.org/licenses/by/4.0/).
Share and Cite
Davis, W.A.; Chakera, A.; Gregg, E.; McAullay, D.; Davis, T.M.E. Temporal Trends in Renal Replacement Therapy in Community-Based People with or without Type 2 Diabetes: The Fremantle Diabetes Study. J. Clin. Med. 2022, 11, 695. https://doi.org/10.3390/jcm11030695
Davis WA, Chakera A, Gregg E, McAullay D, Davis TME. Temporal Trends in Renal Replacement Therapy in Community-Based People with or without Type 2 Diabetes: The Fremantle Diabetes Study. Journal of Clinical Medicine. 2022; 11(3):695. https://doi.org/10.3390/jcm11030695
Chicago/Turabian StyleDavis, Wendy A., Aron Chakera, Edward Gregg, Daniel McAullay, and Timothy M. E. Davis. 2022. "Temporal Trends in Renal Replacement Therapy in Community-Based People with or without Type 2 Diabetes: The Fremantle Diabetes Study" Journal of Clinical Medicine 11, no. 3: 695. https://doi.org/10.3390/jcm11030695
APA StyleDavis, W. A., Chakera, A., Gregg, E., McAullay, D., & Davis, T. M. E. (2022). Temporal Trends in Renal Replacement Therapy in Community-Based People with or without Type 2 Diabetes: The Fremantle Diabetes Study. Journal of Clinical Medicine, 11(3), 695. https://doi.org/10.3390/jcm11030695