Article

Pathological Diagnosis of Adult Craniopharyngioma on MR Images: An Automated End-to-End Approach Based on Deep Neural Networks Requiring No Manual Segmentation

1
Department of Neurosurgery, West China Hospital of Sichuan University, Chengdu 610041, China
2
Department of Neurosurgery, Ziyang People’s Hospital, Ziyang 641300, China
*
Authors to whom correspondence should be addressed.
These authors contributed equally to this work and share first authorship.
J. Clin. Med. 2022, 11(24), 7481; https://doi.org/10.3390/jcm11247481
Submission received: 28 November 2022 / Revised: 9 December 2022 / Accepted: 14 December 2022 / Published: 16 December 2022
(This article belongs to the Special Issue Artificial Intelligence in Radiology: Present and Future Perspectives)

Abstract

:
Purpose: The goal of this study was to develop end-to-end convolutional neural network (CNN) models that can noninvasively discriminate papillary craniopharyngioma (PCP) from adamantinomatous craniopharyngioma (ACP) on MR images requiring no manual segmentation. Materials and methods: A total of 97 patients diagnosed with ACP or PCP were included. Pretreatment contrast-enhanced T1-weighted images were collected and used as the input of the CNNs. Six models were established based on six networks, including VGG16, ResNet18, ResNet50, ResNet101, DenseNet121, and DenseNet169. The area under the receiver operating characteristic curve (AUC), accuracy, sensitivity, and specificity were used to assess the performances of these deep neural networks. A five-fold cross-validation was applied to evaluate the performances of the models. Results: The six networks yielded feasible performances, with area under the receiver operating characteristic curves (AUCs) of at least 0.78 for classification. The model based on Resnet50 achieved the highest AUC of 0.838 ± 0.062, with an accuracy of 0.757 ± 0.052, a sensitivity of 0.608 ± 0.198, and a specificity of 0.845 ± 0.034, respectively. Moreover, the results also indicated that the CNN method had a competitive performance compared to the radiomics-based method, which required manual segmentation for feature extraction and further feature selection. Conclusions: MRI-based deep neural networks can noninvasively differentiate ACP from PCP to facilitate the personalized assessment of craniopharyngiomas.

1. Introduction

Craniopharyngioma is a type of rare benign epithelial tumor located along the craniopharyngeal duct, accounting for approximately 1.2–4.6% of all intracranial tumors, with an annual incidence rate of 0.5–2.5 cases per 1 million in the population [1]. According to the latest World Health Organization (WHO) classification of central nervous system (CNS) tumors, craniopharyngioma molecularly consists of two distinct subtypes: adamantinomatous craniopharyngioma (ACP) and papillary craniopharyngioma (PCP) [2]. The clinical manifestations of ACP and PCP can be different; ACP has a bimodal age distribution, with peak incidences between the ages of 5 and 15 as well as 45 and 60, while PCP occurs almost exclusively in adults, peaking between the ages of 40 and 55 [3]. Surgical resection is still the first-line management in the vast majority of cases, but there is a high rate of postsurgical comorbidities that significantly impair daily functions [4]. In addition, patients with ACPs may suffer from higher recurrence rates and poor prognoses compared to PCP, mainly due to their infiltrative nature and low complete-resection rate [5,6].
The recent development of genomics allows clinicians to explore a more individualized method for craniopharyngioma treatment and prognostic prediction. It has been identified that the CTNNB1 mutation is mostly associated with ACP, while PCPs frequently harbor the somatic BRAF-V600E mutation [7,8,9]. A targeted therapy harboring BRAF-V600E is therefore viable for PCP treatment, and it has been reported to be feasible in several individual cases [10,11,12,13]. Moreover, PCP tends to present a higher overall expression of PD-L1 than ACP, which seems to be associated with the BRAF mutation, and may have a favorable response to anti-PD-L1 therapy [14]. Therefore, a combination of targeting PD-L1 and a BRAF inhibitor is an attractive potential therapy for PCP patients [6,15]. Overall, given these progresses in individualized treatment and the distinction in patient prognosis, molecular diagnosis before treatment is rather clinically relevant and should be explored. Lacking specific clinical symptom or blood biomarkers, magnetic resonance imaging (MRI) is the standard as well as the most important preoperative assessment of craniopharyngioma. On T1-weighted images (T1WI), a lobulated, hyperintense, cystic appearance is commonly observed in ACP, while a spherical, hypointense, solid appearance with cysts is observed in PCP [16]. However, the differentiation of ACP and PCP based on above image characteristics is subjective and inadequate, especially for adult patients [16,17]. Nowadays, a series of artificial intelligence (AI) models have been built to assist radiologists and have shown gratifying results in lesion detection, segmentation, diagnosis, and genetic prediction [18,19,20,21]. Previously, several machine learning models built with selected radiomics features were used to discriminate ACP from PCP and to estimate the BRAF and CTNNB1 mutation statuses in craniopharyngioma [22,23,24] although the results were laborious, as they required radiomics features extracted from manual segmentation and a selection of appropriate features [25,26]. Convolutional neural networks (CNNs), a class of deep learning technology, allow for the automatic recognition of important features for detection or classification through multiple layers of representations in raw data [27,28]. Thus, an automated end-to-end approach based on deep learning technology requiring no human involvement should be investigated. In this study, we retrospectively analyzed the clinical and MRI characteristics of ACP and PCP in adult patients. Moreover, we developed a series of CNN models to automatically discriminate ACP from PCP using routine MRIs and tested their performance with classical radiomics methods.

2. Materials and Methods

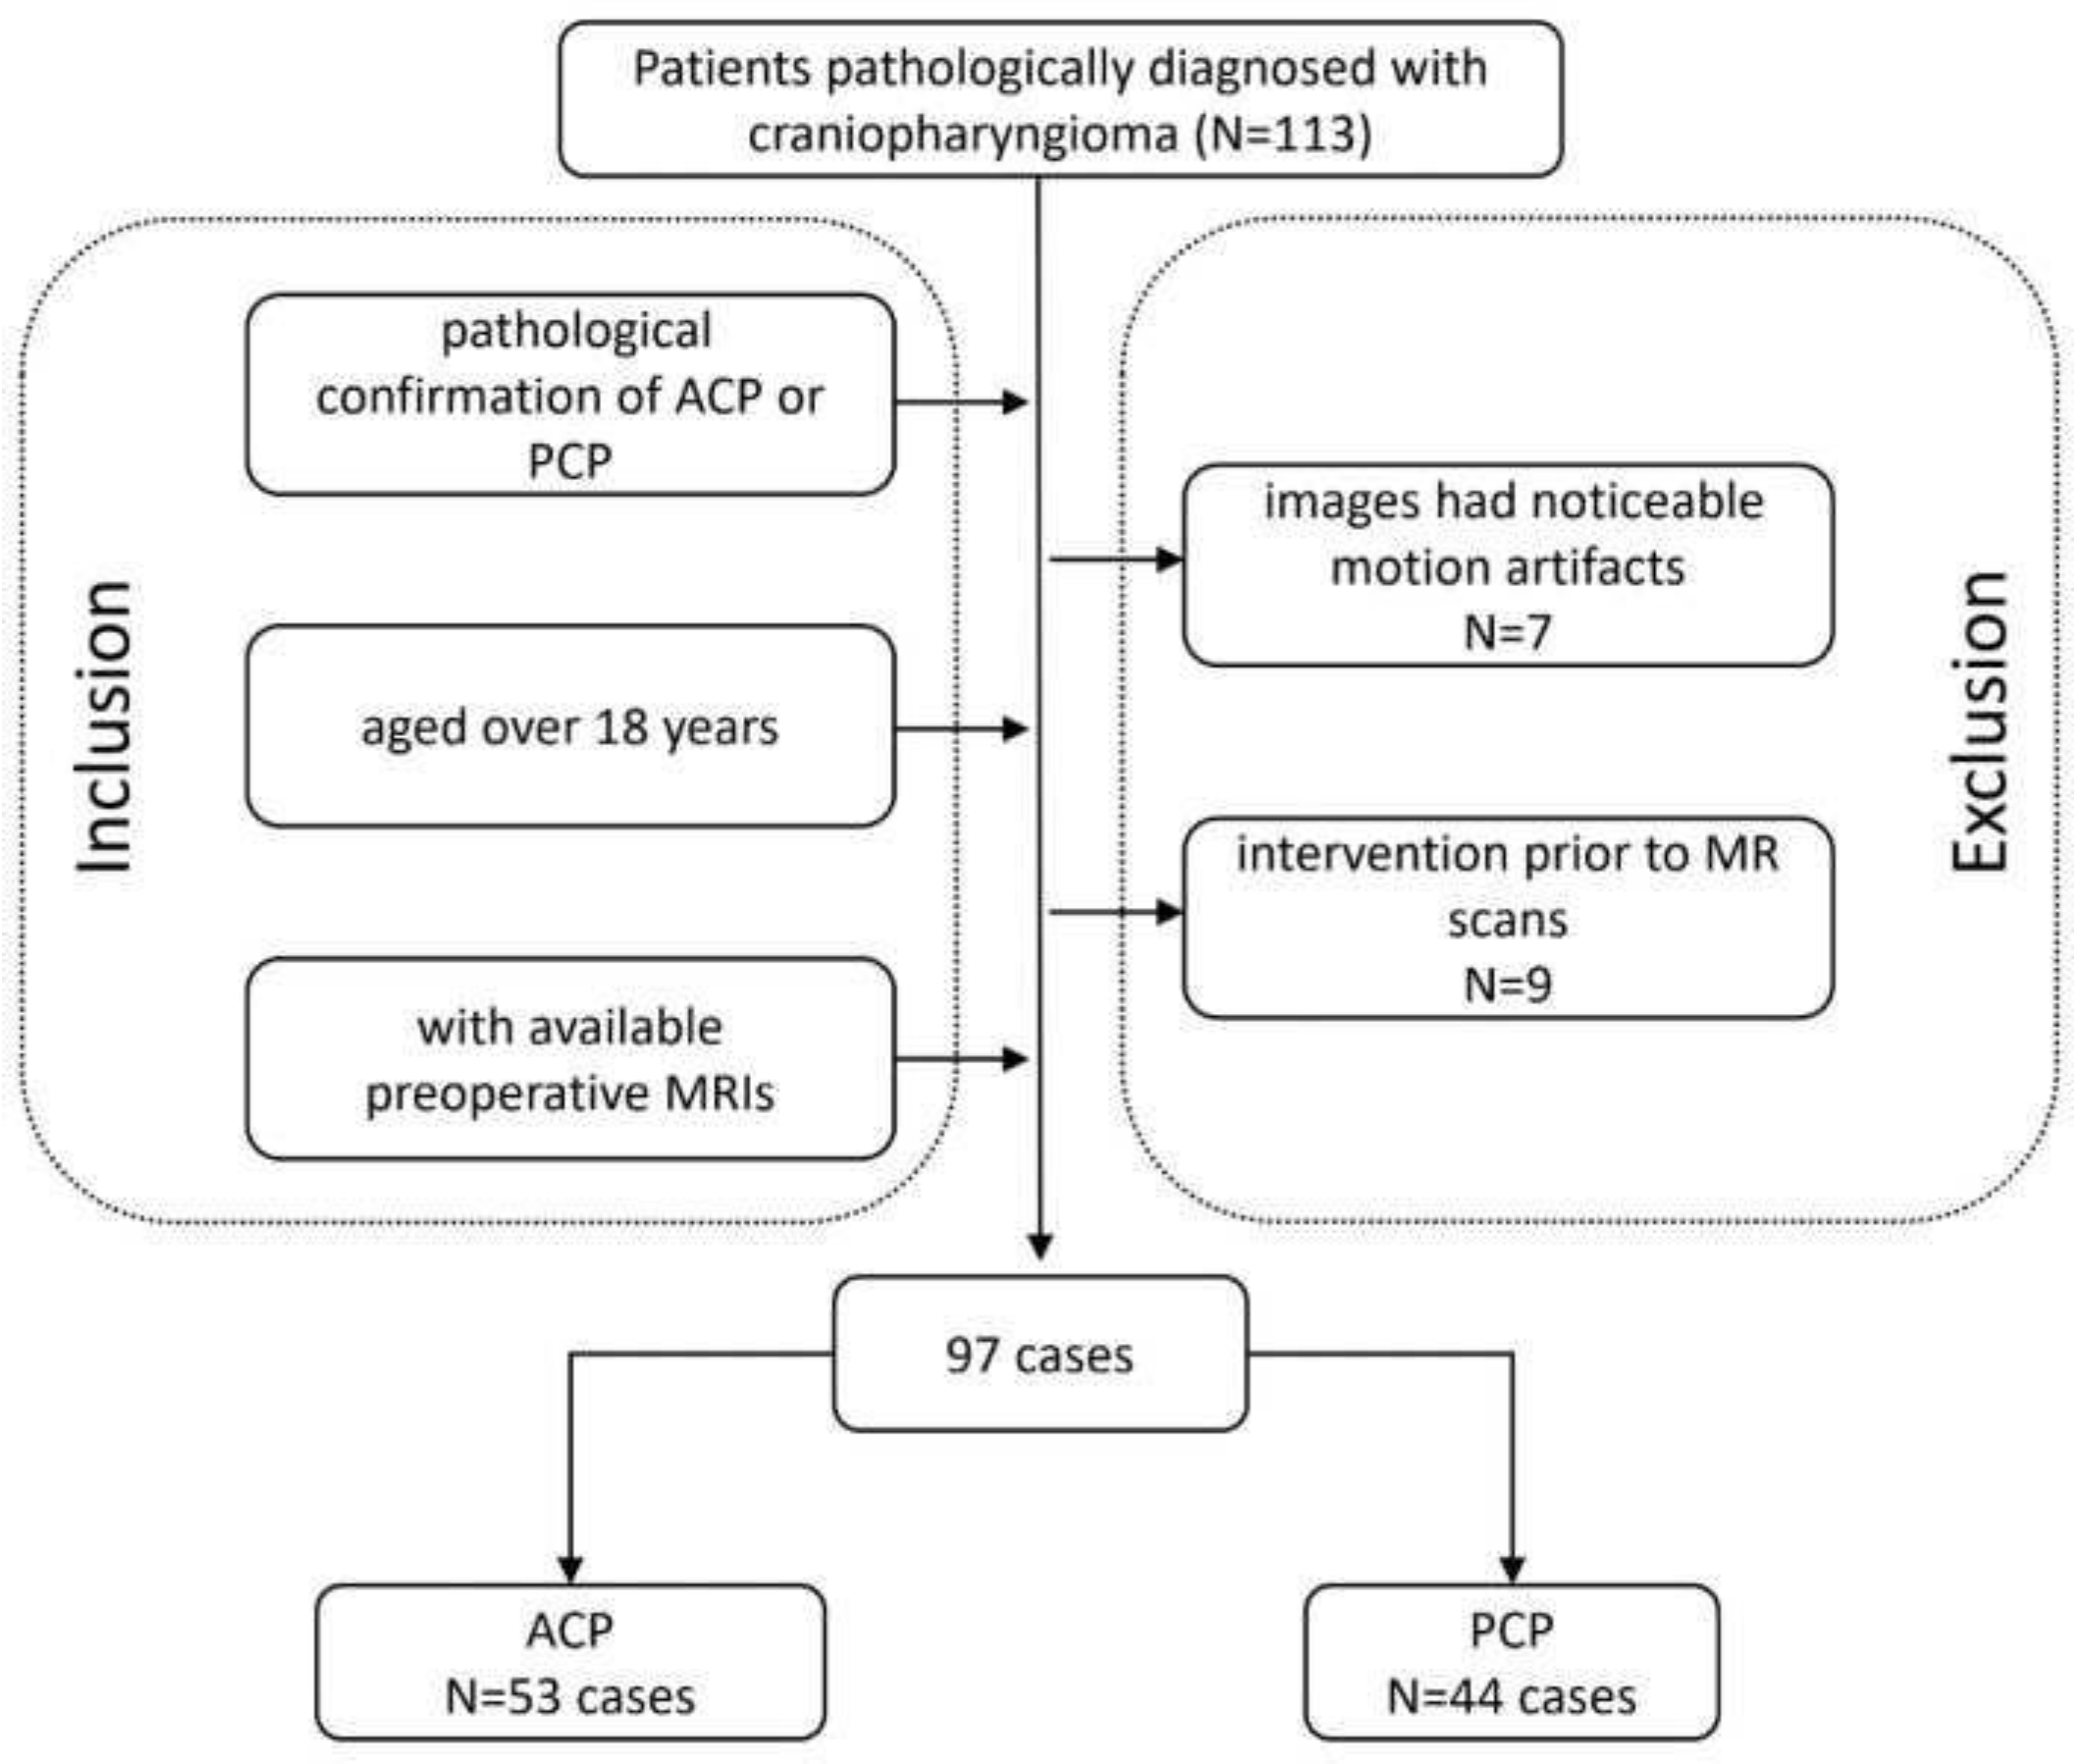
2.1. Patient Enrollment

This was a single-center retrospective study performed in the radiology department of West China Hospital. We reviewed the electronic records of patients who underwent tumor resection and were diagnosed with craniopharyngioma between June 2015 and December 2020. The inclusion criteria were as follows: (a) patients with a pathological confirmation of ACP or PCP; (b) patients aged over 18 years at the time of diagnosis; and (c) patients with available preoperative MRIs. The exclusion criteria were (a) images that had noticeable motion artifacts and (b) therapeutic or diagnostic interventions prior to MR scans, such as radiotherapy and biopsy. The clinical characteristics of the patients and the radiological characteristics of the tumors were also evaluated and collected. The working flow chart of this study is shown in Figure 1. This retrospective study was approved by the institutional review board of West China Hospital, Sichuan University, and the informed consent was waived (2021-S-851).

2.2. MRI Protocol

MR scans of the sellar region were performed on all eligible patients via a 3.0 T scanner (Signa Excite; GE healthcare, Milwaukee, WI, USA) in our institution. Coronal contrast-enhanced T1-weighted images were used in this study, as the tumor boundaries were much clearer on the enhanced images compared to the other sequences and coronal images are commonly used in clinical work, as they can provide more information about the relationship between a tumor and the surrounding structures. The parameters of the contrast-enhanced T1-weighted imaging were as follows: time repetition = 552 ms, time echo = 10 ms, field of view = 150 mm × 150 mm, data matrix = 256 × 256, and slice thickness = 5 mm. The contrast-enhanced images were acquired within 200 s after the injection of the contrast agent, gadopentetate dimeglumine (dose: 0.1 mmol/kg). The images were exported from the picture archiving and communication system (PACS). Figure 2 shows examples of ACP and PCP, respectively.

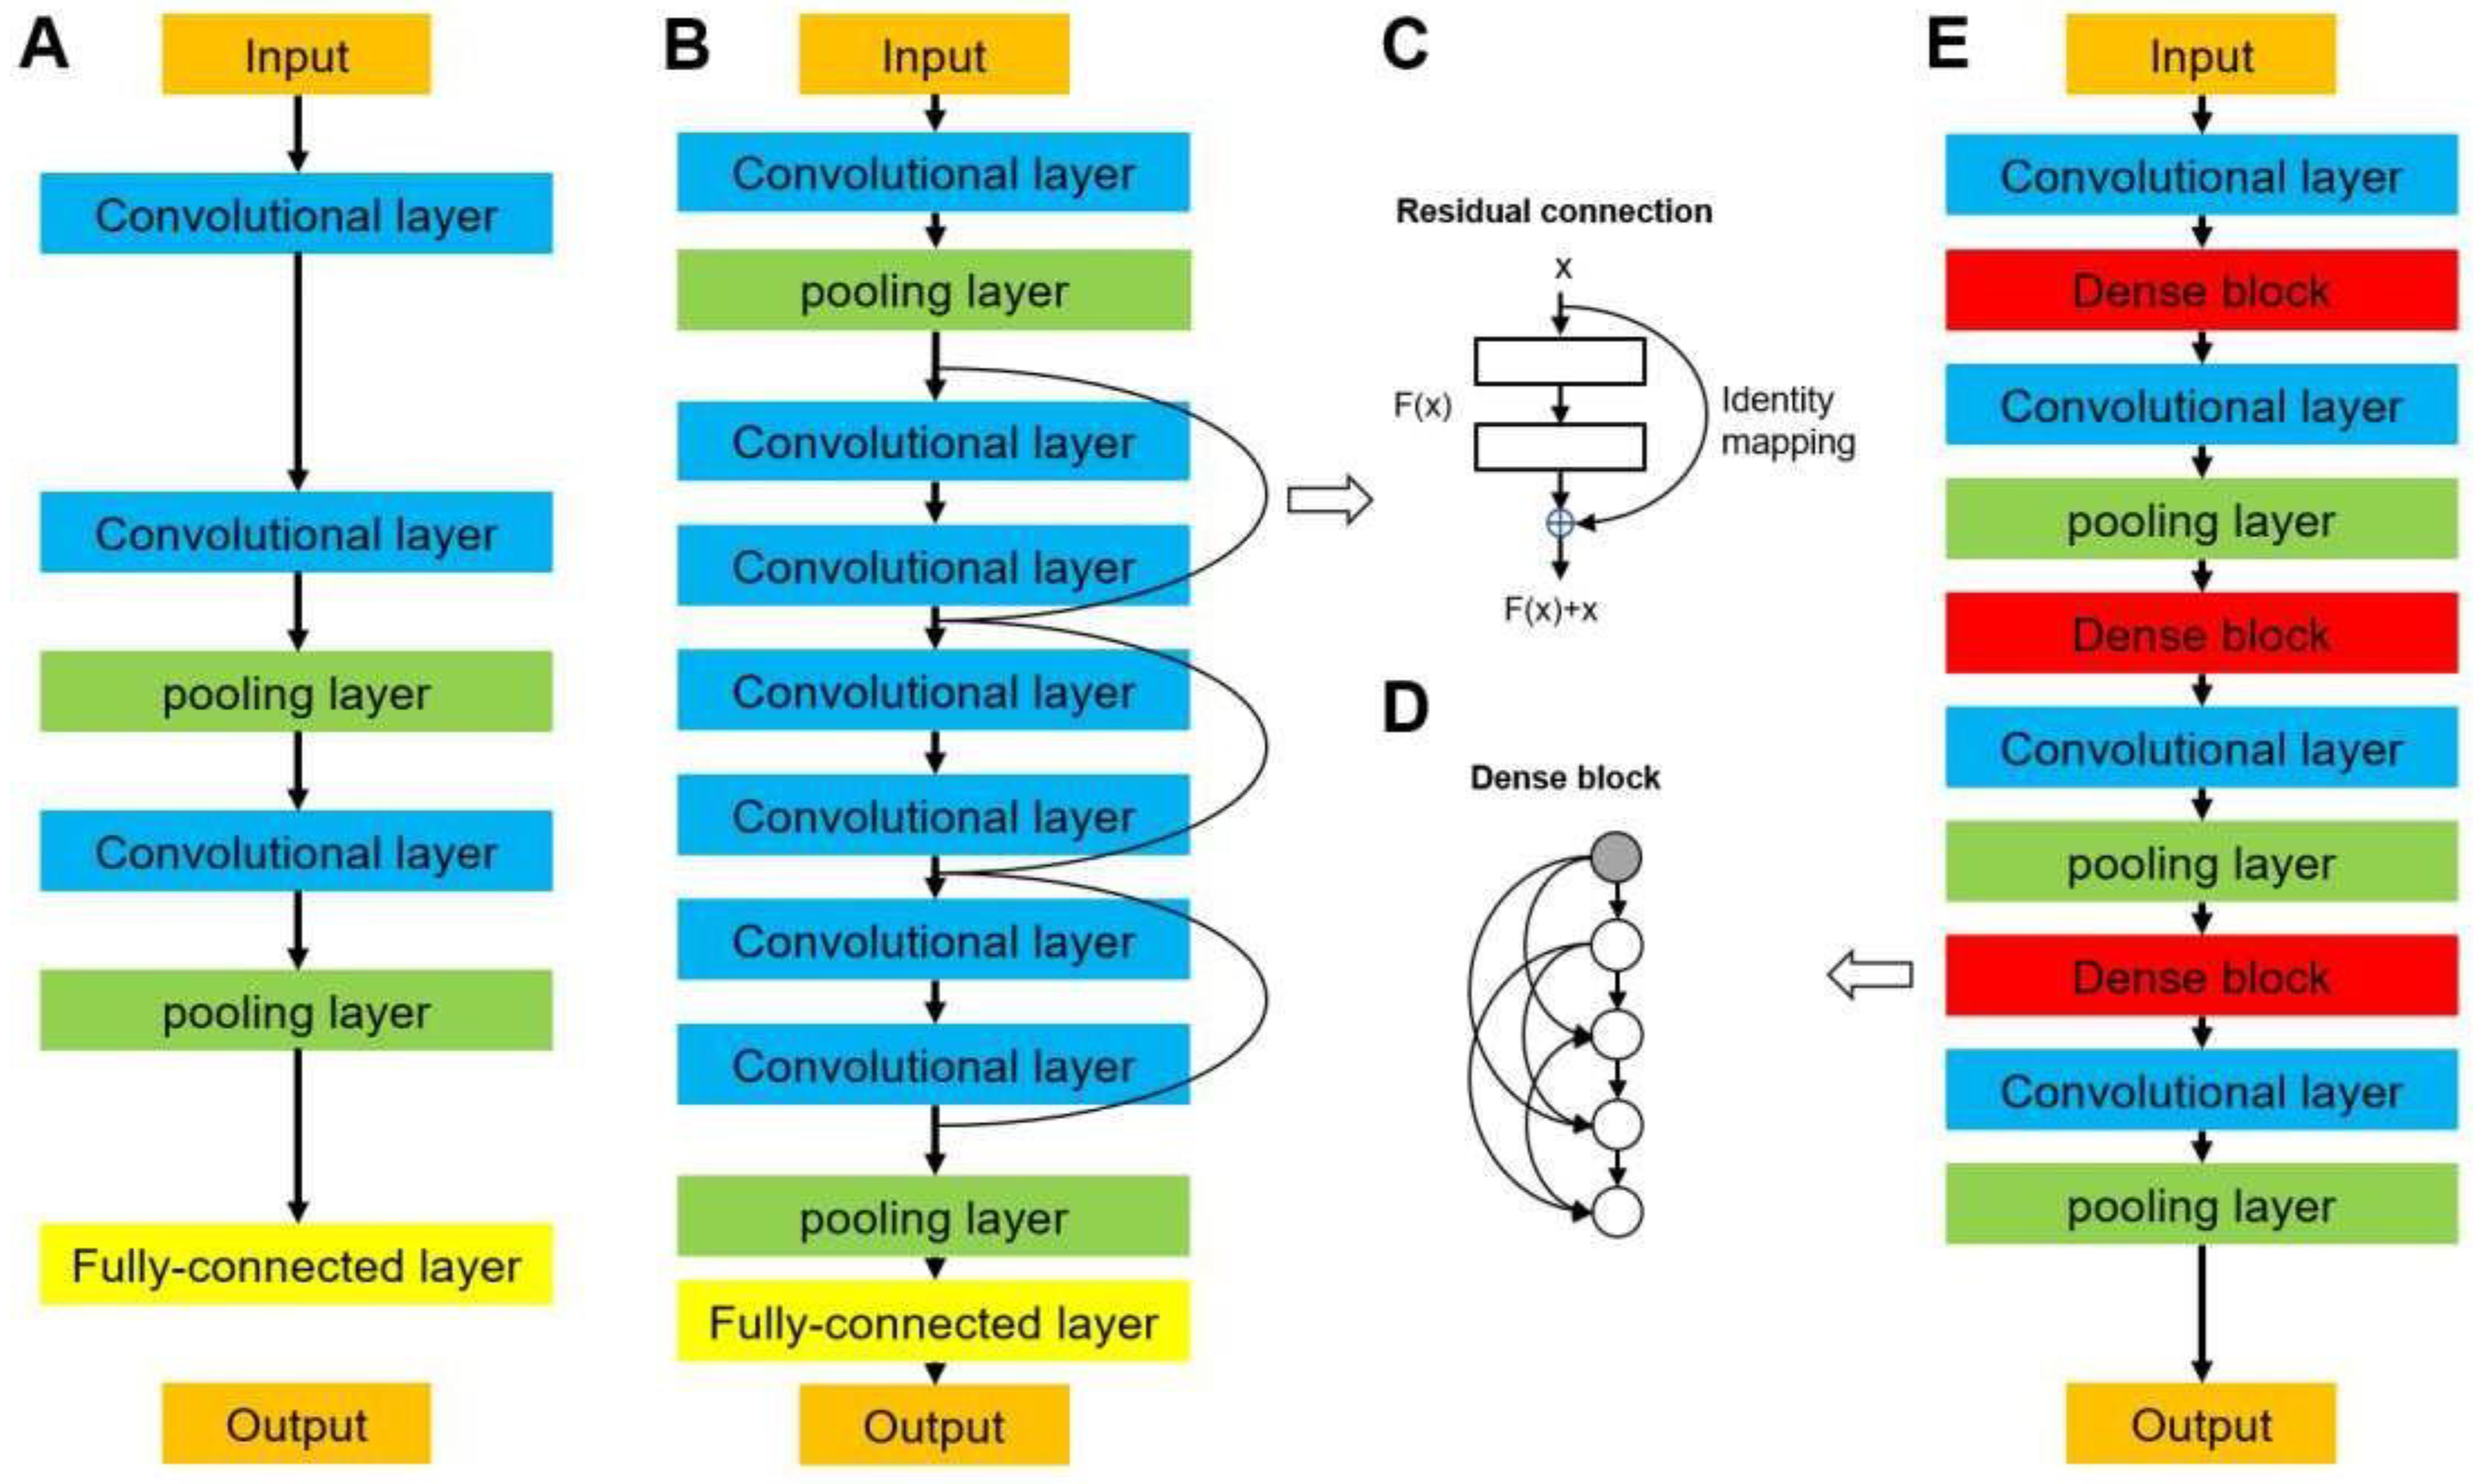
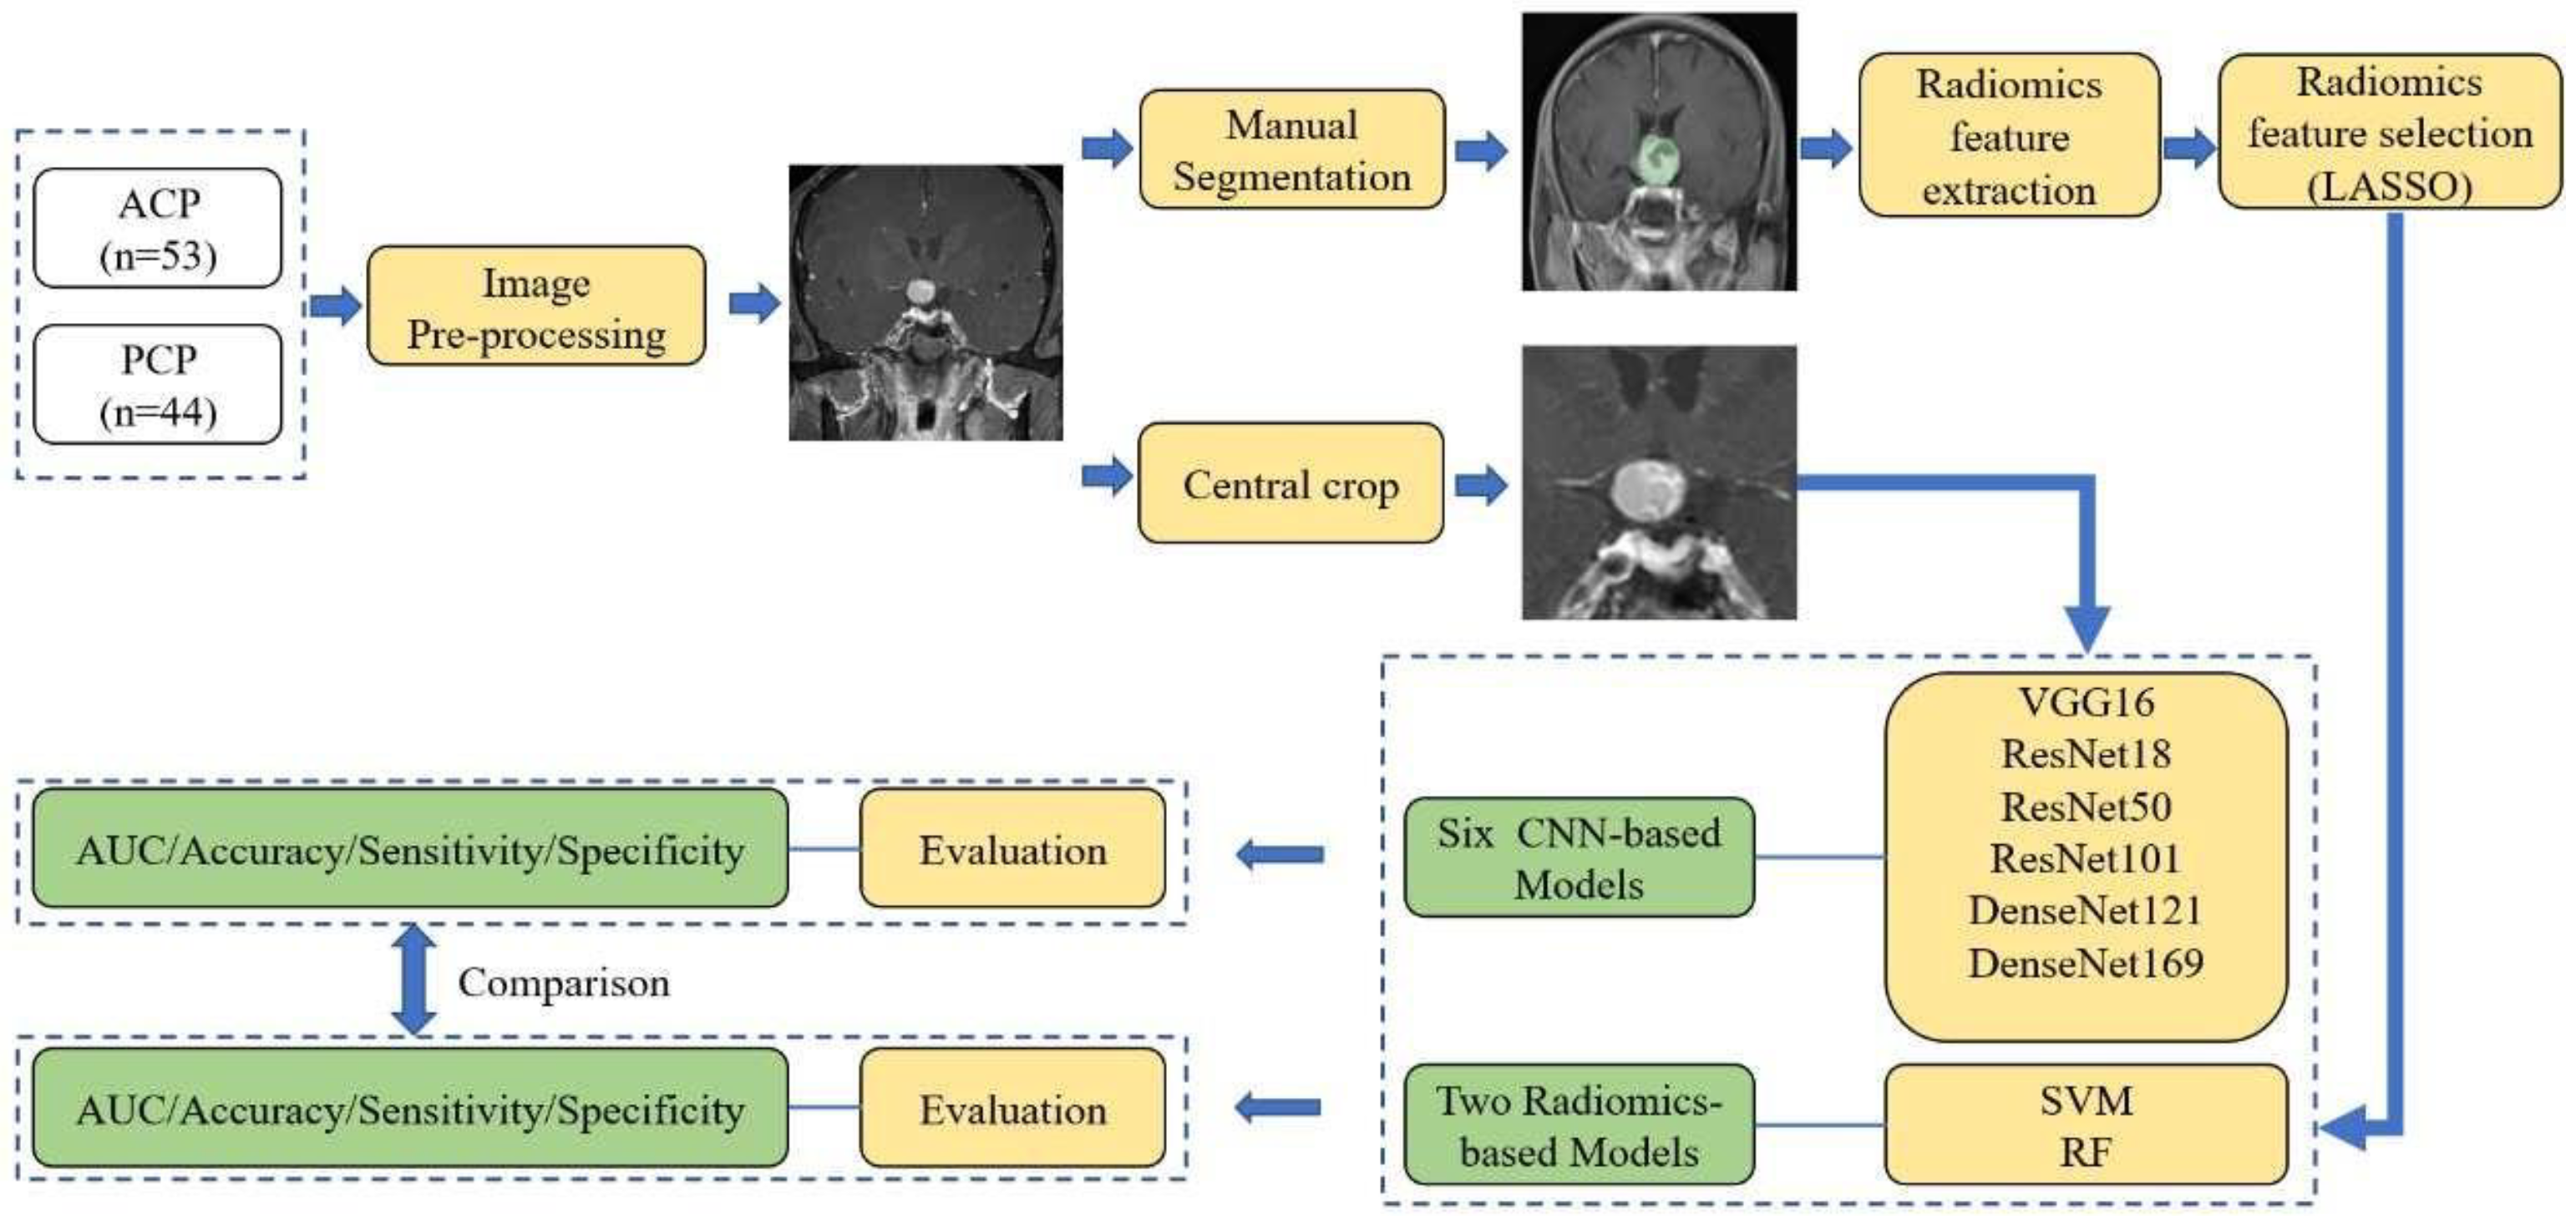
2.3. Image Preprocessing and Deep Neural Network Architecture

All experiments were performed on our laboratory workstation (CPU: 2.20 GHz Intel Xeon Silver 4214; RAM: 128 Gb; GPU: 24 Gb Nvidia RTX3090; OS: Ubuntu 20.04; Intel Corporation, Santa Clara, CA, USA). The model was programmed using the Python programming language, and the codes are available at https://github.com/pytorch/vision/tree/main/torchvision/models (accessed on 19 April 2022). No modifications were made in setting the network hyperparameters and data augmentation strategy.
In preprocessing, the mean in-plane voxel sizes were resampled to 1 × 1 × 1 mm3 and normalized to [0, 1]. Then, the images were cropped to 50 × 50 and centered on the lesion.
Data augmentation was also used, where the images were randomly flipped horizontally and vertically and rotated within the range of −30 to 30 degrees for each epoch. In this study, the batch size of each architecture was set to 32. We started with a learning rate of 5E-5, multiplied it by 0.96 every six epochs, and terminated the training after 200 epochs. Three state-of-art 2D-CNN architectures were used in the current research, including VGG, ResNet, and DenseNet. They represented high-performance medical image classification, and are usually set as the ground truth in methodological research. The representative images of the CNN structure are shown in Figure 3, and a detailed description of the networks is provided below.

2.3.1. VGG Networks

Visual geometry group networks (VGG) are widely used in clinical image classification, such as the diagnosis of COVID-19 and colorectal cancer [29,30]. We implemented VGG16 [31] in this study, in which 16 refers to the number of layers that have weights (Figure 3A). This network is characterized by the convolutional layers of 3 × 3 filters with a stride of 1 and the max pooling layers of 2 × 2 filters with a stride of 2. The arrangement of the convolutional layers and pooling layers runs through the entire architecture. In the end, there are two fully connected layers followed by a softmax layer for output. A residual neural network (ResNet) solves the vanishing gradient problem by providing residual connections to skip one or more layers (Figure 3B) [32], which was used in previous studies to diagnose breast lesions and predict microvascular invasion in hepatocellular carcinoma [33,34]. The plain architecture of ResNet is primarily inspired by the concept of VGG, with convolutional layers that mainly have 3 × 3 filters. As shown in Figure 3C, the residual connection acts as a simple identity mapping function, and its out- put is the same as input x. The output of the residual connection, x, is added to the output of the stacked layers, F(x, Wi); thus, a building block is defined as y = F(x, Wi) + x. In this formulation, x and y are the input and output of the building block and F(x, Wi) is the residual mapping to be learned. In this study, we implemented ResNet18, ResNet50, and ResNet101, which have 18, 50, and 101 weighted layers, respectively.

2.3.2. DenseNet Networks

A dense convolutional network (DenseNet) is another CNN that introduces direct connections among all the layers [35]. They are used in the classification of diseases using clinical images, such as lung tumors and Parkinson’s disease [36,37]. Each layer obtains feature maps from all preceding layers and passes its output to all subsequent layers. As shown in Figure 3D,E, the architecture of a DenseNet contains dense blocks and transition layers. Each layer in a dense block is of the same feature-map size and implements a composite function of batch normalization, a rectified linear unit, and convolution. Because the size of the feature map is unchanged in a dense block, a transition layer that can change the feature maps is used between two contiguous blocks for downsampling, which contains a batch normalization layer, a convolutional layer (filter: 1 × 1), and an average pooling layer (filter: 2 × 2) with a stride of 2. We used DenseNet121 and DenseNet169 in this study, which were composed of 121 and 169 weighted layers, respectively.

2.4. Deep Learning Model Training and Test

Two-dimensional MRIs were set as the input, and the output of each case was calculated by the average probability of the slices. We applied a stratified five-fold cross-validation to evaluate the performance of the six CNN architectures. Specifically, in each fold, the numbers of ACP and PCP were 10/13 and 8/9, respectively. A receiver operation characteristics (ROC) analysis was conducted to evaluate the prediction performance of the model at all classification thresholds. The area under the ROC curve (AUC), accuracy, sensitivity, and specificity were calculated for each model. The superior model was determined as the one with the highest AUC. The performance of a network was presented with the means and standard deviations (SDs) of these metrics of the five models generated during the five-fold cross-validation.

2.5. Radiomics Method

Under the supervision of the senior radiologist, two researchers manually contoured the tumors slice by slice using 3D Slicer software [38]. PyRadiomics v3.0.1 was used to extract radiomics features from segmentations [39]. A total of 851 radiomics features were extracted, followed by a feature selection using a least absolute shrinkage and selection operator (LASSO) regression, a commonly used method for the regression of high-dimensional data [40,41,42]. Then, two machine-learning algorithms were employed to develop classification models, including support vector machine (SVM) and random forest (RF) [43]. The overall workflow of this research is shown in Figure 4. The AUC, accuracy, sensitivity, and specificity were calculated for each model for evaluation.

2.6. Statistical Analysis

The characteristics of the patients and tumors were compared between the two groups using chi-square tests and t-tests for categorical and continuous variables, respectively. All tests were two-sided, and p < 0.05 was considered statistically significant. All statistical analyses were conducted using Stata (version 15.1, Stata Corp., College Station, TX, USA). The CNN models were programed in the Python language and operated in the NVIDIA 3090 (NVIDIA Corporation, Santa Clara, CA, USA) data center accelerator. All radiomics algorithms were performed with R v3.6.3.

3. Results

3.1. Clinical Characteristics of the Study Population

The characteristics of the patients and tumors are summarized in Table 1. A total of 97 patients diagnosed with ACP or PCP were included in this study. Among these patients, 53 patients were diagnosed with ACP and 44 patients were diagnosed with PCP. The mean ages were 49.6 years in the ACP group and 44.7 years in the PCP group (p = 0.187). The male/female ratios were 1.04 and 1.44 in the ACP group and PCP group, respectively (p = 0.422). The mean durations of symptom onset were 50.89 weeks in the ACP group and 39.73 weeks in the PCP group (p = 0.453). Hypothalamic involvement was observed in 11 cases in the ACP group and 17 cases in the PCP group (p = 0.053). Symptomatic patients accounted for 96.2% of the ACP group and 93.2% of the PCP group. Headache, visual impairment, and endocrine dysfunction were the most common symptoms in both groups, and there was no significant differences in the distribution of symptoms.

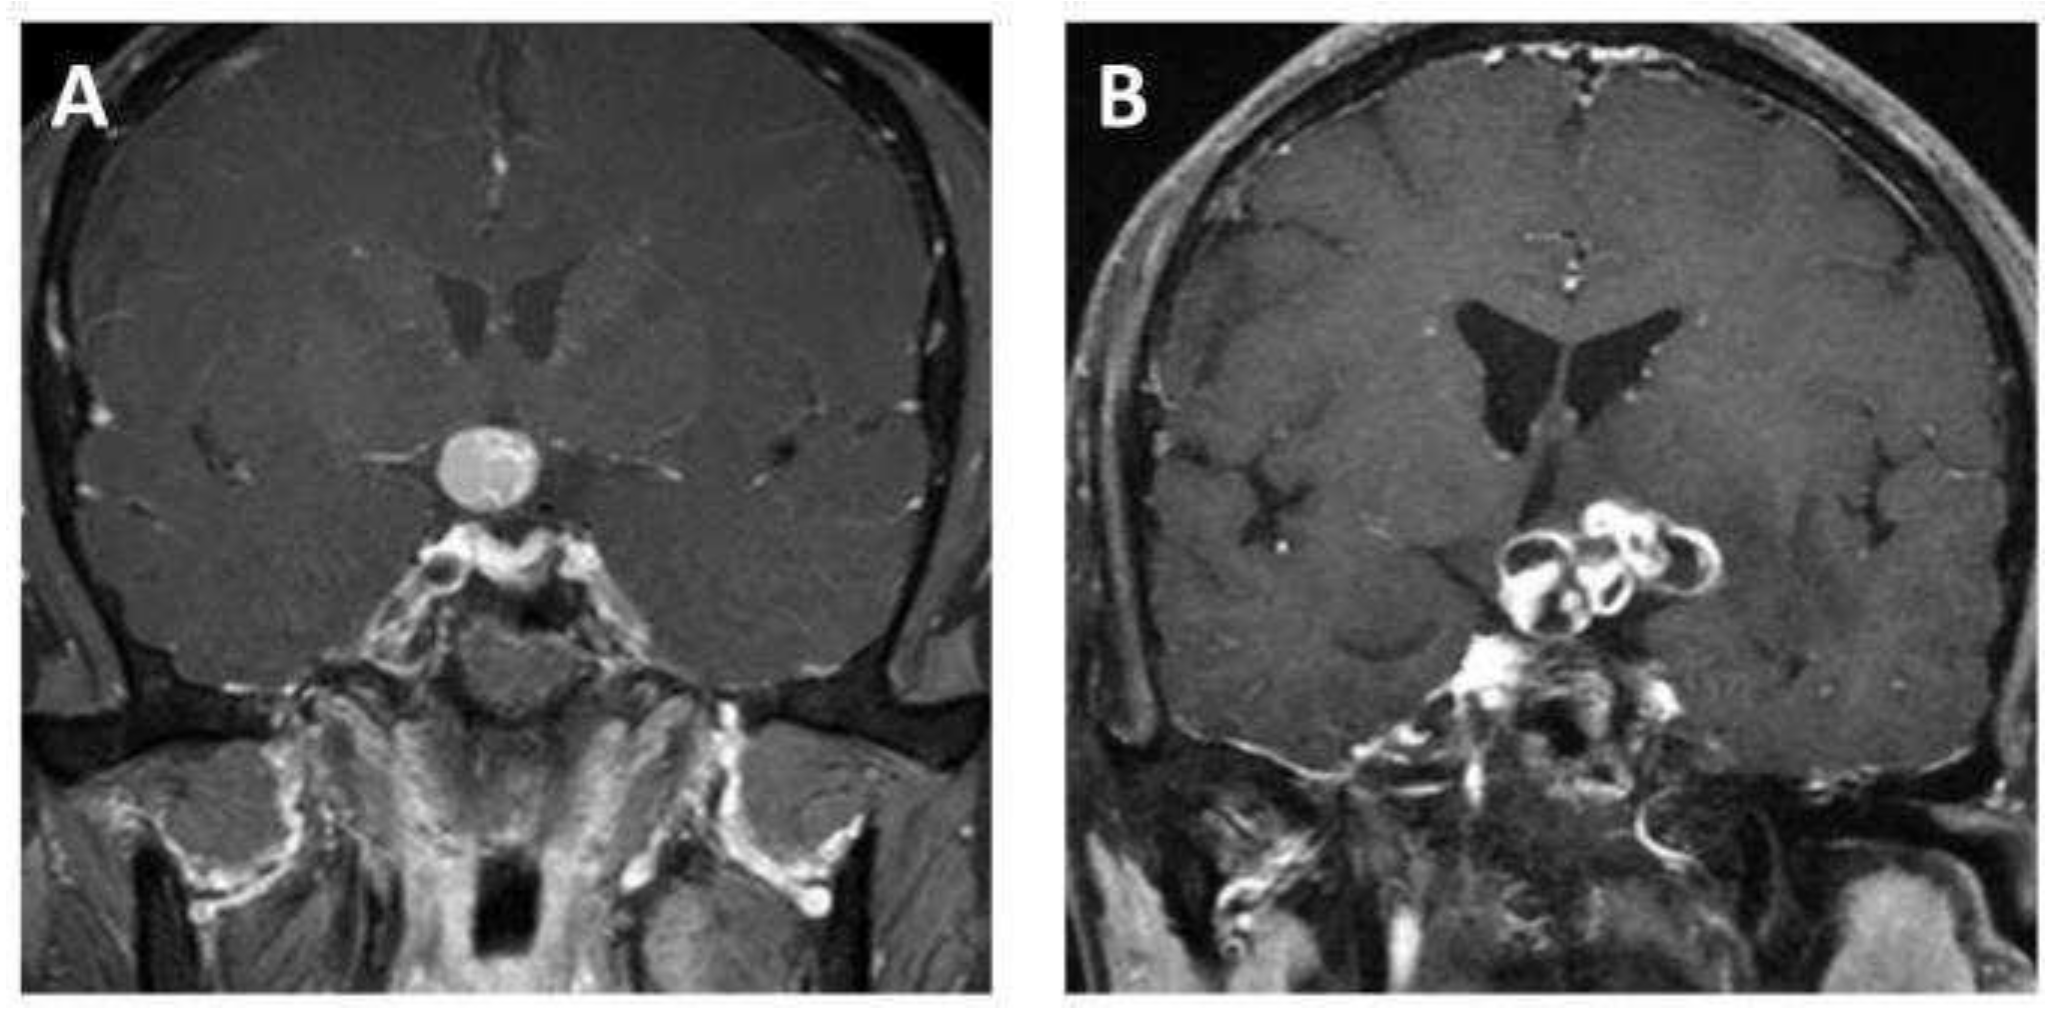
3.2. Radiological Features of Tumors

The radiological features of tumors are shown in Table 1. The mean maximum diameter of ACP was significantly larger than that of PCP (37.91 mm vs. 30.02 mm, p = 0.015). There were no significant differences between the two groups regarding the location (p = 0.396), tissue component (p = 0.154), or shape (p = 0.751) of the tumors. As for the tumor location, in the ACP group, 29 patients had a tumor located in the suprasellar region, and 24 patients had a tumor in the suprasellar region with a sellar extension. In the PCP group, 27 tumors were located in the suprasellar region, 16 were located in the suprasellar region with a sellar extension, and 1 was located in the intrasellar region without suprasellar involvement. For the tumor components, 7, 15, and 31 ACPs were solid, cystic, and mixed, respectively, compared with 10, 6, and 28 of the PCPs. Moreover, 20.8% of ACPs had a regular shape, and 18.2% of PCPs were regular.

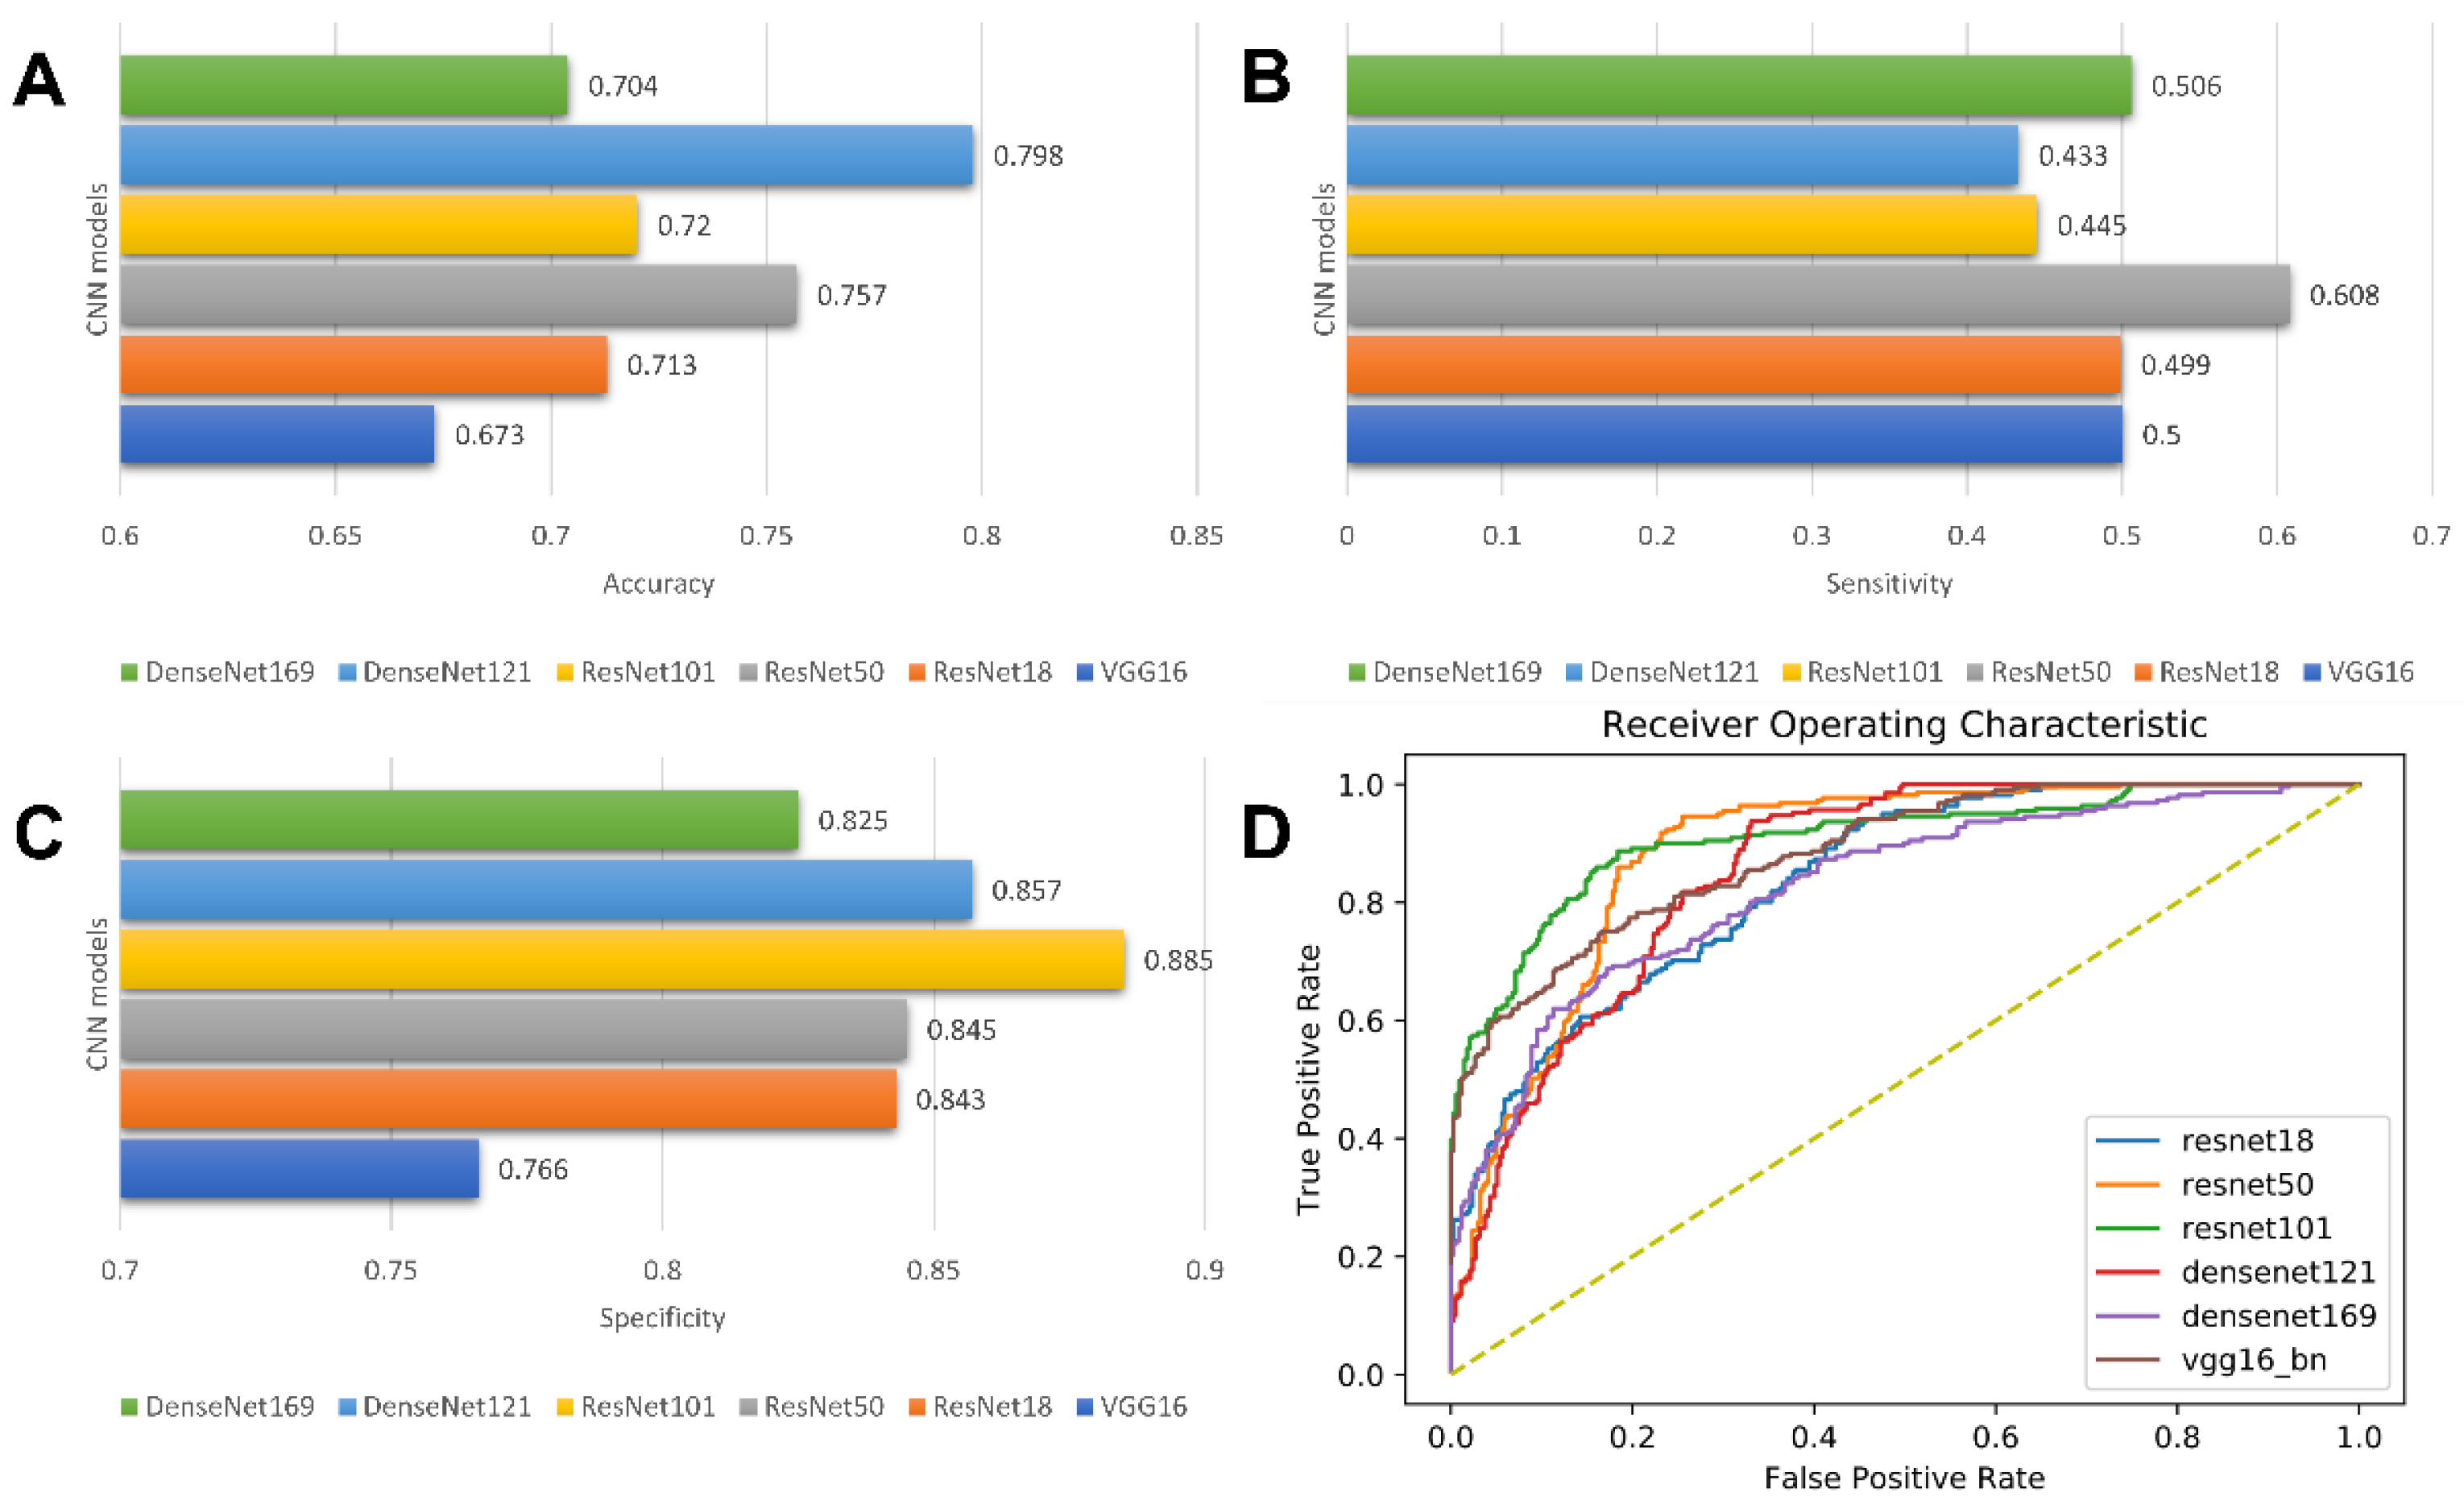
3.3. Prediction Performance of CNNs

In this study, six state-of-the-art CNN architectures, including VGG16, ResNet18, ResNet50, ResNet101, DenseNet121, and DenseNet169, with a five-fold cross-validation, were implemented. Among the six deep learning models, the VGG16-based model and ResNet50-based model showed the best predictive performance, with AUC values of 0.822 and 0.838, respectively. For the model built with VGG16, accuracy = 0.673 ± 0.013; sensitivity = 0.500 ± 0.327; and specificity = 0.766 ± 0.189, respectively. For the model based on Resnet50, the accuracy, sensitivity, and specificity were 0.757± 0.052, 0.608± 0.198, and 0.845 ± 0.034, respectively. Detailed results of the model performance are summarized in Table 2 and illustrated in Figure 5.

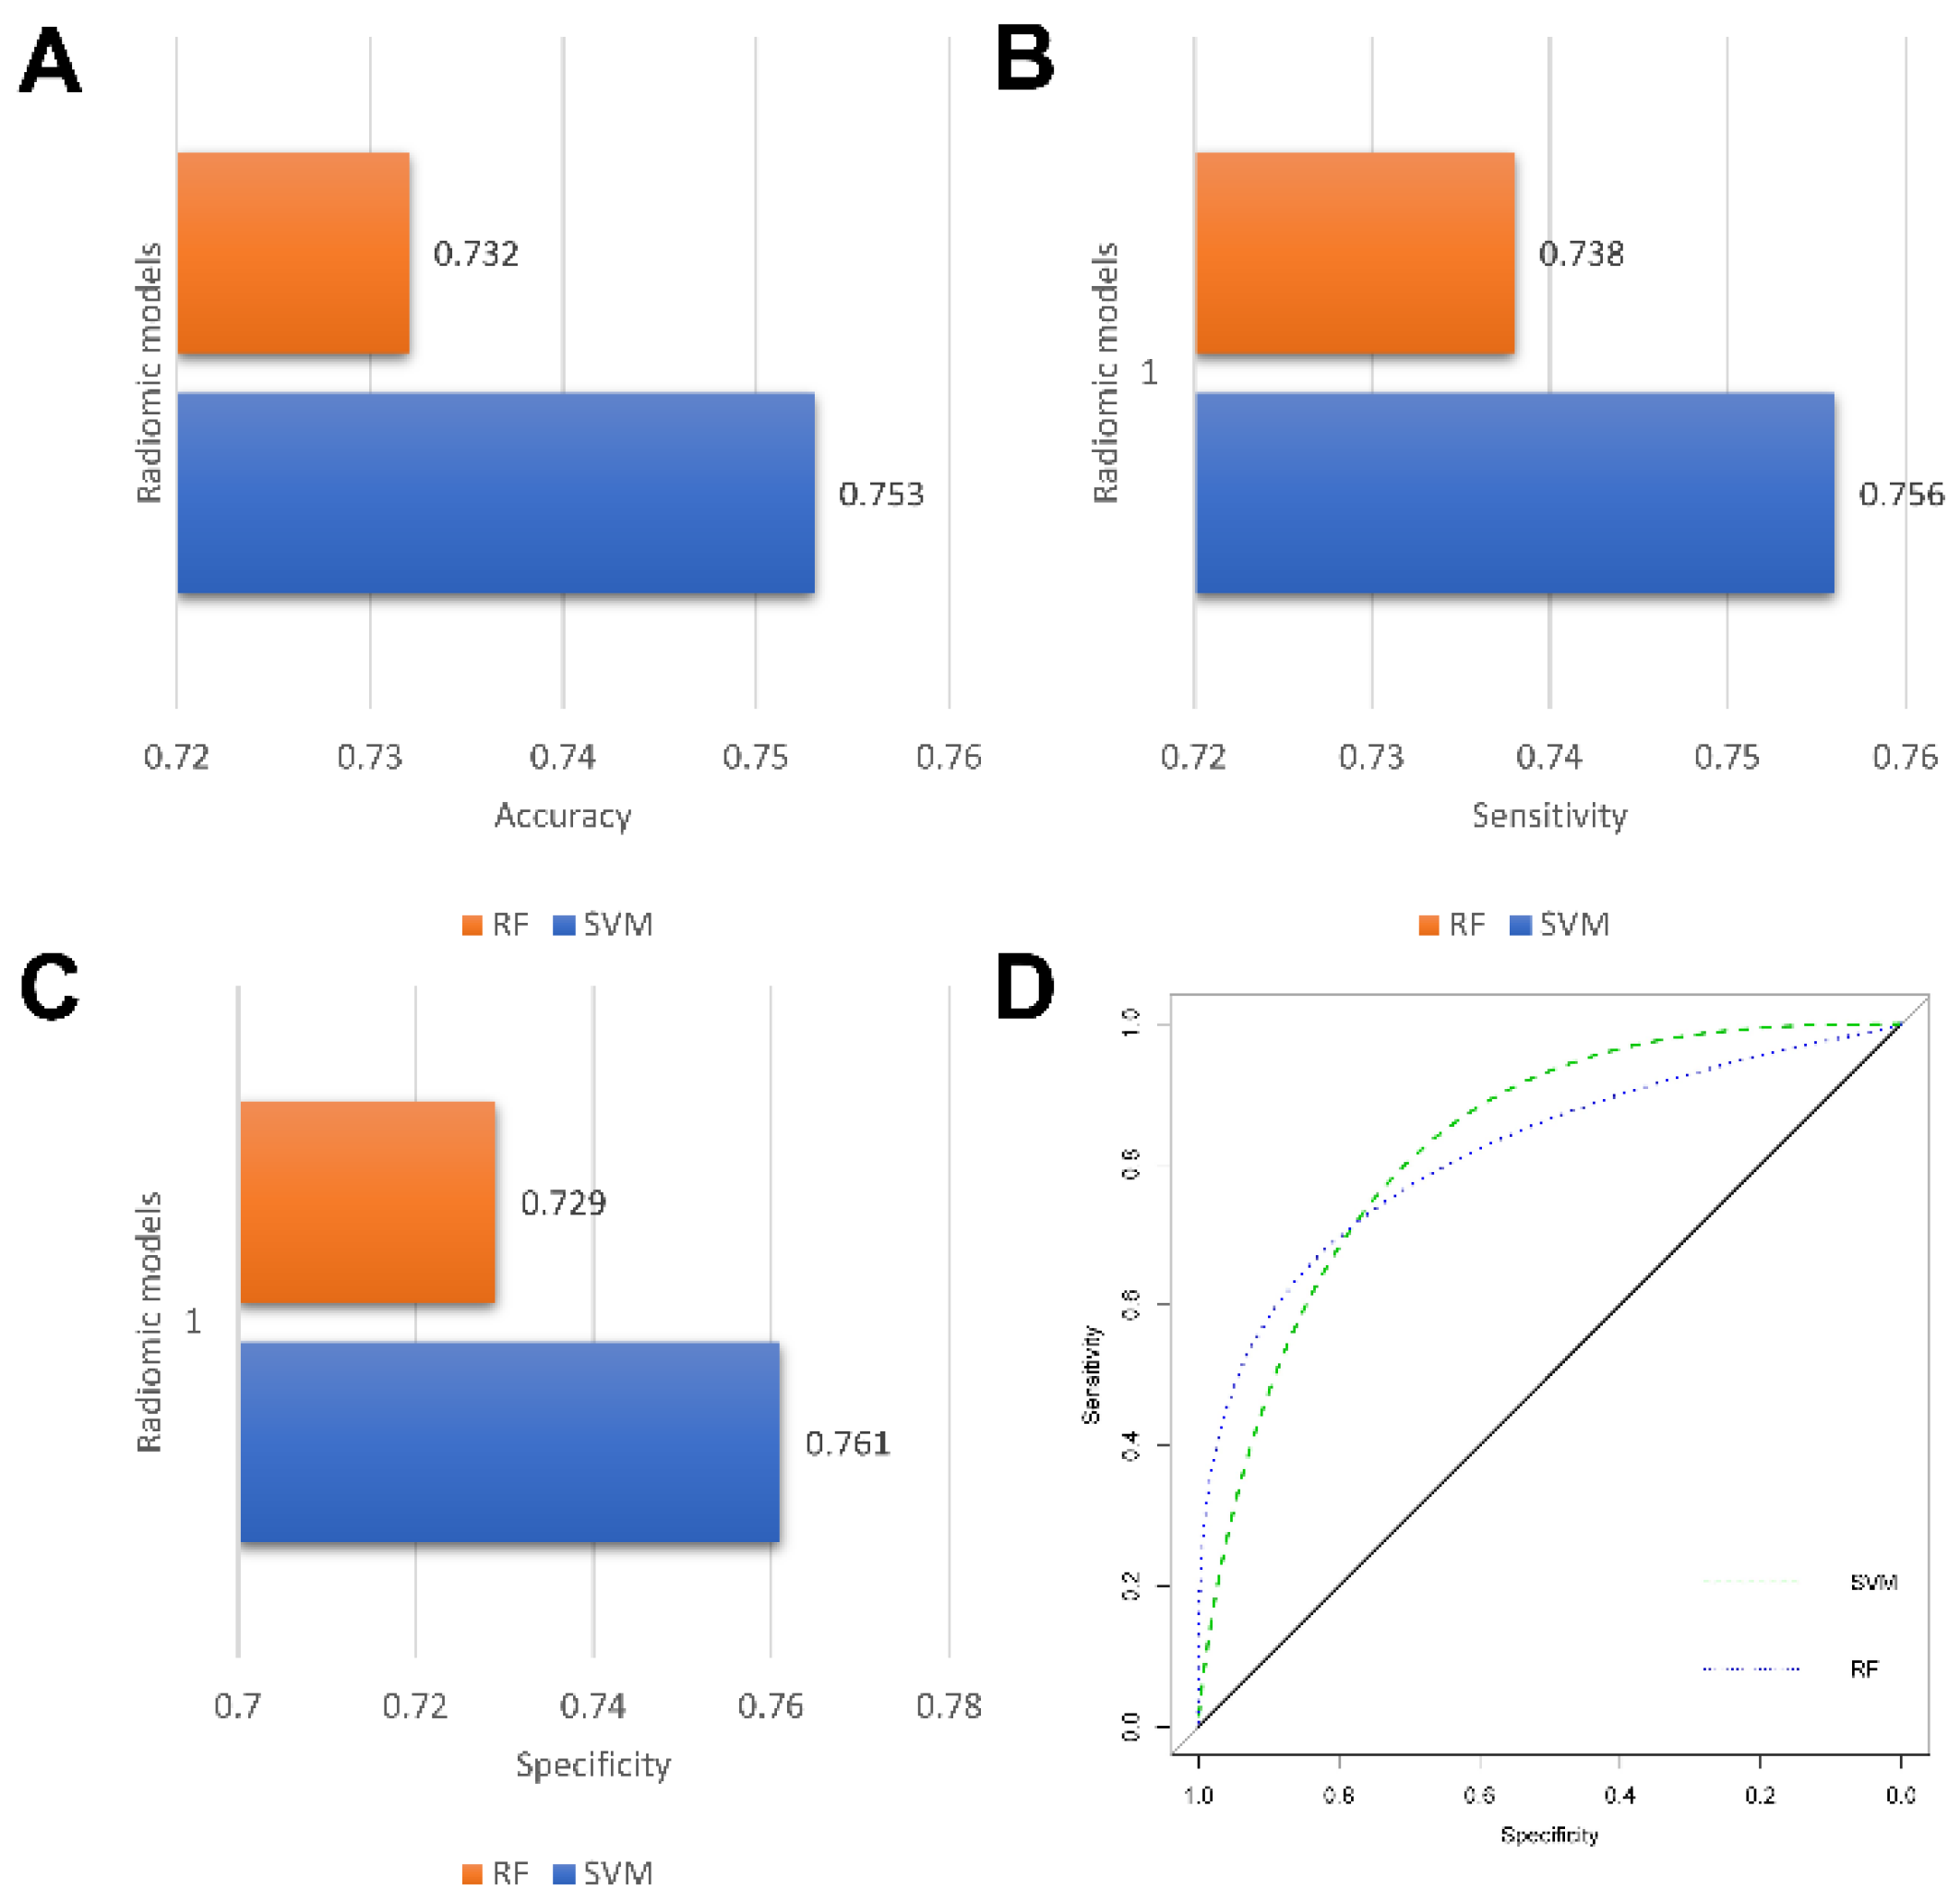
3.4. Predictive Performance of Radiomics Model

In this study, a total of nine radiomics features were selected using a LASSO regression. The detailed radiomics features selected for each fold are listed in Supplementary Materials S1. Three machine learning models were constructed based on the selected radiomics features, with an AUC of more than 0.760 in the validation set. In a comparison of the two radiomics models, the RF-based model showed the better predictive performance, achieving the highest AUC of 0.769 ± 0.066 in the validation, while the accuracy, sensitivity, and specificity were 0.732 ± 0.053, 0.738 ± 0.044, and 0.729 ± 0.085, respectively. The detailed performances of the three radiomics models are summarized in Table 2 and illustrated in Figure 6.
In general, the CNN models performed better than the radiomics models, and the ResNet50-based model represented the best performance for the classification of ACP and PCP.

4. Discussion

In this study, we proposed six segmentation-free CNN models for the classification of ACP and PCP using routine contrast-enhanced T1-weighted MRIs. VGG, ResNets, and DenseNets with different weighted layers were adapted to establish CNN models. The results showed that all architectures were feasible for the discrimination of ACP and PCP and showed competitive prediction performances compared to the radiomics method. The ResNet50-based model represented the optimal architecture, with the highest AUC of 0.838, indicating that the model has the potential to help with the preoperative differentiation of ACP and PCP in adult patients and to facilitate personalized decision making for targeted therapy for craniopharyngioma.
ACP and PCP are regarded as two distinct tumors according to the 2021 WHO classification of CNS tumors [2]. First and for most, ACPs are driven by genetic mutations in CTNNB1 and have molecularly and histologically been proposed to be of embryonic origin. In contrast, PCPs harbor BRAFV600E mutations [7,44,45]. Moreover, PCP was reported to have a lower recurrence rate and mortality rate than ACP after surgical resection [46,47,48]. Conventional MRI features, such as the tumor shape, composition, location, and enhancement pattern, are also useful in the discrimination of the two subtypes of craniopharyngioma. However, previous research suggested that the machine learning model could achieve a diagnostic performance of AUC = 0.671 in validation cohorts [23]. Similarly, we found that these clinical features or MRI features in our cohort were mostly not significantly different in adult patients, suggesting that the use of MRI characteristics may be inadequate for the classification of ACP and PCP for diagnostic purposes. Previous computer-aided diagnosis (CAD) studies developed several radiomics-based machine learning models for the classification of ACP and PCP. These models were realized using selected radiomics features extracted from MRIs. One study with a total of 44 patients, by adopting a random forest classifier and four selected features, achieved an AUC of 0.89 for the classification [22]. Another multicenter study using multi-parametric MRI included a total of 164 patients, with 99 in the training group, 33 in the validation group, and 32 in the independent validation group [23]. The seven most significant radiomics features were fed into a linear support vector machine classifier, and they achieved AUCs of 0.899, 0.810, and 0.920 in the training, internal validation, and external validation groups, respectively [23]. These studies suggested that a model developed with artificial intelligence algorithms could be feasible for discriminating ACP from PCP. Compared to previous studies, the highlights of our study can be summarized as follows: First, our model was a segmentation-free end-to-end approach, indicating that human segmentation, radiomics extraction, and feature selection were not necessary in this research. Second, peritumoral regions were also included as network inputs in our research, which had been demonstrated to be helpful in predicting the characteristics of ACP [42]. Third, this study was more clinically relevant, as only adult patients were involved. The age distribution of craniopharyngioma showed significance in discrimination, as most pediatric patients were diagnosed with ACP. To make our research more clinically relevant, we excluded the pediatric patients to prevent the influence of age and only involved adult patients in this research. However, compared with previous studies with AUC values of 0.899 and 0.89, the performances of our model were slightly inadequate, with an AUC of 0.838, an accuracy of 0.757, a sensitivity of 0.608, and a specificity of 0.845 [23]. This might be attributed to the differences in the inputs into the algorithms. The model with an AUC of 0.899 was built with a multisequence feature. Previous studies suggested that, compared with single-sequence feature sets, multisequence feature sets could provide more information, and showed superior results [49,50,51]. In addition, the model with an AUC of 0.89 was built using the radiomics features extracted from high-resolution T1-w images [22]. We believe that the diagnostic performance of our CNN models could be further improved by using higher-quality images and multisequence images.
Although ResNet50 achieved the highest AUC of 0.838, the sensitivity of this model was relatively low, with a value of 0.608, and the specificity was acceptable, with a value of 0.845. This result suggested that the model was inclined to choose ACP rather than PCP in the molecular prediction. Similar results were also suggested in one previous study [23]. On the contrary, although the radiomics models showed relatively low performance, with an AUC of 0.769, all evaluation indicators showed more balanced values, with a sensitivity of 0.738 and a specificity of 0.729. Therefore, the results should be interpreted more carefully, and for neuro-radiologists and neuro-oncologists, who may need the most assistance from the intelligent model, this point should be considered when using AI models for pretreatment diagnosis.
This study had several limitations. First, this was a single-center retrospective study with inevitable selection bias. External validation in datasets of geographically diverse institutions is needed in future studies to verify the generalizability of the deep neural networks. Second, the sample size of this study was relatively small. Given the rarity of craniopharyngiomas, training models with datasets from multiple institutions is a required approach to increase the training group size and to improve the performance of neural networks in future studies. Third, only contrast-enhanced T1 images were used as CNN inputs, and the values of other sequences were unclear. Given that previous studies suggested that T1-w images played an important role in the differentiation, future studies are required to investigate if the CNN models could be improved when combined with other sequences and advanced MR technology.

5. Conclusions

This study proposed CNN models to discriminate ACP from PCP on MRIs. The trained models showed feasibility in the discrimination and were competitive with classical radiomics models. Drug-targeted therapy is a promising approach at the forefront of the current research in the management of craniopharyngiomas. Our models developed using deep learning technology could potentially be utilized as novel tools to assist clinicians in selecting individualized treatments for patients with craniopharyngioma.

Supplementary Materials

The following supporting information can be downloaded at: https://www.mdpi.com/article/10.3390/jcm11247481/s1, Supplementary Materials S1: Radiomic features selected using LASSO regression in training set.

Author Contributions

Conceptualization, C.C. and J.X.; Methodology, Y.T., X.R., C.C. and J.X.; Software, B.C.; Validation, Y.T. and X.R.; Formal analysis, Y.T. and X.R.; Investigation, Y.T. and X.R.; Data curation, X.R. and B.C.; Writing—original draft, Y.T. and X.R.; Writing—review & editing, C.C. and J.X.; Funding acquisition, J.X. All authors have read and agreed to the published version of the manuscript.

Funding

This research was funded by Knowledge Innovation Program of the Chinese Academy of Sciences (JH2022007) and 1·3·5 project for disciplines of excellence–Clinical Research Incubation Project, West China Hospital, Sichuan University (2020HXFH036).

Institutional Review Board Statement

The study was conducted in accordance with the Declaration of Helsinki, and approved by the institutional review board of West China Hospital, Sichuan University (protocol code 2021-S-851; date of approval 6 June 2021).

Informed Consent Statement

This retrospective study was approved by the institutional review board of West China Hospital, Sichuan University, and the informed consent was waived (2021-S-851).

Data Availability Statement

The radiomic data obtained for this study are available upon reasonable request to the corresponding author.

Conflicts of Interest

The authors declare no conflict of interest.

References

  1. Müller, H.L.; Merchant, T.E.; Warmuth-Metz, M.; Martinez-Barbera, J.P.; Puget, S. Craniopharyngioma. Nat. Rev. Dis. Primers 2019, 5, 75. [Google Scholar] [CrossRef] [PubMed]
  2. Louis, D.N.; Perry, A.; Wesseling, P.; Brat, D.J.; Cree, I.A.; Figarella-Branger, D.; Hawkins, C.; Ng, H.K.; Pfister, S.M.; Reifenberger, G.; et al. The 2021 WHO Classification of Tumors of the Central Nervous System: A summary. Neuro Oncol. 2021, 23, 1231–1251. [Google Scholar] [CrossRef] [PubMed]
  3. Hamblin, R.; Tsermoulas, G.; Karavitaki, N. Craniopharyngiomas. Presse Med. 2021, 50, 104078. [Google Scholar] [CrossRef] [PubMed]
  4. Ostrom, Q.T.; Gittleman, H.; Liao, P.; Vecchione-Koval, T.; Wolinsky, Y.; Kruchko, C.; Barnholtz-Sloan, J.S. CBTRUS Statistical Report: Primary brain and other central nervous system tumors diagnosed in the United States in 2010-2014. Neuro Oncol. 2017, 19, v1–v88. [Google Scholar] [CrossRef] [Green Version]
  5. Wu, J.; Wu, X.; Yang, Y.Q.; Ding, H.; Yang, L.; Bao, Y.Y.; Zhou, L.; Yang, C.X.; Hong, T. Association of histological subtype with risk of recurrence in craniopharyngioma patients: A systematic review and meta-analysis. Neurosurg. Rev. 2022, 45, 139–150. [Google Scholar] [CrossRef] [PubMed]
  6. Lara-Velazquez, M.; Mehkri, Y.; Panther, E.; Hernandez, J.; Rao, D.; Fiester, P.; Makary, R.; Rutenberg, M.; Tavanaiepour, D.; Rahmathulla, G. Current Advances in the Management of Adult Craniopharyngiomas. Curr. Oncol. 2022, 29, 1645–1671. [Google Scholar] [CrossRef]
  7. Brastianos, P.K.; Taylor-Weiner, A.; Manley, P.E.; Jones, R.T.; Dias-Santagata, D.; Thorner, A.R.; Lawrence, M.S.; Rodriguez, F.J.; Bernardo, L.A.; Schubert, L.; et al. Exome sequencing identifies BRAF mutations in papillary craniopharyngiomas. Nat. Genet. 2014, 46, 161–165. [Google Scholar] [CrossRef]
  8. Hölsken, A.; Sill, M.; Merkle, J.; Schweizer, L.; Buchfelder, M.; Flitsch, J.; Fahlbusch, R.; Metzler, M.; Kool, M.; Pfister, S.M.; et al. Adamantinomatous and papillary craniopharyngiomas are characterized by distinct epigenomic as well as mutational and transcriptomic profiles. Acta Neuropathol. Commun. 2016, 4, 20. [Google Scholar] [CrossRef] [Green Version]
  9. Brastianos, P.K.; Santagata, S. ENDOCRINE TUMORS: BRAF V600E mutations in papillary craniopharyngioma. Eur. J. Endocrinol. 2016, 174, R139–R144. [Google Scholar] [CrossRef] [Green Version]
  10. Roque, A.; Odia, Y. BRAF-V600E mutant papillary craniopharyngioma dramatically responds to combination BRAF and MEK inhibitors. CNS Oncol. 2017, 6, 95–99. [Google Scholar] [CrossRef]
  11. Himes, B.T.; Ruff, M.W.; Van Gompel, J.J.; Park, S.S.; Galanis, E.; Kaufmann, T.J.; Uhm, J.H. Recurrent papillary craniopharyngioma with BRAF V600E mutation treated with dabrafenib: Case report. J. Neurosurg. 2018, 130, 1299–1303. [Google Scholar] [CrossRef] [PubMed] [Green Version]
  12. Juratli, T.A.; Jones, P.S.; Wang, N.; Subramanian, M.; Aylwin, S.J.B.; Odia, Y.; Rostami, E.; Gudjonsson, O.; Shaw, B.L.; Cahill, D.P.; et al. Targeted treatment of papillary craniopharyngiomas harboring BRAF V600E mutations. Cancer 2019, 125, 2910–2914. [Google Scholar] [CrossRef] [PubMed] [Green Version]
  13. Brastianos, P.K.; Shankar, G.M.; Gill, C.M.; Taylor-Weiner, A.; Nayyar, N.; Panka, D.J.; Sullivan, R.J.; Frederick, D.T.; Abedalthagafi, M.; Jones, P.S.; et al. Dramatic Response of BRAF V600E Mutant Papillary Craniopharyngioma to Targeted Therapy. J. Natl. Cancer Inst. 2016, 108, djv310. [Google Scholar] [CrossRef] [PubMed]
  14. Mori, M.; Takeshima, H.; Kuratsu, J. Expression of interleukin-6 in human craniopharyngiomas: A possible inducer of tumor-associated inflammation. Int. J. Mol. Med. 2004, 14, 505–509. [Google Scholar] [CrossRef]
  15. Wang, Y.; Deng, J.; Wang, L.; Zhou, T.; Yang, J.; Tian, Z.; Yang, J.; Chen, H.; Tang, X.; Zhao, S.; et al. Expression and clinical significance of PD-L1, B7-H3, B7-H4 and VISTA in craniopharyngioma. J. Immunother. Cancer 2020, 8, e000406. [Google Scholar] [CrossRef]
  16. Sartoretti-Schefer, S.; Wichmann, W.; Aguzzi, A.; Valavanis, A. MR differentiation of adamantinous and squamous-papillary craniopharyngiomas. AJNR. Am. J. Neuroradiol. 1997, 18, 77–87. [Google Scholar]
  17. Lee, I.H.; Zan, E.; Bell, W.R.; Burger, P.C.; Sung, H.; Yousem, D.M. Craniopharyngiomas: Radiological Differentiation of Two Types. J. Korean Neurosurg. Soc. 2016, 59, 466–470. [Google Scholar] [CrossRef]
  18. Bangalore Yogananda, C.G.; Shah, B.R.; Vejdani-Jahromi, M.; Nalawade, S.S.; Murugesan, G.K.; Yu, F.F.; Pinho, M.C.; Wagner, B.C.; Mickey, B.; Patel, T.R.; et al. A novel fully automated MRI-based deep-learning method for classification of IDH mutation status in brain gliomas. Neuro Oncol. 2020, 22, 402–411. [Google Scholar] [CrossRef]
  19. Ben Naceur, M.; Akil, M.; Saouli, R.; Kachouri, R. Fully automatic brain tumor segmentation with deep learning-based selective attention using overlapping patches and multi-class weighted cross-entropy. Med. Image Anal. 2020, 63, 101692. [Google Scholar] [CrossRef]
  20. Xue, J.; Wang, B.; Ming, Y.; Liu, X.; Jiang, Z.; Wang, C.; Liu, X.; Chen, L.; Qu, J.; Xu, S.; et al. Deep learning-based detection and segmentation-assisted management of brain metastases. Neuro Oncol. 2020, 22, 505–514. [Google Scholar] [CrossRef]
  21. Zhang, M.; Young, G.S.; Chen, H.; Li, J.; Qin, L.; McFaline-Figueroa, J.R.; Reardon, D.A.; Cao, X.; Wu, X.; Xu, X. Deep-Learning Detection of Cancer Metastases to the Brain on MRI. J. Magn. Reson. Imaging JMRI 2020, 52, 1227–1236. [Google Scholar] [CrossRef] [PubMed]
  22. Chen, X.; Tong, Y.; Shi, Z.; Chen, H.; Yang, Z.; Wang, Y.; Chen, L.; Yu, J. Noninvasive molecular diagnosis of craniopharyngioma with MRI-based radiomics approach. BMC Neurol. 2019, 19, 6. [Google Scholar] [CrossRef] [PubMed]
  23. Huang, Z.S.; Xiao, X.; Li, X.D.; Mo, H.Z.; He, W.L.; Deng, Y.H.; Lu, L.J.; Wu, Y.K.; Liu, H. Machine Learning-Based Multiparametric Magnetic Resonance Imaging Radiomic Model for Discrimination of Pathological Subtypes of Craniopharyngioma. J. Magn. Reson. Imaging JMRI 2021, 54, 1541–1550. [Google Scholar] [CrossRef] [PubMed]
  24. Lin, D.; Zhao, W.; Yang, J.; Wang, H.; Zhang, H. Integrative Analysis of Biomarkers and Mechanisms in Adamantinomatous Craniopharyngioma. Front. Genet. 2022, 13, 830793. [Google Scholar] [CrossRef] [PubMed]
  25. Havaei, M.; Davy, A.; Warde-Farley, D.; Biard, A.; Courville, A.; Bengio, Y.; Pal, C.; Jodoin, P.M.; Larochelle, H. Brain tumor segmentation with Deep Neural Networks. Med. Image Anal. 2017, 35, 18–31. [Google Scholar] [CrossRef] [PubMed] [Green Version]
  26. Pereira, S.; Pinto, A.; Alves, V.; Silva, C.A. Brain Tumor Segmentation Using Convolutional Neural Networks in MRI Images. IEEE Trans Med Imaging 2016, 35, 1240–1251. [Google Scholar] [CrossRef]
  27. LeCun, Y.; Bengio, Y.; Hinton, G. Deep learning. Nature 2015, 521, 436–444. [Google Scholar] [CrossRef]
  28. Esteva, A.; Robicquet, A.; Ramsundar, B.; Kuleshov, V.; DePristo, M.; Chou, K.; Cui, C.; Corrado, G.; Thrun, S.; Dean, J. A guide to deep learning in healthcare. Nat. Med. 2019, 25, 24–29. [Google Scholar] [CrossRef]
  29. Sitaula, C.; Hossain, M.B. Attention-based VGG-16 model for COVID-19 chest X-ray image classification. Appl. Intell. 2021, 51, 2850–2863. [Google Scholar] [CrossRef]
  30. Yoon, H.; Lee, J.; Oh, J.E.; Kim, H.R.; Lee, S.; Chang, H.J.; Sohn, D.K. Tumor Identification in Colorectal Histology Images Using a Convolutional Neural Network. J. Digit. Imaging 2019, 32, 131–140. [Google Scholar] [CrossRef]
  31. Simonyan, K.; Zisserman, A.J. Very deep convolutional networks for large-scale image recognition. arXiv 2014, arXiv:1409.1556. [Google Scholar]
  32. He, K.; Zhang, X.; Ren, S.; Sun, J. Deep residual learning for image recognition. In Proceedings of the IEEE Conference on Computer Vision and Pattern Recognition, Las Vegas, NV, USA, 27–30 June 2016; pp. 770–778. [Google Scholar]
  33. Zhou, J.; Zhang, Y.; Chang, K.T.; Lee, K.E.; Wang, O.; Li, J.; Lin, Y.; Pan, Z.; Chang, P.; Chow, D.; et al. Diagnosis of Benign and Malignant Breast Lesions on DCE-MRI by Using Radiomics and Deep Learning With Consideration of Peritumor Tissue. J. Magn. Reson. Imaging JMRI 2020, 51, 798–809. [Google Scholar] [CrossRef] [PubMed]
  34. Liu, S.C.; Lai, J.; Huang, J.Y.; Cho, C.F.; Lee, P.H.; Lu, M.H.; Yeh, C.C.; Yu, J.; Lin, W.C. Predicting microvascular invasion in hepatocellular carcinoma: A deep learning model validated across hospitals. Cancer Imaging 2021, 21, 56. [Google Scholar] [CrossRef] [PubMed]
  35. Huang, G.; Liu, Z.; Van Der Maaten, L.; Weinberger, K.Q. Densely connected convolutional networks. In Proceedings of the IEEE Conference on Computer Vision and Pattern Recognition, Honolulu, HI, USA, 21–26 July 2017; pp. 4700–4708. [Google Scholar]
  36. Tao, Z.; Bingqiang, H.; Huiling, L.; Zaoli, Y.; Hongbin, S. NSCR-Based DenseNet for Lung Tumor Recognition Using Chest CT Image. BioMed Res. Int. 2020, 2020, 6636321. [Google Scholar] [CrossRef]
  37. Thakur, M.; Kuresan, H.; Dhanalakshmi, S.; Lai, K.W.; Wu, X. Soft Attention Based DenseNet Model for Parkinson’s Disease Classification Using SPECT Images. Front. Aging Neurosci. 2022, 14, 908143. [Google Scholar] [CrossRef]
  38. Fedorov, A.; Beichel, R.; Kalpathy-Cramer, J.; Finet, J.; Fillion-Robin, J.C.; Pujol, S.; Bauer, C.; Jennings, D.; Fennessy, F.; Sonka, M.; et al. 3D Slicer as an image computing platform for the Quantitative Imaging Network. Magn. Reson. Imaging 2012, 30, 1323–1341. [Google Scholar] [CrossRef] [Green Version]
  39. van Griethuysen, J.J.M.; Fedorov, A.; Parmar, C.; Hosny, A.; Aucoin, N.; Narayan, V.; Beets-Tan, R.G.H.; Fillion-Robin, J.C.; Pieper, S.; Aerts, H. Computational Radiomics System to Decode the Radiographic Phenotype. Cancer Res. 2017, 77, e104–e107. [Google Scholar] [CrossRef] [Green Version]
  40. Xie, N.; Fan, X.; Chen, D.; Chen, J.; Yu, H.; He, M.; Liu, H.; Yin, X.; Li, B.; Wang, H. Peritumoral and Intratumoral Texture Features Based on Multiparametric MRI and Multiple Machine Learning Methods to Preoperatively Evaluate the Pathological Outcomes of Pancreatic Cancer. J. Magn. Reson. Imaging JMRI, 2022; in press. [Google Scholar] [CrossRef]
  41. Joo, L.; Park, J.E.; Park, S.Y.; Nam, S.J.; Kim, Y.H.; Kim, J.H.; Kim, H.S. Extensive peritumoral edema and brain-to-tumor interface MRI features enable prediction of brain invasion in meningioma: Development and validation. Neuro Oncol. 2021, 23, 324–333. [Google Scholar] [CrossRef]
  42. Ma, G.; Kang, J.; Qiao, N.; Zhang, B.; Chen, X.; Li, G.; Gao, Z.; Gui, S. Non-Invasive Radiomics Approach Predict Invasiveness of Adamantinomatous Craniopharyngioma Before Surgery. Front. Oncol. 2020, 10, 599888. [Google Scholar] [CrossRef]
  43. Ngiam, K.Y.; Khor, I.W. Big data and machine learning algorithms for health-care delivery. Lancet Oncol. 2019, 20, e262–e273. [Google Scholar] [CrossRef] [PubMed]
  44. Apps, J.R.; Carreno, G.; Gonzalez-Meljem, J.M.; Haston, S.; Guiho, R.; Cooper, J.E.; Manshaei, S.; Jani, N.; Hölsken, A.; Pettorini, B.; et al. Tumour compartment transcriptomics demonstrates the activation of inflammatory and odontogenic programmes in human adamantinomatous craniopharyngioma and identifies the MAPK/ERK pathway as a novel therapeutic target. Acta Neuropathol. 2018, 135, 757–777. [Google Scholar] [CrossRef] [PubMed]
  45. Haston, S.; Pozzi, S.; Carreno, G.; Manshaei, S.; Panousopoulos, L.; Gonzalez-Meljem, J.M.; Apps, J.R.; Virasami, A.; Thavaraj, S.; Gutteridge, A.; et al. MAPK pathway control of stem cell proliferation and differentiation in the embryonic pituitary provides insights into the pathogenesis of papillary craniopharyngioma. Development 2017, 144, 2141–2152. [Google Scholar] [CrossRef] [Green Version]
  46. Adamson, T.E.; Wiestler, O.D.; Kleihues, P.; Yaşargil, M.G. Correlation of clinical and pathological features in surgically treated craniopharyngiomas. J. Neurosurg. 1990, 73, 12–17. [Google Scholar] [CrossRef] [PubMed]
  47. Tavangar, S.M.; Larijani, B.; Mahta, A.; Hosseini, S.M.; Mehrazine, M.; Bandarian, F. Craniopharyngioma: A clinicopathological study of 141 cases. Endocr. Pathol. 2004, 15, 339–344. [Google Scholar] [CrossRef] [PubMed]
  48. Szeifert, G.T.; Sipos, L.; Horváth, M.; Sarker, M.H.; Major, O.; Salomváry, B.; Czirják, S.; Bálint, K.; Slowik, F.; Kolonics, L.; et al. Pathological characteristics of surgically removed craniopharyngiomas: Analysis of 131 cases. Acta Neurochir. 1993, 124, 139–143. [Google Scholar] [CrossRef] [PubMed]
  49. Cui, E.; Li, Z.; Ma, C.; Li, Q.; Lei, Y.; Lan, Y.; Yu, J.; Zhou, Z.; Li, R.; Long, W.; et al. Predicting the ISUP grade of clear cell renal cell carcinoma with multiparametric MR and multiphase CT radiomics. Eur. Radiol. 2020, 30, 2912–2921. [Google Scholar] [CrossRef] [PubMed]
  50. Tang, T.Y.; Li, X.; Zhang, Q.; Guo, C.X.; Zhang, X.Z.; Lao, M.Y.; Shen, Y.N.; Xiao, W.B.; Ying, S.H.; Sun, K.; et al. Development of a Novel Multiparametric MRI Radiomic Nomogram for Preoperative Evaluation of Early Recurrence in Resectable Pancreatic Cancer. J. Magn. Reson. Imaging JMRI 2020, 52, 231–245. [Google Scholar] [CrossRef] [Green Version]
  51. Zhang, B.; Tian, J.; Dong, D.; Gu, D.; Dong, Y.; Zhang, L.; Lian, Z.; Liu, J.; Luo, X.; Pei, S.; et al. Radiomics Features of Multiparametric MRI as Novel Prognostic Factors in Advanced Nasopharyngeal Carcinoma. Clin. Cancer Res. 2017, 23, 4259–4269. [Google Scholar] [CrossRef]
Figure 1. Flowchart of the involved population. ACP, adamantinomatous craniopharyngioma; PCP, papillary craniopharyngioma.
Jcm 11 07481 g001
Figure 2. Representative contrast-enhanced T1-weighted MR images of (A) adamantinomatous craniopharyngioma and (B) papillary craniopharyngioma.
Jcm 11 07481 g002
Figure 3. Network architectures of (A) a typical convolutional neural network, (B) a residual neural network (ResNet), and (E) a densely connected convolutional network (DenseNet). (C) Residual connection building block in ResNet. (D) Densely connected dense block in DenseNet.
Jcm 11 07481 g003
Figure 4. The flow chart of the current research. ACP, adamantinomatous craniopharyngioma; PCP, papillary craniopharyngioma; LASSO, least absolute shrinkage and selection operator; VGG, visual geometry group network; ResNet, residual neural network; DenseNet, densely connected convolutional network; SVM, support vector machine; RF, random forest; CNN, convolutional neural network.
Jcm 11 07481 g004
Figure 5. Model performance of CNN models. Bar charts of accuracy (A), sensitivity (B), and specificity (C); Receiver operating characteristic (ROC) curves of CNN models (D).
Jcm 11 07481 g005
Figure 6. Performance of radiomics models. Bar charts of accuracy (A), sensitivity (B), and specificity (C); Receiver operating characteristic (ROC) curves of radiomics models (D).
Jcm 11 07481 g006
Table 1. The characteristics of the patients and tumors.
CharacteristicsACP (n = 53)PCP (n = 44)p Value
Age (y)49.6 ± 3.044.7 ± 2.20.187
Sex 0.422
Male2726
Female2618
Onset duration (w)50.9 ± 9.939.7 ± 11.00.453
Symptoms
Headache34320.367
Visual impairment36350.198
Endocrine dysfunction35330.337
None230.500
Hypothalamic involvement11170.053
Location 0.396
Intrasellar01
Suprasellar2927
Combination2416
Tissue structure 0.154
Solid710
Cystic156
Mixed3128
Shape 0.751
Regular118
Irregular4236
Maximum diameter (mm)37.91 ± 1.7 (22–78)30.02 ± 1.7 (9–66)0.015
ACP, adamantinomatous craniopharyngioma; PCP, papillary craniopharyngioma.
Table 2. The results of the validation of the six CNNs and two radiomic models for the classification of ACP and PCP.
MethodModelAUCAccuracySensitivitySpecificity
CNNVGG160.822 ± 0.0540.673 ± 0.0130.500 ± 0.3270.766 ± 0.189
ResNet180.791 ± 0.0550.713 ± 0.0380.499 ± 0.2030.843 ± 0.077
ResNet500.838 ± 0.0620.757 ± 0.0520.608 ± 0.1980.845 ± 0.034
ResNet1010.821 ± 0.0800.720 ± 0.0790.445 ± 0.1220.885 ± 0.060
DenseNet1210.799 ± 0.0630.798 ± 0.0510.433 ± 0.0520.857 ± 0.052
DenseNet1690.789 ± 0.0500.704 ± 0.0490.506 ± 0.0880.825 ± 0.063
RadiomicsSVM0.763 ± 0.0680.753 ± 0.0910.756 ± 0.0580.761 ± 0.144
RF0.769 ± 0.0660.732 ± 0.0530.738 ± 0.0440.729 ± 0.085
CNN, convolutional neural network; ACP, adamantinomatous craniopharyngioma; PCP, papillary craniopharyngioma; AUC, area under curve; ResNet, residual neural network; DenseNet, densely connected convolutional network; SVM, support vector machine; RF, random forest.
Publisher’s Note: MDPI stays neutral with regard to jurisdictional claims in published maps and institutional affiliations.

