Abstract
Background: Although immune checkpoint inhibitors (ICI) are a promising therapeutic strategy for lung adenocarcinoma (LUAD), individual subgroups that might benefit from them are yet to be identified. As T cell-mediated tumor killing (TTK) is an underlying mechanism of ICI, we identified subtypes based on genes associated with TTK sensitivity and assessed their predictive significance for LUAD immunotherapies. Methods: Using high-throughput screening techniques, genes regulating the sensitivity of T cell-mediated tumor killing (GSTTK) with differential expression and associations with prognosis were discovered in LUAD. Furthermore, patients with LUAD were divided into subgroups using unsupervised clustering based on GSTTK. Significant differences were observed in the tumor immune microenvironment (TIME), genetic mutation and immunotherapy response across subgroups. Finally, the prognostic significance of a scoring algorithm based on GSTTK was assessed. Results: A total of 6 out of 641 GSTTK exhibited differential expression in LUAD and were associated with prognosis. Patients were grouped into two categories based on the expression of the six GSTTK, which represented different TTK immune microenvironments in LUAD. Immune cell infiltration, survival difference, somatic mutation, functional enrichment and immunotherapy responses also varied between the two categories. Additionally, a scoring algorithm accurately distinguished overall survival rates across populations. Conclusions: TTK had a crucial influence on the development of the varying TIME. Evaluation of the varied TTK modes of different tumors enhanced our understanding of TIME characteristics, wherein the changes in T cell activity in LUAD are reflected. Thus, this study guides the development of more effective therapeutic methods.
1. Introduction
Non-small cell lung cancer (NSCLC) is one of the most lethal malignancies worldwide, with a meagre 15% 5-year survival rate [1]. Moreover, the most pervasive subtype of NSCLC is lung adenocarcinoma (LUAD). In the past decade, immune checkpoint inhibitors (ICI) targeting programmed death protein 1 (PD-1) and its ligand (PD-L1) or cytotoxic T lymphocyte antigen 4 (CTLA-4) have innovated the conventional therapy of NSCLC [2]. Since PD-L1 status may be influenced by tumor heterogeneity, test variability, inter- and intra-observer variability, the clinical benefit is restricted to 15–20% of patients with non-oncogenic addicted NSCLC [3,4,5,6,7,8,9]. High-level PD-L1 expression (>50%) improved survival and prognosis only in non-squamous histology patients treated with ICI [10]. Unlike categorical biomarkers for oncogene-addicted NSCLC such as epidermal growth factor receptor (EGFR), PD-L1 as an immunotherapy biomarker is continuous, spatially and temporally variable, and impacted by complex immune machinery in the tumor immune microenvironment (TIME) [11]. Thus, the current biomarker for prediction of ICI response, PD-L1, has low informative power because it is either not necessary or not adequate. We observe ICI responds in PD-L1 negative patients but not in those with >50%. To identify ICI-responsive patients, a more comprehensive strategy including additional indicators is desired.
Although ICI is a promising immunotherapeutic strategy for LUAD, identifying subgroups of individuals who might benefit from this approach remains a challenge. Based on its role in malignant cell and immune system interactions, the TIME has been reported to impact immunotherapy response [12]. Moreover, immune cells (particularly diverse subtypes of T cells), stromal cells and molecules are critical elements in the TIME. Nonetheless, the most effective immunotherapies for LUAD are those that suppress immunological checkpoints to enhance T cell-mediated tumor killing (TTK). Because of a variety of factors that are not well understood, immunotherapy is ineffective against a significant portion of human malignancies. Pan et al. employed a genome-scale CRISPR-Cas9 screen to detect tumor cell resistance to TTK; the main anticancer immune mechanism, and multiple genes related to TTK resistance have been identified [13]. Ru et al. reported that CD47 and PTPN2 are genes regulating the sensitivity of the tumor to T cell-mediated killing (referred to as GSTTK) and immunotherapy using high-throughput screening and genomic profiling data [14].
In this study, identified GSTTK sets were used to distinguish between patients with LUAD having distinct immune cell infiltration features and immunophenotypes. Additionally, we aim to explore the immunologic and genetic characteristics and establish the novel independent prognostic model based on the GSTTK to predict survival of patients with LUAD.
2. Materials and Methods
2.1. Datasets
The Cancer Genome Atlas (TCGA, https://portal.gdc.cancer.gov/, accessed on 15 June 2022) was utilized to gain the clinicopathological data and corresponding RNA-seq transcriptome data of 483 patients with LUAD, which comprised the training set. Additionally. the data of 150 patients with LUAD were acquired from the Gene Expression Omnibus (GEO; accession number: GSE29013, GSE29016, GSE30219; https://www.ncbi.nlm.nih.gov/geo/, accessed on 5 July 2022) database, which formed the validation set. Furthermore, these GEO datasets were merged utilising inSilicoMerging in R [15] and the batch effect was removed utilizing a previously reported method [16] (Figure S1). From the TISIDB database (http://cis.hku.hk/TISIDB/, accessed on 15 June 2022), genes linked with a great response to TTK in immunotherapy were utilized to develop a gene set referred to as GSTTK [14].
2.2. Exploration of Key Genes
The R package DESeq2 detected GSTTK expression differences between cancerous and para-cancerous tissues. The modified P values were investigated to correct false-positive TCGA data. |Fold change| > 1.5 and p < 0.05 were regard as screening criteria for the differential expression of mRNAs. In LUAD, univariate Cox regression determined that GSTTK was strongly linked with overall survival (OS) utilizing Survival in R. The maftools package was used to characterize somatic mutations in these genes in patients with LUAD. Furthermore, least absolute shrinkage and selection operator (LASSO) with L1-penalty, a prominent approach for creating explicable forecast rules able to deal with the collinearity issue, was utilized to identify important immune genes among those selected using univariate Cox regression analysis. By imposing a penalty equal to their magnitude on the regression coefficient, a subset of immune genes related to the survival of patients with LUAD was identified. Subsequently, very few indicators with non-zero weights remained, whereas the majority of possible indications were reduced to zero. LASSO Cox analysis was employed utilizing the package named glmnet (Version 2.0-16). Additionally, utilizing the stats package (Version 3.6.0), a principal component analysis (PCA) determined if certain GSTTK in the TCGA-LUAD dataset can discriminate between cancerous and para-cancerous tissues. This was subsequently validated using t-distributed stochastic neighbor embedding (tSNE), performed with the Rtsne program (Version 0.15). Another validation method is Uniform manifold approximation and projection (UMAP), which were employed utilizing the umap package (Version 0.2.7.0). The differential copy number variation (CNV) status of GSTTK was collected from the TCGA database and outlined utilizing GISTIC 2.0 to gain chromosomal characteristics and the loss or gain status, which was presented using a circus plot [17]. Pearson’s correlations were utilized to quantify the relationship between these genes. Furthermore, the protein–protein interaction (PPI) network was built to discover co-expressed proteins and signaling pathways (http://genemania.org/, accessed on 23 June 2022).
2.3. Unsupervised Clustering
Unsupervised Clustering was conducted to utilize the ConsensusClusterPlus package [18], wherein agglomerative pam clustering with a 1-Pearson correlation distance and resampling of 80% of samples for 10 repetitions was performed. The appropriate cluster figure was identified utilizing the empirical cumulative distribution function plot. Subsequently, a cluster map was constructed utilizing the pheatmap tool package. Furthermore, transcriptional profiles were compared among immune subtypes using PCA, tSNE and UMAP. Using the R packages survminer and survival, we performed Kaplan–Meier (KM) analysis and log-rank tests in the clustered TCGA-LUAD and GEO cohorts.
2.4. Differential Analysis Based on Whole-Genome Data
For patients in the TCGA-LUAD, somatic mutation data in the mutect2 format was transformed to the mutation annotation format. Waterfall diagrams were drawn to graphically reveal high mutation risk genes via the maftools software. To study differences in mutation distribution between TCGA-LUAD subtypes, we identified the differential mutation genes. p < 0.05 was regarded as statistically significant.
2.5. Functional Enrichment Analysis
We conducted Kyoto Encyclopedia of Genes and Genomes (KEGG) and Gene Ontology (GO) analyses to assess biological impacts and different signaling pathways between low expression and high expression of GSTTK. We utilized clusterProfiler package in R to evaluate KEGG and GO pathways. Additionally, in KEGG and GO enrichment analyses, p and q-value thresholds were less than 0.05.
2.6. Gene Set Enrichment Analysis (GSEA)
We performed GSEA (http://www.broadinstitute.org/gsea/index.jsp, accessed on 25 June 2022) to explore if there was a substantial alteration in the gene sets of GSTTK low and high expression subgroups in the MSigDB Collection enrichment [19,20].
2.7. Single Samples Gene Set Enrichment Analysis (ssGSEA)
We extracted datasets containing 28 types of immuno-infiltration cells and 782 associated genes from the molecular characteristics database. Furthermore, in the tumor samples, the enrichment of the 28 immuno-infiltration cell types was evaluated utilizing ssGSEA.
2.8. Immune Landscape Comparison between Two GSTTK Subgroups
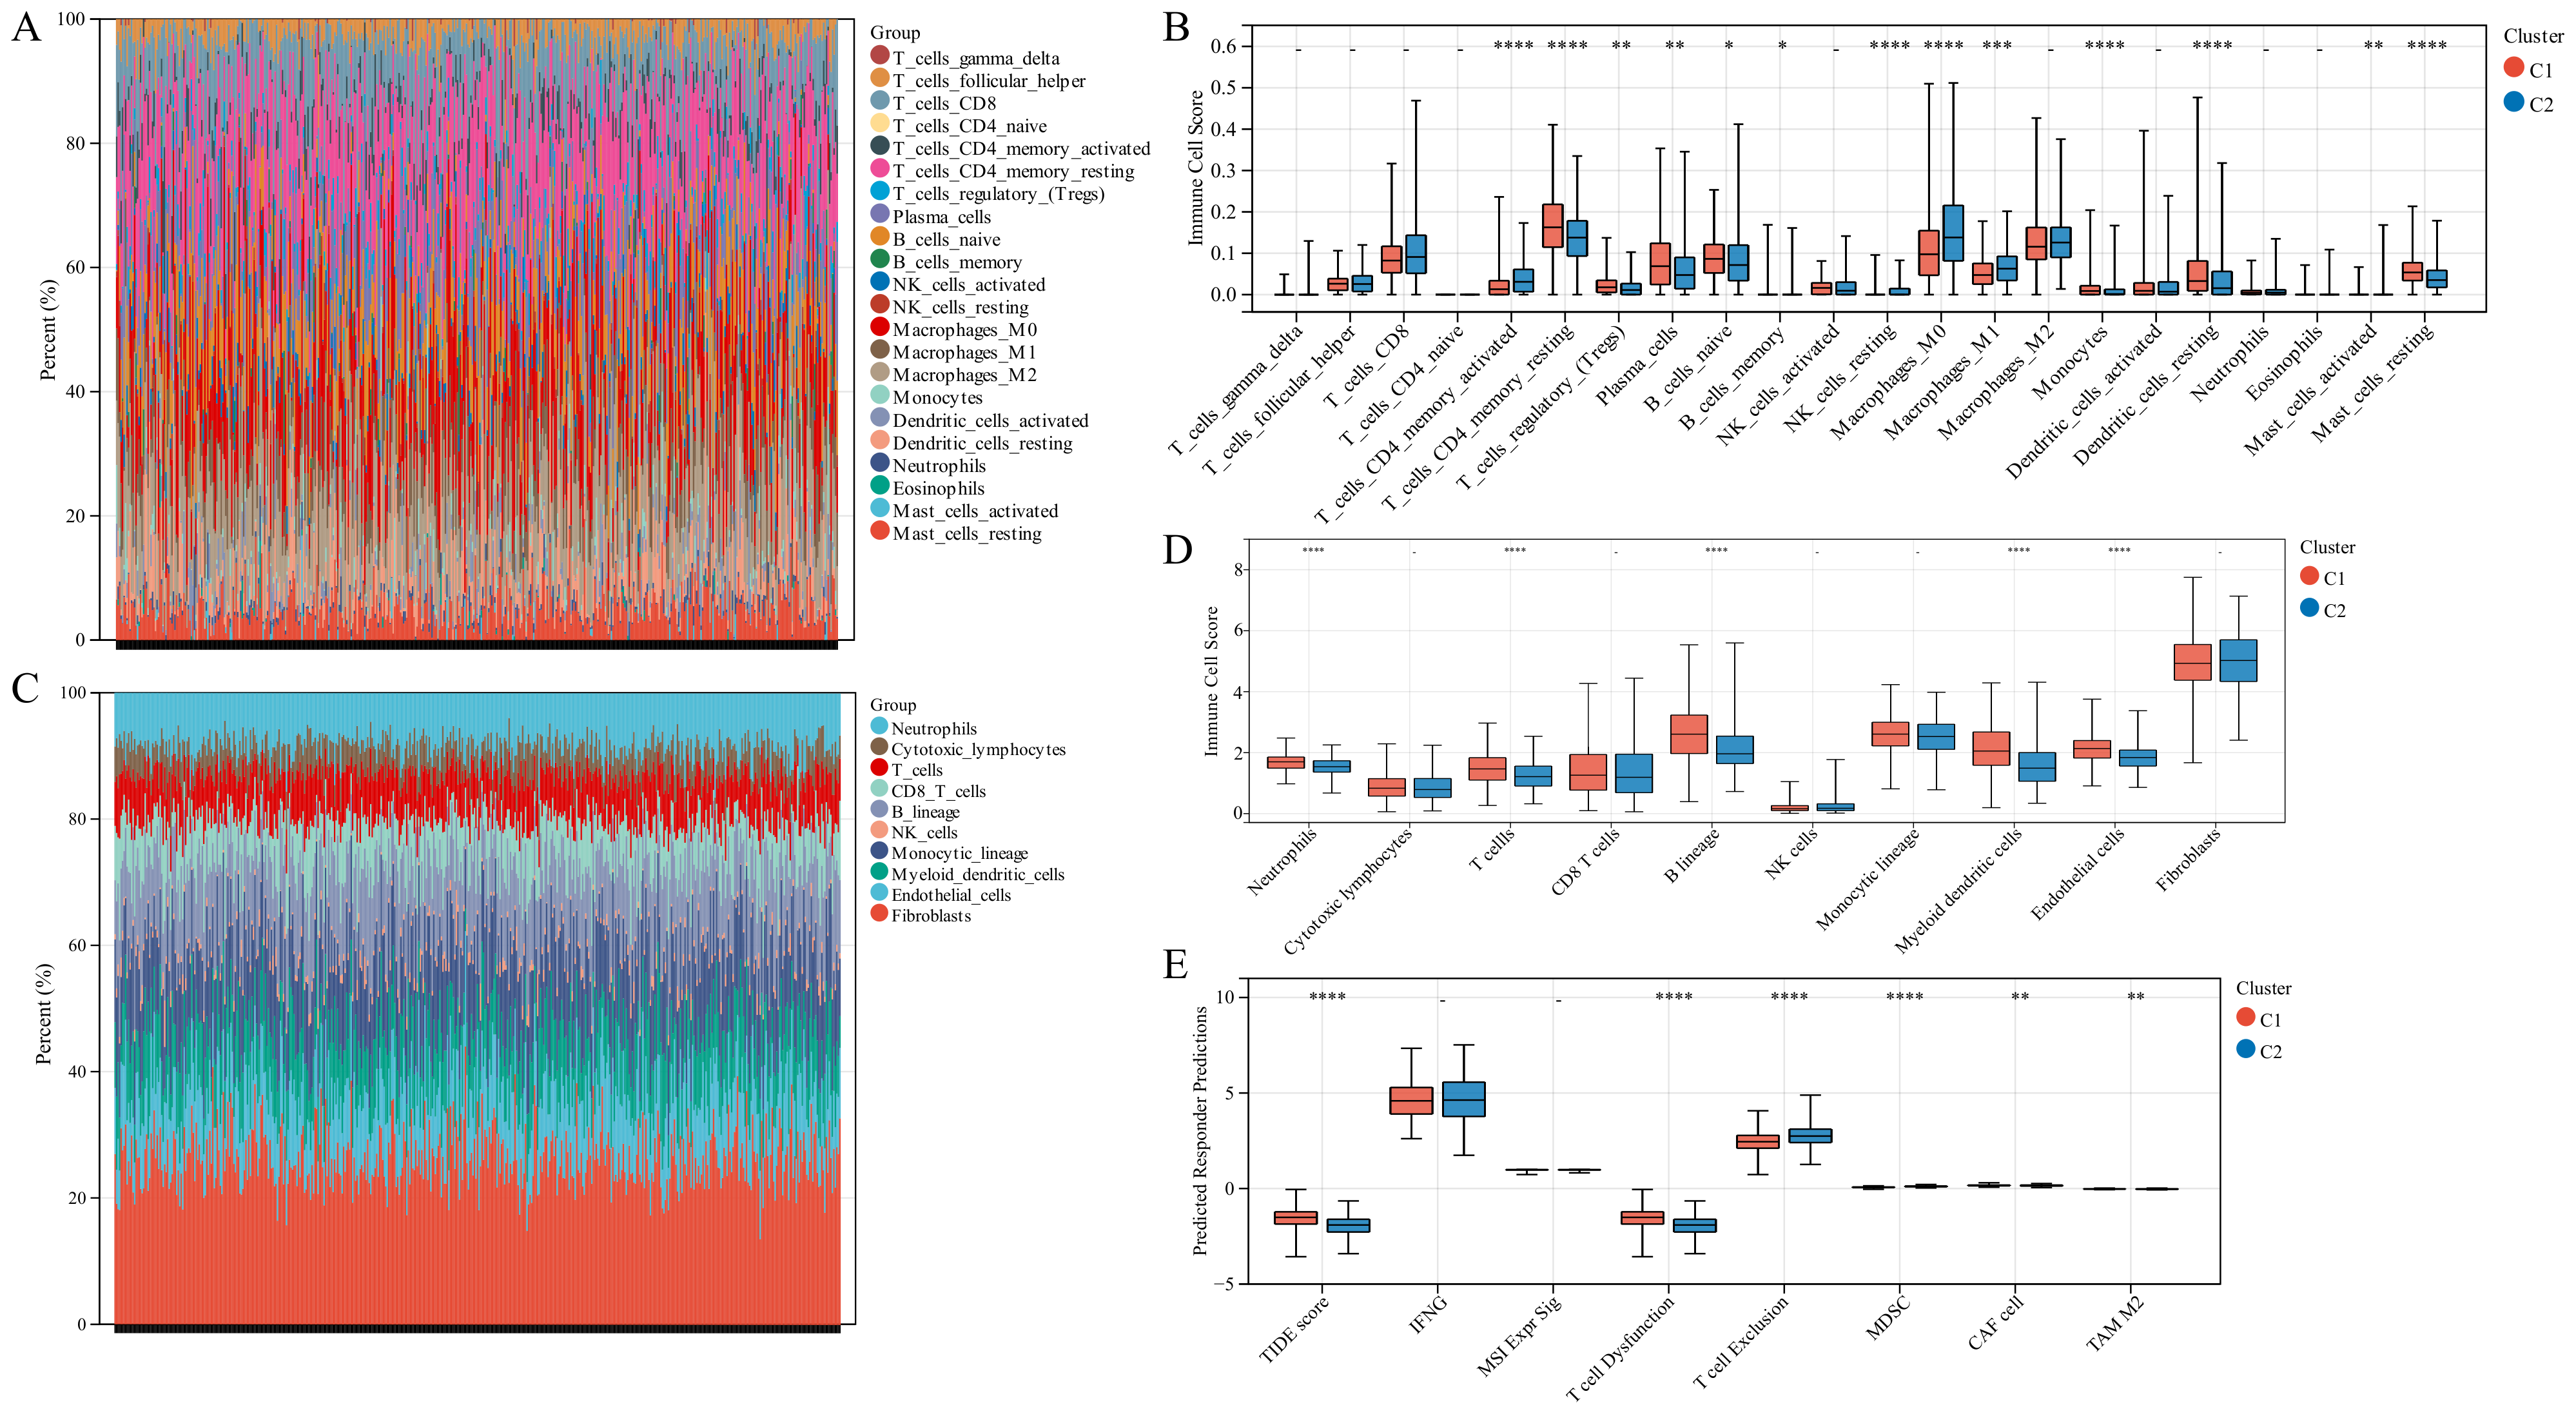
To evaluate tumor purity, the ESTIMATE [21] algorithm was utilized to analyze non-malignant contextures, such as stromal and immunological markers. To estimate the relative percentage of the different immunogenicity cell types in 483 patients with LUAD, expression data were imported into CIBERSORT [22] and MCPCounter [23] and the findings were shown using the stacked plot. Additionally, relative percentage of immunogenicity cell types was also compared between the differential expression GSTTK subgroups, and the box plot displayed the results. ESTIMATE, CIBERSORT and MCPCounter are three of the eight open-source deconvolution algorithms that are integrated into the Immuno-Oncology Biological Research (IOBR) package in R [24], which was used to identify every sample’s immune infiltrating cell score based on the TCGA-LUAD expression profiles. The response potential of tumor immunotherapy can be predicted using Liu’s Tumor Immune Dysfunction and Exclusion (TIDE) algorithm, which models the two primary mechanisms of tumor immune escape—the induction of T cell dysfunction at high cytotoxic T lymphocyte (CTL) and the prevention of T cell infiltration at low CTL [25].
2.9. Establishment of a Risk Model
We performed LASSO analysis to reduce the number of prognostic genes that had been filtered utilizing the glmnet package. The optimal lambda value was set by taking into account the performance of the model and the number of genes. After multiple computations using GEO datasets, the model performance of multivariate Cox regression analysis was inadequate hence, this study did not use multivariate Cox regression to build a model. Thus, the risk model was established on the basis of the optimal lambda value by LASSO analysis. We utilized receiver operating characteristic (ROC) to assess the model’s prediction accuracy. Figure S2A presents the data analysis process. Following this, patients were redivided based on age, gender, tumor site, survival status, T stage, and genetic mutation status, and a risk score subgroup analysis was performed.
2.10. Survival Analysis
Using survminer and survival packages, a KM analysis compared OS in the differential risk cohorts. Then, multivariate Cox analysis assembled variables having statistical significance in univariate Cox analysis or clinical settings. Based on age, gender and genetic mutation status, the patients were redivided and a KM subgroup analysis was performed.
2.11. Construction and Evaluation of the Integrated Nomogram
Based on the multivariable analysis results, a nomination chart was created to individualize forecasted survival rates for 1, 3 and 5 years. The package named rms (Version 6.3-0) was utilized to construct the integrated nomogram comprising important clinical features and risk score. Calibration and discrimination are the prevalent approaches for assessing the power of models. In this study, calibration curves were plotted against observed rates and the 45° line reflected the most accurate prediction values. Using the concordance index (C-index) and ROC analysis, the prediction accuracy of the integrated nomogram and individual prognostic indicators was examined.
2.12. Statistical Analyses
R (version 4.2.1), Statistical Product Service Solutions (SPSS) 27.0 and SangerBox platform [26] were utilized for statistical analyses. Survival analysis was conducted to utilize the KM, and the prediction power of risk score was appraised utilizing time-dependent ROC via the package named survivalROC. Discontinuous data are presented as mean ± standard deviation (SD). The student’s t-test was utilized for comparison between two subgroups and a one-way analysis of variance was utilized flexibly for comparisons between three or more groups. p < 0.05 determined a statistically significant difference.
3. Results
3.1. Determination and Characterization of GSTTK Involved in LUAD
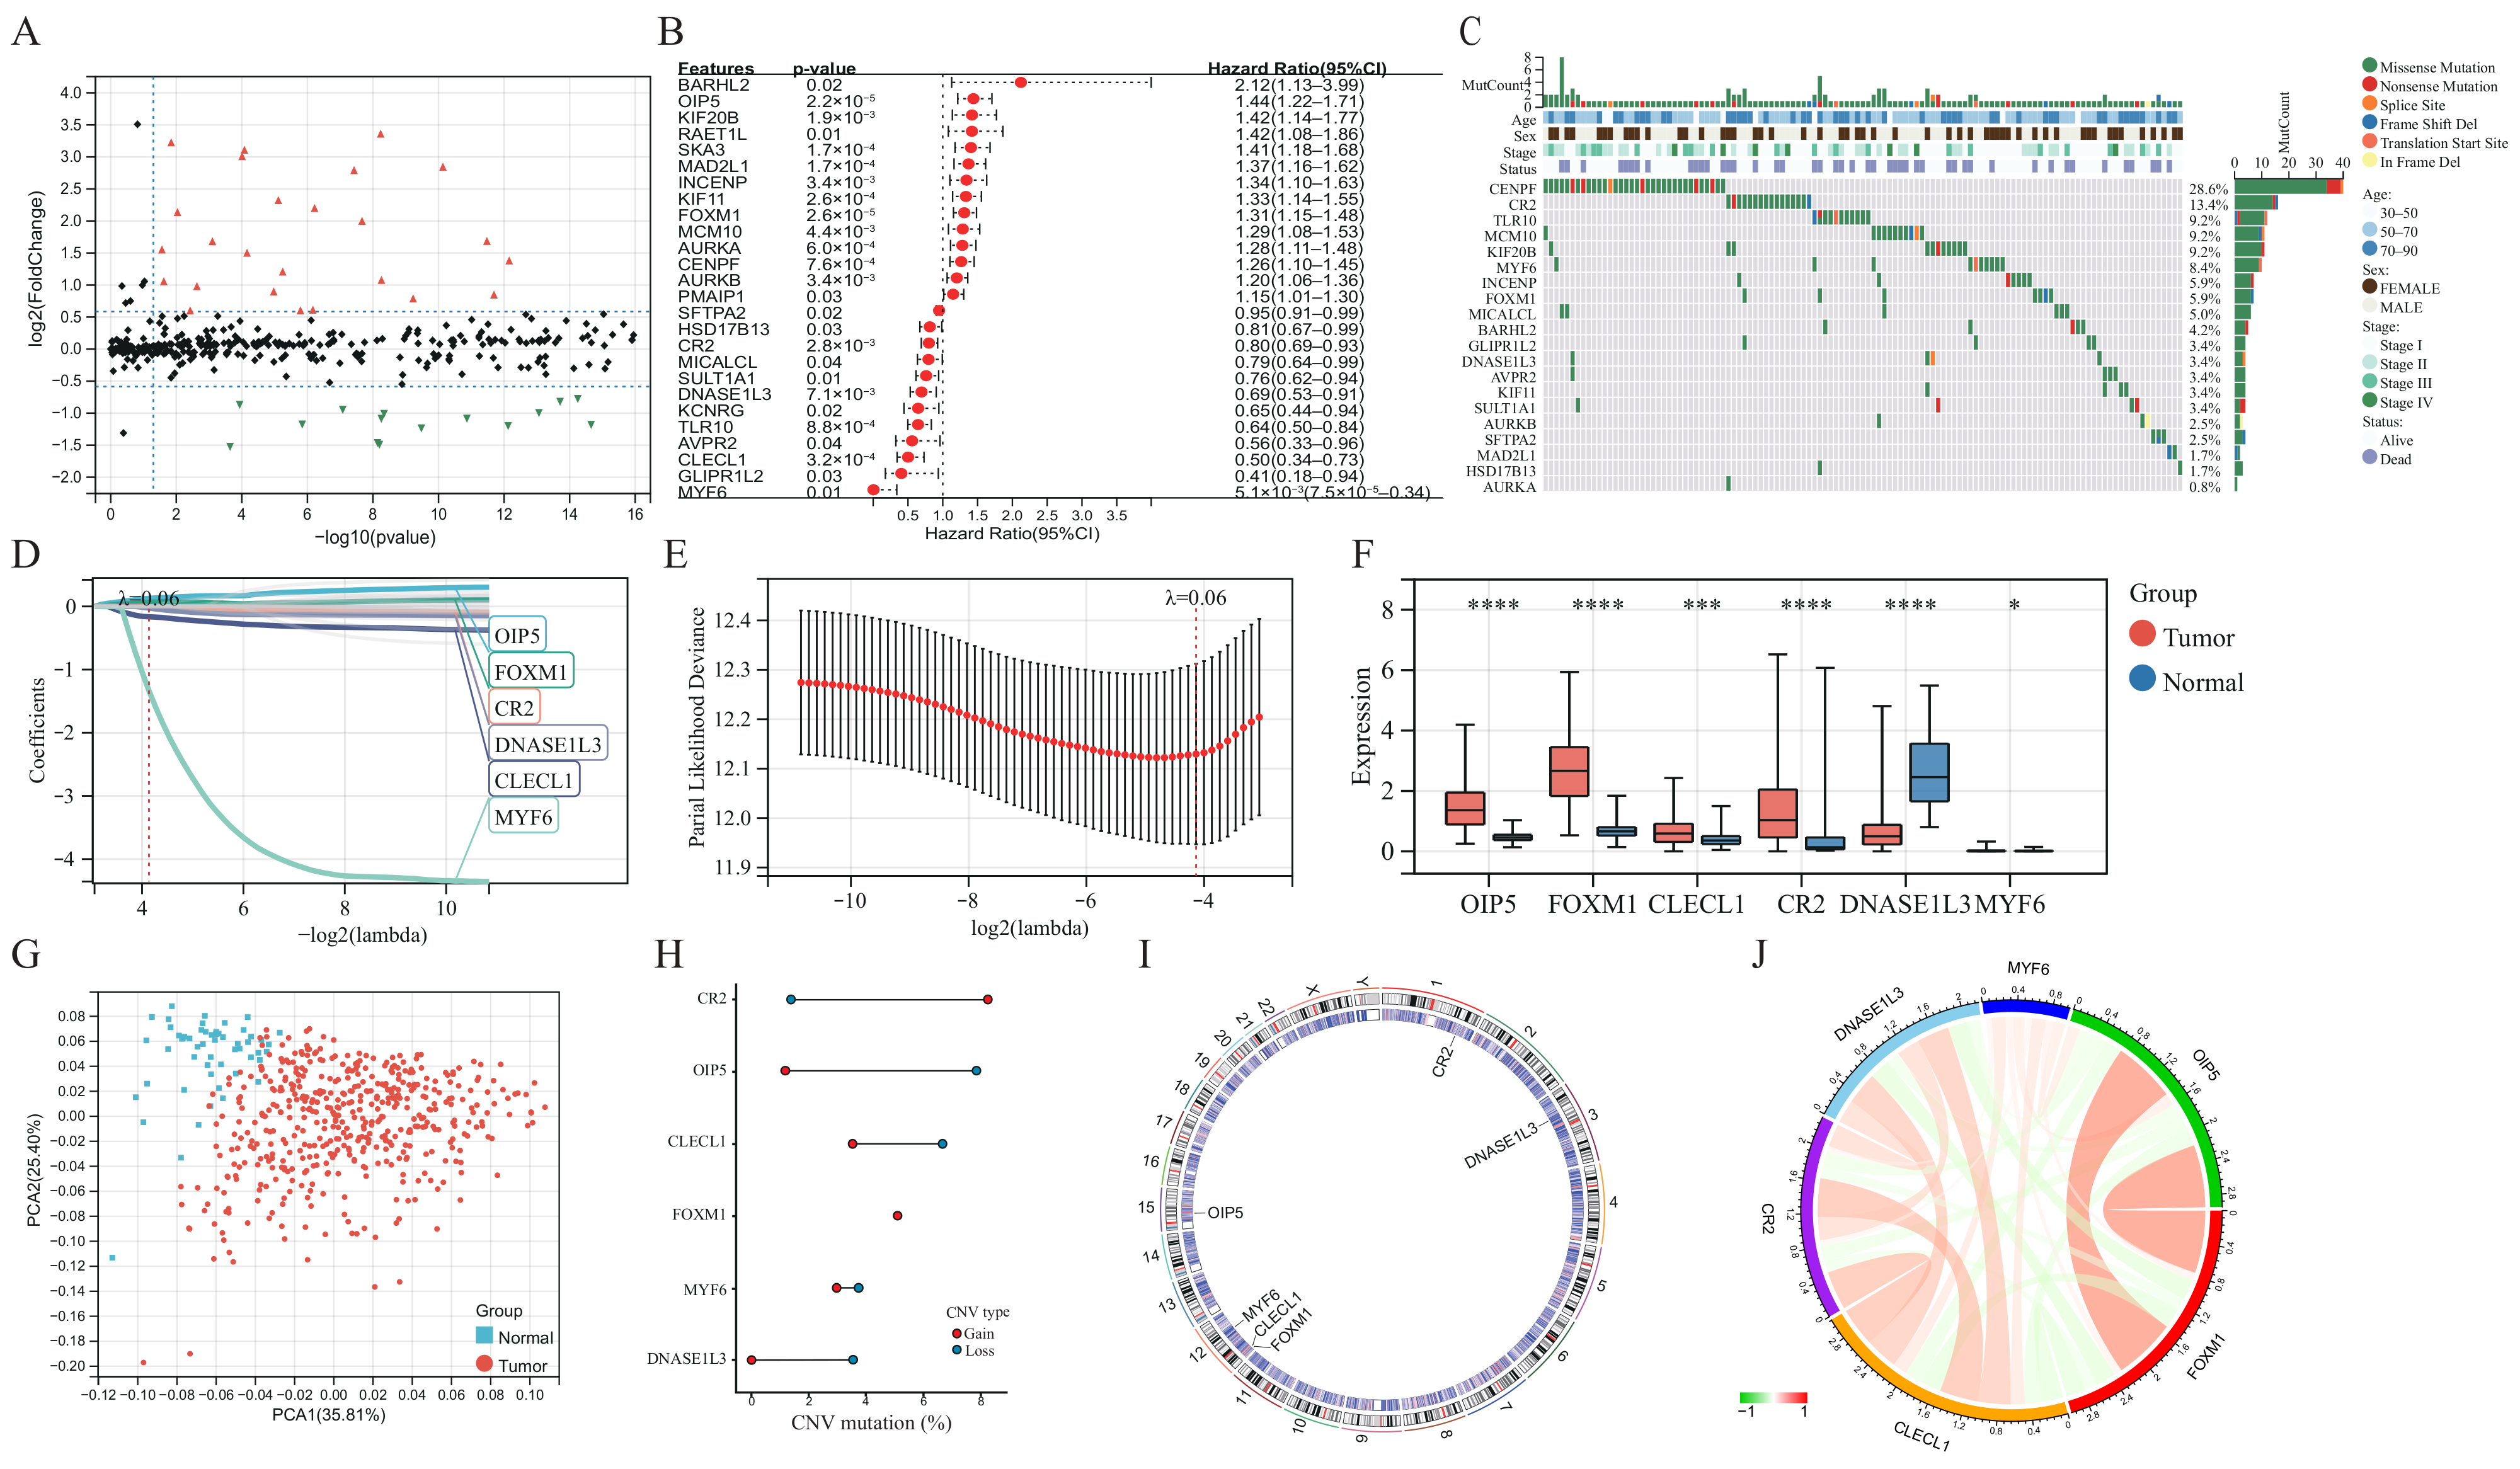
The baseline clinical general features of patients in the TCGA-LUAD cohort are shown in Table S1. Differential analysis of transcriptome data reveals that 99 of the 641 GSTTK were elevated or declined in LUAD (Figure 1A and Figure S2B), which was presented using a volcano map and heatmap, respectively. The univariate Cox analysis determined that 26 of the 99 GSTTK were related to survival rate in LUAD. The univariate Cox analysis also revealed that 12 GSTTK were protective variables with a hazard ratio (HR) < 1 and 14 GSTTK were harmful variables (HR > 1) for LUAD survival (Figure 1B). The mutational landscape for the top 20 GSTTK has been presented using a waterfall plot (Figure 1C), which is based on TCGA-LUAD genomic mutation data. Furthermore, univariate Cox analysis of 26 GSTTK and their respective P-values are presented in Table S2. GSTTK were evaluated and selected for the risk model using LASSO regression analysis (Figure 1D,E). Cancerous and para-cancerous tissues were separated using principal component analysis (Figure 1G) by the different mRNA levels of six GSTTK (Figure 1F), demonstrating high heterogeneity in the expression of GSTTK and somatic mutation status between tumor and normal samples. Additionally, tSNE and UMAP validated the above results (Figure S2C,D). Therefore, alterations in GSTTK expression are speculated to promote the growth of LUAD. Additionally, extensive CNV in six GSTTK was discovered (Figure 1H). CNV gains were most commonly observed. CR2 showed widespread CNV amplification, whereas OIP5 and CLECL1 showed CNV loss. The chromosomal sites of the six GSTTK are displayed in Figure 1I. Pearson’s correlation analysis further revealed that OIP5 and FOXM1 had a strong correlation (Figure 1J). The constructed PPI model predicted 20 co-expressed proteins and seven related signaling pathways. CD22, FCRL3 and STAP1 also had important roles in the immunogenicity cells proliferation and the receptor-mediated signaling pathways regulation (Figure S2E).
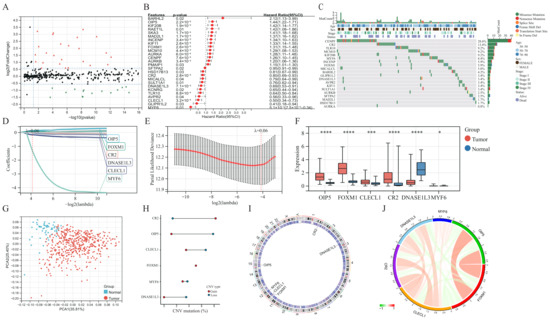
Figure 1.
Determination and characterization of GSTTK involved in lung adenocarcinoma (LUAD). (A) Volcano map displays the 99 GSTTK with differential mRNA levels between cancerous and para-cancerous tissues in the TCGA-LUAD cohort. Red indicates up-regulation and green indicates down-regulation. (B) Univariate Cox analysis of 26 GSTTK related to overall survival (OS) in LUAD. (C) Waterfall plot shows the mutational scenery of 26 GSTTK and the clinicopathological features. (D,E) Lasso analysis identified six genes that were closely related to OS in the TCGA-LUAD cohort. (F) The six GSTTK are expressed differentially in cancerous and para-cancerous tissues. Tumor and normal samples are indicated in red and blue, respectively. The upper and lower ends of boxes indicate the interquartile range. Line in the boxes indicates median values. Asterisks indicate significance, * p < 0.05; *** p < 0.001; **** p < 0.0001; -,no statistical significance. (G) Principal component analysis differentiated cancerous (red) and para-cancerous (blue) tissues. (H) Copy number variation (CNV) in the six GSTTK in LUAD. Gain, red dots; Loss, blue dots. (I) CNV locations of the six GSTTK are tagged on the chromosome. (J) Correlation between the expression of the six GSTTK in the TCGA-LUAD cohort.
3.2. Identification of Two TTK Modes in LUAD
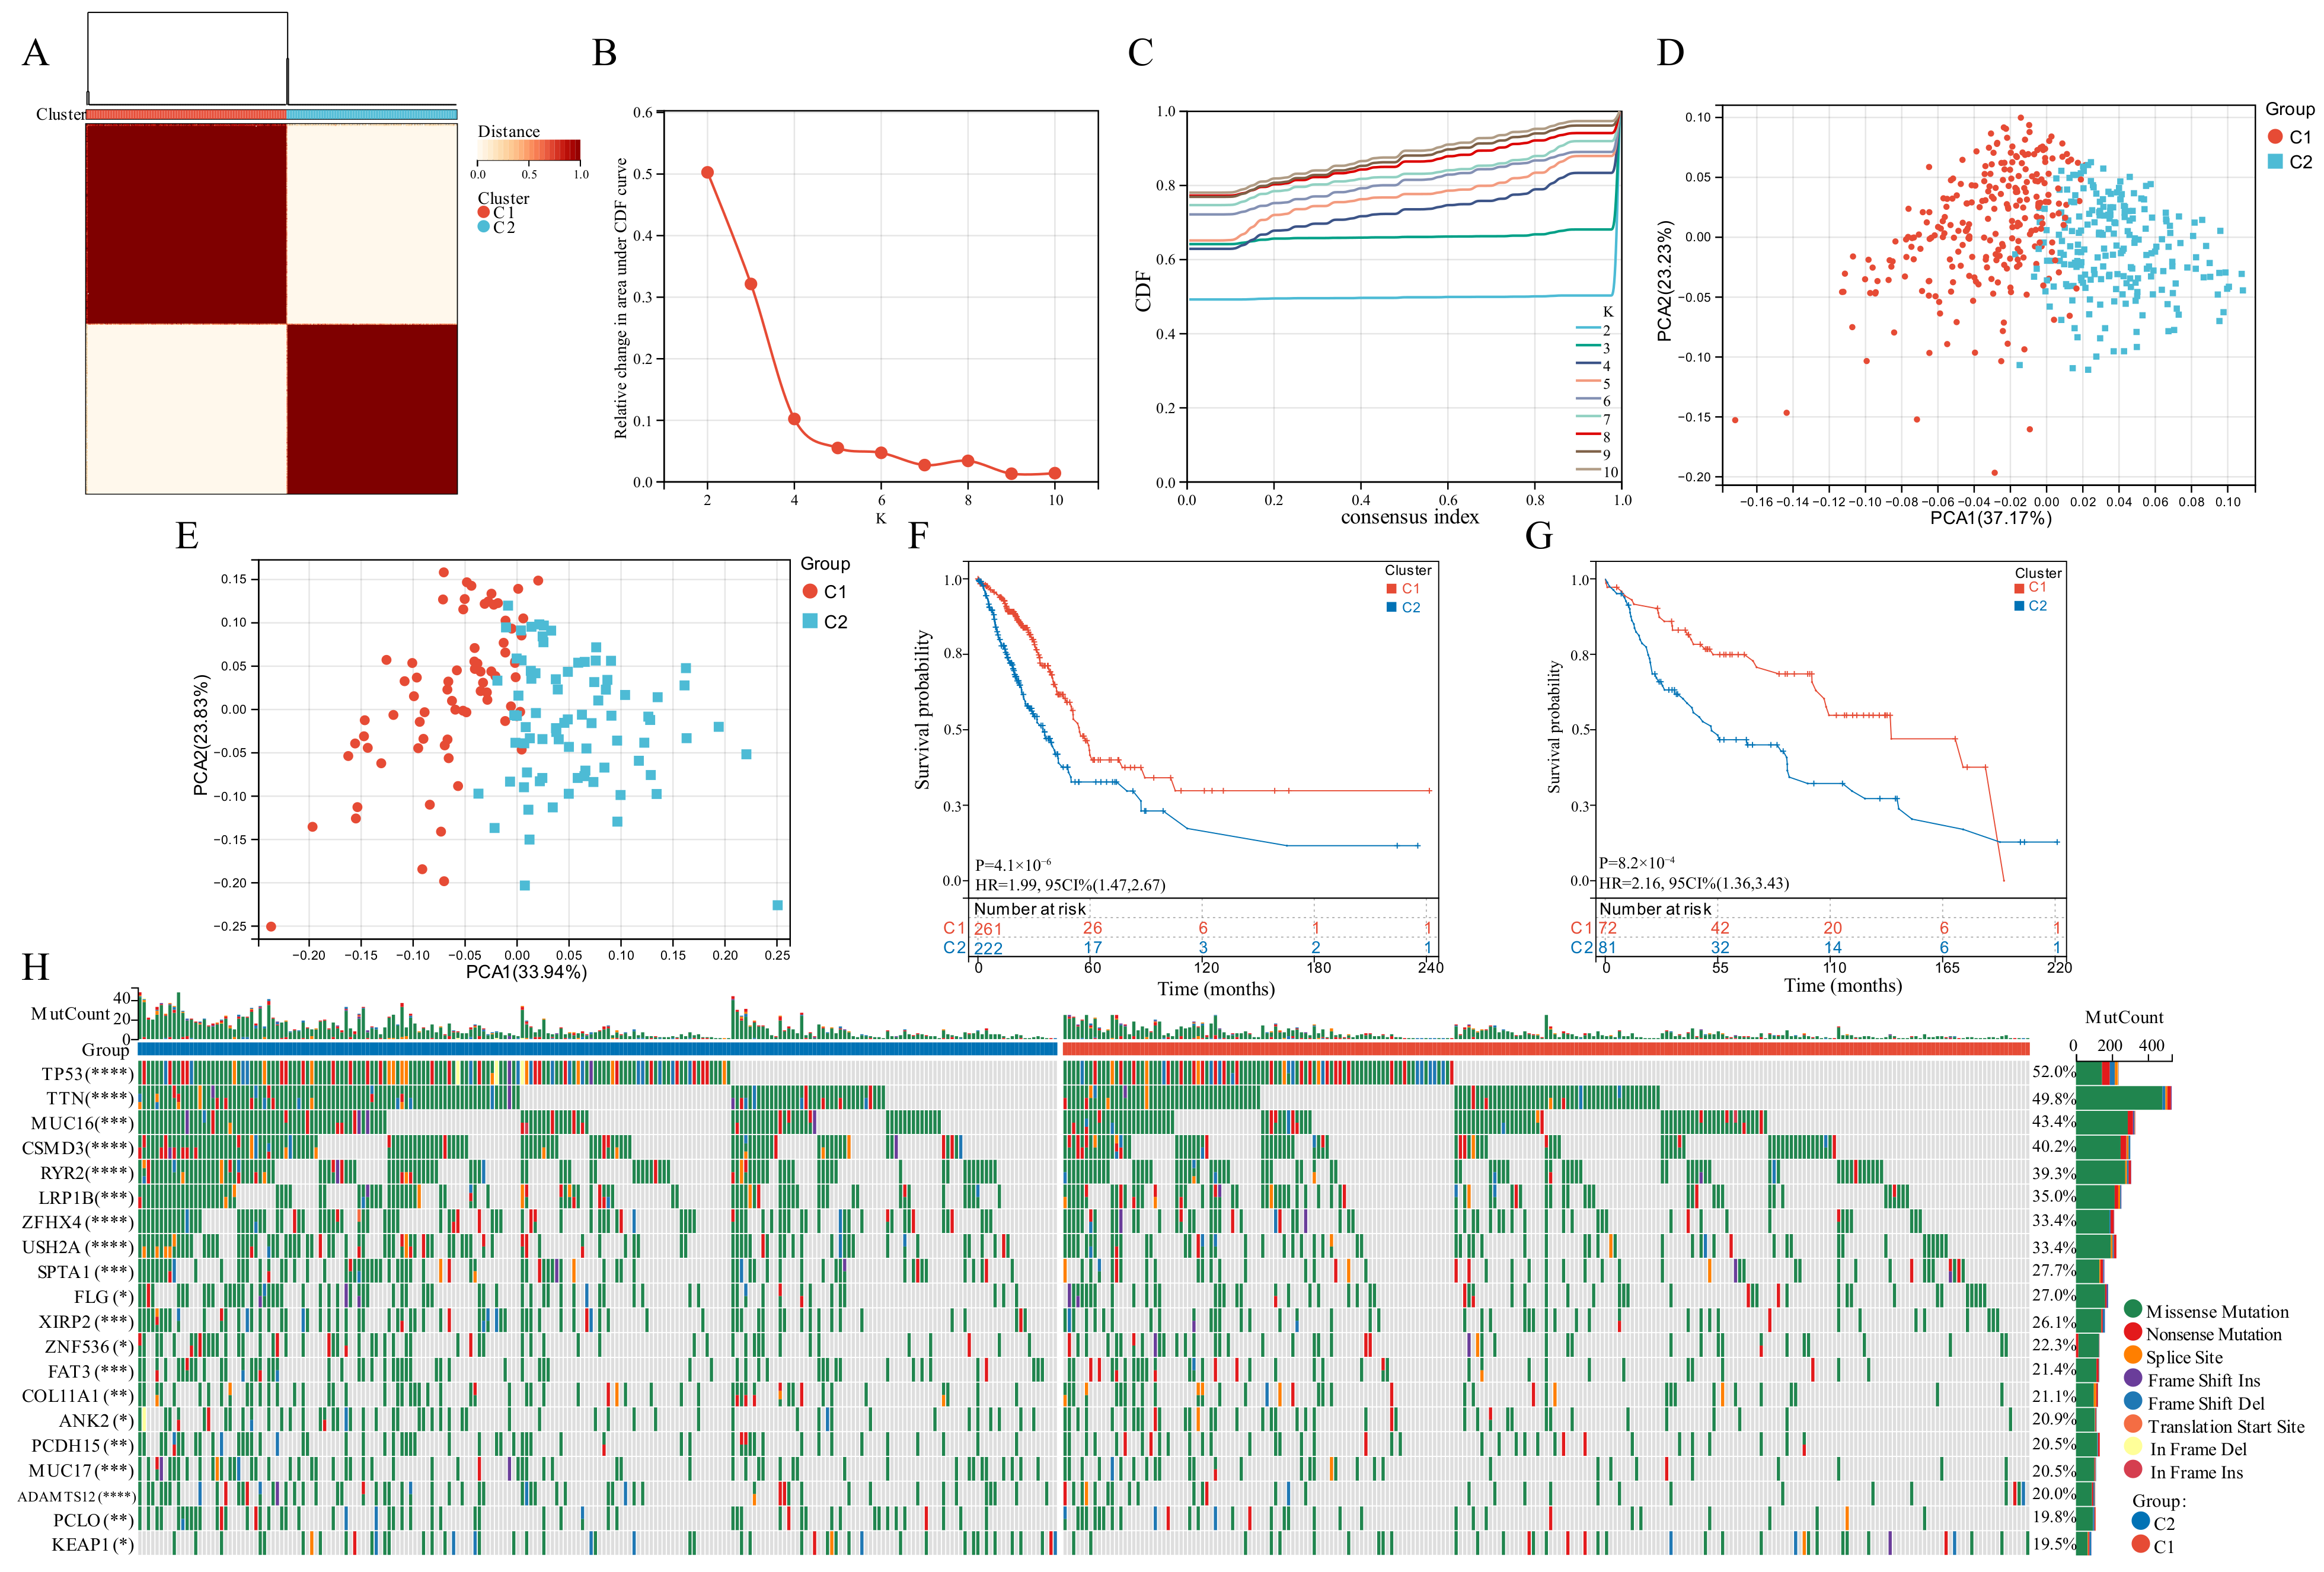
Based on the expression of the six GSTTK, we categorized patients with qualitatively distinct TTK modes using unsupervised clustering (Figure 2A–C). The PCA, tSNE and UMAP analyses were employed to investigate TTK modes, which identified substantial variations in the transcriptional profiles (Figure 2D and Figure S2A,B). To validate the consistency and application of two TTK modes in LUAD, unsupervised clustering analysis was repeatedly used in the GSE29013, GSE29016 and GSE30219 cohorts (Figure S3C–E). The findings of PCA (Figure 2E), tSNE (Figure S3F) and UMAP (Figure S3G) supported the two distinct TTK modes in LUAD. The prediction power of TTK modes was determined utilizing KM analysis. The survival of patients in the two modes differed significantly in both TCGA (p = 4.1 × 10⁻⁶, HR = 1.99, Figure 2F) and GEO datasets (p = 8.2 × 10⁻⁴, HR = 2.16, Figure 2G).
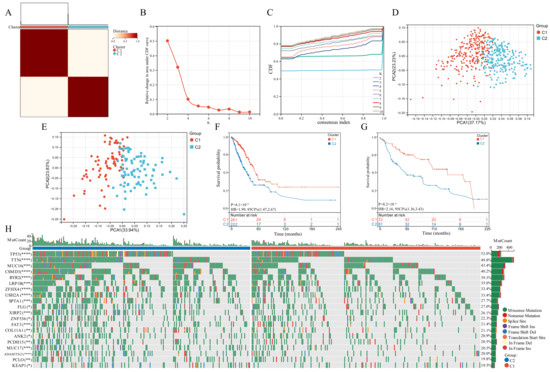
Figure 2.
Modes of TTK and prediction efficiency in lung adenocarcinoma. (A) Two modes of TTK were recognized using clustering algorithm. (B,C) The optimal value was K = 2 for consensus clustering. (D,E) The principal component analysis confirmed the two modes in TCGA or GEO datasets. Two independent subgroups were recognized, suggesting that Cluster 1 and Cluster 2 patients could be separated by the six GSTTK expressions. (F,G) Kaplan-Meier analysis recognized that patients classified into the two subgroups had markedly differing survival rates in the TCGA or GEO databases. (H) Waterfall plots reveal the mutated genes in the two subgroups, Asterisks indicate significance, * p < 0.05; ** p < 0.01; *** p < 0.001; **** p < 0.0001.
3.3. Somatic Mutations Related to the Two TTK Modes
Genomic data from TCGA-LUAD datasets was used to evaluate the distribution of somatic mutations in the two TTK modes (Figure 2H). On comparing the mutant genes in the two TTK modes, TP53 and TTN had the highest differential mutation frequency.
3.4. Functional Enrichment Analysis
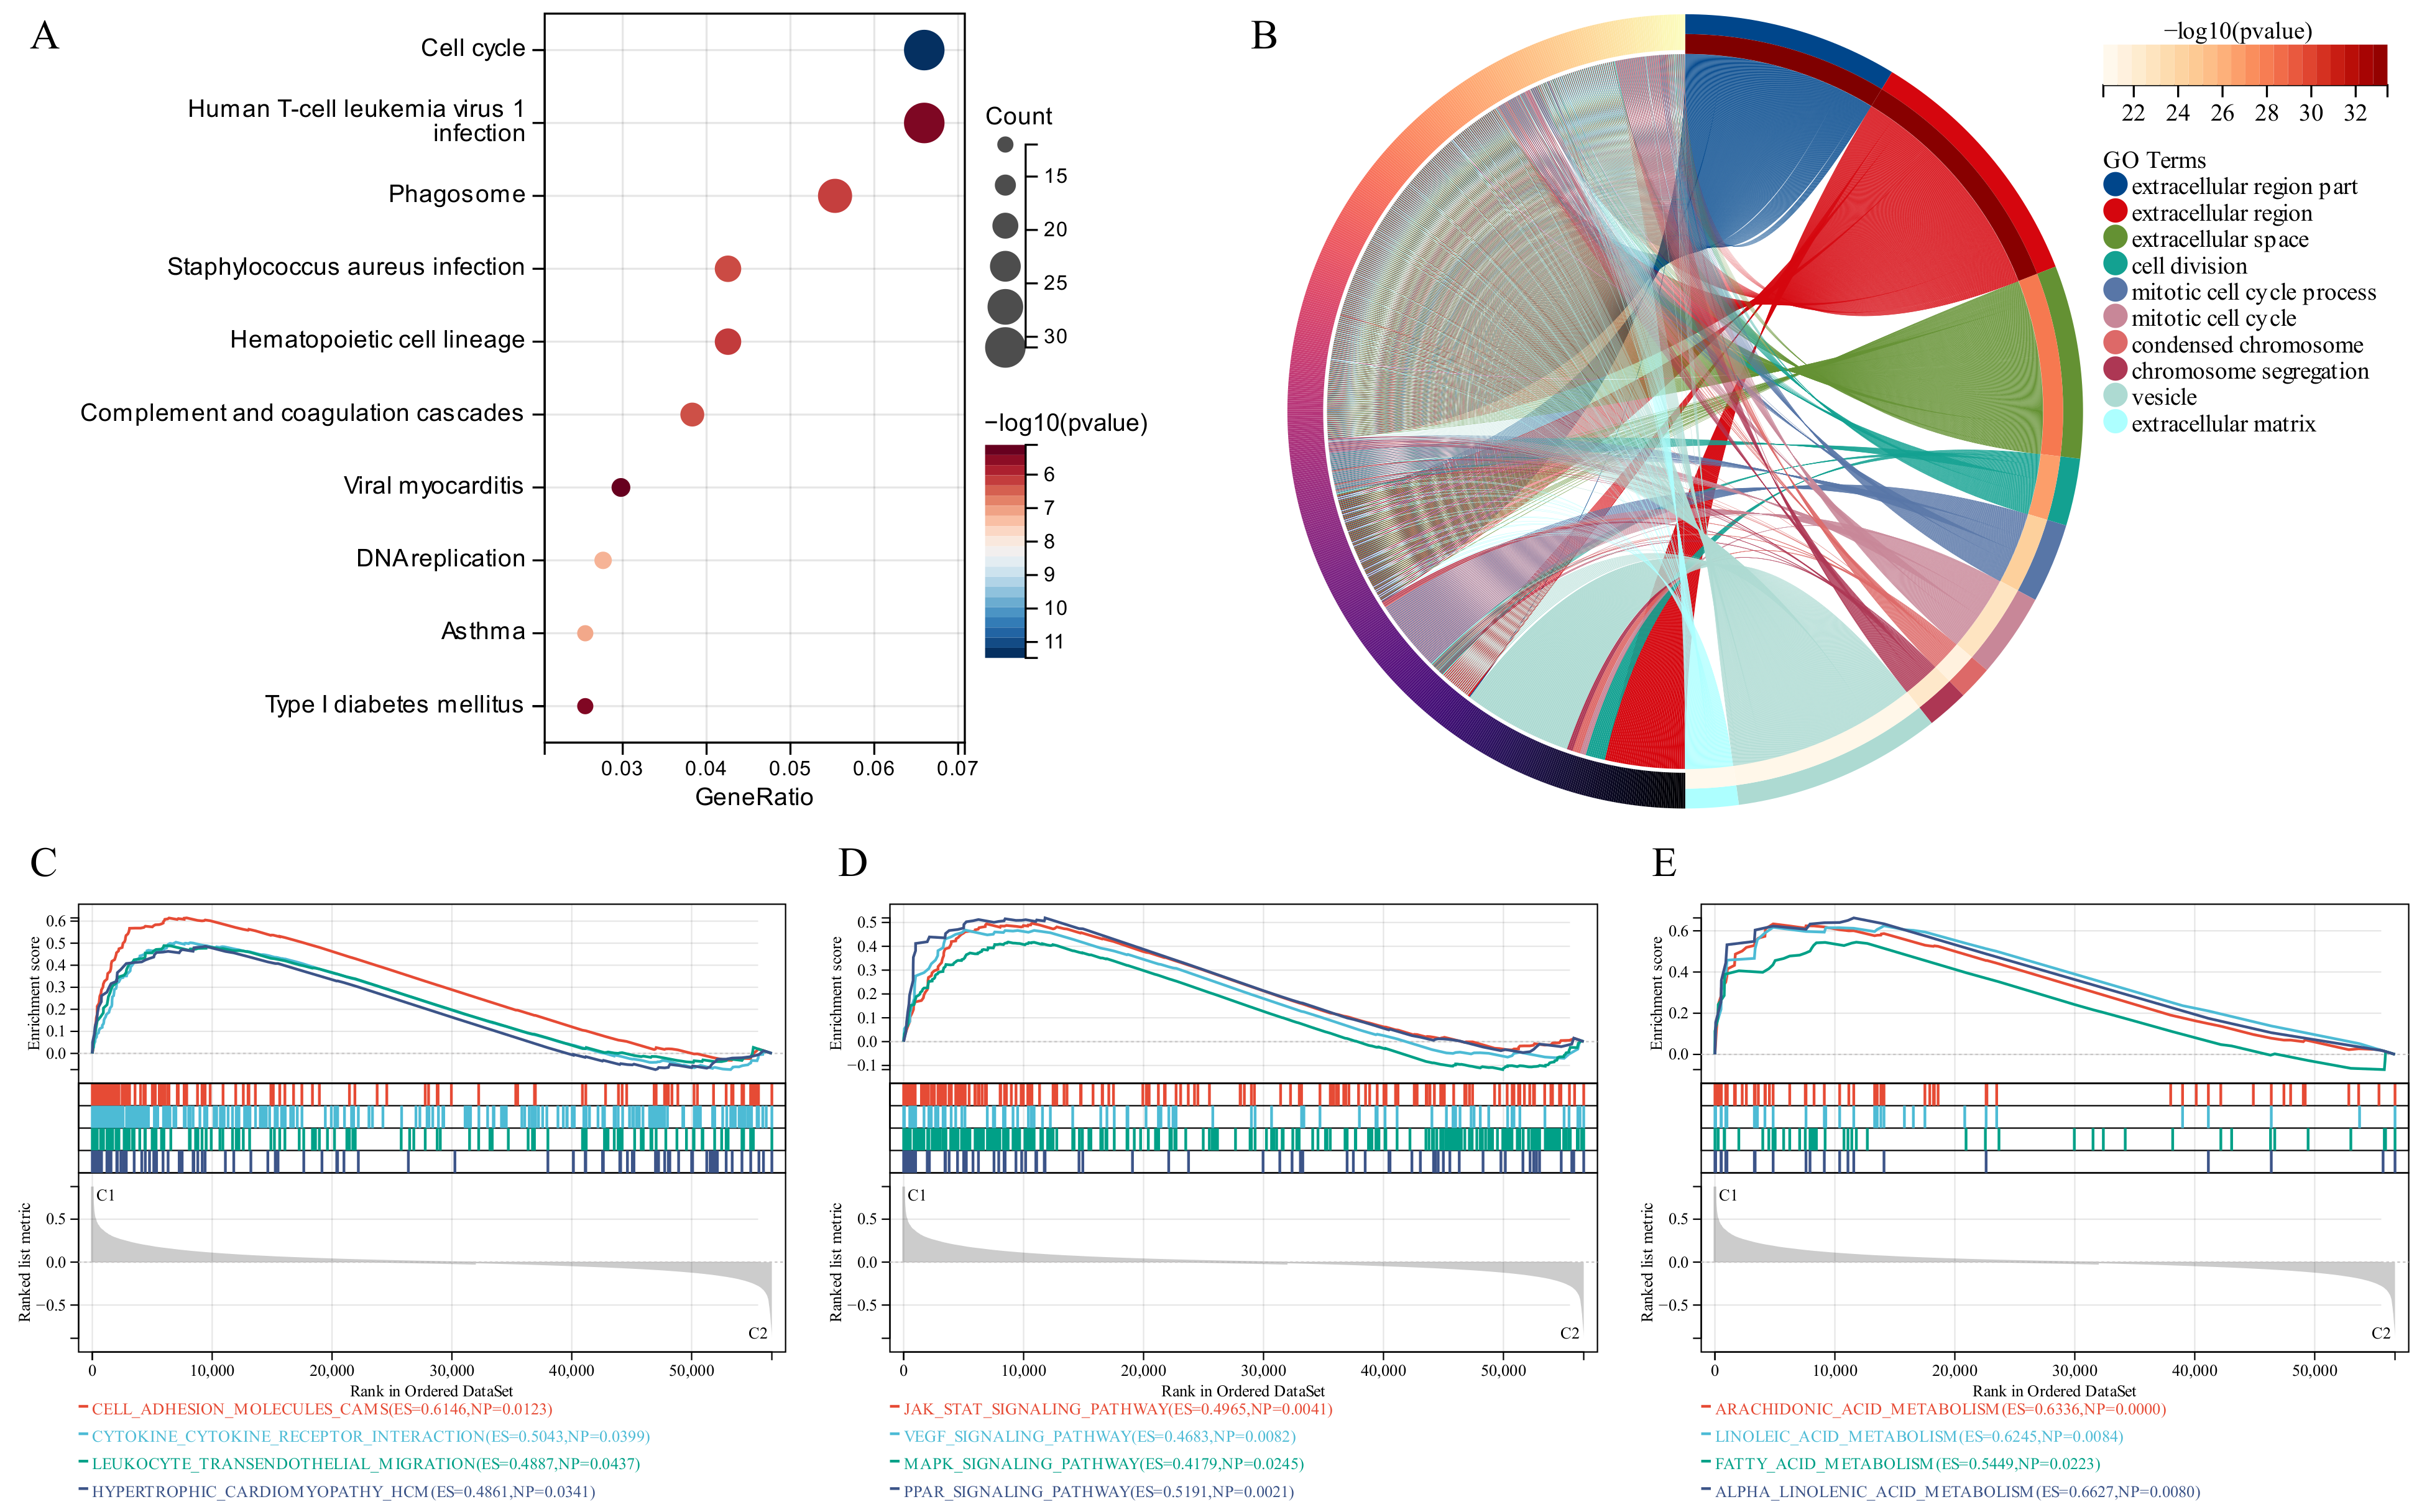
KEGG analysis recognized some signaling pathways involved in the Human T-cell leukemia virus 1 infection, Cell Cycle and Phagosome (Figure 3A). Similarly, GO analysis revealed that the GSTTK were concentrated in the extracellular region. Additionally, some other molecular functions and biological components were also displayed in Figure 3B. To identify the related signaling pathways active in Cluster 1, we compared the two TTK modes using GSEA. Gene sets associated with immunological, tumorigenesis and lipid metabolism pathways, including leukocyte trans-endothelial migration, JAK-STAT, MAPK and arachidonic acid metabolism, were significantly enriched in the GSTTK groups (Figure 3C–E).
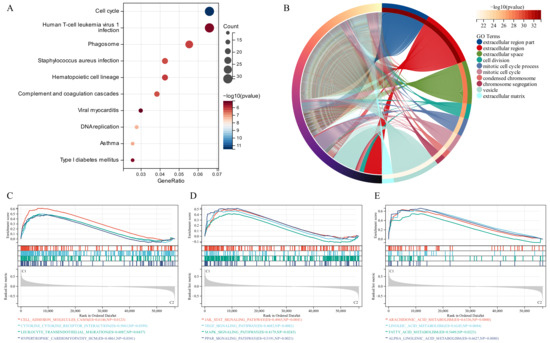
Figure 3.
Functional enrichment and identification of underlying signaling pathways. (A) Dot plots present the Kyoto Encyclopedia of Genes and Genomes analysis. The dot size indicates gene count, and the dot colour indicates −log10 (p-value). (B) Circle plot visualises the biological process, cell component, and molecular function enriched by Gene Ontology analysis. (C–E) Gene Set Enrichment Analysis (GSEA) plots visualise the results of GSEA.
3.5. Different TIME in the Two TTK Modes
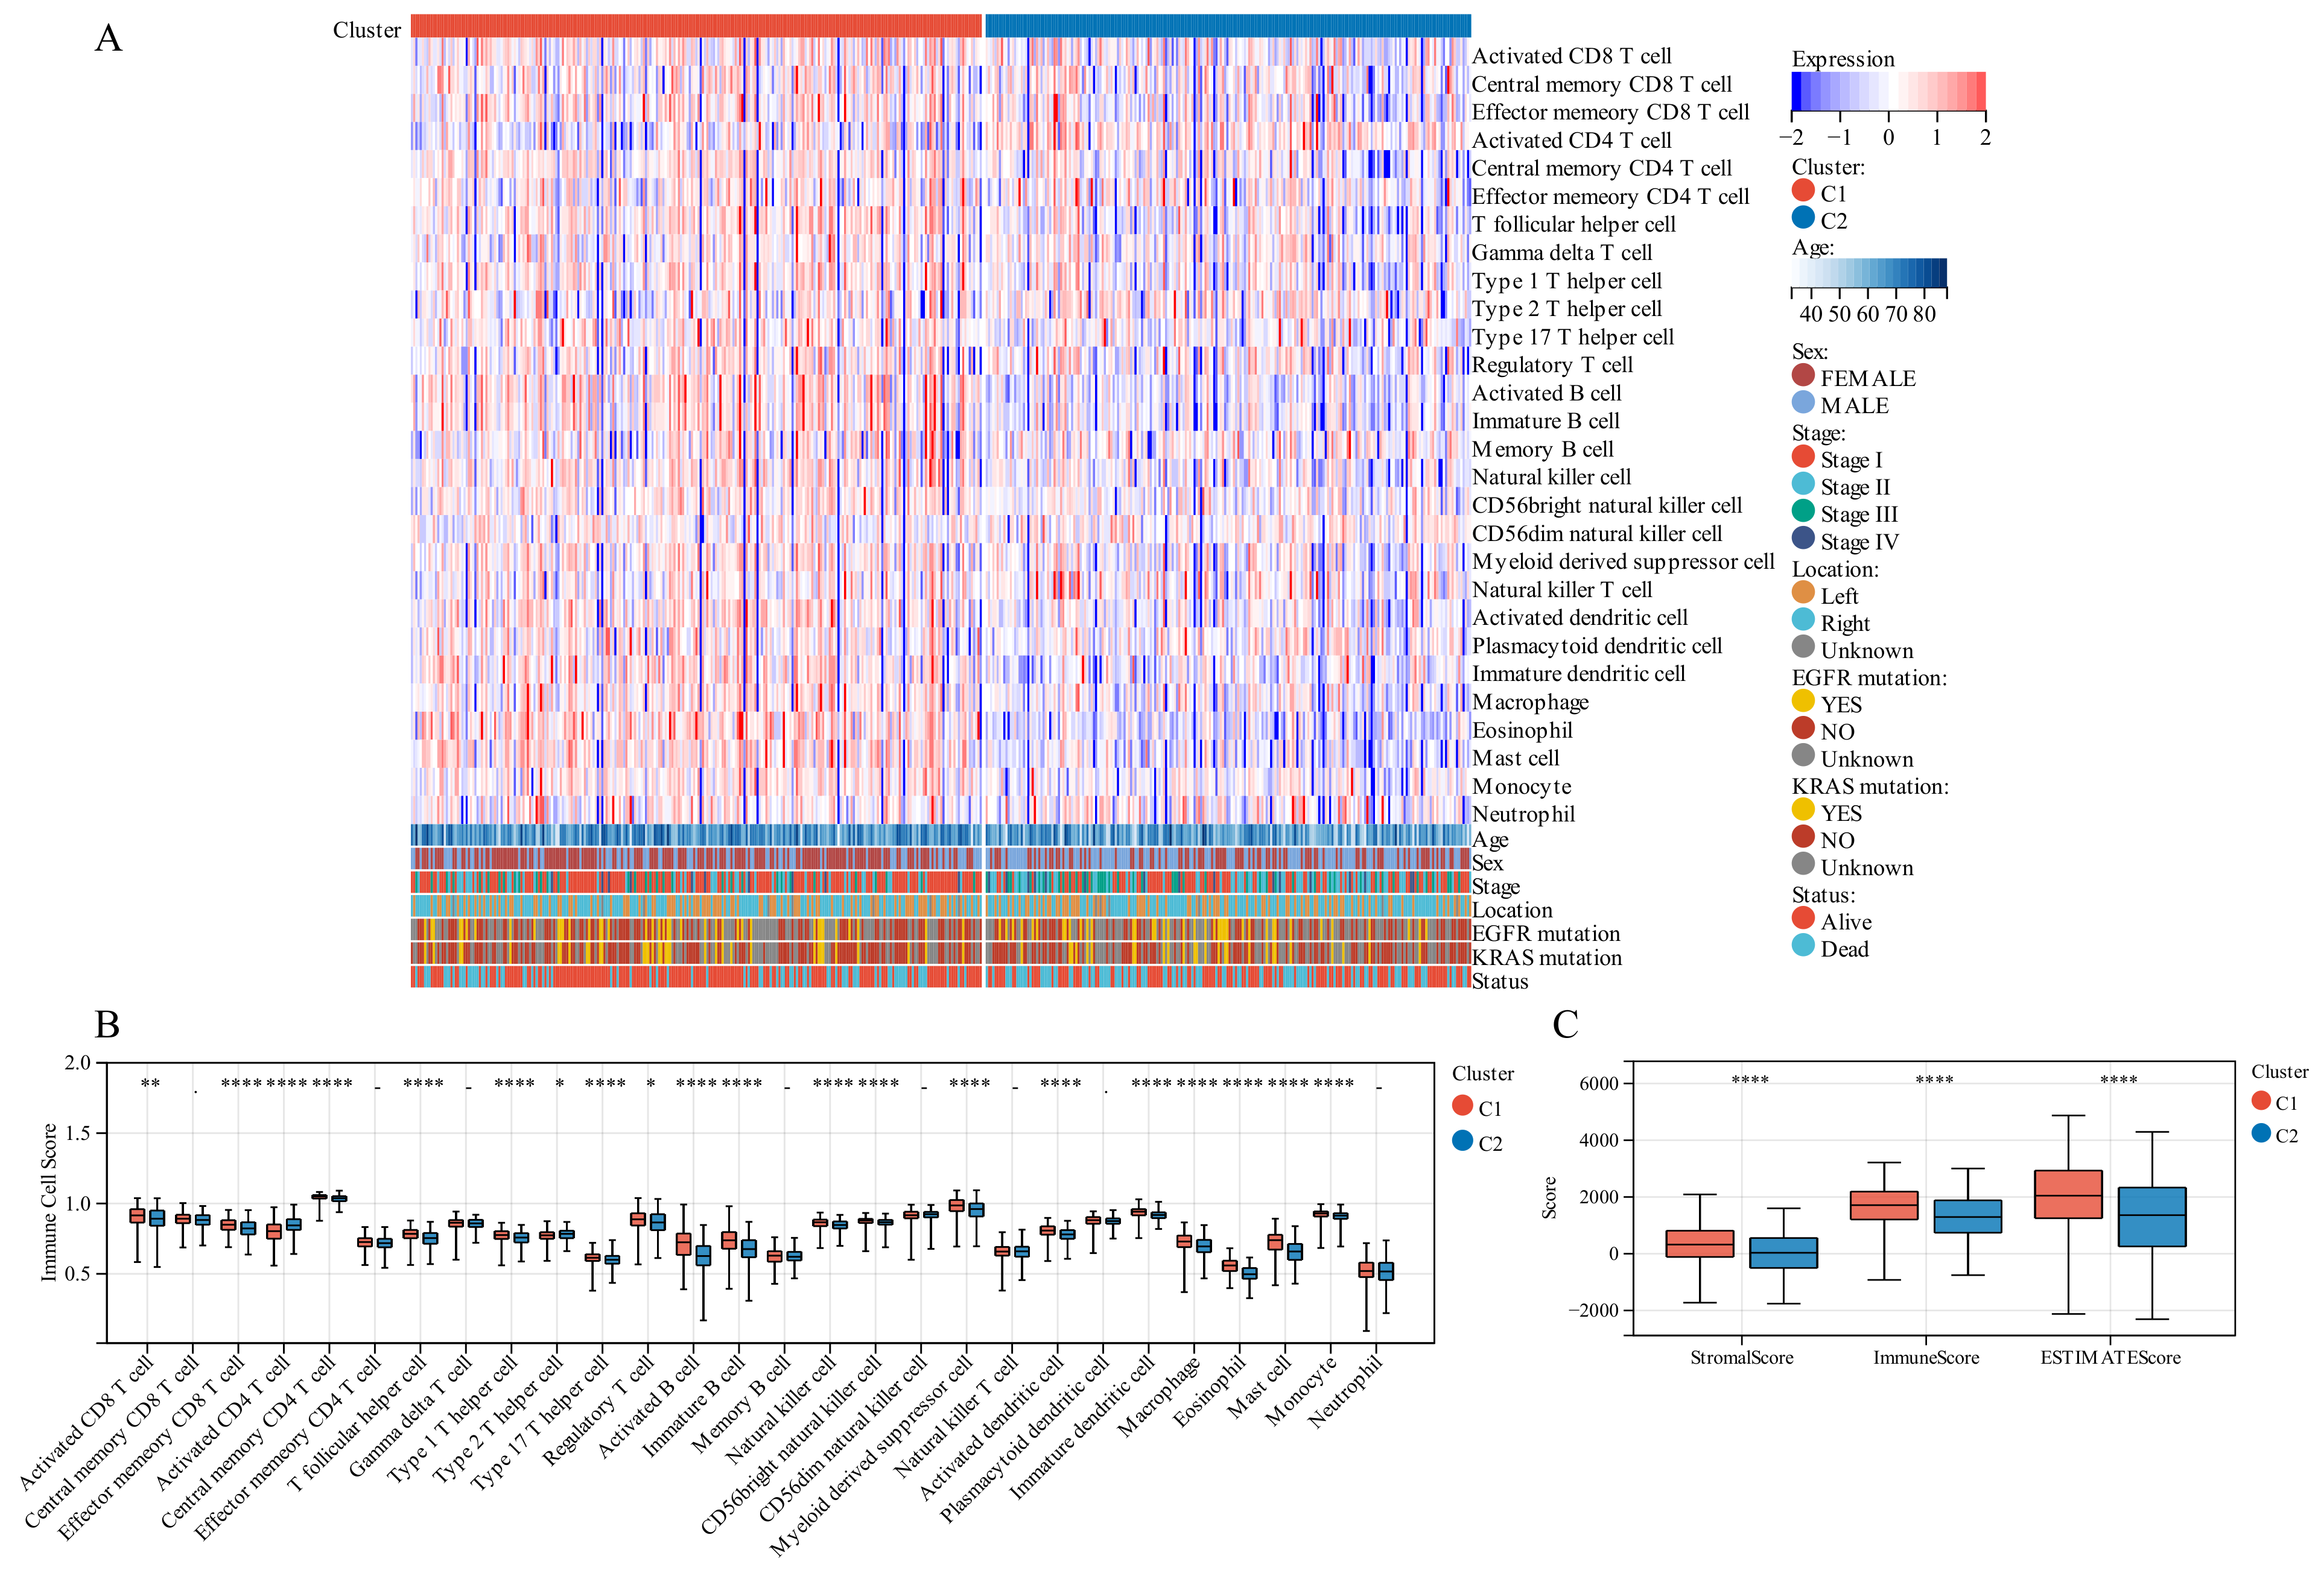
On comparing the makeup of immunogenicity cells entering the TIME of LUAD across the two TTK modes (Figure 4A), major significant observations were made. Patients in Cluster 1 exhibited generally high immunogenicity cell infiltration, while patients in Cluster 2 displayed predominantly low immunogenicity cell infiltration. Additionally, higher immune cell infiltration could be observed in patients with the following characteristics: elderly, female, early stage and survival status.
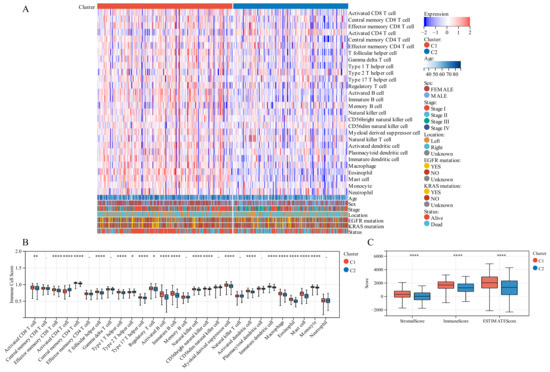
Figure 4.
Tumor immune microenvironment (TIME) immunogenicity cell infiltration features and tumor purity in different TTK modes. (A) Heatmap displays the ssGSEA score of 28 immunogenicity cell features in different TTK modes, and survival status, KRAS mutation, EGFR mutation, tumor location, tumor stage, sex and age. (B) Each infiltrating cell type’s relative abundance differs between the different TTK modes. (C) Box plots present the ESTIMATE score for the different TTK modes in lung adenocarcinoma. Asterisks indicate significance, * p < 0.05; ** p < 0.01; **** p < 0.0001; -, no statistical significance.
To discover the precise immune components responsible for the difference in TIME between Cluster 1 and Cluster 2, we computed the modes-specific differences of 28 immunogenicity cells via ssGSEA. Patients in Cluster 1 with a positive survival outcome showed a high incidence of infiltration by activated CD8 T cells, effector memory CD8 T cells, central memory CD4 T cells, T follicular helper cells, type 1 T helper cells, type 17 T helper cells, activated B cells, natural killer cells, CD56 natural killer cells, activated dendritic cells, macrophage, eosinophil, mast cells and monocyte on the base of KM survival analysis (Figure 2F), while those in Cluster 2 with poor clinical prognosis had a low incidence of infiltration by activated CD4 T cells and type 2 T helper cells (Figure 4B).
3.6. Different TIME Status in the Two Molecular Modes
We employed immune analysis to investigate the immunity differential between the two TTK molecular modes. Patients with LUAD in Cluster 1 had a higher immune score, ESTIMATE score and stromal score than those in Cluster 2 (Figure 4C). Besides, the CIBERSORT algorithm indicated that Cluster 1 had higher levels of memory resting CD4 T cells, monocytes, resting mast cells and resting dendritic cells, and lower levels of memory activated CD4 T cells, resting natural killer cells and M0 macrophages than those in Cluster 2 (Figure 5A,B). Additionally, the MCPCounter algorithm revealed that Cluster 1 had significantly higher levels of neutrophils, T cells, B cells, myeloid dendritic cells and endothelial cells (Figure 5C,D). Cluster 1 samples scored higher in TIDE score and T cell dysfunction in an RNA-sequencing-based TIDE analysis than Cluster 2 samples, whereas Cluster 2 samples scored higher in T cell exclusion and myeloid-derived suppressor cells (Figure 5E).
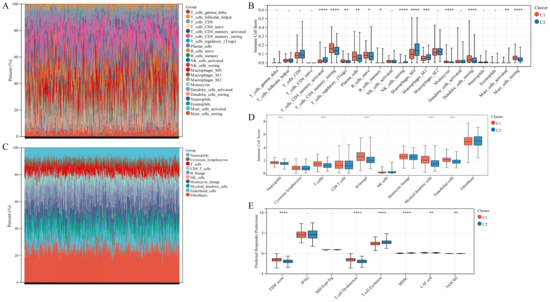
Figure 5.
Immune landscape in the two TTK modes. (A,C) The relative proportion of immune infiltration analysed using the CIBERSORT and MCPCounter algorithms in TCGA-LUAD cohorts. (B,D) Box plots display the significantly distinct immunogenicity cells between various subtypes in TCGA-LUAD cohorts using the CIBERSORT and MCPCounter algorithms. (E) Box plots display the TIDE score for the two clusters in LUAD. Asterisks indicate significance, * p < 0.05; ** p < 0.01; *** p < 0.001; **** p < 0.0001; -, no statistical significance.
3.7. Construction of The GSTTK Risk Signature in the Training Set
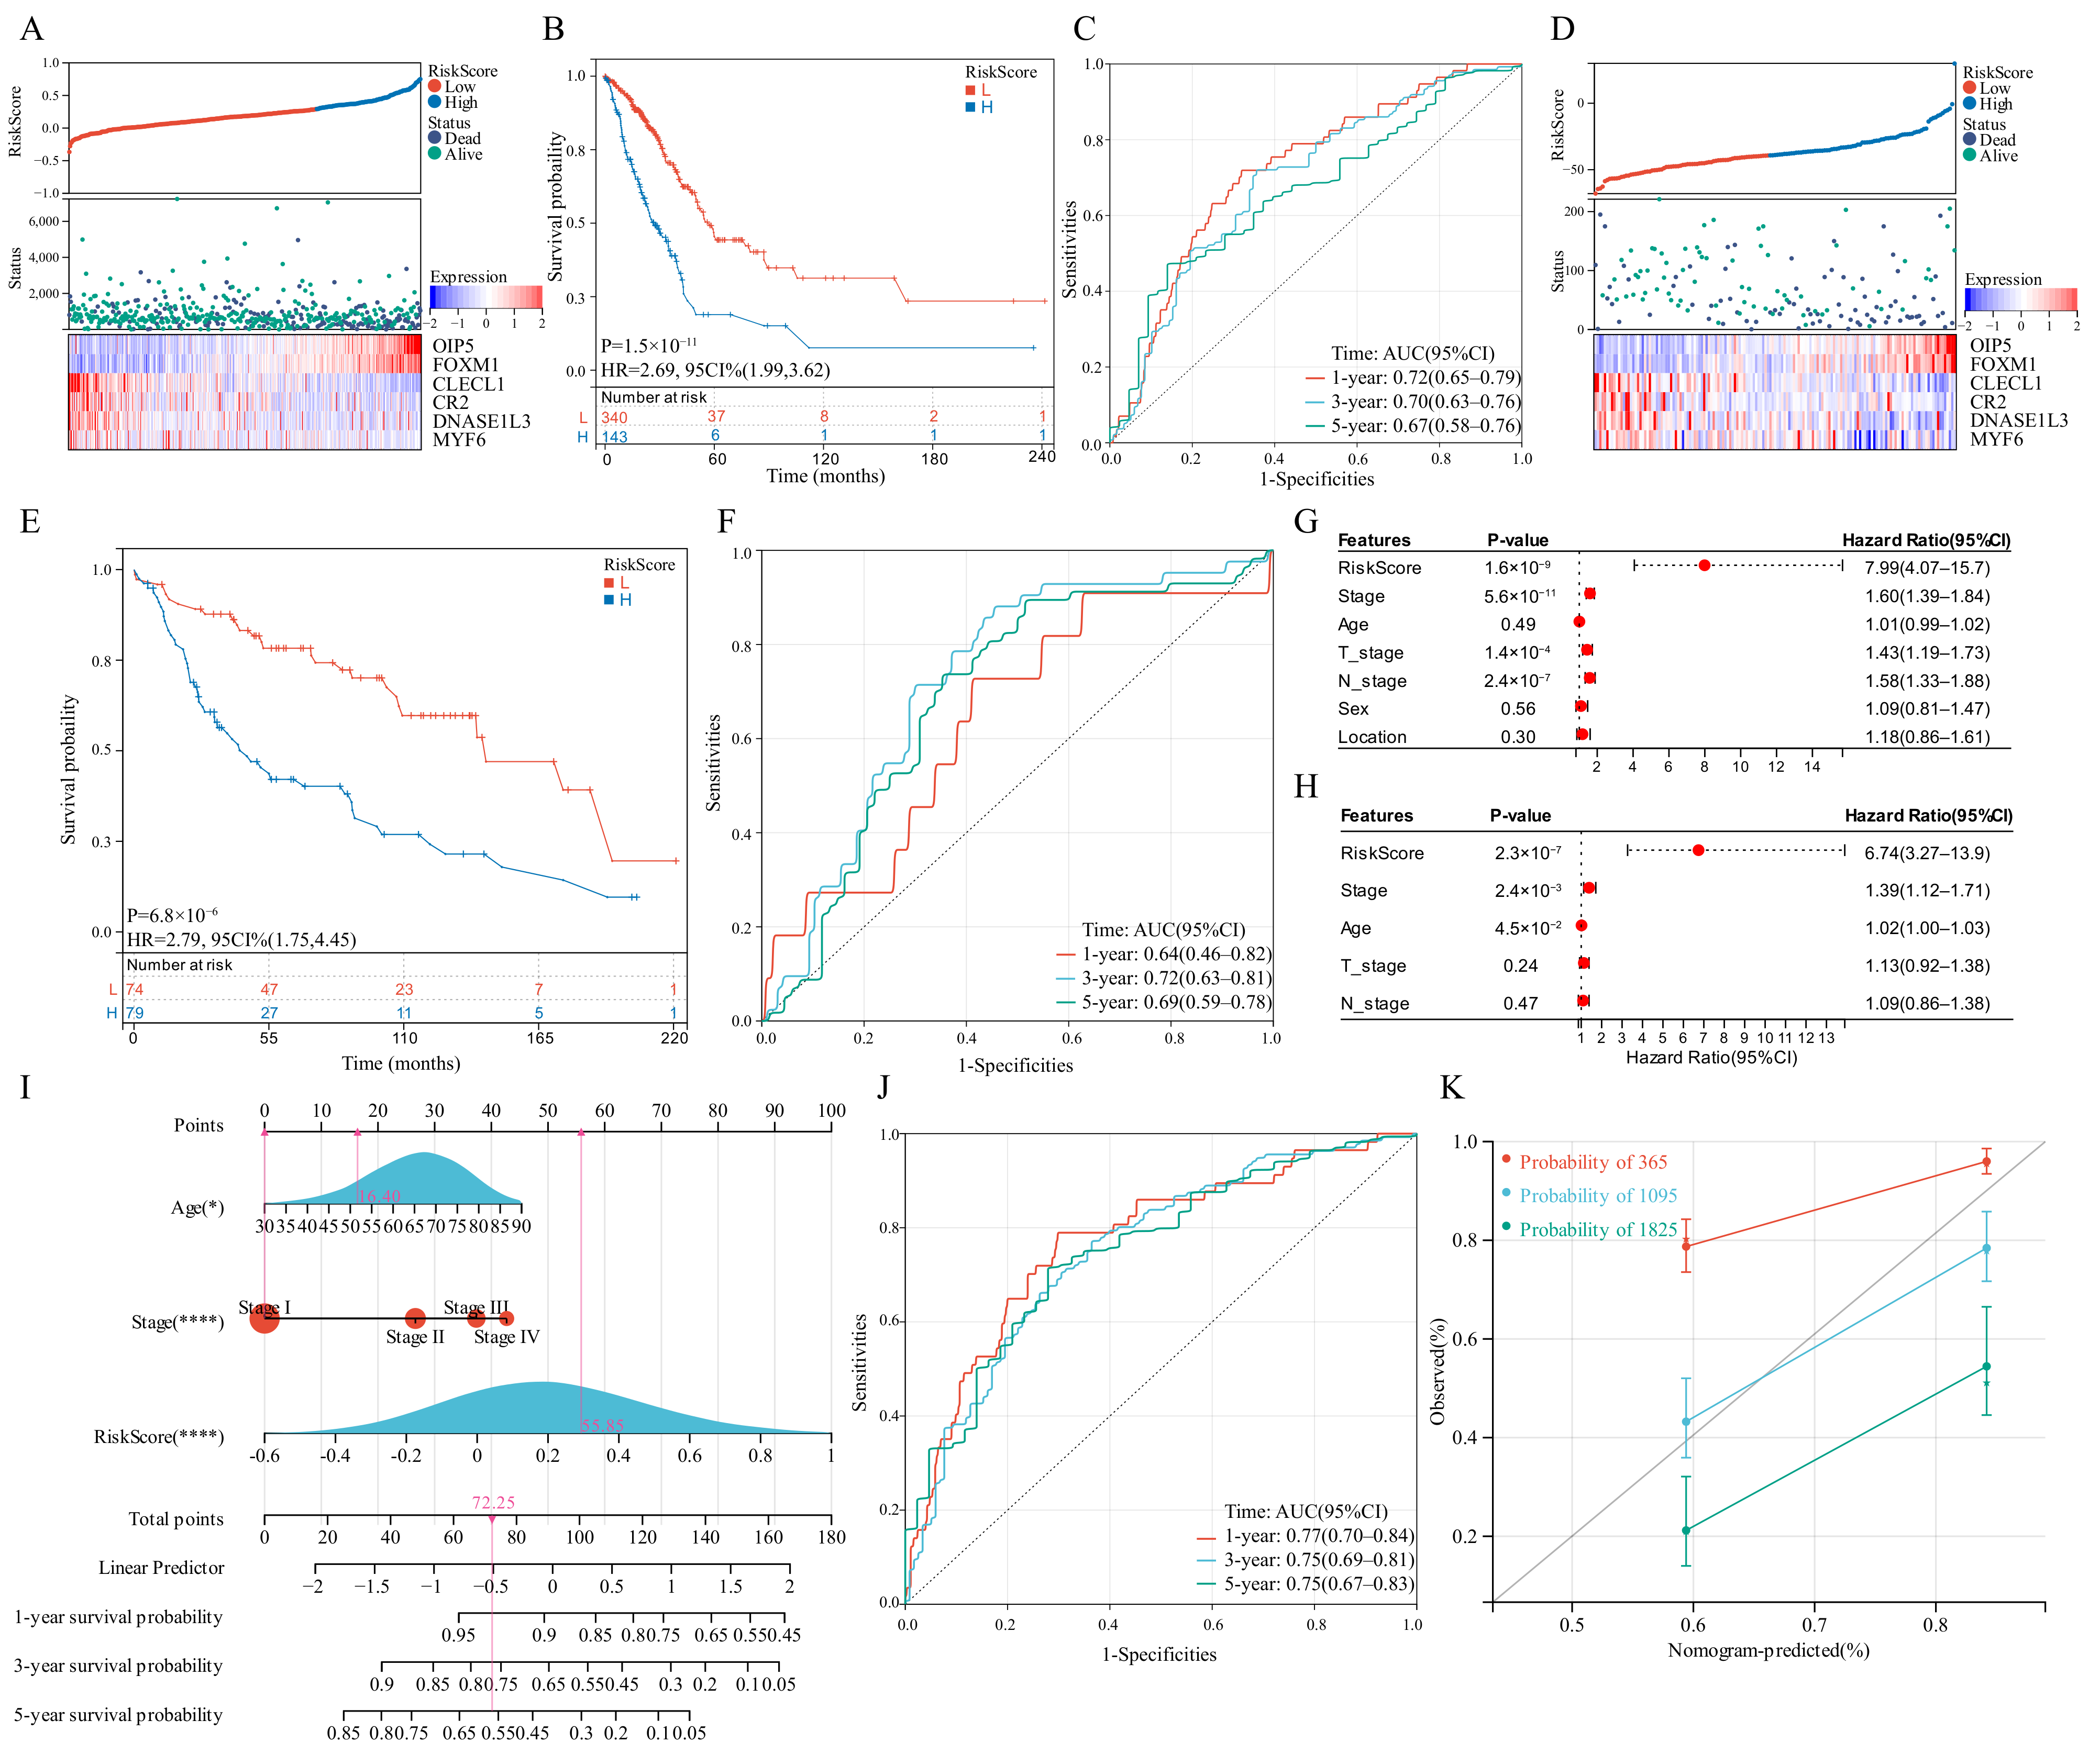
LASSO regression analysis was utilized to select candidate genes for developing a risk score and the optimal lambda value was used to filter 26 genes. Six genes were detected by LASSO analysis and were utilized to generate the risk score model. Each patient’s risk score was computed in the training set and validation set as follows: risk score = 0.1268 × OIP5 + 0.0638 × FOXM1 − 0.1644 × CLECL1 − 0.0068 × CR2 − 0.0259 × DNASE1L3 − 1.3362 × MYF6. The developed risk score categorized patients with LUAD into low-risk and high-risk groups (Figure 6A). The OS of the low-risk group patients would be longer than those in the high-risk group (Figure 6B). As far as the diagnostic efficacy of the risk score, the ROC curve demonstrated a passable evaluation outcome (Figure 6C). The built risk score had an accurate ability to forecast over 5 years, with the area under the curve (AUC) of the ROC curve for 1, 3 and 5 years as 0.72, 0.70 and 0.67, respectively. Different subgroups were assessed for risk scores based on age, gender, tumor location, survival status, T-stage, tumor stage, EGFR mutation status and KRAS mutation status, wherein all the subgroups had significant differences except the tumor location and EGFR mutation status subgroups. (Figure S4A–H). Pearson’s correlation coefficients between risk scores and typical immunological checkpoints were presented as a correlation heatmap, with the correlation between CD4 and risk score considered to be the strongest (Figure S4I). The expression of typical immunological checkpoints was compared between the two differential risk score subgroups. Significant differences in the gene expression of PD-L1, CTLA-4, TIM-3, TIGIT and CD4 in the two differential risk score subgroups were observed (Figure S4J). Finally, the two differential risk score subgroups were analysed for prognosis based on age, sex, EGFR mutation and KRAS mutation status, wherein the survival curves were separated for all variables (Figure S5).
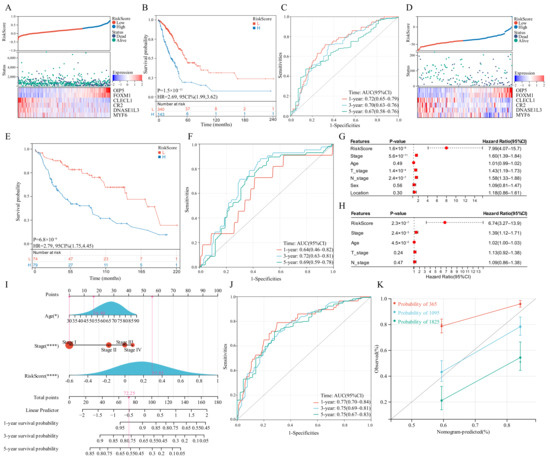
Figure 6.
Survival analysis of the risk score model and integrated nomogram. (A,D) Risk scores split line, survival status of individual and heatmap of the six GSTTK in the TCGA or GEO cohorts. (B,E) Kaplan-Meier analysis exhibits the prognostic significance of the risk score in TCGA or GEO cohorts. (C,F) Time-dependent receiver operating characteristic (ROC) analysis demonstrates the specificity and sensitivity of the risk score in TCGA or GEO cohorts. (G,H) Univariate and multivariate Cox analyses of TCGA-LUAD cohort. (I) Integrated nomogram including risk score and important clinical features. (J) ROC analysis of the integrated nomogram. (K) Calibration curve of the integrated nomogram at 1, 3 and 5 years in TCGA-LUAD cohort.
3.8. Verification of the GSTTK Risk Signature in the Validation Set
The developed risk score was then repeatedly validated in the validation set. Patients with LUAD were categorized into two differential risk score groups utilizing the above-mentioned formula (Figure 6D). Moreover, survival analysis indicated that high-risk individuals had poor outcomes (P = 6.8 × 10⁻⁶, HR = 2.79, Figure 6E). Furthermore, the ROC curve revealed that the risk score provided the most accurate prediction efficiency for 3-year survival (Figure 6F).
3.9. Construction and Calibration of an Integrated Nomogram
Based on univariate and multivariate Cox outcomes (Figure 6G,H), an integrated nomogram incorporating the risk score and important clinical characteristics was created for estimating the survival rate of patients with LUAD. The constructed nomogram is depicted in Figure 6I and clinical characteristics and risk scores are assigned a precise score based on their contribution to LUAD survival. As far as the model diagnostic of the nomogram (Figure 6J), the C-index and calibration curve exhibited a satisfactory degree of accuracy (Figure 6K). The integrated nomogram had an accurate ability to forecast over 5 years, with the AUC of the ROC curve for 1, 3 and 5 years being 0.77, 0.75 and 0.75, respectively. The C-index of the integrated nomogram in the training set achieved 0.72. Thus, the integrated nomogram can forecast the survival of patients with LUAD with high accuracy.
4. Discussion
Immunotherapy drugs, such as anti-PD-(L)1 and anti-CTLA4 antibodies, are approved for treating cancer; however, only some patients with LUAD respond to these treatments. Consequently, it is essential to describe the specific TIME in LUAD and classify patients according to their speculated response to immunotherapy.
We employed GSTTK, which was identified using high-throughput analytical techniques, to distinguish LUAD and utilized unsupervised clustering to further dedifferentiate based on TTK modes. Following that, a thorough investigation of variances in the TIME was carried out (such as somatic mutations, the levels of tumor-infiltrating cells, immunoreactivity score and immunostimulatory gene function) between TTK modes. Furthermore, we established a scoring system to predict the prognosis of lung adenocarcinoma.
Immune infiltration and immunotherapy response are linked; immunogenicity cell malfunction enhances tumor immunosuppression. In this study, we classified patients based on genomic data from TCGA-LUAD and checked the results in a patient population utilizing GEO data. We observed that Cluster 1 was characterized by immunogenic cells that mediated anti-tumor treatment, and survival rates in this cluster were higher than those in Cluster 2. Moreover, the malignant tumor is more than just an aggregation of tumor cells; it also contains fibroblasts, endothelial cells, structural components and immune cells that affect tumor formation, metastasis, invasion and prognosis [27]. Xu et al. analysed clinical data, whole-exome sequencing data and RNA sequencing data of over 10,000 samples, which included 13 common cancers and normal samples [28], and categorized tumors as TIME-poor, TIME-intermediate and TIME-rich subtypes. The TIME-rich subgroup had more tumor-infiltrating lymphocytes (TILs) and a more favourable prognosis, most notably for ICI therapy [29,30], compared to the other subtypes. For instance, the presence of (CD45RO+CCR7-CD28-CD27-) effector memory T cells in the TIME was an independent survival predictive factor [31]. Similarly, tumor-infiltrating B cells are also reported to be present in all stages of tumor development, having crucial effects on the TIME [32]. The role of endothelial cells cannot be ignored, and evidence suggests that angiogenesis and immune evasion often occur simultaneously [33]. The interaction between tumor endothelial cells and immune cells explains the effectiveness of combining anti-angiogenic medicines with ICIs, and the combination of both treatments has the potential to disrupt the equilibrium of TIME [34]. In this study, Cluster 1 had more TILs, such as activated CD8 T cells, effector memory CD8 T cells, central memory CD4 T cells, T follicular helper cells, type 1 T helper cells, type 17 T helper cells, activated B cells, natural killer cells, CD56 natural killer cells, activated dendritic cells, macrophage, eosinophil, mast cells and monocyte, than Cluster 2. These findings demonstrated that Cluster 1 was more likely to achieve a favourable prognosis, including ICI therapy.
A recent study reported a relationship between tumor mutations and immunotherapy response or tolerance [35]. In the current study, the most prevalent mutations were missense mutations, followed by nonsense mutations and splice site mutations, in that order. The gene mutation rates in Cluster 1 were generally lower than those in Cluster 2, and TP53 exhibited the highest difference in mutation frequencies. The most prevalent cancer-related genetic alteration is the TP53 mutation, which is associated with a worse prognosis and a more aggressive disease stage in various malignancies [36]. TP53 modifies the tumor cell cycle via the p53/TGF-β signaling pathway. Additionally, it can be speculated that Cluster 2 promotes proliferation via the β-catenin/TCF signaling pathway owing to its greater rate of LRP1B mutation than Cluster 1 [37,38]. Hence, patients in Cluster 2 who had abundant TP53 and LRP1B mutations had a worse prognosis than those in Cluster 1 who had low levels of TP53 and LRP1B mutations. This is consistent with our survival data.
Transcriptome data was merged from the six GSTTK to generate a new, independent quantitative biomarker combination, the risk score, which was utilized for each patient’s assessment of clinical features, sensitivity to immunotherapy and survival rates. The six genes utilized for building risk scores in this study are reported to be strongly related with the occurrence and growth of cancer. OIP5 (Opa interacting protein 5), one of the cancer-testis antigens, is involved in cell cycle regulation and interacts with RAF1 in lung cancer, resulting in poor prognosis [39]. FOXM1 (Forkhead box transcription factor) is participated in various biological activities, such as proliferation, and cell cycle progression [28]. Previous studies have reported the involvement of FOXM1 in various tumorigenesis and progression processes [40,41,42] and have also been related with poor survival rate of small cell lung cancer [43]. CLECL1 encodes C-type lectin-like 1, which is produced by antigen-presenting cells, such as dendritic cells, and is speculated to take part in the regulation of the immune response [44,45]. CR2, also known as CD21, is a complement C3 receptor located outside of B-cells, thereby allowing the complement system to participate in B-cell activation and maturation [46]. Furthermore, CR2 is also considered a promising biomarker for predicting survival in patients with locally advanced NSCLC [47]. The majority of DNASE1L3 (Deoxyribonuclease 1-like 3) is generated by macrophages, dendritic cells and neutrophils. Prior research has suggested that DNASE1L3 has a vital effect on DNA catabolism and cell apoptosis [48,49]. The mRNA expression of DNASE1L3 has also been strongly linked with the diverse immune cell infiltration and immune blocking checkpoints in LUAD, particularly with a subset of m6A methylation regulators [50]. MYF6 (myogenic factor 6) is a muscle-specific transcription factor that is essential for muscle differentiation. The hypomethylation of the MYF6 gene was identified in NSCLC and associated with stage I of the disease [51]. Notably, survival analysis demonstrated in the current study that the created risk score accurately predicted the survival rate of patients with LUAD. Such comprehensive bioinformatic analyses could guide future research works on elucidating the functions and mechanisms of these vital genes. Furthermore, an integrated nomogram incorporating the risk score and important clinical characteristics demonstrated a superior degree of survival prediction accuracy.
However, this study still has several limitations and needs more advanced evidence. The TTK modes and risk score were derived using comprehensive bioinformatics analyses, thus further large-scale clinical trials are required for validating the results of this study. We did not achieve a high level of precision and personalization, which may have been influenced by the selection of gene set. Additionally, vital GSTTK and tumorigenic pathways in TTK modes, such as JAK-STAT, VEGF and MAPK signaling pathways, require experimental validation in the future. The further research could employ single or multiple gene sets in combination with radiomics and pathomics data to make predictions for specific populations, such as lung cancer patients receiving neoadjuvant immunotherapy. In the future, excellent clinical prognostic models could be generated by combining artificial neural network algorithms with massive amounts of real-world data. In addition, prospective clinical trials could be undertaken in the future using genomics to guide patient stratifications for immunotherapy options and aid in prognosis prediction. Blood collection at distinct times to monitor changes in gene expression assists in the analysis of immunotherapy resistance mechanisms.
5. Conclusions
Two TTK modes were identified in LUAD using the bioinformatic analysis of the expression of six GSTTK, shedding light on T cell activity in LUAD. Besides, the modes of TTK, such as TIME features and multi-omics characteristics, were investigated. They also aid in determining therapeutic regimens, such as the selection of immunotherapy or combination therapy tactics. Ultimately the integrated nomogram, a comprehensive description of the TTK modes of individual tumors, was constructed, which enhances our knowledge of the TIME and genomic characteristics.
Supplementary Materials
The following are available online at https://www.mdpi.com/article/10.3390/jcm11237223/s1, Table S1. Baseline clinical characteristics of the two clustered subgroups; Table S2. Univariate Cox regression analysis for 26 GSTTK; Figure S1. Combining with the GEO datasets and removal of the batch effect. Density (A,B), UMAP (C,D) and expression data (E,F) distribution of data sets before and after removing the batch effect; Figure S2. (A) The flow diagram of the study. (B) Heatmap displays the 99 GSTTK differentially expressed in LUAD. (C,D) tSNE and UMAP analyses differentiate between cancerous and para-cancerous tissues. (E) Protein-protein interaction (PPI) network of the six GSTTK, 20 co-expressed proteins and related signaling pathways. DEGs, differently expressed genes; FC, fold change; GEO, Gene Expression Omnibus; LASSO, least absolute shrinkage and selection operator; LUAD, lung adenocarcinoma; OS, overall survival; PCA, principal component analysis; ROC, receiver operating characteristic; TCGA, The Cancer Genome Atlas; tSNE, t-distributed stochastic neighbor embedding; Figure S3. (A,B) tSNE and UMAP verified the two modes in TCGA datasets. (C) Two modes of TTK were recognized using unsupervised clustering in the GEO datasets. (D,E) The optimal value was K = 2 for consensus clustering. (F,G) tSNE and UMAP verified the two modes in the GEO datasets; Figure S4. (A–H) Differential expression of the risk score in age, sex, tumor location, survival status, T stage, tumor stage, EGFR mutation, and KRAS mutation subgroups. (I) There is a correlation between the expression of some common immunogenicity checkpoints and the risk score in the TCGA-LUAD cohort. (J) Box plots presented that immunogenicity checkpoint expressions in the TCGA-LUAD cohort were markedly different between high- and low-risk individuals; Figure S5. Kaplan–Meier analysis of age, sex, EGFR mutation and KRAS mutation subgroups between high- and low-risk individuals in TCGA-LUAD cohort.
Author Contributions
P.D., L.L. and Y.B.: Conception, data collection, design, statistics and data interpretation; Y.H. and L.C.: Result analysis and manuscript preparation; L.W. and R.Z.: Data collection and interpretation; F.T. and X.D.: Manuscript revision. All authors have read and agreed to the published version of the manuscript.
Funding
This research received no external funding.
Institutional Review Board Statement
TCGA and GEO belong to public databases. The patients involved in the database have obtained ethical approval. Users can download relevant data for free for research and publish relevant articles. Our study is based on open-source data, so there are no ethical issues and other conflicts of interest.
Informed Consent Statement
Informed consent was obtained from all subjects involved in the study.
Data Availability Statement
We downloaded all data utilized in this research from the GDC portal (https://portal.gdc.cancer.gov/) and the GEO database (GSE29013, GSE29016 and GSE30219).
Conflicts of Interest
All authors state this study has no financial or commercial connections that might be considered a potential conflict of interest.
References
- Sung, H.; Ferlay, J.; Siegel, R.L.; Laversanne, M.; Soerjomataram, I.; Jemal, A.; Bray, F. Global Cancer Statistics 2020: GLOBOCAN Estimates of Incidence and Mortality Worldwide for 36 Cancers in 185 Countries. CA Cancer J. Clin. 2021, 71, 209–249. [Google Scholar] [CrossRef] [PubMed]
- Duma, N.; Santana-Davila, R.; Molina, J.R. Non-Small Cell Lung Cancer: Epidemiology, Screening, Diagnosis, and Treatment. Mayo Clin. Proc. 2019, 94, 1623–1640. [Google Scholar] [CrossRef] [PubMed]
- Wang, Y.; Wang, H.; Yao, H.; Li, C.; Fang, J.-Y.; Xu, J. Regulation of PD-L1: Emerging Routes for Targeting Tumor Immune Evasion. Front. Pharmacol. 2018, 9, 536. [Google Scholar] [CrossRef] [PubMed]
- Torlakovic, E.; Lim, H.J.; Adam, J.; Barnes, P.; Bigras, G.; Chan, A.W.H.; Cheung, C.C.; Chung, J.-H.; Couture, C.; Fiset, P.O.; et al. “Interchangeability” of PD-L1 immunohistochemistry assays: A meta-analysis of diagnostic accuracy. Mod. Pathol. 2019, 33, 4–17. [Google Scholar] [CrossRef] [PubMed]
- Elfving, H.; Mattsson, J.S.M.; Lindskog, C.; Backman, M.; Menzel, U.; Micke, P. Programmed Cell Death Ligand 1 Immunohisto-chemistry: A Concordance Study Between Surgical Specimen, Biopsy, and Tissue Microarray. Clin. Lung Cancer 2019, 20, 258–262. [Google Scholar] [CrossRef]
- Brunnström, H.; Johansson, A.; Fremer, S.W.; Backman, M.; Djureinovic, D.; Patthey, A.; Isaksson-Mettävainio, M.; Gulyas, M.; Micke, P. PD-L1 immunohistochemistry in clinical diagnostics of lung cancer: Inter-pathologist variability is higher than assay variability. Mod. Pathol. 2017, 30, 1411–1421. [Google Scholar] [CrossRef]
- Tsao, M.S.; Kerr, K.M.; Kockx, M.; Beasley, M.-B.; Borczuk, A.C.; Botling, J.; Bubendorf, L.; Chirieac, L.; Chen, G.; Chou, T.-Y.; et al. PD-L1 Immunohistochemistry Comparability Study in Real-Life Clinical Samples: Results of Blueprint Phase 2 Project. J. Thorac. Oncol. 2018, 13, 1302–1311. [Google Scholar] [CrossRef]
- Hirsch, F.R.; McElhinny, A.; Stanforth, D.; Ranger-Moore, J.; Jansson, M.; Kulangara, K.; Richardson, W.; Towne, P.; Hanks, D.; Vennapusa, B.; et al. PD-L1 Immunohistochemistry Assays for Lung Cancer: Results from Phase 1 of the Blueprint PD-L1 IHC Assay Comparison Project. J. Thorac. Oncol. 2017, 12, 208–222. [Google Scholar] [CrossRef]
- Rimm, D.L.; Han, G.; Taube, J.M.; Yi, E.S.; Bridge, J.A.; Flieder, D.B.; Homer, R.; West, W.W.; Wu, H.; Roden, A.C.; et al. A Prospective, Multi-institutional, Pathologist-Based Assessment of 4 Immunohistochemistry Assays for PD-L1 Expression in Non–Small Cell Lung Cancer. JAMA Oncol. 2017, 3, 1051. [Google Scholar] [CrossRef]
- Doroshow, D.B.; Wei, W.; Gupta, S.; Zugazagoitia, J.; Robbins, C.; Adamson, B.; Rimm, D.L. PD-L1 tumor proportion score and overall survival from first line pembrolizumab in patients with nonsquamous versus squamous non-small cell lung cancer. J. Thorac. Oncol. 2021, 16, 2139–2143. [Google Scholar] [CrossRef]
- Camidge, D.R.; Doebele, R.C.; Kerr, K.M. Comparing and contrasting predictive biomarkers for immunotherapy and targeted therapy of NSCLC. Nat. Rev. Clin. Oncol. 2019, 16, 341–355. [Google Scholar] [CrossRef]
- Genova, C.; Dellepiane, C.; Carrega, P.; Sommariva, S.; Ferlazzo, G.; Pronzato, P.; Gangemi, R.; Filaci, G.; Coco, S.; Croce, M. Therapeutic Implications of Tumor Micro-environment in Lung Cancer: Focus on Immune Checkpoint Blockade. Front. Immunol. 2021, 12, 799455. [Google Scholar] [CrossRef]
- Pan, D.; Kobayashi, A.; Jiang, P.; Ferrari de Andrade, L.; Tay, R.E.; Luoma, A.M.; Tsoucas, D.; Qiu, X.; Lim, K.; Rao, P.; et al. A major chromatin regulator determines re-sistance of tumor cells to T cell-mediated killing. Science 2018, 359, 770–775. [Google Scholar] [CrossRef]
- Ru, B.; Wong, C.N.; Tong, Y.; Zhong, J.Y.; Zhong, S.S.W.; Wu, W.C.; Chu, K.C.; Wong, C.Y.; Lau, C.Y.; Chen, I.; et al. TISIDB: An integrated repository portal for tumor–immune system interactions. Bioinformatics 2019, 35, 4200–4202. [Google Scholar] [CrossRef]
- Taminau, J.; Meganck, S.; Lazar, C.; Steenhoff, D.; Coletta, A.; Molter, C.; Duque, R.; Schaetzen, V.D.; Weiss Solís, D.Y.; Bersini, H.; et al. Unlocking the potential of publicly available mi-croarray data using inSilicoDb and inSilicoMerging R/Bioconductor packages. BMC Bioinform. 2012, 13, 335. [Google Scholar] [CrossRef]
- Johnson, W.; Li, C.; Rabinovic, A. Adjusting batch effects in microarray expression data using empirical Bayes methods. Biostatistics 2006, 8, 118–127. [Google Scholar] [CrossRef]
- Mermel, C.H.; Schumacher, S.E.; Hill, B.; Meyerson, M.L.; Beroukhim, R.; Getz, G. GISTIC2.0 facilitates sensitive and confident localization of the targets of focal somatic copy-number alteration in human cancers. Genome Biol. 2011, 12, R41. [Google Scholar] [CrossRef]
- Wilkerson, M.D.; Hayes, D.N. ConsensusClusterPlus: A class discovery tool with confidence assessments and item tracking. Bioinformatics 2010, 26, 1572–1573. [Google Scholar] [CrossRef]
- Subramanian, A.; Tamayo, P.; Mootha, V.K.; Mukherjee, S.; Ebert, B.L.; Gillette, M.A.; Paulovich, A.; Pomeroy, S.L.; Golub, T.R.; Lander, E.S.; et al. Gene set enrichment analysis: A knowledge-based approach for interpreting genome-wide expression profiles. Proc. Natl. Acad. Sci. USA 2005, 102, 15545–15550. [Google Scholar] [CrossRef]
- Mootha, V.K.; Lindgren, C.M.; Eriksson, K.-F.; Subramanian, A.; Sihag, S.; Lehar, J.; Puigserver, P.; Carlsson, E.; Ridderstråle, M.; Laurila, E.; et al. PGC-1α-responsive genes involved in oxidative phosphorylation are coordinately downregulated in human diabetes. Nat. Genet. 2003, 34, 267–273. [Google Scholar] [CrossRef]
- Yoshihara, K.; Shahmoradgoli, M.; Martínez, E.; Vegesna, R.; Kim, H.; Torres-Garcia, W.; Trevino, V.; Shen, H.; Laird, P.W.; Levine, D.A.; et al. Inferring tumour purity and stromal and immune cell admixture from expression data. Nat. Commun. 2013, 4, 2612. [Google Scholar] [CrossRef] [PubMed]
- Newman, A.M.; Liu, C.L.; Green, M.R.; Gentles, A.J.; Feng, W.; Xu, Y.; Hoang, C.D.; Diehn, M.; Alizadeh, A.A. Robust enumeration of cell subsets from tissue expression profiles. Nat. Methods 2015, 12, 453–457. [Google Scholar] [CrossRef] [PubMed]
- Becht, E.; Giraldo, N.A.; Lacroix, L.; Buttard, B.; Elarouci, N.; Petitprez, F.; Selves, J.; Laurent-Puig, P.; Sautès-Fridman, C.; Fridman, W.H.; et al. Estimating the population abundance of tis-sue-infiltrating immune and stromal cell populations using gene expression. Genome Biol. 2016, 17, 218. [Google Scholar] [CrossRef] [PubMed]
- Zeng, D.; Ye, Z.; Shen, R.; Yu, G.; Wu, J.; Xiong, Y.; Zhou, R.; Qiu, W.; Huang, N.; Sun, L.; et al. IOBR: Multi-Omics Immuno-Oncology Biological Research to Decode Tumor Microenvironment and Signatures. Front. Immunol. 2021, 12, 687975. [Google Scholar] [CrossRef] [PubMed]
- Jiang, P.; Gu, S.; Pan, D.; Fu, J.; Sahu, A.; Hu, X.; Li, Z.; Traugh, N.; Bu, X.; Li, B.; et al. Signatures of T cell dysfunction and exclusion predict cancer immunotherapy response. Nat. Med. 2018, 24, 1550–1558. [Google Scholar] [CrossRef]
- Shen, W.; Song, Z.; Zhong, X.; Huang, M.; Shen, D.; Gao, P.; Qian, X.; Wang, M.; He, X.; Wang, T.; et al. Sangerbox: A comprehensive, interaction-friendly clinical bioinformatics analysis platform. iMeta 2022, 1, e36. [Google Scholar] [CrossRef]
- Bremnes, R.M.; Busund, L.T.; Kilvær, T.L.; Andersen, S.; Richardsen, E.; Paulsen, E.E.; Hald, S.; Khanehkenari, M.R.; Cooper, W.A.; Kao, S.C.; et al. The Role of Tumor-Infiltrating Lymphocytes in Development, Progression, and Prognosis of Non-Small Cell Lung Cancer. J. Thorac. Oncol. 2016, 11, 789–800. [Google Scholar] [CrossRef]
- Xu, X.; Li, J.; Zou, J.; Feng, X.; Zhang, C.; Zheng, R.; Duanmu, W.; Saha-Mandal, A.; Ming, Z.; Wang, E. Association of Germline Variants in Natural Killer Cells with Tumor Immune Microenvironment Subtypes, Tumor-Infiltrating Lymphocytes, Immunotherapy Response, Clinical Outcomes, and Cancer Risk. JAMA Netw. Open 2019, 2, e199292. [Google Scholar] [CrossRef]
- Paijens, S.T.; Vledder, A.; de Bruyn, M.; Nijman, H.W. Tumor-infiltrating lymphocytes in the immunotherapy era. Cell. Mol. Immunol. 2020, 18, 842–859. [Google Scholar] [CrossRef]
- Pagès, F.; Berger, A.; Camus, M.; Sanchez-Cabo, F.; Costes, A.; Molidor, R.; Mlecnik, B.; Kirilovsky, A.; Nilsson, M.; Damotte, D.; et al. Effector memory T cells, early metastasis, and survival in colorectal cancer. N. Engl. J. Med. 2005, 353, 2654–2666. [Google Scholar] [CrossRef]
- Wang, S.-S.; Liu, W.; Ly, D.; Xu, H.; Qu, L.; Zhang, L. Tumor-infiltrating B cells: Their role and application in anti-tumor immunity in lung cancer. Cell. Mol. Immunol. 2018, 16, 6–18. [Google Scholar] [CrossRef] [PubMed]
- Motz, G.T.; Santoro, S.P.; Wang, L.-P.; Garrabrant, T.; Lastra, R.R.; Hagemann, I.S.; Lal, P.; Feldman, M.D.; Benencia, F.; Coukos, G. Tumor endothelium FasL establishes a selective immune barrier promoting tolerance in tumors. Nat. Med. 2014, 20, 607–615. [Google Scholar] [CrossRef] [PubMed]
- Ribatti, D.; Solimando, A.; Pezzella, F. The Anti-VEGF(R) Drug Discovery Legacy: Improving Attrition Rates by Breaking the Vicious Cycle of Angiogenesis in Cancer. Cancers 2021, 13, 3433. [Google Scholar] [CrossRef] [PubMed]
- Vitale, I.; Sistigu, A.; Manic, G.; Rudqvist, N.-P.; Trajanoski, Z.; Galluzzi, L. Mutational and Antigenic Landscape in Tumor Progression and Cancer Immunotherapy. Trends Cell Biol. 2019, 29, 396–416. [Google Scholar] [CrossRef] [PubMed]
- Vousden, K.H.; Prives, C. P53 and prognosis: New insights and further complexity. Cell 2005, 120, 7–10. [Google Scholar]
- Mendiratta, G.; Ke, E.; Aziz, M.; Liarakos, D.; Tong, M.; Stites, E.C. Cancer gene mutation frequencies for the U.S. population. Nat. Commun. 2021, 12, 5961. [Google Scholar] [CrossRef]
- Wang, Z.; Sun, P.; Gao, C.; Chen, J.; Li, J.; Chen, Z.; Xu, M.; Shao, J.; Zhang, Y.; Xie, J. Down-regulation of LRP1B in colon cancer promoted the growth and mi-gration of cancer cells. Exp. Cell Res. 2017, 357, 1–8. [Google Scholar] [CrossRef]
- Koinuma, J.; Akiyama, H.; Fujita, M.; Hosokawa, M.; Tsuchiya, E.; Kondo, S.; Nakamura, Y.; Daigo, Y. Characterization of an Opa interacting protein 5 involved in lung and esophageal carcinogenesis. Cancer Sci. 2012, 103, 577–586. [Google Scholar] [CrossRef]
- Kalathil, D.; John, S.; Nair, A.S. FOXM1 and Cancer: Faulty Cellular Signaling Derails Homeostasis. Front. Oncol. 2021, 10, 626836. [Google Scholar] [CrossRef]
- Arceci, A.; Bonacci, T.; Wang, X.; Stewart, K.; Damrauer, J.S.; Hoadley, K.; Emanuele, M.J. FOXM1 Deubiquitination by USP21 Regulates Cell Cycle Progression and Paclitaxel Sensitivity in Basal-like Breast Cancer. Cell Rep. 2019, 26, 3076–3086.e6. [Google Scholar] [CrossRef]
- Tassi, R.A.; Todeschini, P.; Siegel, E.R.; Calza, S.; Cappella, P.; Ardighieri, L.; Cadei, M.; Bugatti, M.; Romani, C.; Bandiera, E.; et al. FOXM1 expression is significantly associated with chemotherapy resistance and adverse prognosis in non-serous epithelial ovarian cancer patients. J. Exp. Clin. Cancer Res. 2017, 36, 63. [Google Scholar] [CrossRef]
- Xia, L.; Huang, W.; Tian, D.; Zhu, H.; Zhang, Y.; Hu, H.; Fan, D.; Nie, Y.; Wu, K. Upregulated FoxM1 expression induced by hepatitis B virus X protein promotes tumor metastasis and indicates poor prognosis in hepatitis B virus-related hepatocellular carcinoma. J. Hepatol. 2012, 57, 600–612. [Google Scholar] [CrossRef]
- Liang, S.K.; Hsu, C.C.; Song, H.L.; Huang, Y.C.; Kuo, C.W.; Yao, X.; Li, C.C.; Yang, H.C.; Hung, Y.L.; Chao, S.Y.; et al. FOXM1 is required for small cell lung cancer tumorigenesis and associated with poor clinical prognosis. Oncogene 2021, 40, 4847–4858. [Google Scholar] [CrossRef]
- Drouin, M.; Saenz, J.; Chiffoleau, E. C-Type Lectin-Like Receptors: Head or Tail in Cell Death Immunity. Front. Immunol. 2020, 11, 251. [Google Scholar] [CrossRef]
- Ryan, E.J.; Magaletti, D.; Draves, K.E.; Clark, E.A. Ligation of dendritic cell–associated lectin–1 induces partial maturation of human monocyte derived dendritic cells. Hum. Immunol. 2009, 70, 1–5. [Google Scholar] [CrossRef][Green Version]
- Dunkelberger, J.R.; Song, W.C. Complement and its role in innate and adaptive immune responses. Cell Res. 2010, 20, 34–50. [Google Scholar] [CrossRef]
- Vaes, R.D.; Reynders, K.; Sprooten, J.; Nevola, K.T.; Rouschop, K.M.; Vooijs, M.; Garg, A.D.; Lambrecht, M.; Hendriks, L.E.; Rucevic, M.; et al. Identification of Potential Prognostic and Predictive Immunological Biomarkers in Patients with Stage I and Stage III Non-Small Cell Lung Cancer (NSCLC): A Prospective Exploratory Study. Cancers 2021, 13, 6259. [Google Scholar] [CrossRef]
- Errami, Y.; Naura, A.S.; Kim, H.; Ju, J.; Suzuki, Y.; El-Bahrawy, A.H.; Ghonim, M.A.; Hemeida, R.A.; Mansy, M.S.; Zhang, J.; et al. Apoptotic DNA Fragmentation May Be a Cooperative Activity between Caspase-activated Deoxyribonuclease and the Poly(ADP-ribose) Polymerase-regulated DNAS1L3, an Endoplasmic Reticulum-localized Endonuclease That Translocates to the Nucleus during Apoptosis. J. Biol. Chem. 2013, 288, 3460–3468. [Google Scholar] [CrossRef]
- Han, D.S.; Ni, M.; Chan, R.W.; Chan, V.W.; Lui, K.O.; Chiu, R.W.; Lo, Y.D. The Biology of Cell-free DNA Fragmentation and the Roles of DNASE1, DNASE1L3, and DFFB. Am. J. Hum. Genet. 2020, 106, 202–214. [Google Scholar] [CrossRef]
- Chen, J.; Ding, J.; Huang, W.; Sun, L.; Chen, J.; Liu, Y.; Zhan, Q.; Gao, G.; He, X.; Qiu, G.; et al. DNASE1L3 as a Novel Diagnostic and Prognostic Biomarker for Lung Adenocarcinoma Based on Data Mining. Front. Genet. 2021, 12, 699242. [Google Scholar] [CrossRef]
- Zhao, Y.; Zhou, H.; Ma, K.; Sun, J.; Feng, X.; Geng, J.; Gu, J.; Wang, W.; Zhang, H.; He, Y.; et al. Abnormal methylation of seven genes and their associations with clinical characteristics in early stage non-small cell lung cancer. Oncol. Lett. 2013, 5, 1211–1218. [Google Scholar] [CrossRef]
Publisher’s Note: MDPI stays neutral with regard to jurisdictional claims in published maps and institutional affiliations. |
© 2022 by the authors. Licensee MDPI, Basel, Switzerland. This article is an open access article distributed under the terms and conditions of the Creative Commons Attribution (CC BY) license (https://creativecommons.org/licenses/by/4.0/).

