
Reliability and Validity of Scoliosis Measurements Obtained with Surface Topography Techniques: A Systematic Review

Abstract
1. Introduction
2. Materials and Methods
2.1. Search Strategy
2.2. Eligibility Criteria
- Subjects were patients with idiopathic scoliosis;
- The analysis of the patient’s scoliosis was performed using the surface topography technique;
- The reliability and/or validity of the surface topography measurements was evaluated;
- The surface topographic and radiological data were compared in the validity evaluation.
- Subjects had a history of previous spinal surgery or other spinal diseases;
- Subjects with scoliosis of neuromuscular, degenerative or other diagnosable cause;
- Subjects received spinal surgery or other treatment (including spinal orthoses and exercise therapy, etc.) during the experiment;
- Repeatedly published or unavailable full-text literature.
2.3. Data Extraction
2.4. Quality Assessment
2.5. Data Analysis
3. Results
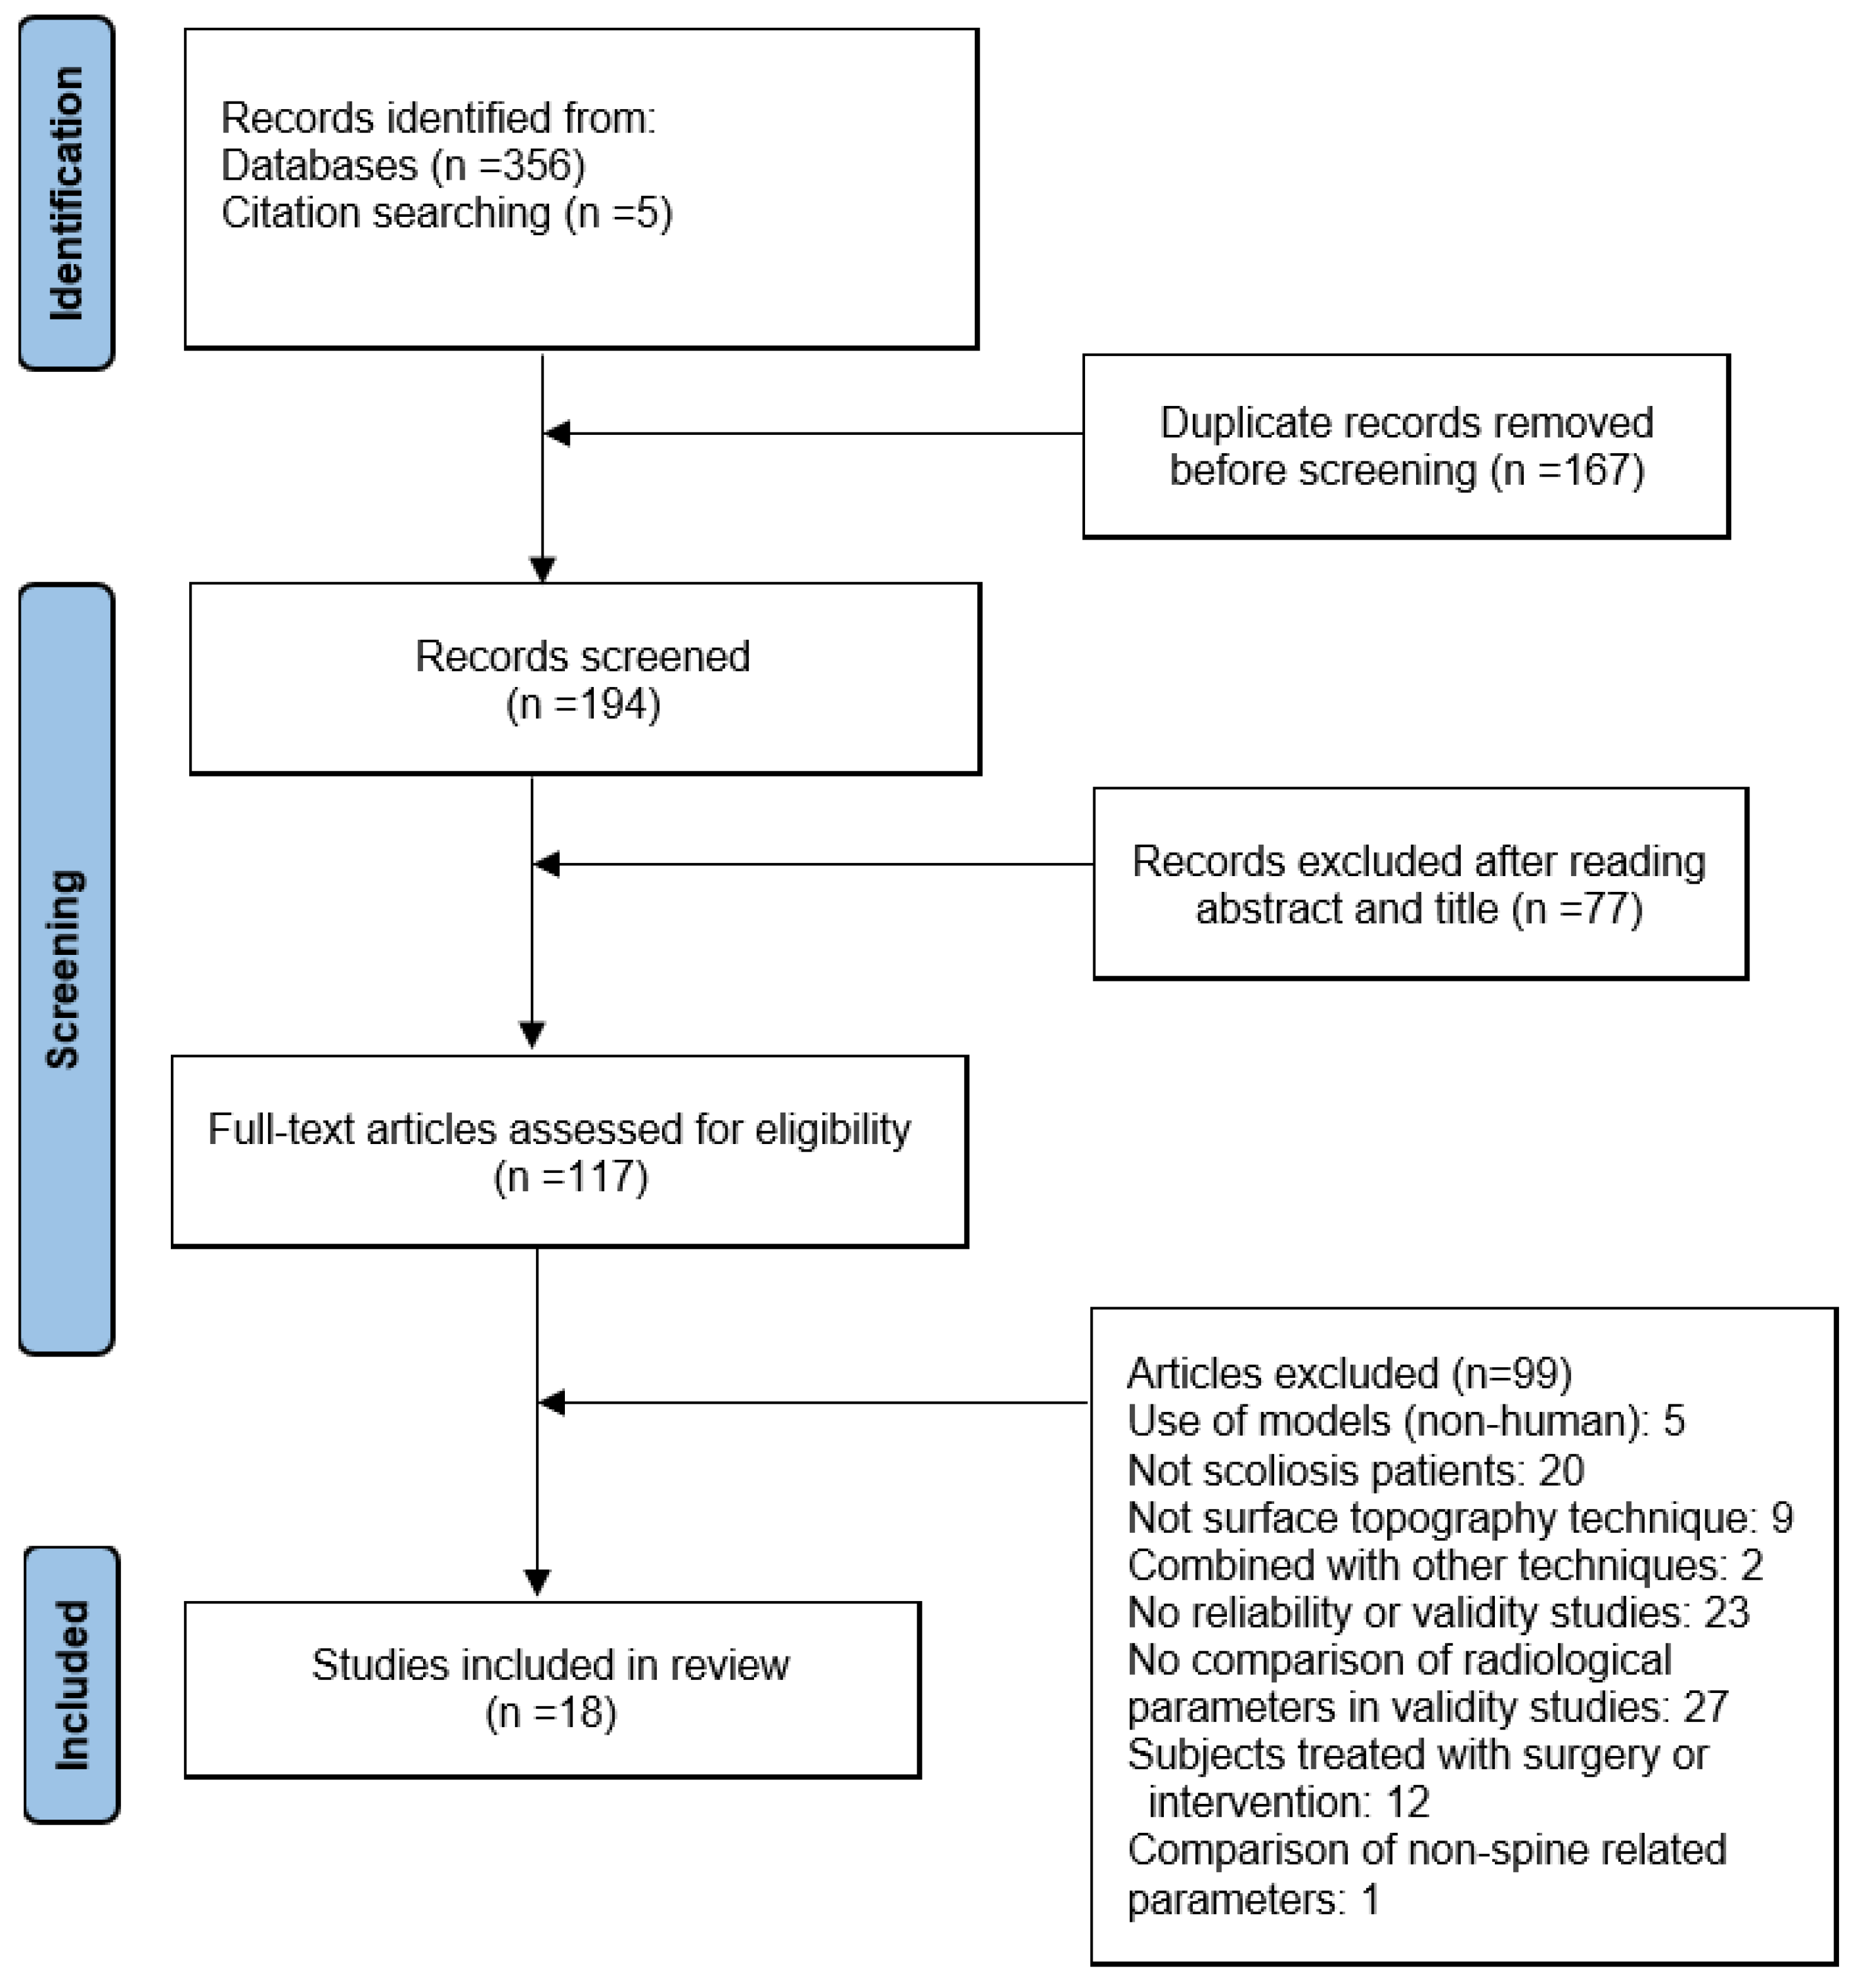
3.1. Articles Selection
3.2. Quality Assessment
3.3. Study Characteristics
3.3.1. The Surface Topography Systems
3.3.2. Participants
3.3.3. Data Acquisition
3.4. Reliability Results
3.4.1. Intra-Investigator Reliability Assessment Results
3.4.2. Inter-Investigator Reliability Assessment Results
3.5. Validity Results
4. Discussion
5. Conclusions
Author Contributions
Funding
Institutional Review Board Statement
Informed Consent Statement
Data Availability Statement
Conflicts of Interest
References
- El-Hawary, R.; Chukwunyerenwa, C. Update on evaluation and treatment of scoliosis. Pediatr. Clin. 2014, 61, 1223–1241. [Google Scholar] [CrossRef]
- Asher, M.A.; Burton, D.C. Adolescent idiopathic scoliosis: Natural history and long term treatment effects. Scoliosis 2006, 1, 2. [Google Scholar] [CrossRef] [PubMed]
- Grossman, D.C.; Curry, S.J.; Owens, D.K.; Barry, M.J.; Davidson, K.W.; Doubeni, C.A.; Epling, J.W.; Kemper, A.R.; Krist, A.H.; Kurth, A.E. Screening for adolescent idiopathic scoliosis: US preventive services task force recommendation statement. JAMA 2018, 319, 165–172. [Google Scholar]
- Baird, C.; Gardner, A. A report of the number of adolescents screened as warranting further investigation for depression and social anxiety in a pre-operative cohort with idiopathic scoliosis. Surg. J. R. Coll. Surg. Edinb. Irel. 2021, 19, 263–267. [Google Scholar] [CrossRef] [PubMed]
- Chang, W.P.; Lin, Y.L.; Huang, H.L.; Lu, H.F.; Wang, S.T.; Chi, Y.C.; Hung, K.S.; Chen, H.Y. Scoliosis and the Subsequent Risk of Depression A Nationwide Population-based Cohort Study in Taiwan. Spine 2016, 41, 253–258. [Google Scholar] [CrossRef] [PubMed]
- Amaricai, E.; Suciu, O.; Onofrei, R.R.; Miclaus, R.S.; Iacob, R.E.; Catan, L.; Popoiu, C.M.; Cerbu, S.; Boia, E. Respiratory function, functional capacity, and physical activity behaviours in children and adolescents with scoliosis. J. Int. Med. Res. 2020, 48, 300060519895093. [Google Scholar] [CrossRef]
- Ramirez, N.; Johnston, C.E.; Browne, R.H. The prevalence of back pain in children who have idiopathic scoliosis. J. Bone Jt. Surg. Am. Vol. 1997, 79A, 364–368. [Google Scholar] [CrossRef]
- Mohammadi, P.; Akbari, M.; Sarrafzadeh, J.; Moradi, Z. Comparison of respiratory muscles activity and exercise capacity in patients with idiopathic scoliosis and healthy individuals. Physiother. Theory Pract. 2014, 30, 552–556. [Google Scholar] [CrossRef]
- Rao, P.S.; Gregg, E.C. A Revised Estimate of the Risk of Carcinogenesis from X-Rays To Scoliosis Patients. Investig. Radiol. 1984, 19, 58–60. [Google Scholar] [CrossRef]
- Don, S. Radiosensitivity of children: Potential for overexposure in CR and DR and magnitude of doses in ordinary radiographic examinations. Pediatr. Radiol. 2004, 34, S167–S172. [Google Scholar] [CrossRef]
- Doody, M.M.; Lonstein, J.E.; Stovall, M.; Hacker, D.G.; Luckyanov, N.; Land, C.E.; Collaborators, U.S.C.S. Breast cancer mortality after diagnostic radiography: Findings from the US Scoliosis Cohort Study. Spine 2000, 25, 2052–2063. [Google Scholar] [CrossRef] [PubMed]
- Adam, C.J.; Izatt, M.T.; Harvey, J.R.; Askin, G.N. Variability in Cobb angle measurements using reformatted computerized tomography scans. Spine 2005, 30, 1664–1669. [Google Scholar] [CrossRef] [PubMed]
- Lee, C.S.; Hwang, C.J.; Jung, H.S.; Lee, D.H.; Park, J.W.; Cho, J.H.; Yang, J.J.; Park, S. Association Between Vertebral Rotation Pattern and Curve Morphology in Adolescent Idiopathic Scoliosis. World Neurosurg. 2020, 143, E243–E252. [Google Scholar] [CrossRef] [PubMed]
- Xiao, B.; Zhang, Y.B.; Yan, K.; Jiang, J.L.; Ma, C.Y.; Xing, Y.G.; Liu, B.; Tian, W. Where should Scoliometer and EOS Imaging be Applied when Evaluating Spinal Rotation in Adolescent Idiopathic Scoliosis-A Preliminary Study with Reference to CT Images. Glob. Spine J. 2022, in press. [Google Scholar] [CrossRef] [PubMed]
- Jiang, W.W.; Chen, X.T.; Yu, C.H. A real-time freehand 3D ultrasound imaging method for scoliosis assessment. J. Appl. Clin. Med. Phys. 2022, 23, e13709. [Google Scholar] [CrossRef] [PubMed]
- Lai, K.K.L.; Lee, T.T.Y.; Lee, M.K.S.; Hui, J.C.H.; Zheng, Y.P. Validation of Scolioscan Air-Portable Radiation-Free Three-Dimensional Ultrasound Imaging Assessment System for Scoliosis. Sensors 2021, 21, 2858. [Google Scholar] [CrossRef]
- Pang, H.; Wong, Y.S.; Yip, B.H.K.; Hung, A.L.H.; Chu, W.C.W.; Lai, K.K.L.; Zheng, Y.P.; Chung, T.W.H.; Sharma, G.; Cheng, J.C.Y.; et al. Using Ultrasound To Screen for Scoliosis To Reduce Unnecessary Radiographic Radiation: A Prospective Diagnostic Accuracy Study on 442 Schoolchildren. Ultrasound Med. Biol. 2021, 47, 2598–2607. [Google Scholar] [CrossRef]
- Zhang, J.H.; Li, H.J.; Yu, B. Three-Dimensional Assessment of Scoliosis Based on Ultrasound Data. In Proceedings of the Eighth International Conference on Machine Vision (Icmv 2015), Barcelona, Spain, 19–20 November 2015; Volume 9875. [Google Scholar] [CrossRef]
- Roy, S.; Grunwald, A.T.D.; Alves-Pinto, A.; Maier, R.; Cremers, D.; Pfeiffer, D.; Lampe, R. A Noninvasive 3D Body Scanner and Software Tool towards Analysis of Scoliosis. Biomed Res. Int. 2019, 2019, 4715720. [Google Scholar] [CrossRef]
- Bolzinger, M.; Bernardini, I.; Thevenin Lemoine, C.; Gallini, A.; Accadbled, F.; Sales de Gauzy, J. Monitoring adolescent idiopathic scoliosis by measuring ribs prominence using surface topography device. Spine Deform. 2021, 9, 1349–1354. [Google Scholar] [CrossRef]
- Yildirim, Y.; Tombak, K.; Karasin, S.; Yuksel, I.; Nur, A.H.; Ozsoy, U. Assessment of the reliability of hand-held surface scanner in the evaluation of adolescent idiopathic scoliosis. Eur. Spine J. 2021, 30, 1872–1880. [Google Scholar] [CrossRef]
- Liu, X.; Thometz, J.; Tassone, J.; Paulsen, L.; Lyon, R. Historical review and experience with the use of surface topographic systems in children with idiopathic scoliosis. ISIS 2013, 2, 9. [Google Scholar]
- Page, M.J.; McKenzie, J.E.; Bossuyt, P.M.; Boutron, I.; Hoffmann, T.C.; Mulrow, C.D.; Shamseer, L.; Tetzlaff, J.M.; Akl, E.A.; Brennan, S.E.; et al. The PRISMA 2020 statement: An updated guideline for reporting systematic reviews. Syst. Rev. 2021, 10, n71. [Google Scholar] [CrossRef] [PubMed]
- Brink, Y.; Louw, Q.A. Clinical instruments: Reliability and validity critical appraisal. J. Eval. Clin. Pract. 2012, 18, 1126–1132. [Google Scholar] [CrossRef] [PubMed]
- Barrett, E.; McCreesh, K.; Lewis, J. Reliability and validity of non-radiographic methods of thoracic kyphosis measurement: A systematic review. Man. Ther. 2014, 19, 10–17. [Google Scholar] [CrossRef] [PubMed]
- Keogh, J.W.; Cox, A.; Anderson, S.; Liew, B.; Olsen, A.; Schram, B.; Furness, J. Reliability and validity of clinically accessible smartphone applications to measure joint range of motion: A systematic review. PLoS ONE 2019, 14, e0215806. [Google Scholar] [CrossRef]
- Schrama, P.P.; Stenneberg, M.S.; Lucas, C.; Van Trijffel, E. Intraexaminer reliability of hand-held dynamometry in the upper extremity: A systematic review. Arch. Phys. Med. Rehabil. 2014, 95, 2444–2469. [Google Scholar] [CrossRef]
- Bellet, R.N.; Adams, L.; Morris, N.R. The 6-minute walk test in outpatient cardiac rehabilitation: Validity, reliability and responsiveness—a systematic review. Physiotherapy 2012, 98, 277–286. [Google Scholar] [CrossRef]
- Van Tulder, M.; Furlan, A.; Bombardier, C.; Bouter, L.; Editorial Board of the Cochrane Collaboration Back Review Group. Updated method guidelines for systematic reviews in the cochrane collaboration back review group. Spine 2003, 28, 1290–1299. [Google Scholar] [CrossRef]
- Koo, T.K.; Li, M.Y. A guideline of selecting and reporting intraclass correlation coefficients for reliability research. J. Chiropr. Med. 2016, 15, 155–163. [Google Scholar] [CrossRef]
- Madelin, G.; Babb, J.; Xia, D.; Regatte, R.R. Repeatability of quantitative sodium magnetic resonance imaging for estimating pseudo-intracellular sodium concentration and pseudo-extracellular volume fraction in brain at 3 T. PLoS ONE 2015, 10, e0118692. [Google Scholar] [CrossRef]
- Tabard-Fougere, A.; Bonnefoy-Mazure, A.; Hanquinet, S.; Lascombes, P.; Armand, S.; Dayer, R. Validity and Reliability of Spine Rasterstereography in Patients With Adolescent Idiopathic Scoliosis. Spine 2017, 42, 98–105. [Google Scholar] [CrossRef] [PubMed]
- de Sèze, M.; Randriaminahisoa, T.; Gaunelle, A.; de Korvin, G.; Mazaux, J.M. Inter-observer reproducibility of back surface topography parameters allowing assessment of scoliotic thoracic gibbosity and comparison with two standard postures. Ann. Phys. Rehabil. Med. 2013, 56, 599–612. [Google Scholar] [CrossRef] [PubMed]
- Frerich, J.M.; Hertzler, K.; Knott, P.; Mardjetko, S. Comparison of radiographic and surface topography measurements in adolescents with idiopathic scoliosis. Open Orthop. J. 2012, 6, 261–265. [Google Scholar] [CrossRef] [PubMed]
- Goldberg, C.J.; Kaliszer, M.; Moore, D.P.; Fogarty, E.E.; Dowling, F.E. Surface topography, Cobb angles, and cosmetic change in scoliosis. Spine 2001, 26, E55–E63. [Google Scholar] [CrossRef]
- Gonzalez-Ruiz, J.M.; Perez-Nunez, M.I.; Garcia-Alfaro, M.D.; Bastir, M. Geometric morphometrics of adolescent idiopathic scoliosis: A prospective observational study. Eur. Spine J. 2021, 30, 612–619. [Google Scholar] [CrossRef]
- Gorton, G.E.; Young, M.L.; Masso, P.D. Accuracy, Reliability, and Validity of a 3-Dimensional Scanner for Assessing Torso Shape in Idiopathic Scoliosis. Spine 2012, 37, 957–965. [Google Scholar] [CrossRef]
- Knott, P.; Sturm, P.; Lonner, B.; Cahill, P.; Betsch, M.; McCarthy, R.; Kelly, M.; Lenke, L.; Betz, R. Multicenter Comparison of 3D Spinal Measurements Using Surface Topography With Those From Conventional Radiography. Spine Deform. 2016, 4, 98–103. [Google Scholar] [CrossRef]
- Sudo, H.; Kokabu, T.; Abe, Y.; Iwata, A.; Yamada, K.; Ito, Y.M.; Iwasaki, N.; Kanai, S. Automated noninvasive detection of idiopathic scoliosis in children and adolescents: A principle validation study. Sci. Rep. 2018, 8, 17714. [Google Scholar] [CrossRef]
- Kokabu, T.; Kawakami, N.; Uno, K.; Kotani, T.; Suzuki, T.; Abe, Y.; Maeda, K.; Inage, F.; Ito, Y.M.; Iwasaki, N.; et al. Three-dimensional depth sensor imaging to identify adolescent idiopathic scoliosis: A prospective multicenter cohort study. Sci. Rep. 2019, 9, 9678. [Google Scholar] [CrossRef]
- Manca, A.; Monticone, M.; Cugusi, L.; Doria, C.; Tranquilli-Leali, P.; Deriu, F. Back surface measurements by rasterstereography for adolescent idiopathic scoliosis: From reproducibility to data reduction analyses. Eur. Spine J. 2018, 27, 2130–2138. [Google Scholar] [CrossRef]
- Mínguez, M.F.; Buendía, M.; Cibrián, R.M.; Salvador, R.; Laguía, M.; Martín, A.; Gomar, F. Quantifier variables of the back surface deformity obtained with a noninvasive structured light method: Evaluation of their usefulness in idiopathic scoliosis diagnosis. Eur. Spine J. 2007, 16, 73–82. [Google Scholar] [CrossRef] [PubMed]
- Mangone, M.; Raimondi, P.; Paoloni, M.; Pellanera, S.; Di Michele, A.; Di Renzo, S.; Vanadia, M.; Dimaggio, M.; Murgia, M.; Santilli, V. Vertebral rotation in adolescent idiopathic scoliosis calculated by radiograph and back surface analysis-based methods: Correlation between the Raimondi method and rasterstereography. Eur. Spine J. 2013, 22, 367–371. [Google Scholar] [CrossRef] [PubMed]
- Pazos, V.; Cheriet, F.; Danserau, J.; Ronsky, J.; Zernicke, R.F.; Labelle, H. Reliability of trunk shape measurements based on 3-D surface reconstructions. Eur. Spine J. 2007, 16, 1882–1891. [Google Scholar] [CrossRef] [PubMed]
- Pino-Almero, L.; Minguez-Rey, M.F.; de Anda, R.; Salvador-Palmer, M.R.; Sentamans-Segarra, S. Correlation between Topographic Parameters Obtained by Back Surface Topography Based on Structured Light and Radiographic Variables in the Assessment of Back Morphology in Young Patients with Idiopathic Scoliosis. Asian Spine J. 2017, 11, 219–229. [Google Scholar] [CrossRef]
- Pino-Almero, L.; Mínguez-Rey, M.F.; Sentamans-Segarra, S.; Salvador-Palmer, M.R.; Anda, R.M.C.-O.d.; La O., J.L.-d. Quantification of topographic changes in the surface of back of young patients monitored for idiopathic scoliosis: Correlation with radiographic variables. J. Biomed. Opt. 2016, 21, 116001. [Google Scholar] [CrossRef] [PubMed]
- Tabard-Fougère, A.; Bonnefoy-Mazure, A.; Dhouib, A.; Valaikaite, R.; Armand, S.; Dayer, R. Radiation-free measurement tools to evaluate sagittal parameters in AIS patients: A reliability and validity study. Eur. Spine J. Off. Publ. Eur. Spine Soc. Eur. Spinal Deform. Soc. Eur. Sect. Cerv. Spine Res. Soc. 2019, 28, 536–543. [Google Scholar] [CrossRef]
- Applebaum, A.; Cho, W.; Nessim, A.; Kim, K.; Tarpada, S.P.; Yoon, S.H.; Pujar, B.; Kim, D.; Kim, S.Y. Establishing the validity of surface topography for assessment of scoliosis: A prospective study. Spine Deform. 2021, 9, 685–689. [Google Scholar] [CrossRef]
- Liu, X.-C.; Tassone, J.C.; Thometz, J.G.; Paulsen, L.C.; Lyon, R.M.; Marquez-Barrientos, C.; Tarima, S.; Johnson, P.R. Development of a 3-Dimensional Back Contour Imaging System for Monitoring Scoliosis Progression in Children. Spine Deform. 2013, 1, 102–107. [Google Scholar] [CrossRef]
- Holcombe, S.A.; Wang, S.C. Subcutaneous fat distribution in the human torso. In Proceedings of the IRCOBI Conference, Berlin, Germany, 10–12 September 2014. [Google Scholar]
- Parenteau, C.S.; Zhang, P.; Holcombe, S.; Kohoyda-Inglis, C.; Wang, S.C. Analysis of morphomics parameters by gender and BMI groups: Thorax shape and H-point location. In Proceedings of the IRCOBI Conference, Gothenburg, Sweden, 11–13 September 2013; pp. 11–13. [Google Scholar]
- Asamoah, V.; Mellerowicz, H.; Venus, J.; Klockner, C. The effectiveness of diagnostic procedures of spinal diseases. Surface analysis of the back. Orthopade 2000, 29, 480–489. [Google Scholar] [CrossRef]
- Negrini, S.; Grivas, T.B.; Kotwicki, T.; Maruyama, T.; Rigo, M.; Weiss, H.R. Why do we treat adolescent idiopathic scoliosis? What we want to obtain and to avoid for our patients. SOSORT 2005 Consensus paper. Scoliosis Spinal Disord. 2006, 1, 4. [Google Scholar] [CrossRef]
- James, J.I.P. Idiopathic scoliosis: The prognosis, diagnosis, and operative indications related to curve patterns and the age at onset. J. Bone Jt. Surg. Br. Vol. 1954, 36, 36–49. [Google Scholar] [CrossRef] [PubMed]
- Thulbourne, T.; Gillespie, R. The rib hump in idiopathic scoliosis. Measurement, analysis and response to treatment. J. Bone Jt. Surg. Br. Vol. 1976, 58, 64–71. [Google Scholar] [CrossRef] [PubMed]
- Zaina, F.; Negrini, S.; Atanasio, S. TRACE (Trunk Aesthetic Clinical Evaluation), a routine clinical tool to evaluate aesthetics in scoliosis patients: Development from the Aesthetic Index (AI) and repeatability. Scoliosis 2009, 4, 3. [Google Scholar] [CrossRef] [PubMed]
- Patias, P.; Grivas, T.B.; Kaspiris, A.; Aggouris, C.; Drakoutos, E. A review of the trunk surface metrics used as Scoliosis and other deformities evaluation indices. Scoliosis Spinal Disord. 2010, 5, 12. [Google Scholar] [CrossRef]


| #1 | “Scoliosis” [MeSH] OR scoliosis OR scolioses OR “adolescent idiopathic scoliosis” OR “idiopathic scoliosis” OR “spinal curvature” |
| #2 | “rasterstereography” OR “rasterstereographic” OR “surface topography” OR “stereophotogrammetry” OR “Moire topography” [MeSH] |
| #3 | “Reproducibility of Results”[MeSH] OR “validity” OR “reliability” OR “validation” OR “accuracy” OR “validate” |
| #4 | #1 AND #2 AND #3 |
| Strong | Consistent findings among ≥ three high-quality studies |
| Moderate | Consistent findings among ≥ one high-quality study and ≥ one low-quality study |
| Limited | Findings from ≥ one low-quality study or only from one study (high- or low-quality) |
| Conflicting | Inconsistent findings among ≥ two studies (high- or low-quality) |
| ICC Value | CV Value | Reliability Level | r-Value | Correlation Level |
|---|---|---|---|---|
| >0.9 | ≤10% | excellent | >0.8 | Strong |
| 0.75–0.9 | 10–20% | good | 0.6–0.8 | Good |
| 0.5–0.75 | 20–30% | moderate | 0.3–0.6 | Moderate |
| <0.5 | >30% | poor | <0.3 | Poor |
| 1 | 2 | 3 | 4 | 5 | 6 | 7 | 8 | 9 | 10 | 11 | 12 | 13 | HQ | |
|---|---|---|---|---|---|---|---|---|---|---|---|---|---|---|
| Tabard-Fougere, A. et al. [32] | N | N | Y | N | Y | Y | Y | Y | Y | N | Y | Y | Y | √ |
| Bolzinger M. et al. [20] | Y | N | n/a | Y | n/a | N | n/a | N | n/a | N | n/a | Y | N | × |
| de Sèze M. et al. [33] | N | N | n/a | Y | n/a | N | n/a | N | n/a | N | n/a | Y | Y | × |
| Frerich J. M. et al. [34] | Y | N | Y | n/a | n/a | n/a | Y | Y | Y | Y | Y | Y | Y | √ |
| Goldberg C. J. et al. [35] | Y | N | Y | n/a | n/a | n/a | Y | n/a | Y | Y | Y | Y | Y | √ |
| Gonzalez-Ruiz J. M. et al. [36] | Y | N | Y | n/a | n/a | n/a | N | n/a | Y | Y | Y | Y | Y | √ |
| Gorton G. E. et al. [37] | Y | N | Y | n/a | N | N | N | Y | Y | Y | Y | Y | Y | √ |
| Knott P. et al. [38] | Y | N | Y | n/a | N | n/a | Y | Y | Y | Y | Y | Y | N | √ |
| Sudo H. et al. [39] | Y | N | Y | n/a | N | N | N | Y | Y | Y | N | Y | N | × |
| Kokabu T. et al. [40] | Y | Y | Y | n/a | n/a | n/a | N | n/a | Y | Y | Y | Y | Y | √ |
| Manca, A. et al. [41] | Y | N | n/a | n/a | N | N | n/a | Y | n/a | Y | n/a | Y | Y | √ |
| Mínguez M. F. et al. [42] | Y | Y | Y | Y | N | N | N | Y | Y | Y | N | Y | N | √ |
| Mangone, M. et al. [43] | Y | N | Y | n/a | n/a | n/a | Y | n/a | Y | Y | Y | Y | Y | √ |
| Pazos V. et al. [44] | N | N | n/a | n/a | N | N | n/a | Y | n/a | Y | n/a | N | Y | × |
| Pino-Almero L. et al. [45] | Y | N | Y | n/a | n/a | n/a | N | n/a | Y | Y | Y | Y | Y | √ |
| Pino-Almero L. et al. [46] | Y | Y | Y | N | N | N | N | N | Y | Y | Y | Y | Y | √ |
| Yıldırım Y. et al. [21] | Y | N | Y | n/a | n/a | n/a | N | n/a | Y | Y | Y | N | Y | √ |
| Tabard-Fougere, A. et al. [47] | Y | N | Y | n/a | N | N | Y | Y | Y | Y | Y | Y | Y | √ |
| Study | Participant Information | ST System | Acquisition Protocol | ||||
|---|---|---|---|---|---|---|---|
| Number and Sex | Age | Degree and Type of Scoliosis | |||||
| 1 | Tabard-Fougere, A. et al. [32] | 35 (22 females and 13 males) | 13.1 ± 2.0 years | Not mentioned | Formetric 4D (Diers International GmbH; Schlangenbad, Germany) | Each patient received a postero-anterior biplanar radiography and ST scans; Three repeated ST scans by two different operators (OP1 and OP2) on the same day, three more ST scans by the first operator (OP1) 1 week later; Subjects stood with their fists on their clavicles, elbow flexed, and the head looking forward; Manual marking of anatomical landmarks; Back-only scanning | |
| 2 | Bolzinger M. et al. [20] | 123 (111 females and 12 males) | 10–13 | Cobb angles: 10–40°; Type: 70 single curve (24 thoracic, 18 thoraco-lumbar, 28 lumbar), 53 double curve (double thoracic or thoracic-lumbar) | BIOMOD®L (AXS MEDICAL, Merignac, France) | Each patient received three acquisitions at 6-month intervals; Each acquisition consists of two ST scans (performed by two operators separately); Acquisition posture and Scan-Scan interval not specified; Automatic measurement and calculation; Back-only scanning | |
| 3 | de Sèze M. et al. [33] | 46 (40 females and 6 males) | / | Cobb angles: 26.8 ± 10°; Type: 9 single curve, 36 double curve, 1 triple curve | BIOMOD®L (AXS MEDICAL, Merignac, France) | Each patient received two acquisition series (performed by two operators separately); Each acquisition involved a preparation stage and three ST scans in three different positions (Backward standing with different arm positions); Scan-Scan interval not specified; Manual marking of anatomical landmarks; Back-only scanning | |
| 4 | Frerich J. M. et al. [34] | RE | 14 females | 16–25 | Cobb angles: 9 participants <10°, 5 participants 15–40°; Type: Not mentioned | Formetric (Diers Medical Systems, Chicago, IL, USA) | Each participant received thirty ST scans in a 60-min time period (subjects stood in their normal, comfortable posture); Automatic measurement and calculation; Back-only scanning |
| VA | 64 (55 females and 9 males) | 9–17 | Cobb angles: 10–50°; Type: Not mentioned | Each patient received a standard postero-anterior radiograph and thirty ST scans in a 60-min time period (subjects stood in their normal, comfortable posture); Automatic measurement and calculation | |||
| 5 | Goldberg C. J. et al. [35] | 155 (132 females and 23 males) | 2.67–20.58 | Cobb angles: 41.16 ± 22°; Type: Not mentioned | Quantec (Quantec Image Processing, Warrington, Cheshire, UK) | Each subject received one spine radiograph and four ST scans; Subjects stood free in a customized frame, with feet separated by a standard wooden block; Scan-Scan interval not specified; Manual marking of anatomical landmarks; Back-only scanning | |
| 6 | Gonzalez-Ruiz J. M. et al. [36] | 21 | <18 | Cobb angles: 23.53 ± 9°; Type: Not mentioned | Self-designed system (Artec Eva MHT scanner, Viewbox 4.0 software) | Each subject received surface scan; Subjects used a standardized standing position with the arms raised and slightly flexed behind the head; Manual marking of anatomical landmarks; Full-torso scanning | |
| 7 | Gorton G. E. et al. [37] | 36 (26 females and 10 males) | 10.8–17.7 | Cobb angles: 49–108° Type: Not mentioned | Vitus Smart 3D Body Scanner (Vitronic, Wiesbaden, Germany) | Each subject received one spine radiograph and three ST scans; Subjects stood on a platform within a 1.6 × 1.8-m measurement volume, with hands at the side and arms slightly abducted; Scans were consecutive; Automatic measurement and calculation; Full-torso scanning | |
| 8 | Knott P. et al. [38] | 193 (148 females and 45 males) | 8–18 | thoracic average 22.7 ± 10°; lumbar average 19.6 ± 9°; kyphosis magnitude 54.0 ± 11° | Formetric (Diers Medical Systems, Chicago, IL, USA) | Each subject received standing postero-anterior and lateral radiograph and three ST scans; The ST scan was obtained three times within a 5-min period; Subjects stood in an upright position in front of the ST scanner; External markers are placed for obese patients; Back-only scanning | |
| 9 | Sudo H. et al. [39] | 76 | 7–18 | Cobb angles: 0–64° Type: 59 single curve (33 thoracic, 17 thoraco-lumbar/lumbar), 19 double curve (thoracic and thoraco-lumbar/lumbar) | Self-designed system: A 3D depth sensor (Xtion Pro Live, ASUSTeK Computer Inc. Taipei, Republic of China), a computer | Forty-six subjects received one ST scan, thirty subjects received two ST scans with repositioning; Subjects bent forward below the sensor; Automatic measurement and calculation; Scan-Scan interval not specified; Back-only scanning | |
| 10 | Kokabu T. et al. [40] | 170 (149 females and 21 males) | 8–18 | Cobb angles: 0–60.7° Type: 119 single curve (70 thoracic, 49 thoraco-lumbar/lumbar), 47 double curve (thoracic and thoraco-lumbar/lumbar) | Self-designed system: A 3D depth sensor (Xtion Pro Live, ASUSTeK Computer Inc. Taipei, Republic of China), a computer | Each subject received one ST scan; Subjects bent forward below the sensor; Automatic measurement and calculation; back-only scanning | |
| 11 | Manca, A. et al. [41] | 66(53 females and 13 males) | 10–17 | Cobb angles: 22.9 ± 10.8° Type: 52 single curve (17 thoracic, 24 thoraco-lumbar, 11 lumbar), 14 double curve (thoracic and lumbar) | Formetric (Diers Medical Systems, Chicago, IL, USA) | Each subject received three ST scans; The assessment was repeated on the same day; Scan-Scan interval is 15 min (Retest 1) and 1 week (Retest 2); Subjects stood backward in free bipedal, heels placed at the end of the platform; Automatic measurement and calculation; Back-only scanning | |
| 12 | Mínguez M. F. et al. [42] | 30 (22 females and 8 males) | average: 14.88 | Cobb angles: ≥10° Type: Not mentioned | Self-designed system: Screen, camera, computer, projector | Each subject received ST scan; twenty subjects received ST scans with repositioning; Subjects stood backward and arms straight down and facing straight ahead in a natural position; Manual marking of anatomical landmarks; No indication of when the X-rays were obtained; Back-only scanning | |
| 13 | Mangone, M. et al. [43] | 25 patients (14 females and 9 males) | 14 ± 3 | Cobb angles: 30 ± 9° Type: Not mentioned | Formetric 4D (Diers International GmbH, Schlangenbad, Germany) | Each subject received X-ray and ST scan; Scan-Scan interval not specified; Automatic measurement and calculation; Back-only scanning | |
| 14 | Pazos V.et al. [44] | 49 (42 females and 7 males) | 11.0–19.7 | Not mentioned | InSpeck system (InSpeck Inc., Montreal, Canada) | Each subject received four ST scans (two ST scans in two different arm postures); Subjects stood in the center of the system with the arms in slight abduction with the side or the elbows extending forward, hands on the side of the neck; Manual marking of anatomical landmarks; Half-min interval between two postures; Full-torso scanning | |
| 15 | Pino-Almero L. et al. [45] | 88 (76 females and 12 males) | 7–17 | Cobb angles: 10–51.80° Type: 39 single curve (8 thoracic, 17 thoraco-lumbar, 14 lumbar), 49 double curve (thoracic and lumbar) | Self-designed system (A mobile white screen, a projector, a digital camera, a computer with image recognition software) | Each subject received standard radiographies of the full spine and ST scan; Subjects stood backward with arms relaxed at the sides; Manual marking of anatomical landmarks; Back-only scanning | |
| 16 | Pino-Almero L. et al. [46] | 31 (27 females and 4 males) | 7–17 | Cobb angles: 13.10–35.00° Type: 39 single curve (8 thoracic, 17 thoraco-lumbar, 14 lumbar), 49 double curve (thoracic and lumbar) | Self-designed system (A mobile white screen, a projector EPSON, a digital camera Canon, and a computer with the program) | Each subject received two acquisitions at 6-month intervals; Each acquisition consists of two ST scans (performed by two operators separately) and a standard radiography of the entire spine; Subjects stood backward with arms hanging at the sides; Manual marking of anatomical landmarks; Scan-Scan interval not specified; Back-only scanning | |
| 17 | Yıldırım Y. et al. [21] | 42 (32 females and 10 males) | 10–20 | Cobb angles: Not mentionedType: Double curve (right convexity of thoracic and left convexity of lumbar) | A hand-held 3D scanner device (Artec EVA, Artec Group 2013, Luxembourg) | Each subject received ST scan in three different body positions (standing position with the arms hanging at the sides, standing position with the arms extended forward in a bending position); Manual marking of anatomical landmarks; Back-only scanning | |
| 18 | Tabard-Fougere, A. et al. [47] | 51 (32 females and 19 males) | 13.5 ± 2.0 years | Cobb angles: 22.9 ± 17.4° Type: Not mentioned | Formetric 4D (Diers International GmbH, Schlangenbad, Ger-many) | Each subject received biplanar radiography and ST scan on the same day; Subjects stood with their fists on their clavicles, elbow flexed, and the head facing forward; Manual marking of anatomical landmarks; Back-only scanning | |
| Study | Type | Indicator | ST Measurements and Outcomes | |
|---|---|---|---|---|
| 1 | Tabard-Fougere, A. et al. [32] | Intra | same day: ICC [1, 1] | [FM] SA (17.4 ± 7.1) 1: good (0.70); PO (3.0 ± 2.0): poor (0.50); [SM] TL (405.9 ± 36.6): excellent (0.97); TK (38.4 ± 11.0): excellent (0.94); LL (37.2 ± 9.7): good (0.86); [HM] VO_rms (5.6 ± 2.8): excellent (0.91); VO_max (10.0 ± 4.6): good (0.85); VO_amp (12.3 ± 6.4): good (0.88) |
| 1 week later: ICC [1, 3], SEM, SDC | [FM] SA (18.7 ± 5.5): moderate (0.72, 5.2, 4.4); PO (3.8 ± 3.4): poor (0.27, 3.7, 10.4); [SM] TL (406.6 ± 43.4): excellent (0.95, 13.1, 36.2); TK (34.8 ± 11.8): good (0.85, 6.1, 17.1); LL (35.6 ± 11.2): excellent (0.93, 3.8, 10.6); [HM] VO_rms (5.6 ± 2.6): good (0.88, 1.4, 3.9); VO_max (10.0 ± 4.4): excellent (0.90, 2.1, 5.9); VO_amp (12.8 ± 5.6): excellent (0.92, 2.8, 7.6) | |||
| Inter | ICC [3, 3], SEM, SDC | [FM] SA (16.6 ± 5.9): good (0.84, 4.8, 3.4); PO (4.5 ± 3.6): poor (0.46, 3.4, 9.4); [SM] TL: excellent (0.96, 13.2, 36.6); TK: excellent (0.92, 6.1, 16.8); LL: excellent (0.94, 4.6, 12.7); [HM] VO_rms (5.6 ± 2.6): excellent (0.94, 1.2, 3.4); VO_max (9.7 ± 4.5): excellent (0.97, 1.5, 4.2); VO_amp (11.8 ± 6.2): excellent (0.94, 2.9, 8.0) | ||
| 2 | Bolzinger M. et al. [20] | Inter | SCC | [AM] RPC (202.7 ± 111, 200.8 ± 112) 2: good (0.8) |
| 3 | de Sèze M. et al. [33] | Inter | ICC, TEM | “clavical” position [FM] TS (11.5 ± 18.2) 1: excellent (3.8, 0.96); TLS (−8.3 ± 16.2): excellent (3.4, 0.96); LD_C7 (−5.9 ± 14.6): good (5.2, 0.88); PI (2.1 ± 2.4): moderate (1.3, 0.69); LS (−12.8 ± 13.8): poor (13.0, 0.13); [SM] AR_C7 (38.3 ± 20.2): good (7.1, 0.88); AR_T (7.3 ± 9.7): good (4.5, 0.79); HOIP (49.8 ± 10.8): good (3.8, 0.88); KA (29.9 ± 11.0): good (4.3, 0.85); AR_L (46.1 ± 9.7): moderate (6.0, 0.63); LA (36.0 ± 6.8): good (2.8, 0.83); [HM] TG (5.2 ± 2.7) 1: moderate (1.5, 0.70) 2; TH (74.3 ± 11.3): good (4.9, 0.82); PLP (4.7 ± 3.5): good (1.4, 0.84); LH (30.6 ± 7.2): good (3.2, 0.81); TLG (4.7 ± 3.1): good (1.5, 0.78); “folding” position [FM] TS (12.0 ± 19.1): excellent (3.7, 0.97), TLS (−8.6 ± 16.4): excellent (4.6, 0.93); LD_C7 (−4.0 ± 16.4): excellent (5.4, 0.90); PI (2.1 ± 2.5): moderate (1.6, 0.61); LS (−10.1 ± 14.2): moderate (9.7, 0.61); [SM] AR_C7 (33.3 ± 20.5): (9.3, 0.80); AR_T (4.1 ± 11.0): (5.0, 0.80); HOIP (48.7 ± 13.5): (4.5, 0.90); KA (32.1 ± 11.1): (4.3, 0.86): good to excellent; AR_L (4.1 ± 11.0): (6.2, 0.76); LA (50.4 ± 12.3): (2.7, 0.86): moderate to good; [HM] TG (5.6 ± 2.9): moderate (1.5, 0.74) 2; TH (76.3 ± 9.6): good (4.0, 0.84); PLP (5.2 ± 3.9): good (1.4, 0.87); LH (30.5 ± 6.8): good (2.4, 0.88); TLG (6.0 ± 3.3): moderate (1.8, 0.70) “straight out” position [FM] TS: (13.4 ± 18.0): excellent (4.2, 0.95); TLS (−9.2 ± 15.7): excellent (4.8, 0.91); LD_C7 (−5.8 ± 16.4): excellent (4.5, 0.93); PI (1.9 ± 2.4): moderate (1.7, 0.52); LS (−13.6 ± 8.6): poor (6.8, 0.44); [SM] AR_C7 (35.8 ± 19.4): excellent (6.1, 0.91); AR_T (4.5 ± 6.9): good (3.3, 0.78); HOIP (49.0 ± 12.5): good (5.8, 0.79); KA (31.5 ± 11.4): excellent (3.0, 0.93); AR_L (47.3 ± 10.8): good (5.3, 0.78); LA (37.1 ± 7.0): moderate (4.5, 0.60); [HM] TG (5.0 ± 2.9): moderate (1.9, 0.59); TH (75.0 ± 10.8): good (4.2, 0.86); PLP (5.3 ± 4.0): excellent (1.1, 0.93); LH (31.6 ± 7.3): excellent (2.0, 0.93); TLG (5.1 ± 3.2): good (1.4, 0.82) |
| 4 | Gorton G. E. et al. [37] | Intra | ICC [1, 3] (single measures) ICC [3, 3] (average measures) | [FM] MRS: excellent (0.94, 0.98); MLS: good to excellent (0.88, 0.96); SR_RL: excellent (0.90, 0.96); [SM] MPS: good to excellent (0.78, 0.91); MAS: good to excellent (0.87, 0.95); SR_AP: moderate to good (0.67, 0.86); [HM] MR_CCW: excellent (0.96, 0.99); MR_CW: excellent (0.97, 0.99); ROR: excellent (0.97, 0.99); [AM] SRE: excellent (0.98, 0.99); LRE: excellent (0.96, 0.99); RRE: excellent (0.94, 0.98); RLA_Min: good to excellent (0.75, 0.90); RLA_Max: moderate to good (0.63, 0.84); RLA_Ra: moderate to good (0.59, 0.81) |
| 5 | Knott P. et al. [38] | Intra | ICC | [FM] TC: excellent (0.95); LC: good (0.86); PO: good (0.894); T_IM: excellent (0.95) [SM] TK: excellent (0.98); LL: excellent (0.98); T_IN: excellent (0.91) |
| 6 | Sudo H. et al. [39] | Intra | ICC | [AM] AI: excellent (0.995) |
| 7 | Manca, A. et al. [41] | Intra | ICC [1, 2] | [FM] T_IM: good (0.88); PO: excellent (0.90); SD_amp: excellent (0.91); SD_rms: good (0.82); SA: excellent (0.98); [SM] T_IN: excellent (0.97); P_TI: excellent (0.93); TK: excellent (0.97); LL: excellent (0.97); [HM] P_TO: good (0.80); VO_rms: excellent (0.94); VO_amp: good (0.87) |
| 8 | Mínguez M. F. et al. [42] | Intra | CV | [AM] DAPI (0.27 ± 0.2) 1: excellent (5.13%); POTSI (3.95 ± 4.15): good (15.09%) |
| Inter | CV | [AM] DAPI (0.38 ± 0.3): excellent (7.69%); POTSI (3.98 ± 4.17): good (15.16%) | ||
| 9 | Pazos V. et al. [44] | Intra | ICC, TEM, SDD | “anatomical“position: excellent. [FM] DCC (17.6 ± 9.8) 1: (3.19, 5.62, 0.91); LTI (0.4 ± 3.4): (0.88, 1.55, 0.97); FPT (0.2 ± 3.4): (0.69, 1.22, 0.97); [SM] STI (−5.6 ± 3.3): (0.75, 1.32, 0.95); [HM] BSR_max (11.6 ± 4.5): (1.41, 2.48, 0.93); ATR_max (6.8 ± 3.5): (0.84, 1.48, 0.97); TH (394 ± 30): (3.0, 5.3, 0.99); [AM] FAR (1.8 ± 1.6): (0.28, 0.59, 0.99); FA (13.2 ± 36.7): (4.74, 8.35, 0.99); LAS (5.4 ± 10.2): (2.66, 4.69, 0.95) “clavicle” position: good to excellent. [FM] DCC (19.7 ± 9.9): (3.90, 6, 87, 0.85); LTI (0.9 ± 3.4): (1.17, 2.06, 0.92); FPT (0.0 ± 3.4): (1.05, 1.85, 0.95); [SM] STI (0.2 ± 3.1): (1.54, 2.71, 0.88); [HM] BSR_max (12.0 ± 4.8): (1.36, 2.39, 0.92); ATR_max (6.8 ± 3.5): (0.81, 1.43, 0.97); TH (382 ± 31): (5.17, 9.11, 0.97); [AM] FAR (1.7 ± 1.5): (0.52, 0.92, 0.90); FA (12.9 ± 35.7): (4.89, 8.62, 0.98); LAS (5.0 ± 10.3): (2.48, 4.37, 0.94) |
| 10 | Pino-Almero L. et al. [46] | Intra | ICC | [AM] DHOPI: excellent (0.983); POTSI: excellent (0.959); PC: excellent (0.984) (p < 0.05) |
| Inter | ICC | [AM] DHOPI: excellent (0.987); POTSI: excellent (0.978); PC: excellent (0.969) (p < 0.05) | ||
| 11 | Tabard-Fougere, A. et al. [47] | Intra | ICC [1, 1] | [SM] TK (36.9 ± 11.5) 1: excellent (0.937); LL (36.5 ± 9.9): excellent (0.965) |
| Abbreviation | ST Measurement | Description | CL |
|---|---|---|---|
| AI (mm) | Asymmetry Index [39,40] | The asymmetry index is calculated by a series of complex steps including capturing, segmenting, estimating a median sagittal plane and the boundary, generating the reflection point cloud, fitting, and extracting deviations for the dorsal point cloud. | AM |
| AR_C7 (mm) | C7 plumb line arrow [33] | The horizontal anterior-posterior distance from the C7 spinous processes relative to the vertical line spanning the most posterior point of those processes. | SM |
| AR_L (mm) | Lumbar arrow [33] | The horizontal anterior-posterior distance between the most anterior point of the spinous processes at the level of the lumbar lordosis relative to the vertical line spanning the most posterior segment of the processes. | SM |
| AR_T (mm) | Thoracic arrow [33] | The horizontal anterior-posterior distance between the most posterior point of the spinous processes at the level of the thoracic kyphosis relative to the vertical line spanning the most posterior segment of the processes. | SM |
| ATR_max (°) | Axial trunk rotation max [44] | The maximum angle between the principal axis of the section and the X-axis 1. | HM |
| BSR_max (°) | Back surface rotation max [44] | The maximum angle between the tangent line to the back profile and the X-axis 1. | HM |
| DAPI | Axial plane deformity index [42] | Consists of an addition of the difference of the depths of symmetrical points, at the level of the scapulae and waist. | AM |
| DCC (mm) | Maximum center deviation [44] | The maximum deviation of the line passing through the centers of the first and last cross-sections 2 as a distance in medio lateral direction in the transverse plane. | FM |
| DHOPI | Horizontal Plane Deformity Index [45,46] | Two lines are drawn: (a) The line between the two most prominent points of the scapulae; (b) the line between the two least prominent points of the waist. Then, locating the symmetrical point of the most prominent point situated on the two lines. Finally, the differences in depth between the symmetrical points, divided by distance I 3, are added. | AM |
| FA (mm) | Frontal asymmetry [44] | The global apparent asymmetry in the frontal view was calculated as the difference between right and left areas. | AM |
| FAR | Frontal asymmetry ratio [44] | The global apparent asymmetry in the frontal view was calculated as the ratio. | AM |
| FPT (°) | Frontal pelvic tilt [44] | The angle between the horizontal plane and the ASIS line in the frontal plane. | FM |
| HOIP (%) | Height of inflection point [33] | The height of the intersection point by the spinous processes and the segment consisting in C7 and the intergluteal cleft (0% corresponding to the top of the intergluteal cleft and 100% to the C7 spinal process). | SM |
| KA (°) | Kyphotic angle [33] | The angle formed by the perpendicular lines at the C7 spinal processes and at the inflection point in the sagittal plane. | SM |
| LA (°) | Lordotic angle [33] | The angle formed by the perpendicular lines at the spinal processes at the inflection point and at the top of the intergluteal cleft in the sagittal plane. | SM |
| LAS (mm) | Lateral asymmetry [44] | In the lateral view, the global asymmetry was the root-mean-square difference between the right and left mid-lateral curves. | AM |
| LC (°) | Lumbar curve [34,38] | The angle of lumbar curve in the frontal plane between tangents to the cranial and caudal endplates of the respectively calculated cranial and caudal vertebral bodies. | FM |
| LD_C7 (mm) | The C7 lateral deviation [33] | The horizontal distance between the C7 spinous processes and the vertical plane spanning the top of the intergluteal cleft (positive on the right, negative on the left). | FM |
| LH (%) | Lumbar height [33] | Height of the maximum rotation in the lumbar deformity relative to the C7 intergluteal cleft. | HM |
| LL (°) | Lumbar lordosis angle [32,38,41,47] | Maximal lumbar angle calculated between the 12th thoracic vertebra (T12) and midpoint between DM in the sagittal plane. | SM |
| ) | Largest residual [37] | The largest root-mean-square error (RMSE) of the distance between the point cloud of any ellipse and the point cloud in the reference ellipse 4. | AM |
| LS (°) | Lumbar sinuosity [33] | The camber angles of the spinous processes situated between two inflection points of the line in lumbar area. | FM |
| LTI (°) | Lateral trunk inclination [44] | The shift of the VP relative to the vertical line passing through origin 5 in the frontal plane. | FM |
| MAS (mm) | Maximum anterior shift [37] | The maximum deviation from the reference ellipse 1 in anterior direction of any slice. | SM |
| MLS (mm) | Maximum left shift [37] | The maximum deviation from the reference ellipse 1 in left direction of any slice. | FM |
| MPS (mm) | Maximum posterior shift [37] | The maximum deviation from the reference ellipse 1 in posterior direction of any slice within the defined volume. The scan produced a number of slices. Each consists of several hundred data points (a “point cloud”) that are fitted to an ellipse. The reference ellipse was an ellipse fitted to the point cloud of the reference slice defined at the level of the posterior superior iliac spine. The center of this ellipse and orientation of its principal axis served as reference for all measurements. | SM |
| MR_CCW (°) | Maximum CCW rotation [37] | The maximum deviation from the reference ellipse 1 in counterclockwise (CCW) direction of any slice. | HM |
| MR_CW (°) | Maximum CW rotation [37] | The maximum deviation from the reference ellipse1 in clockwise (CW) direction of any slice. | HM |
| MRS (mm) | Maximum right shift [37] | The maximum deviation from the reference ellipse 1 in right direction of any slice. | FM |
| PC | Columnar Profile [45,46] | It is obtained by determining the three angles that are formed when identifying the following points in the topography: The first angle (PC1) is delimited by the line between the basis of the neck (C7 vertebra) with the inter-shoulder blade zone (T5 vertebra) and the vertical line. The second angle (PC2) is delimited by the line between the anterior point (T5) with the waist zone (L3) and the vertical line. The third angle (PC3) is delimited by the line between the previous point corresponding to L3 with the intergluteal cleft (sacrum) and the vertical line. | AM |
| PD (mm2) | Procrustes distance [36] | The sum of squared distances between landmarks and semi-landmarks after general Procrustes analysis (GPA) and allows for quantifying the differences in shape excluding size. | AM |
| PI (°) | Pelvic imbalance [33] | The angle formed between the horizontal plane and the line spanning the sacral dimples. | FM |
| PLP (°) | Paraspinal lumbar prominence [33] | The maximum rotation (relative to the frontal plane) of the paraspinal lumbar prominence. | HM |
| PO (mm) | Pelvis Obliquity [32,38,41] | Height difference between the right and left lumbar dimples, based on a horizontal plane. | FM |
| P_TI (°) | Pelvis tilt [41,44] | Angle between plumb line and a tangent on the lumbar dimples in the sagittal plane. | SM |
| P_TO (°) | Pelvis torsion [41] | Torsion between left and right side pelvis bones (os ilium). | HM |
| POTSI | Posterior Trunk Symmetry Index [42,45,46] | POTSI is the sum of two variables: Height asymmetry indices (HAI) and frontal asymmetry indices (FAI). HAI is obtained as the sum of height differences of the shoulders, axillary fold, and waist creases and is normalized with the division of its value by the distance I. FAI is the sum of the differences in horizontal distance with respect to the gluteal cleft, C7 vertebra, axillary folds, and waist, which is also normalized by dividing them by distance I 3. | AM |
| QA (°) | Quantec angle [35] | Derived from the spine line (defined by T1, T12, and the posterior superior iliac spines) in the frontal plane and is calculated automatically by the Quantec system. | FM |
| RLA_Max (mm2) | Maximum right/left asymmetry [37] | The maximum value of the difference between the area of the left and right halves (divided along the minor axis of the ellipse) of the point cloud of any ellipse. | AM |
| RLA_Min (mm2) | Minimum right/left asymmetry [37] | The minimum value of the difference between the area of the left and right halves (divided along the minor axis of the ellipse) of the point cloud of any ellipse. | AM |
| RLA_Ra (mm2) | Right/left asymmetry range [37] | The value range of the difference between the area of the left and right halves (divided along the minor axis of the ellipse) of the point cloud of any ellipse. | AM |
| ) | Root-mean-square [21] | Root-mean-square of the point-to-point distance after superimposing the original image and the mirror image. | AM |
| ROR (°) | Rotation range [37] | The deviation range from the reference ellipse 1 in CCW-CW direction of any slice. | HM |
| RPC (G) | Rib prominence curve [20] | The spine (between the spinous process of C7 and the top of the gluteal fold) is divided into 100 axial slices at equal distances. On each slice, a straight line is defined passing through the highest points of the back on either side of the midline. The angle between this line and the projection of the line passing through the two-posterior superior iliac spines is defined as the rib prominence angle (°). The height (%) of this slice is expressed using the percentage of spine height. The rib prominence curve is the sum of the rib prominence angles of all the slices included in the curve multiplied by the height value of the slice. The thoracic, thoracolumbar, and lumbar segment curves were calculated separately, and the largest of these was obtained as the final value of the rib protrusion curve. | AM |
| ) | Residual range [37] | The root-mean-square error (RMSE) range of the distance between the point cloud of any ellipse and the point cloud in the reference ellipse 4. | AM |
| SA (°) | Scoliosis angle [32,41] | Maximal angle in the frontal plane between tangents to the cranial and caudal endplates of the respectively calculated cranial and caudal vertebral bodies. | FM |
| SD_amp (mm) | Side deviation-amp [41] | Lateral deviations of vertebral bodies from symmetry line in the frontal plane as the maximal variation from VP to DM. | FM |
| SD_rms (mm) | Side deviation from symmetry line-rms [41] | Lateral deviations of vertebral bodies from symmetry line in the frontal plane as the central tendency from VP to DM. | FM |
| SR_AP (mm) | Anterior/posterior shift range [37] | The deviation range from the reference ellipse 4 in anterior-posterior direction of any slice. | SM |
| ) | Smallest residual [37] | The smallest root-mean-square error (RMSE) of the distance between the point cloud of any ellipse and the point cloud in the reference ellipse 1. | AM |
| SR_RL (mm) | Right/left shift range [37] | The deviation range from the reference ellipse 4 in right-left direction of any slice. | FM |
| STI (°) | Forward-backward trunk inclination [44] | The shift of the VP relative to the vertical line passing through origin 3 in the sagittal plane. | SM |
| TC (°) | Thoracic curve [34,38] | The angle of thoracic curve in the frontal plane between tangents to the cranial and caudal endplates of the respectively calculated cranial and caudal vertebral bodies. | FM |
| TG (°) | Thoracic gibbosity [33] | The maximum rotation (relative to the frontal plane) of the thoracic deformity. | HM |
| TH (°) | Thoracic height [33] | Height of the maximum rotation in the thoracic deformity relative to the C7 intergluteal cleft. | HM |
| T_IN (mm) | Trunk inclination [38,41] | Plumb line deviation distance from VP to DM in the sagittal plane. Sva = lateral trunk inclination. | SM |
| T_IM (mm) | Trunk imbalance [38,41] | Plumb line deviation distance from VP to DM in the frontal plane. Cva = forward-backward trunk inclination. | FM |
| TK (°) | Thoracic kyphosis angle [33,38,41,47] | Maximal thoracic angle calculated between VP and the 12th thoracic vertebra (T12) in the sagittal plane. | SM |
| TL (mm) | Trunk length [32,44] | Distance from VP to midpoint between DM. | SM |
| TLG (°) | Thoracolumbar gibbosity [33] | The maximum rotation (relative to the frontal plane) of the thoracolumbar deformity. | HM |
| TLH (%) | Thoracolumbar height [33] | Height of the maximum rotation in the thoracolumbar deformity relative to the C7 intergluteal cleft. | HM |
| TLS (°) | Thoracolumbar sinuosity [33] | The camber angles of the spinous processes situated between two inflection points of the line in thoracolumbar area. | FM |
| TS (°) | Thoracic sinuosity [33] | The camber angles of the spinous processes situated between two inflection points of the line in thoracic area. | FM |
| VR (°) | Vertebral rotation [43] | The angle between the surface orientation on spinous process line (the so-called symmetry line) and the normal to the frontal plane of the reference system. | HM |
| VO_amp (°) | Amplitude of surface rotation T4-DM [32,41] | Amplitude of vertebral rotation measured perpendicular to back surface over the processus spinosus as the central tendency from VP to DM. | HM |
| VO_max (°) | Maximal surface rotation T4-DM [32] | Absolute value of maximal vertebral rotation measured perpendicular to back surface over the processus spinosus as the central tendency from VP to DM. | HM |
| VO_rms (°) | RMS surface rotation T4-DM [32,41] | Root-mean-square of vertebral rotation measured perpendicular to back surface over the processus spinosus as the central tendency from VP to DM. | HM |
| Study | Indicator | ST Measurements | Radiographic Measurements | Outcomes | |
|---|---|---|---|---|---|
| 1 | Tabard-Fougere, A. et al. [32] | r and p | SA (16.0 ± 5.9°) | Cobb angle (16.6 ± 9.3°) | Good (r = 0.70) and were non-significantly different (p = 0.60) |
| 2 | Frerich J. M.et al. [34] | r | TC, LC, LL, TK | Same as the ST measurements | TC: strong (r = 0.87); LL: strong (r = 0.81); TK: good (r = 0.80); LC: good (r = 0.76) |
| 3 | Goldberg C. J. et al. [35] | r | QA (24.2 ± 14.0°) | Cobb angle (41.16 ± 22.0°) | Strong (r = 0.81) |
| 4 | Gonzalez-Ruiz J. M. et al. [36] | p, Linear regressions | PD | Cobb angle | Significant correlation between Cobb angle and PD (r = 0.38; p = 0.01) |
| 5 | Gorton G. E. et al. [37] | r | ROR, MPS, SR_AP, SRE, LRE | Cobb angle, Kyphosis magnitude, Lordosis magnitude | ROR with Cobb angle: moderate (r = 0.48); MPS with kyphosis magnitude: moderate (r = 0.51); SR_AP with Kyphosis magnitude: moderate (r = 0.43); SRE with Lordosis magnitude: moderate (r = 0.45); LRE with Lordosis magnitude: moderate (r = 0.44) |
| 6 | Knott P. et al. [38] | r | TK, LL, TC, LC, T_IM, T_IN, PO | Same as the ST measurements | TK: strong (r = 0.87); LL: strong (r = 0.82); TC: good (r = 0.73); T_IM: good (r = 0.62); LC: moderate (r = 0.49); T_IN: moderate (r = 0.49) |
| 7 | Sudo H. et al. [39] | r | AI | Cobb angle | Strong (r = 0.88) |
| 8 | Kokabu T. et al. [40] | r | AI | Cobb angle | Strong (r = 0.85) |
| 9 | Mínguez M. F. et al. [42] | r | DAPI, POTSI | Cobb angle, Vertebral rotation angle | DAPI with Cobb angle: good (r = 0.71); POTSI with Cobb angle: good (r = 0.67); DAPI with Vertebral rotation angle: good (r = 0.62); POTSI with Vertebral rotation angle: moderate (r = 0.52) |
| 10 | Mangone, M. et al. [43] | r | VR (4.99 ± 3.50°) | Vertebral rotation (9.93 ± 5.38°) | Moderate (r = 0.52) |
| 11 | Pino-Almero L. et al. [45] | r | DHOPI, POTSI, PC | Cobb angle, Thoracic kyphosis angle, Lumbar lordosis angle, Vertebral rotation | DHOPI with: Cobb angle: strong (r = 0.81); POTSI with Cobb angle: good (r = 0.63); PC with thoracic kyphosis angle: moderate (r = 0.45); poor: PC with lordosis lumbar angle (r = 0.26); DHOPI with vertebral rotation poor (r = 0.31); POTSI with vertebral rotation: (r = 0.32) |
| 12 | Pino-Almero L. et al. [46] | r | DHOPI, POTSI, PC | Cobb angle, Thoracic kyphosis angle | DHOPI with Cobb angle: good (r = 0.77, 0.77) 1; POTSI with Cobb angle: moderate (r = 0.54, 0.54); PC with Thoracic kyphosis angle: moderate (r = 0.53, 0.61) |
| 13 | Yıldırım Y. et al. [21] | r | RMS | Cobb angle | RMS with in the thoracic region: good(r = 0.80, 0.76, 0.71) 2; RMS with Cobb angle in the lumbar region: moderate to good (r = 0.56, 0.65, 0.63) |
| 14 | Tabard-Fougere, A. et al. [47] | r | TK (36.9 ± 11.5°), LL (36.5 ± 9.9°) | Thoracic kyphosis (34.4 ± 11.2°), Lumbar lordosis (60.4 ± 10.7°) | Good: TK (r = 0.737); LL (r = 0.625) |
Publisher’s Note: MDPI stays neutral with regard to jurisdictional claims in published maps and institutional affiliations. |
© 2022 by the authors. Licensee MDPI, Basel, Switzerland. This article is an open access article distributed under the terms and conditions of the Creative Commons Attribution (CC BY) license (https://creativecommons.org/licenses/by/4.0/).
Share and Cite
Su, X.; Dong, R.; Wen, Z.; Liu, Y. Reliability and Validity of Scoliosis Measurements Obtained with Surface Topography Techniques: A Systematic Review. J. Clin. Med. 2022, 11, 6998. https://doi.org/10.3390/jcm11236998
Su X, Dong R, Wen Z, Liu Y. Reliability and Validity of Scoliosis Measurements Obtained with Surface Topography Techniques: A Systematic Review. Journal of Clinical Medicine. 2022; 11(23):6998. https://doi.org/10.3390/jcm11236998
Chicago/Turabian StyleSu, Xinyu, Rui Dong, Zhaoyong Wen, and Ye Liu. 2022. "Reliability and Validity of Scoliosis Measurements Obtained with Surface Topography Techniques: A Systematic Review" Journal of Clinical Medicine 11, no. 23: 6998. https://doi.org/10.3390/jcm11236998
APA StyleSu, X., Dong, R., Wen, Z., & Liu, Y. (2022). Reliability and Validity of Scoliosis Measurements Obtained with Surface Topography Techniques: A Systematic Review. Journal of Clinical Medicine, 11(23), 6998. https://doi.org/10.3390/jcm11236998