Article

Prognostic Factors and a Model for Occult Breast Cancer: A Population-Based Cohort Study

Department of Medical Oncology, National Cancer Center/National Clinical Research Center for Cancer/Cancer Hospital, Chinese Academy of Medical Sciences and Peking Union Medical College, Beijing 100021, China
*
Authors to whom correspondence should be addressed.
These authors contributed equally to this work.
J. Clin. Med. 2022, 11(22), 6804; https://doi.org/10.3390/jcm11226804
Submission received: 21 October 2022 / Revised: 10 November 2022 / Accepted: 15 November 2022 / Published: 17 November 2022
(This article belongs to the Section Oncology)

Abstract

:
Occult breast cancer (OBC) is a special type of breast cancer of an unknown primary origin. Early stage OBC is treated as stage II–III breast cancer. Currently, there are no models for predicting the survival outcomes. Hence, we aimed to evaluate the role of the positive lymph node ratio (PLNR) in OBC and further establish and validate a prognostic nomogram. Patients with stage T0N+M0 breast cancer were enrolled from the Surveillance, Epidemiology, and End Results database. Univariate and multivariate Cox analyses were used to evaluate the effects of prognostic factors on breast-cancer-specific survival (BCSS), and a nomogram was established and validated for OBC. Overall, 843 patients were included, and the 5-year BCSS rate was 92.4%. Patients with a PLNR < 0.54 had better BCSS rates than those with a PLNR ≥ 0.54. The nomogram combined clinicopathological parameters, including the PLNR, pN stage, and estrogen receptor status, and showed a higher accuracy than the TNM staging system in predicting the BCSS. The patients could be stratified into different risk groups based on their prognostic scores. Patients in the low-risk subgroup showed an improved BCSS compared those in the high-risk subgroup. In conclusion, the PLNR is an independent prognostic factor for OBC. The PLNR-based nomogram has a better predictive ability than the TNM staging system and could be of great value for the treatment of OBC and prediction of its prognosis.

1. Introduction

Occult breast cancer (OBC) is a sporadic tumor representing 0.1–1% of all breast cancers [1,2]. OBC manifests as axillary lymph node (LN) metastasis. However, upon clinical or imaging examinations, no primary breast tumor can be found [3,4]. OBC has traditionally been considered to be a carcinoma of unknown primary origin with a favorable prognosis and can be treated as stage II–III breast cancer [5,6,7]. The axillary LN metastasis status, estrogen receptor (ER) status, and locoregional treatment are important prognostic factors for OBC [1,2,8,9,10], with axillary LN metastasis being the strongest unfavorable prognostic factor [8,11,12].
To date, almost all studies have focused on analyzing the relationship between the LN stage and the prognosis of OBC [13]. However, according to the American Joint Committee on Cancer (AJCC) TNM staging system, the LN stage of breast cancer is only determined by the positive LN count and location (such as the inner mammary gland and supraclavicular region) [14]. The positive LN ratio (PLNR) is the ratio of the number of positive LNs to the number of regional LNs examined [15,16,17] and can reflect both the number of positive LN metastases and the quality of axillary LN dissection. Thus, it may have a greater prognostic value [18]. The PLNR has emerged as a prognostic factor for multiple cancers in several studies [19,20,21].
Thus, we aimed to evaluate the effect of the PLNR on breast-cancer-specific survival (BCSS) in women with OBC using the Surveillance, Epidemiology, and End Results (SEER) database. Since there is currently no model for predicting survival outcomes in patients with OBC, we aimed to build the first visual nomogram model so as to identify the groups at a high risk of recurrence and provide a reference for clinical diagnosis and treatment.

2. Materials and Methods

2.1. Study Population

Patients diagnosed with OBC from January 2004 to December 2015 and included in the SEER database were retrospectively reviewed. The inclusion criteria were as follows: (1) female sex; (2) pathological diagnosis of OBC; (3) age ≥ 18 years; (4) number of examined LNs (ELN) ≥ 1; and (5) number of positive LNs ≥ 1. The exclusion criteria were repeated patient identity and confirmed metastasis at the first visit. As the study used data from a public database, approval from an ethics committee was not required, as this study did not include a human or animal trial.

2.2. Variable Retrieval and Definition

The SEER*Stat version 8.3.4 software was used to retrieve the data. The clinicopathological variables that were collected included the age at diagnosis, tumor stage and grade (grade I–IV) according to 6th edition of the AJCC, ER status, progesterone receptor (PR) status, human epidermal growth factor receptor-2 (HER-2) status, type of therapy received (surgery, radiotherapy, and chemotherapy), number of regional nodes examined, number of positive regional nodes, survival duration, and the specific cause of death.
The BCSS was calculated from the time of the pathological diagnosis to the date of breast-cancer-related death or last follow-up. The PLNR was defined as the ratio of positive LNs to the total number of LNs removed. The histological grades were expressed as follows: grade I, differentiated; grade II, moderately differentiated; grade III, poorly differentiated; and grade IV, undifferentiated or anaplastic.

2.3. Statistical Analyses

Categorical data were expressed as numbers and percentages, and the chi-square test was performed to examine the differences between groups. All statistical analyses were performed using SPSS (version 23.0, Chicago, IL, USA) and R Studio software (version: 1.4.1717; RStudio, Boston, MA, USA). The X-tile software was used to determine the appropriate threshold using the minimum p value and maximum χ2. The survival curves were analyzed using the Kaplan–Meier method and the log-rank test. Multivariate Cox proportional hazard regression models were used to evaluate the prognostic factors of BCSS, and a nomogram was established. Subsequently, the discriminatory power of the nomogram model was evaluated using several methods, including the concordance index (C-index), area under the curve (AUC) values, calibration plot, and decision-making curve analysis. A two-tailed p value < 0.05 was considered statistically significant.

3. Results

3.1. Patients’ Characteristics

A total of 843 patients identified using the SEER database were included in the study. All the patients had histologically confirmed OBC and were in the stage T0N1–3M0. The median age at diagnosis was 59 (range: 31–98) years, and 163 (19.3%) patients had OBC of grades III and IV. The ER and PR status were positive in 56.5% and 39.6% of the cases, respectively, and HER-2 overexpression was observed in 12.1% of the patients. All the patients underwent axillary LN dissection, and more than 60% had ten or more LNs removed. Of the patients, 59.8%, 19.6%, and 20.6% were categorized as having N1, N2, and N3 diseases, respectively. Regarding the treatment modalities, 322 (38.2%) patients underwent a mastectomy, 92 (10.9%) underwent breast-conserving surgery, and the rest did not undergo breast surgery. The number of patients who received radiotherapy was roughly equal to those who did not (54.0% vs. 46.0%). Moreover, chemotherapy was administered to 75.4% of the patients. The patients’ basic characteristics are presented in Table 1.

3.2. Risk Factors for LN Metastasis

The relationships between LN metastasis and other clinicopathological characteristics are shown in Table 2. The pN stage was related to the number of regional ELNs and the grade. Notably, a higher pN stage was associated with a higher number of regional ELNs (χ2 = 70.243, p < 0.001). Moreover, the pN stage can influence the formulation of therapeutic strategies. Patients with a higher pN stage were more likely to receive adjuvant radiotherapy and chemotherapy. LN metastasis was not associated with age, the ER status, PR status, HER-2 status, pathological grade, or surgical modality (p > 0.05).

3.3. Prognostic Impact of PLNR on BCSS

For patients with OBC, the tumor-size-related staging is T0 by default due to the unknown location of the primary site. The LN metastasis status was regarded as an independent prognostic factor for BCSS. However, the pN stage was affected by the LN surgery method and the number of ELNs. To further explore the relationship between the LN metastasis status and OBC, the PLNR was included as a variable in the analysis. The PLNR is the ratio of the number of positive LNs to the number of detected regional LNs, simultaneously reflecting the impacts of both on prognosis.
According to the best cut-off value screened, the patients were divided into two subgroups based on the PLNR: the PLNR < 0.54 group and the PLNR ≥ 0.54 group. The corresponding maximum chi-square value was 42.3290. Among all the patients, 59.5% had a PLNR < 0.54, and 40.5% had a PLNR ≥ 0.54 (Figure 1).

3.4. Survival and Prognosis

The median follow-up period was 68 months. Overall, the 1-, 3-, and 5-year BCSS rates of the patients were 98.7%, 94.7%, and 92.4%, respectively. The Kaplan–Meier survival curve of the overall cohort can be found in Figure 2A. The results of the univariate and multivariate Cox regression analyses for the BCSS are presented in Table 1. The univariate analysis showed that the ER status (p = 0.002), PR status (p = 0.047), and pN stage (p < 0.001) were correlated with the BCSS. As shown in Figure 2B, patients with a positive ER status had a better BCSS than those with a negative ER status. Additionally, the BCSS differed significantly between patients of different pN stages (Figure 2C). In the multivariate Cox regression models, the ER status, the number of regional ELNs, and the pN stage were independent prognostic factors for the BCSS. Compared with the patients with pN1 stage disease, those with pN2 and pN3 disease had a 2.6-fold and 5.4-fold respective increased risk of death (p = 0.005, hazard ratio (HR) = 2.584, 95% confidence interval (CI): 1.334–5.005 and p < 0.001, HR = 5.374, 95% CI: 3.020–9.565, respectively). Patients who had 10 or more LNs removed had a better BCSS (p = 0.005, HR = 0.448, 95% CI: 0.256–0.785). However, the age at diagnosis, HER-2 status, pathologic grade, postoperative radiotherapy, breast surgery, and adjuvant chemotherapy were not associated with the BCSS (p > 0.05).
The univariate analysis showed that a higher PLNR and pN stage were associated with a poor BCSS. In the multivariate Cox regression model of the BCSS, patients in the PLNR ≥ 0.54 subgroup had poorer prognoses than those in the PLNR < 0.54 subgroup (p < 0.001, HR = 3.584, 95% CI: 1.943–6.614). Moreover, compared with the patients with pN1 stage disease, the risk of breast-cancer-specific death was greater among the patients with pN2 stage (pN2 vs. pN1, p = 0.028, HR = 2.104, 95% CI: 1.083–4.09) and pN3 stage disease (pN3 vs. pN1, p = 0.002, HR = 2.662, 95% CI: 1.438–4.929). In addition, ER positivity was a protective factor against breast-cancer-specific death (p = 0.001, HR = 0.399). The univariate and multivariate Cox analyses of the prognostic factors are shown in Table 3.

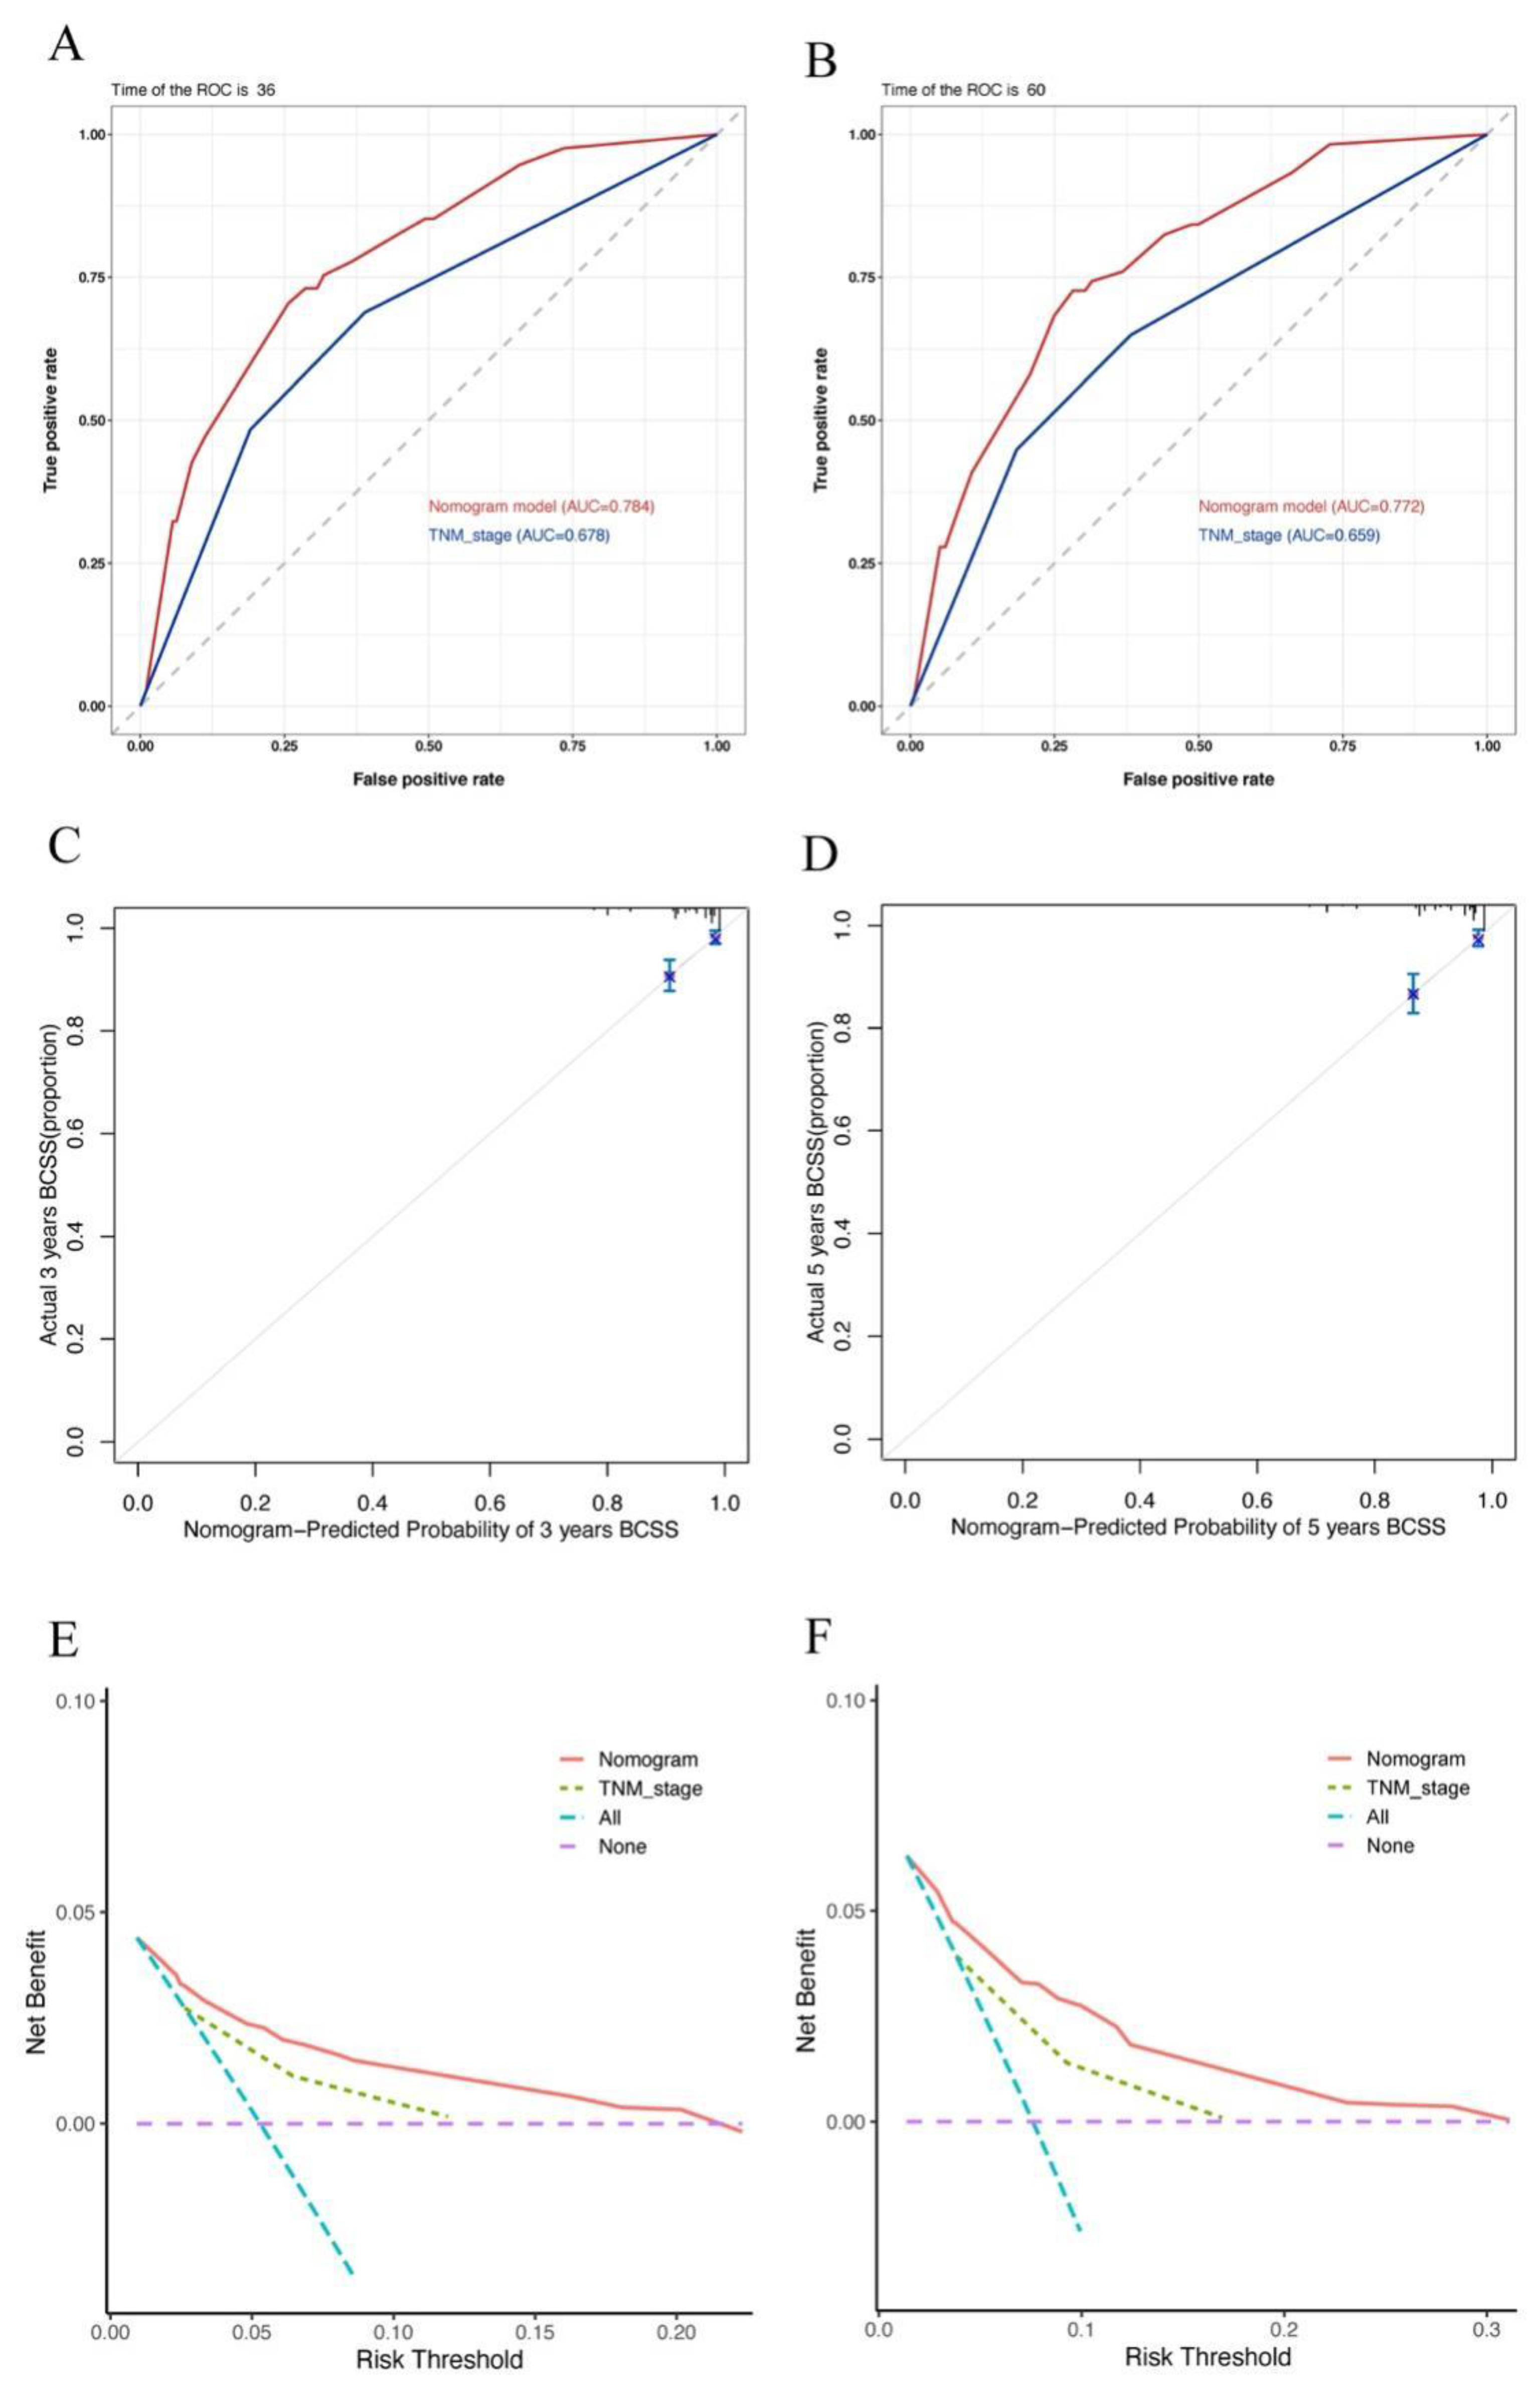
3.5. Nomogram Construction and Validation

Based on the findings of the multivariate Cox analysis, a nomogram model of BCSS in patients with OBC was established, and the details are presented in Figure 3. The point for each variable is determined by drawing a vertical line from the variable to the point axis. The probability of survival at each time point is estimated by summing the total scores and positioning them on the total subscale.
Notably, the C-index values of our nomogram model showed a better discriminative ability than that of the TNM staging system (0.766 vs. 0.664). Similarly, the AUC values of the 3- and 5-year BCSS rates were also higher than those of the TNM staging system (3-year: 0.784 vs. 0.678, 5-year: 0.772 vs. 0.659). In addition, the calibration plots for the 3- and 5-year BCSS predictions based on the nomogram showed a satisfactory agreement between the actual and predicted clinical outcomes, further verifying the clinical value of our model. Furthermore, the decision-making curve analysis showed a good clinical net benefit. The details can be seen in Figure 4.
Subsequently, we used X-tile software to determine the optimal cut-off value for the model-based prognostic scores. We classified the entire cohort into two new prognostic risk groups: low-risk (≤181) and high-risk (>181) (chi-square high vs. low: 59.45, relative risk: 1.00 vs. 4.92). As shown in Figure 5, compared with those in the low-risk subgroup, the BCSS of patients with OBC in the high-risk subgroups was significantly decreased (p < 0.001). The 3- and 5-year BCSS rates for the low- and high-risk subgroups were 96.6% vs. 78.8% and 94.6% vs. 73.7%, respectively.

4. Discussion

OBC is a metastatic carcinoma of the axilla with no primary breast lesions, and the T stage based on the tumor size defaults to T0. Thus, axillary LNs significantly impact the prognosis and treatment options for this particular type of breast cancer. Consistent with the existing literature [22], our study confirmed that the pN stage was associated with the survival outcomes of patients with OBC. Compared to patients with pN1 stage disease, the cancer-related risk of death was significantly increased in patients with disease of the pN2 and pN3 stages (p < 0.05). In addition, we also found that the ER status and the number of ELNs were significantly associated with the BCSS before including the PLNR as a prognostic variable. This is similar to a study conducted by Johnson et al., which showed that age, the pN stage, and ER status are important prognostic factors for OBC [22]. Axillary LN dissection is recommended in the National Comprehensive Cancer Network guidelines to ensure that a certain number of LNs are detected [23]. According to the AJCC staging system, no less than ten regional LNs should be considered for the accurate evaluation and staging of patients with breast cancer. The present study showed that patients with ELNs ≥10 had a better BCSS than those with ELNs <10, suggesting that an adequate number of dissected LNs is critical for patient prognosis.
Accumulating evidence suggests that the PLNR is superior to the pN stage or positive LN count as a prognostic factor for cancer patients [17,24,25]. The PLNR can reflect both the invasion of the tumor area and the effect of axillary LN dissection, theoretically providing greater prognostic value [26,27]. Therefore, our study incorporated the PLNR into the multivariate analysis as a variable for further analysis. The optimal cut-off value for the PLNR was determined in order to classify the patients into two subgroups with significant differences in survival. Patients with a PLNR ≥ 0.54 exhibited a significantly better BCSS than those with a PLNR < 0.54. In addition to the pN stage, the PLNR was also an independent prognostic factor for OBC, which implies that a certain number of LNs should be removed in cases of OBC, and this number is affected by the number of positive LNs.
To the best of our knowledge, we were the first to construct a satisfactory BCSS nomogram model for evaluating the clinical outcomes of patients with OBC. Compared with the AJCC staging system, our nomogram model was more accurate in predicting the prognosis, as confirmed by its higher C-index, better AUC values, and more consistent calibration plots. Importantly, our nomogram model can significantly stratify patient survival outcomes according to low-, intermediate-, and high-risk groups. The BCSS of these patients decreased significantly with the increasing risk class. Given the excellent predictive power of our nomogram model, we further confirmed its clinical utility.
However, our population-based study had a few limitations. Selection bias may have occurred because of the retrospective study design. In addition, some clinicopathological and therapeutic information could not be obtained, such as the HER-2 status prior to 2010, radiation dose and field, and the type of chemotherapy regimen. Despite these limitations, our established prognostic model can stratify patients with OBC into different risk groups, thus providing great value for treatment decision making and prognostic prediction.

5. Conclusions

In conclusion, our study comprehensively explored the clinical characteristics and survival outcomes of patients with OBC. We determined the optimal threshold for the PLNR and further evaluated its prognostic value. We also established a prognostic nomogram model of OBC and stratified the prognostic risk of patients with OBC, which is helpful in clinical decision making.

Author Contributions

Conceptualization, F.M., B.X. and D.Z.; methodology, D.Z. and J.Z.; software, J.Z. and L.L.; validation, D.Z., J.Z. and L.L.; formal analysis, D.Z. and J.Z.; investigation, L.L. and Y.W.; resources, L.L. and Y.W.; data curation, D.Z. and J.Z.; writing—original draft preparation, D.Z., J.Z. and L.L.; writing—review and editing, F.M., B.X. and D.Z.; visualization, F.M. and B.X.; supervision, F.M. and B.X.; project administration, F.M. and B.X.; funding acquisition, F.M. and B.X. All authors have read and agreed to the published version of the manuscript.

Funding

This work was supported by the CAMS Innovation Fund for Medical Sciences (2021-I2M-1-014).

Institutional Review Board Statement

Not applicable.

Informed Consent Statement

Not applicable.

Data Availability Statement

The datasets that were analyzed for this study can be found in the SEER database (https://seer.cancer.gov (accessed on 19 April 2022)).

Acknowledgments

The authors acknowledge the efforts of the SEER Program tumor registries in the creation of the SEER database and thank all the patients analyzed in this study.

Conflicts of Interest

The authors declare that the research was conducted in the absence of any commercial or financial relationships that could be construed as a potential conflict of interest.

References

  1. Sohn, G.; Son, B.H.; Lee, S.J.; Kang, E.Y.; Jung, S.H.; Cho, S.H.; Baek, S.; Lee, Y.R.; Kim, H.J.; Ko, B.S.; et al. Treatment and survival of patients with occult breast cancer with axillary lymph node metastasis: A nationwide retrospective study. J. Surg. Oncol. 2014, 110, 270–274. [Google Scholar] [CrossRef] [PubMed]
  2. Walker, G.V.; Smith, G.L.; Perkins, G.H.; Oh, J.L.; Woodward, W.; Yu, T.K.; Hunt, K.K.; Hoffman, K.; Strom, E.A.; Buchholz, T.A. Population-based analysis of occult primary breast cancer with axillary lymph node metastasis. Cancer 2010, 116, 4000–4006. [Google Scholar] [CrossRef] [PubMed] [Green Version]
  3. Patel, J.; Nemoto, T.; Rosner, D.; Dao, T.L.; Pickren, J.W. Axillary lymph node metastasis from an occult breast cancer. Cancer 1981, 47, 2923–2927. [Google Scholar] [CrossRef]
  4. Galimberti, V.; Bassani, G.; Monti, S.; Simsek, S.; Villa, G.; Renne, G.; Luini, A. Clinical experience with axillary presentation breast cancer. Breast Cancer Res. Treat 2004, 88, 43–47. [Google Scholar] [CrossRef] [PubMed]
  5. Pavlidis, N.; Pentheroudakis, G. Cancer of unknown primary site. Lancet 2012, 379, 1428–1435. [Google Scholar] [CrossRef]
  6. Lee, M.S.; Sanoff, H.K. Cancer of unknown primary. BMJ 2020, 371, m4050. [Google Scholar] [CrossRef]
  7. Terada, M.; Miyashita, M.; Kumamaru, H.; Miyata, H.; Tamura, K.; Yoshida, M.; Ogo, E.; Nagahashi, M.; Asaga, S.; Kojima, Y.; et al. Surgical treatment trends and identification of primary breast tumors after surgery in occult breast cancer: A study based on the Japanese National Clinical Database-Breast Cancer Registry. Breast Cancer 2022, 29, 698–708. [Google Scholar] [CrossRef]
  8. He, M.; Tang, L.C.; Yu, K.D.; Cao, A.Y.; Shen, Z.Z.; Shao, Z.M.; Di, G.-H. Treatment outcomes and unfavorable prognostic factors in patients with occult breast cancer. Eur. J. Surg. Oncol. (EJSO) 2012, 38, 1022–1028. [Google Scholar] [CrossRef]
  9. Chen, K.; Zhang, J.; Beeraka, N.M.; Sinelnikov, M.Y.; Zhang, X.; Cao, Y.; Lu, P. Robot-Assisted Minimally Invasive Breast Surgery: Recent Evidence with Comparative Clinical Outcomes. J. Clin. Med. 2022, 11, 1827. [Google Scholar] [CrossRef]
  10. Chen, K.; Beeraka, N.M.; Zhang, J.; Reshetov, I.V.; Nikolenko, V.N.; Sinelnikov, M.Y.; Mikhaleva, L.M. Efficacy of da Vinci robot-assisted lymph node surgery than conventional axillary lymph node dissection in breast cancer-A comparative study. Int. J. Med. Robot 2021, 17, e2307. [Google Scholar] [CrossRef]
  11. Vlastos, G.; Jean, M.E.; Mirza, A.N.; Mirza, N.Q.; Kuerer, H.M.; Ames, F.C.; Hunt, K.K.; Ross, M.I.; Buchholz, T.A.; Buzdar, A.U.; et al. Feasibility of breast preservation in the treatment of occult primary carcinoma presenting with axillary metastases. Ann. Surg. Oncol. 2001, 8, 425–431. [Google Scholar] [CrossRef]
  12. Qian, K.; Sun, W.; Guo, K.; Zheng, X.; Sun, T.; Chen, L.; Xiang, J.; Li, D.; Wu, Y.; Ji, Q.; et al. The number and ratio of positive lymph nodes are independent prognostic factors for patients with major salivary gland cancer: Results from the surveillance, epidemiology, and End Results dataset. Eur. J. Surg. Oncol. (EJSO) 2019, 45, 1025–1032. [Google Scholar] [CrossRef]
  13. Foroudi, F.; Tiver, K.W. Occult breast carcinoma presenting as axillary metastases. Int. J. Radiat. Oncol. Biol. Phys. 2000, 47, 143–147. [Google Scholar] [CrossRef]
  14. Singletary, S.E.; Allred, C.; Ashley, P.; Bassett, L.W.; Berry, D.; Bland, K.I.; Borgen, P.I.; Clark, G.; Edge, S.B.; Hayes, D.F.; et al. Revision of the American Joint Committee on Cancer staging system for breast cancer. J. Clin. Oncol. 2002, 20, 3628–3636. [Google Scholar] [CrossRef]
  15. Wang, Z.; Chong, W.; Zhang, H.; Liu, X.; Zhao, Y.; Guo, Z.; Fu, L.; Ma, Y.; Gu, F. Breast Cancer Patients With Positive Apical or Infraclavicular/Ipsilateral Supraclavicular Lymph Nodes Should Be Excluded in the Application of the Lymph Node Ratio System. Front. Cell Dev. Biol. 2022, 10, 784920. [Google Scholar] [CrossRef]
  16. Solak, M.; Turkoz, F.P.; Keskin, O.; Aksoy, S.; Babacan, T.; Sarici, F.; Kertmen, N.; Sever, A.R.; Altundag, K. The lymph node ratio as an independent prognostic factor for non-metastatic node-positive breast cancer recurrence and mortality. J. Buon. 2015, 20, 737–745. [Google Scholar]
  17. Cho, D.H.; Bae, S.Y.; You, J.Y.; Kim, H.K.; Chang, Y.W.; Choi, Y.J.; Woo, S.U.; Son, G.S.; Lee, J.B.; Bae, J.W.; et al. Lymph node ratio as an alternative to pN staging for predicting prognosis after neoadjuvant chemotherapy in breast cancer. Kaohsiung J. Med. Sci. 2018, 34, 341–347. [Google Scholar] [CrossRef] [Green Version]
  18. Ataseven, B.; Kümmel, S.; Weikel, W.; Heitz, F.; Holtschmidt, J.; Lorenz-Salehi, F.; Kümmel, A.; Traut, A.; Blohmer, J.; Harter, P.; et al. Additional prognostic value of lymph node ratio over pN staging in different breast cancer subtypes based on the results of 1656 patients. Arch. Gynecol. Obstet. 2015, 291, 1153–1166. [Google Scholar] [CrossRef]
  19. Woodward, W.A.; Vinh-Hung, V.; Ueno, N.T.; Cheng, Y.C.; Royce, M.; Tai, P.; Vlastos, G.; Wallace, A.M.; Hortobagyi, G.N.; Nieto, Y. Prognostic value of nodal ratios in node-positive breast cancer. J. Clin. Oncol. 2006, 24, 2910–2916. [Google Scholar] [CrossRef]
  20. Schneider, D.F.; Chen, H.; Sippel, R.S. Impact of lymph node ratio on survival in papillary thyroid cancer. Ann. Surg. Oncol. 2013, 20, 1906–1911. [Google Scholar] [CrossRef] [Green Version]
  21. Wen, J.; Yang, Y.; Liu, P.; Ye, F.; Tang, H.; Huang, X.; Zhong, S.; Xie, X. Development and validation of a nomogram for predicting survival on the base of modified lymph node ratio in breast cancer patients. Breast 2017, 33, 14–22. [Google Scholar] [CrossRef] [PubMed]
  22. Johnson, H.M.; Irish, W.; Vohra, N.A.; Wong, J.H. The effect of local therapy on breast cancer-specific mortality of women with occult breast cancer and advanced nodal disease (N2/N3): A population analysis. Breast Cancer Res. Treat 2019, 177, 155–164. [Google Scholar] [CrossRef] [PubMed]
  23. Lin, P.P.; Allison, D.C.; Wainstock, J.; Miller, K.D.; Dooley, W.C.; Friedman, N.; Baker, R.R. Impact of axillary lymph node dissection on the therapy of breast cancer patients. J. Clin. Oncol. 1993, 11, 1536–1544. [Google Scholar] [CrossRef] [PubMed]
  24. Sun, Y.; Li, Y.; Wu, J.; Tian, H.; Liu, H.; Fang, Y.; Li, Y.; Yu, F. Nomograms for prediction of overall and cancer-specific survival in young breast cancer. Breast Cancer Res. Treat 2020, 184, 597–613. [Google Scholar] [CrossRef]
  25. Liu, D.; Chen, Y.; Deng, M.; Xie, G.; Wang, J.; Zhang, L.; Liu, Q.; Yuan, P.; Feng, X. Lymph node ratio and breast cancer prognosis: A meta-analysis. Breast Cancer 2014, 21, 1–9. [Google Scholar] [CrossRef]
  26. Yang, J.; Long, Q.; Li, H.; Lv, Q.; Tan, Q.; Yang, X. The value of positive lymph nodes ratio combined with negative lymph node count in prediction of breast cancer survival. J. Thorac. Dis. 2017, 9, 1531–1537. [Google Scholar] [CrossRef] [Green Version]
  27. Vinh-Hung, V.; Verkooijen, H.M.; Fioretta, G.; Neyroud-Caspar, I.; Rapiti, E.; Vlastos, G.; Deglise, C.; Usel, M.; Lutz, J.-M.; Bouchardy, C. Lymph node ratio as an alternative to pN staging in node-positive breast cancer. J. Clin. Oncol. 2009, 27, 1062–1068. [Google Scholar] [CrossRef]
Figure 1. Optimal cut-off values for the PLNR. (A) The black dots represent the optimal cut-off values of the PLNR; (B) histograms of the number of patients grouped based on the optimal cut-off values of the PLNR; (C) Kaplan–Meier curves of patients in the PLNR < 0.54 group (blue) and the PLNR ≥ 0.54 group (grey). Abbreviation: PLNR, positive lymph node ratio.
Jcm 11 06804 g001
Figure 2. Survival curves of the cohort and the subgroups. (A) Kaplan–Meier curve of the cohort; (B) Kaplan–Meier curves of patients with different ER statuses; (C) Kaplan–Meier curves of patients with different pN stages. Abbreviation: ER, estrogen receptor; pN, pathological lymph node.
Jcm 11 06804 g002
Figure 3. Nomogram model of BCSS in patients with OBC. Abbreviation: BCSS, breast-cancer-specific survival; OBC, occult breast cancer.
Jcm 11 06804 g003
Figure 4. The ROC curves, calibration plots, and decision-making curve analysis of 3- and 5-year BCSS; (A,B) ROC curves for the nomogram and TNM stage; (C,D) calibration plot for the nomogram; (E,F) decision-making curve analysis of the nomogram and TNM stage. Abbreviation: ROC, receiver operator characteristic; TNM, tumor-node-metastasis.
Jcm 11 06804 g004
Figure 5. BCSS of patients among the low- and high-risk groups. (A) The black dots represent the optimal cut-off values of the risk scores; (B) histograms of the number of patients grouped based on the optimal cut-off values of the risk scores; (C) Kaplan–Meier curves of patients in the low-risk (blue) and high-risk (grey) groups. Abbreviation: BCSS, breast-cancer-specific survival.
Jcm 11 06804 g005
Table 1. Patient characteristics.
CharacteristicsTotal (n = 843)
N (%)
Univariable AnalysisMultivariable Analysis
HR (95%CI)pHR (95%CI)p
Age at Diagnosis
<60426 (50.5)1
≥60417 (49.5)1.014 (0.626–1.645) 0.954
ER status
Negative286 (33.9)1 1
Positive476 (56.5)0.398 (0.233–0.681) 0.001 0.394 (0.23–0.676) 0.001
Unknown81 (9.6)1.039 (0.513–2.104) 0.915 1.116 (0.544–2.288) 0.764
PR status
Negative410 (48.6)1 0.047
Positive334 (39.6)0.483 (0.271–0.861) 0.014
Unknown99 (11.7)0.873 (0.424–1.796) 0.711
HER-2 status
Negative266 (31.6)1
Positive102 (12.1)0.809 (0.299–2.194) 0.678
Unknown475 (56.3)0.854 (0.474–1.537) 0.598
Grade
I–II48 (5.7)1
III–IV163 (19.3)1.972 (0.586–6.641) 0.273
Unknown632 (75.0)1.169 (0.363–3.77) 0.793
pN
N1504 (59.8)1 1
N2165 (19.6)2.505 (1.298–4.834) 0.006 2.584 (1.334–5.005) 0.005
N3174 (20.6)4.765 (2.706–8.392) <0.001 5.374 (3.02–9.565) <0.001
Number of regional LNs examined
<6218 (25.9)1 1
≥6, <1097 (11.5)0.574 (0.232–1.415) 0.228 0.629 (0.249–1.594) 0.329
≥10528 (62.6)0.648 (0.383–1.096) 0.105 0.448 (0.256–0.785) 0.005
Breast surgery
Mastectomy322 (38.2)1
Breast-conserving surgery92 (10.9)1.047 (0.614–1.783) 0.867
No429 (50.9)1.512 (0.719–3.178) 0.275
Radiotherapy
Yes455 (54.0)1
No388 (46.0)1.241 (0.766–2.011) 0.381
Chemotherapy
Yes636 (75.4)1
No207 (24.6)0.989 (0.556–1.759) 0.970
Abbreviations: HR, hazard ratio; CI, confidence interval; ER, estrogen receptor; PR, progesterone receptor; HER-2, human epidermal growth factor receptor-2; LN, lymph node.
Table 2. Comparison of different N staging outcomes in occult breast cancer patients.
CharacteristicN1 (n = 504) (%)N2 (n = 165) (%)N3 (n = 174) (%)χ2p
Age at diagnosis 0.3580.836
<60254 (50.4)81 (49.1)91 (52.3)
≥60250 (49.6)84 (50.9)83 (47.7)
ER status 6.2570.181
Negative157 (31.2)62 (37.6)67 (38.5)
Positive291 (57.7)90 (54.5)95 (54.6)
Unknown56 (11.1)13 (7.9)12 (6.9)
PR status 8.1470.086
Negative231 (45.8)84 (50.9)95 (54.6)
Positive203 (40.3)64 (38.8)67 (38.5)
Unknown70 (13.9)17 (10.3)12 (6.9)
HER-2 status 5.2570.262
Negative163 (32.3)56 (33.9)47 (27.0)
Positive53 (10.5)21 (12.7)28 (16.1)
Unknown288 (57.1)88 (53.3)99 (56.9)
Grade 9.9090.042
I–II30 (6.0)12 (7.3)6 (3.4)
III–IV82 (16.3)38 (23.0)43 (24.7)
Unknown392 (77.8)115 (69.7)125 (71.8)
Number of regional LNs examined 70.243<0.001
1–5172 (34.1)15 (9.1)31 (17.8)
6–963 (12.5)29 (17.6)5 (2.9)
≥10269 (53.4)121 (73.3)138 (79.3)
Breast surgery 4.5080.342
Mastectomy187 (37.1)72 (43.6)63 (36.2)
BCS58 (11.5)19 (11.5)15 (8.6)
No259 (51.4)74 (44.8)96 (55.2)
Radiotherapy 17.914<0.001
Yes242 (48.0)104 (63.0)109 (62.6)
No262 (52.0)61 (37.0)65 (37.4)
Chemotherapy 7.1910.027
Yes364 (72.2)134 (81.2)138 (79.3)
No140 (27.8)31 (18.8)36 (20.7)
Abbreviations: ER, estrogen receptor; PR, progesterone receptor; HER-2, human epidermal growth factor receptor-2; BCS, breast-conserving surgery; LN, lymph node.
Table 3. Univariate and multivariable analyses of the prognostic factors.
CharacteristicsTotal (n = 843)
N (%)
Univariable AnalysisMultivariable Analysis
HR (95% CI)pHR (95% CI)p
Age at diagnosis
<60426 (50.5)1
≥60417 (49.5)1.014 (0.626–1.645)0.954
ER status
Negative286 (33.9)1 1
Positive476 (56.5)0.398 (0.233–0.681)0.0010.399 (0.233–0.684)0.001
Unknown81 (9.6)1.039 (0.513–2.104)0.9151.123 (0.551–2.287)0.750
PR status
Negative410 (48.6)1
Positive334 (39.6)0.483 (0.271–0.861)0.014
Unknown99 (11.7)0.873 (0.424–1.796)0.711
HER-2 status
Negative266 (31.6)10.847
Positive102 (12.1)0.809 (0.299-2.194)0.678
Unknown475 (56.3)0.854 (0.474–1.537)0.598
Grade
I–II48 (5.7)1
III–IV163 (19.3)1.972 (0.586–6.641)0.273
Unknown632 (75.0)1.169 (0.363–3.77)0.793
pN
N1504 (59.8)1 1
N2165 (19.6)2.505 (1.298–4.834)0.0062.104 (1.083–4.09)0.028
N3174 (20.6)4.765 (2.706–8.392)<0.0012.662 (1.438–4.929)0.002
Number of regional LNs examined
<6218 (25.9)1
≥6, <1097 (11.5)0.574 (0.232–1.415)0.228
≥10528 (62.6)0.648 (0.383–1.096)0.105
PLNR
<0.50502 (59.5)1 1
≥0.50341 (40.5)5.07 (2.887–8.905)<0.0013.584 (1.943–6.614)<0.001
Breast surgery
Mastectomy322 (38.2)1
Breast-conserving surgery92 (10.9)1.047 (0.614–1.783)0.867
No429 (50.9)1.512 (0.719–3.178)0.275
Radiotherapy
Yes455 (54.0)1
No388 (46.0)1.241 (0.766–2.011)0.381
Chemotherapy
Yes636 (75.4)1
No207 (24.6)0.989 (0.556–1.759)0.970
Abbreviations: HR, hazard ratio; CI, confidence interval; ER, estrogen receptor; PR, progesterone receptor; HER-2, human epidermal growth factor receptor-2; PLNR, positive lymph node ratio; LN, lymph node.
Publisher’s Note: MDPI stays neutral with regard to jurisdictional claims in published maps and institutional affiliations.

