
Cathepsin B, D and S as Potential Biomarkers of Brain Glioma Malignancy

 , , ,
, , , 
Abstract
1. Introduction
2. Materials and Methods
2.1. Biological Material
2.2. Procedure for Quantifying Cath B, Cath D and Cath S
2.3. SPRi Measurements
2.4. IDH 1/2 Mutation, p53 Gene Mutation and EGFR Expression
2.5. Statistical Analysis
3. Results
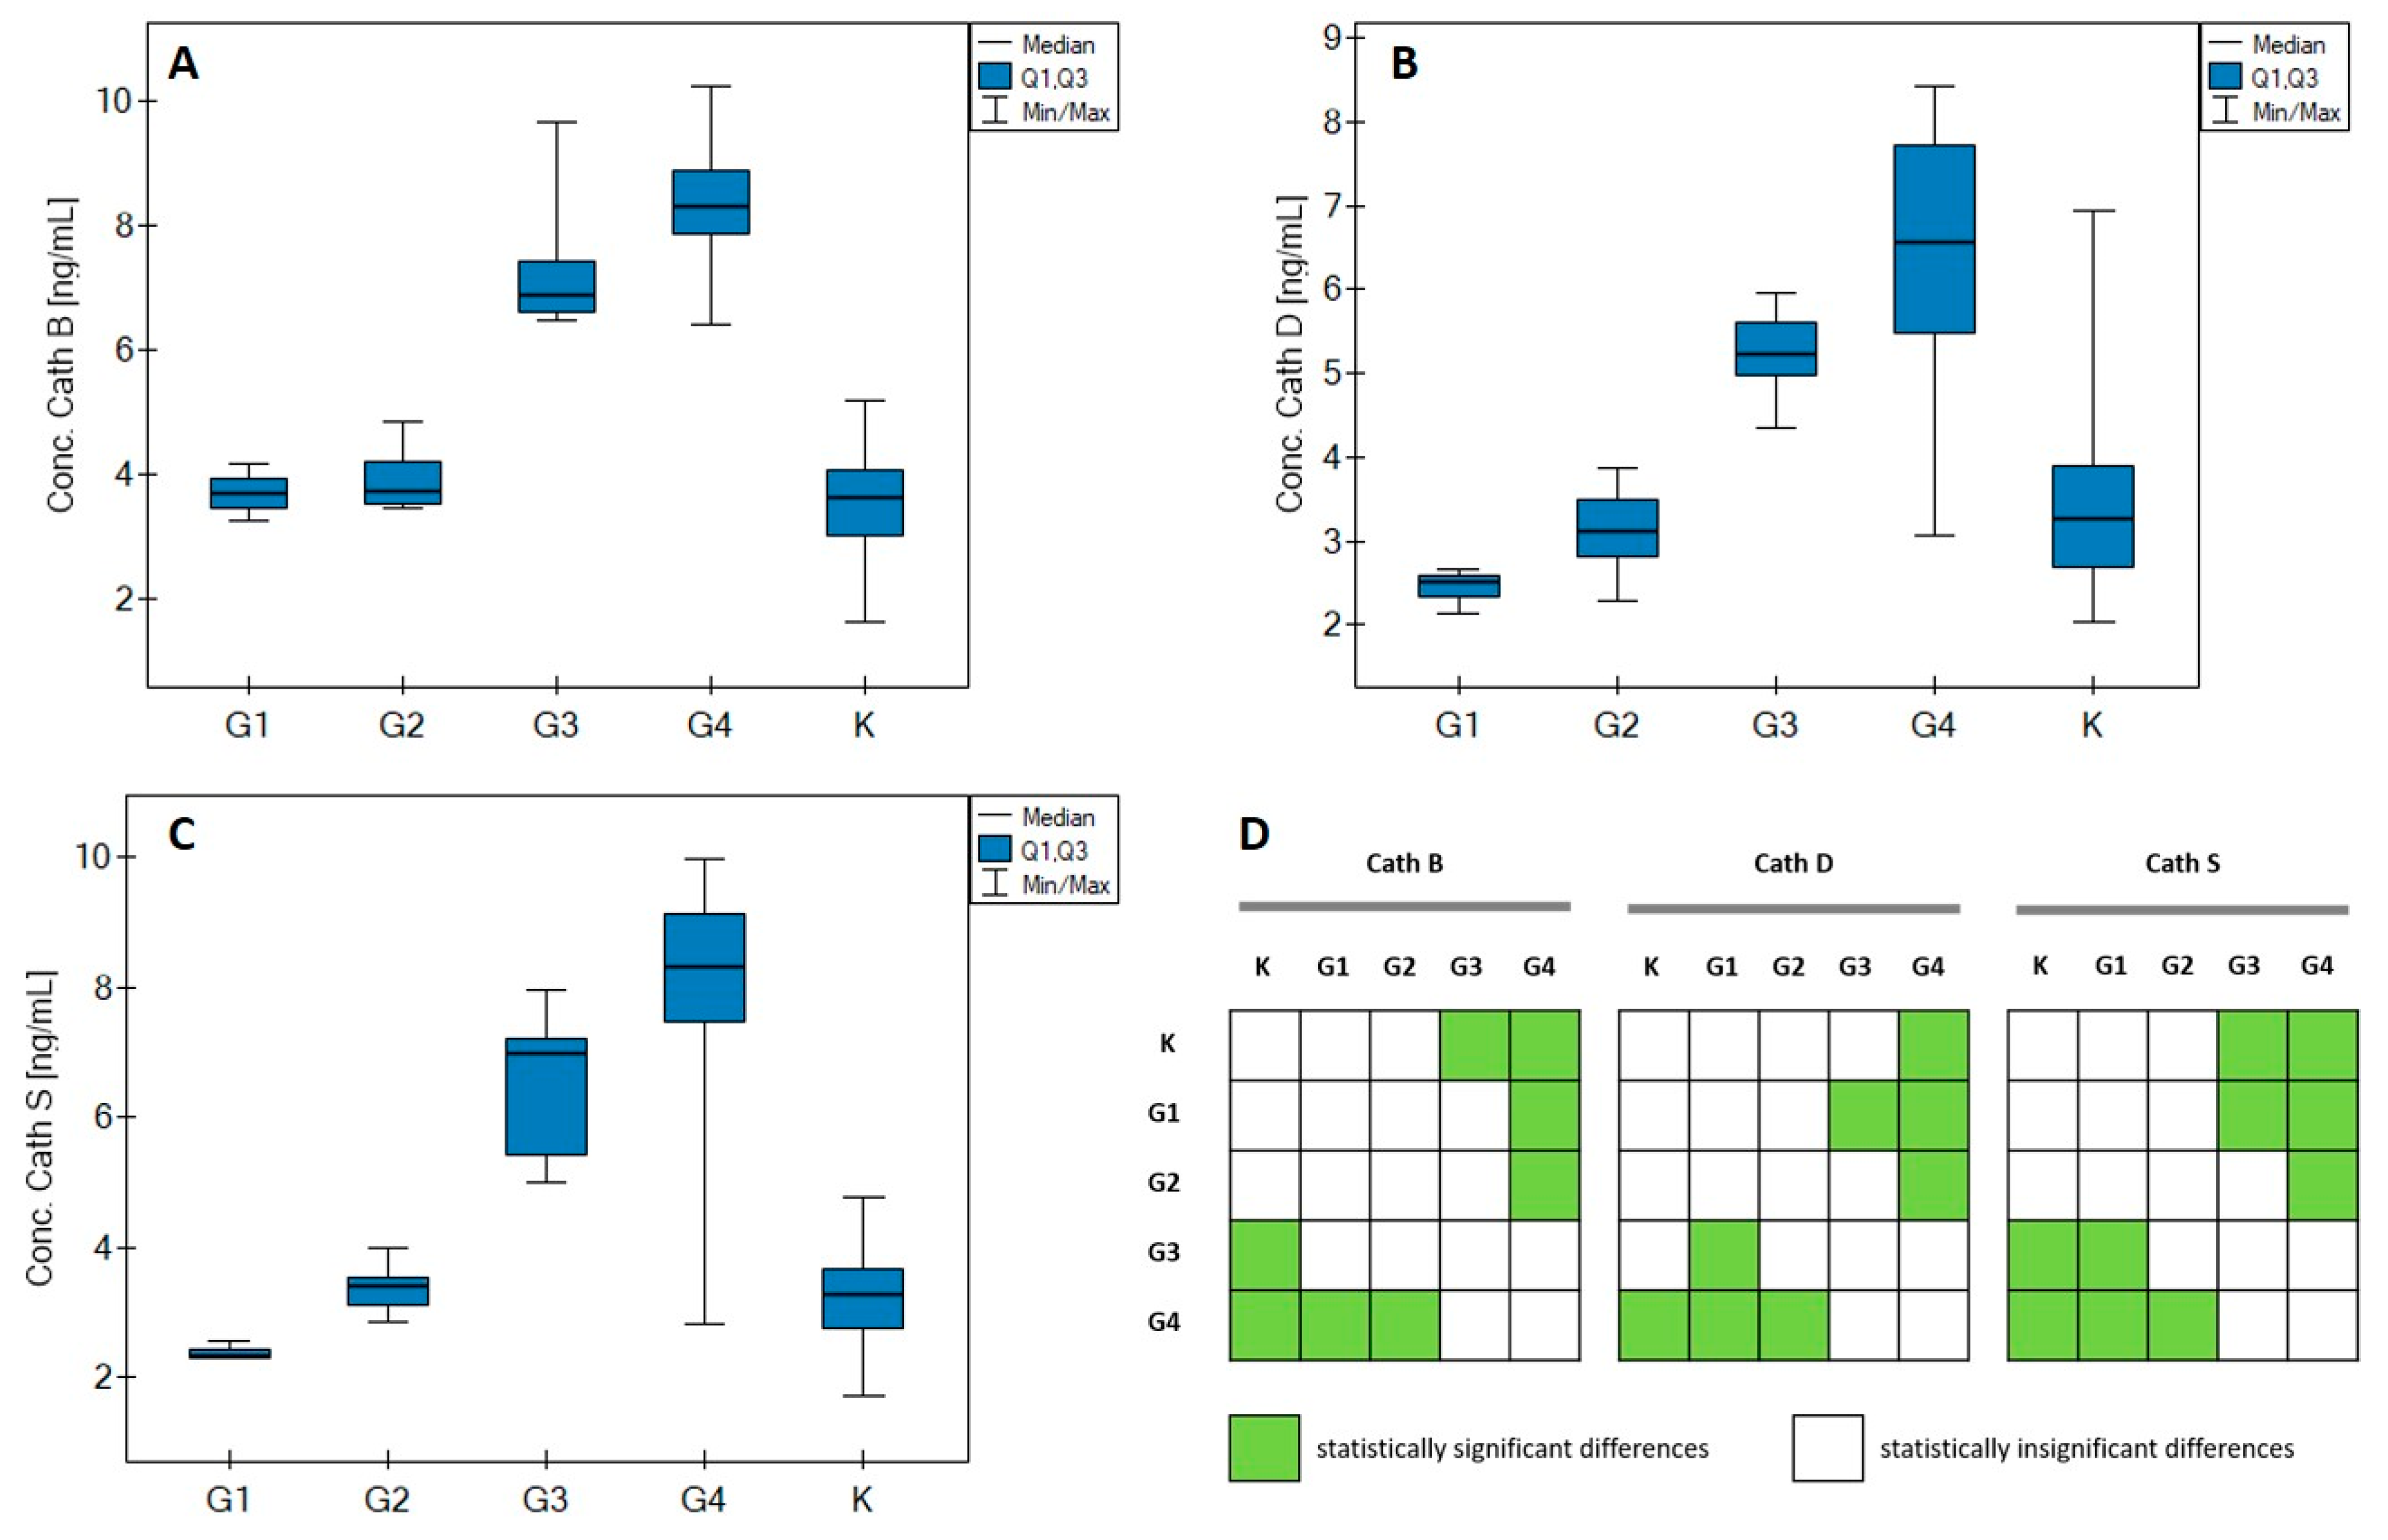
3.1. Statistical Analysis
3.2. Correlations
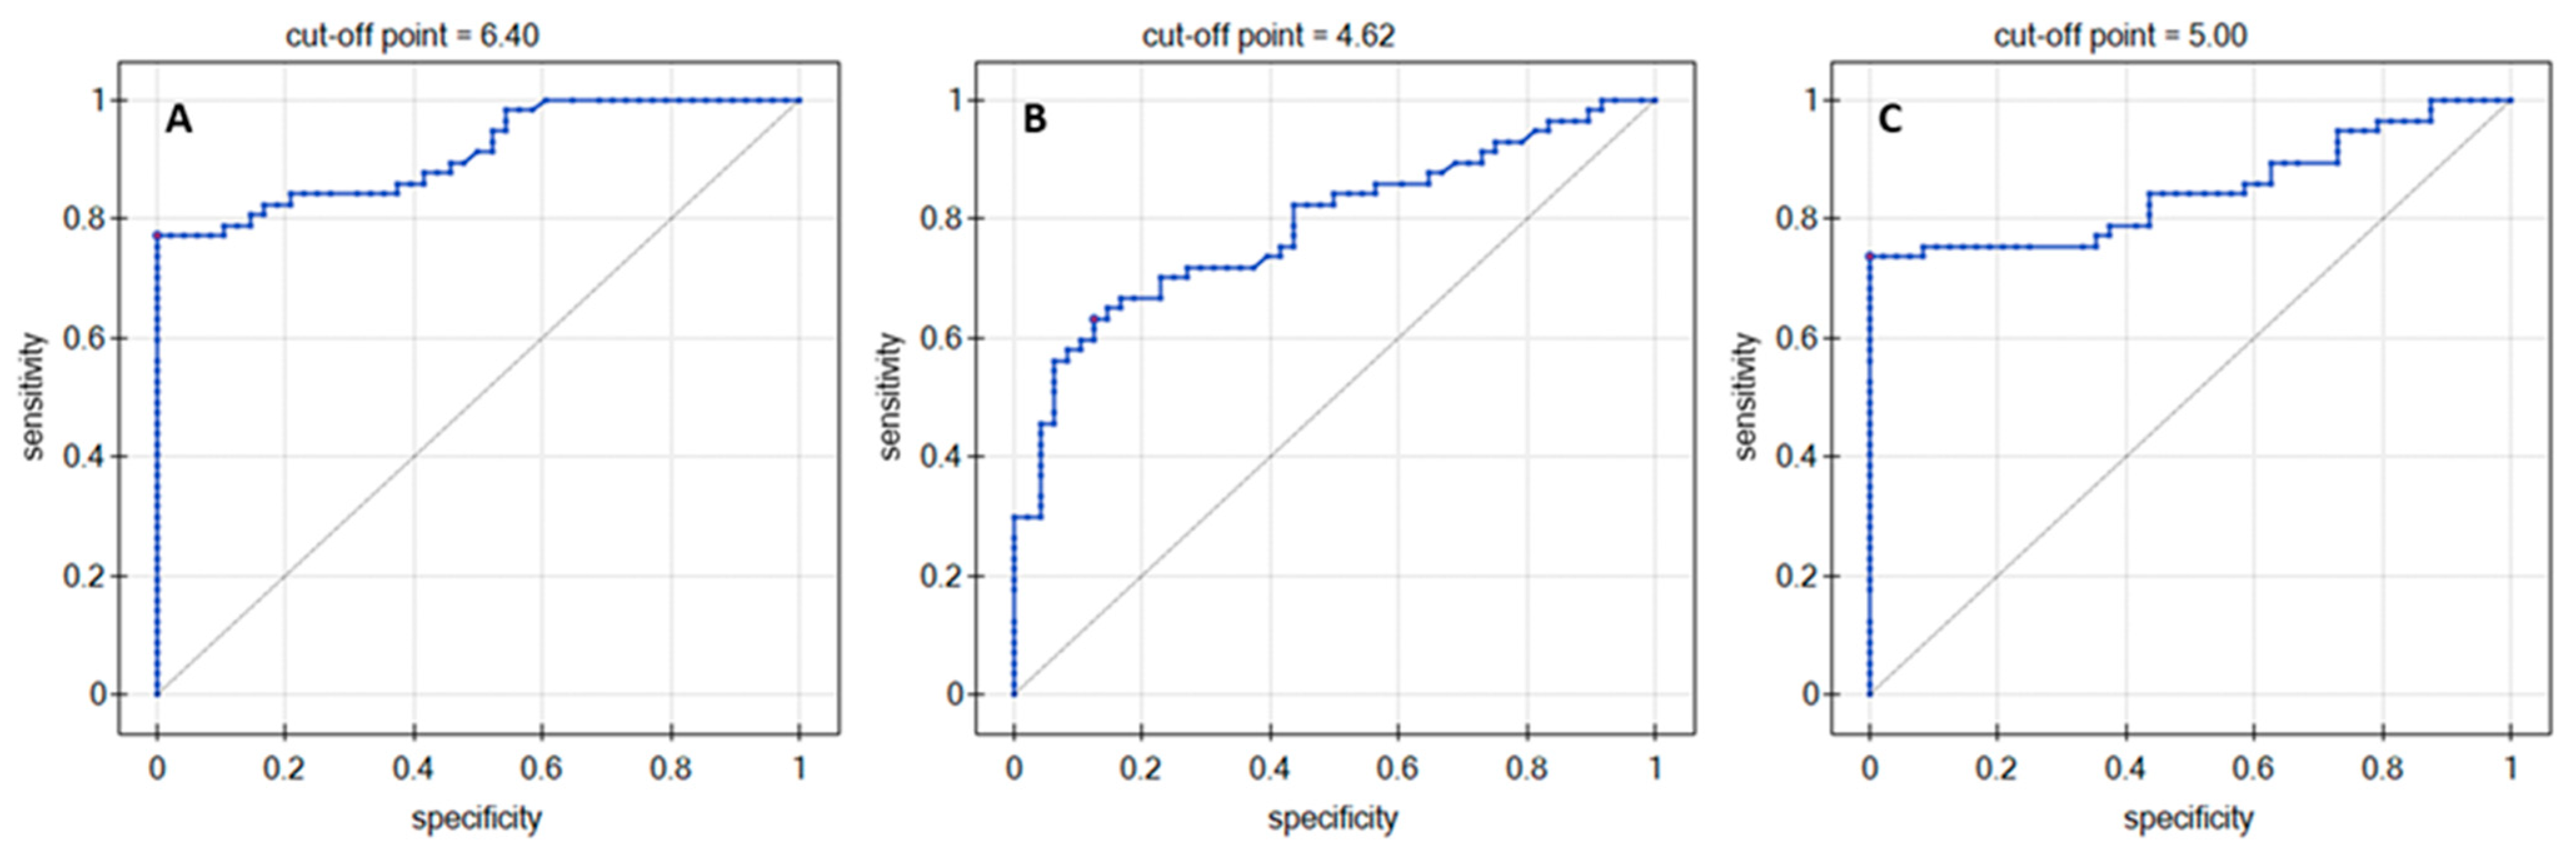
3.3. ROC Analysis
4. Discussion and Conclusions
Author Contributions
Funding
Institutional Review Board Statement
Informed Consent Statement
Data Availability Statement
Acknowledgments
Conflicts of Interest
Appendix A


| Parameter/Biomarker | Cath B [ng/mL] | Cath D [ng/mL] | Cath S [ng/mL] | ||||||||||||
|---|---|---|---|---|---|---|---|---|---|---|---|---|---|---|---|
| Control | G1 | G2 | G3 | G4 | Control | G1 | G2 | G3 | G4 | Control | G1 | G2 | G3 | G4 | |
| Median | 3.62 | 3.68 | 3.72 | 6.87 | 8.31 | 3.27 | 2.51 | 3.11 | 5.22 | 6.56 | 3.26 | 2.32 | 3.40 | 6.98 | 8.32 |
| Q1 | 3.00 | 3.47 | 3.52 | 6.60 | 7.85 | 2.69 | 2.32 | 2.82 | 4.97 | 5.49 | 2.76 | 2.31 | 3.09 | 5.42 | 7.45 |
| Q3 | 4.05 | 3.93 | 4.19 | 7.42 | 8.88 | 3.90 | 2.59 | 3.50 | 5.62 | 7.72 | 3.66 | 2.43 | 3.54 | 7.22 | 9.12 |
| MIN | 1.62 | 3.25 | 3.44 | 6.46 | 6.40 | 2.03 | 2.13 | 2.27 | 4.36 | 3.07 | 1.71 | 2.30 | 2.86 | 5.00 | 2.81 |
| MAX | 5.18 | 4.17 | 4.83 | 9.66 | 10.23 | 6.95 | 2.66 | 3.88 | 5.97 | 8.43 | 4.78 | 2.54 | 3.98 | 7.97 | 9.97 |
| Age–Cath B | |||||
| G1 | G2 | G3 | G4 | All samples | |
| RSpearman | 0.5 | −0.27 | −0.14 | 0.05 | 0.44 |
| p | >0.05 | >0.05 | >0.05 | >0.05 | <0.01 |
| Age–Cath D | |||||
| G1 | G2 | G3 | G4 | All samples | |
| RSpearman | - | 0.06 | 0.46 | −0.03 | 0.44 |
| p | - | >0.05 | >0.05 | >0.05 | <0.05 |
| Age–Cath S | |||||
| G1 | G2 | G3 | G4 | All samples | |
| RSpearman | - | −0.34 | 0.05 | −0.03 | 0.41 |
| p | - | >0.05 | >0.05 | >0.05 | <0.01 |
| Tumor size–Cath B | |||||
| G1 | G2 | G3 | G4 | All samples | |
| RSpearman | - | −0.4 | −0.2 | −0.06 | −0.11 |
| p | - | >0.05 | >0.05 | >0.05 | >0.05 |
| Tumor size–Cath D | |||||
| G1 | G2 | G3 | G4 | All samples | |
| RSpearman | - | - | - | 0.02 | −0.04 |
| p | - | - | - | >0.05 | >0.05 |
| Tumor size–Cath S | |||||
| G1 | G2 | G3 | G4 | All samples | |
| RSpearman | - | −0.8 | 0.2 | −0.29 | −0.18 |
| p | - | >0.05 | >0.05 | >0.05 | >0.05 |
| G1 | |||
| Cath S–Cath B | Cath S–Cath D | Cath B–Cath D | |
| RSpearman | −0.5 | - | −0.5 |
| p | >0.05 | - | >0.5 |
| G2 | |||
| Cath S–Cath B | Cath S–Cath D | Cath B–Cath D | |
| RSpearman | 0.55 | −0.72 | −0.71 |
| p | >0.05 | <0.01 | <0.05 |
| G3 | |||
| Cath S–Cath B | Cath S–Cath D | Cath B–Cath D | |
| RSpearman | −0.61 | −0.35 | 0.03 |
| p | >0.05 | >0.05 | >0.05 |
| G4 | |||
| Cath S–Cath B | Cath S–Cath D | Cath B–Cath D | |
| RSpearman | −0.13 | 0.25 | −0.07 |
| p | >0.05 | >0.05 | >0.05 |
| All samples | |||
| Cath S–Cath B | Cath S–Cath D | Cath B–Cath D | |
| RSpearman | 0.54 | 0.66 | 0.54 |
| p | <<0.01 | <<0.01 | <<0.01 |
References
- Weller, M.; van den Bent, M.; Preusser, M.; le Rhun, E.; Tonn, J.C.; Minniti, G.; Bendszus, M.; Balana, C.; Chinot, O.; Dirven, L.; et al. EANO Guidelines on the Diagnosis and Treatment of Diffuse Gliomas of Adulthood. Nat. Rev. Clin. Oncol. 2021, 18, 170–186. [Google Scholar] [CrossRef] [PubMed]
- Ostrom, Q.T.; Gittleman, H.; Fulop, J.; Liu, M.; Blanda, R.; Kromer, C.; Wolinsky, Y.; Kruchko, C.; Barnholtz-Sloan, J.S. CBTRUS Statistical Report: Primary Brain and Central Nervous System Tumors Diagnosed in the United States in 2008–2012. Neuro Oncol. 2015, 17, iv1–iv62. [Google Scholar] [CrossRef] [PubMed]
- Louis, D.N.; Ohgaki, H.; Wiestler, O.D.; Cavenee, W.K.; Burger, P.C.; Jouvet, A.; Scheithauer, B.W.; Kleihues, P. The 2007 WHO Classification of Tumours of the Central Nervous System. Acta Neuropathol. 2007, 114, 97–109. [Google Scholar] [CrossRef]
- Stupp, R.; Hegi, M.E.; Mason, W.P.; van den Bent, M.J.; Taphoorn, M.J.; Janzer, R.C.; Ludwin, S.K.; Allgeier, A.; Fisher, B.; Belanger, K.; et al. Effects of Radiotherapy with Concomitant and Adjuvant Temozolomide versus Radiotherapy Alone on Survival in Glioblastoma in a Randomised Phase III Study: 5-Year Analysis of the EORTC-NCIC Trial. Lancet Oncol. 2009, 10, 459–466. [Google Scholar] [CrossRef]
- Silantyev, A.S.; Falzone, L.; Libra, M.; Gurina, O.I.; Kardashova, K.S.; Nikolouzakis, T.K.; Nosyrev, A.E.; Sutton, C.W.; Mitsias, P.D.; Tsatsakis, A.; et al. Cells Current and Future Trends on Diagnosis and Prognosis of Glioblastoma: From Molecular Biology to Proteomics. Cells 2019, 8, 863. [Google Scholar] [CrossRef]
- Posti, J.P.; Bori, M.; Kauko, T.; Sankinen, M.; Nordberg, J.; Rahi, M.; Frantzén, J.; Vuorinen, V.; Sipilä, J.O.T. Presenting Symptoms of Glioma in Adults. Acta Neurol. Scand. 2015, 131, 88–93. [Google Scholar] [CrossRef] [PubMed]
- Mondal, A.; Singh, D.K.; Panda, S.; Shiras, A. Extracellular Vesicles as Modulators of Tumor Microenvironment and Disease Progression in Glioma. Front. Oncol. 2017, 7, 144. [Google Scholar] [CrossRef]
- Gocheva, V.; Joyce, J.A. Cysteine Cathepsins and the Cutting Edge of Cancer Invasion. Cell Cycle 2007, 6, 60–64. [Google Scholar] [CrossRef]
- Eeckhout, Y.; Vaes, G. Further Studies on the Activation of Procollagenase, the Latent Precursor of Bone Collagenase. Effects of Lysosomal Cathepsin B, Plasmin and Kallikrein, and Spontaneous Activation. Biochem. J. 1977, 166, 21–31. [Google Scholar] [CrossRef]
- Bischof, J.; Westhoff, M.A.; Wagner, J.E.; Halatsch, M.E.; Trentmann, S.; Knippschild, U.; Wirtz, C.R.; Burster, T. Cancer Stem Cells: The Potential Role of Autophagy, Proteolysis, and Cathepsins in Glioblastoma Stem Cells. Tumor Biol. 2017, 39, 1010428317692227. [Google Scholar] [CrossRef]
- Colin, C.; Voutsinos-Porche, B.; Nanni, I.; Fina, F.; Metellus, P.; Intagliata, D.; Baeza, N.; Bouvier, C.; Delfino, C.; Loundou, A.; et al. High Expression of Cathepsin B and Plasminogen Activator Inhibitor Type-1 Are Strong Predictors of Survival in Glioblastomas. Acta Neuropathol. 2009, 118, 745–754. [Google Scholar] [CrossRef] [PubMed]
- Mikkelsen, T.; Yan, P.S.; Ho, K.L.; Sameni, M.; Sloane, B.F.; Rosenblum, M.L. Immunolocalization of Cathepsin B in Human Glioma: Implications for Tumor Invasion and Angiogenesis. J. Neurosurg. 1995, 83, 285–290. [Google Scholar] [CrossRef] [PubMed]
- Fukuda, M.E.; Iwadate, Y.; Machida, T.; Hiwasa, T.; Nimura, Y.; Nagai, Y.; Takiguchi, M.; Tanzawa, H.; Yamaura, A.; Seki, N. Cathepsin D Is a Potential Serum Marker for Poor Prognosis in Glioma Patients. Cancer Res. 2005, 65, 5190–5194. [Google Scholar] [CrossRef] [PubMed]
- Koh, S.P.; Wickremesekera, A.C.; Brasch, H.D.; Marsh, R.; Tan, S.T.; Itinteang, T. Expression of Cathepsins B, D, and G in Isocitrate Dehydrogenase-Wildtype Glioblastoma. Front. Surg. 2017, 4, 28. [Google Scholar] [CrossRef] [PubMed]
- Zheng, W.; Chen, Q.; Wang, C.; Yao, D.; Zhu, L.; Pan, Y.; Zhang, J.; Bai, Y.; Shao, C. Inhibition of Cathepsin D (CTSD) Enhances Radiosensitivity of Glioblastoma Cells by Attenuating Autophagy. Mol. Carcinog. 2020, 59, 651–660. [Google Scholar] [CrossRef]
- Quesnel, A.; Karagiannis, G.S.; Filippou, P.S. Extracellular Proteolysis in Glioblastoma Progression and Therapeutics. Biochim. Biophys. Acta 2020, 1874, 188428. [Google Scholar] [CrossRef]
- Flannery, T.; Gibson, D.; Mirakhur, M.; McQuaid, S.; Greenan, C.; Trimble, A.; Walker, B.; McCormick, D.; Johnston, P.G. The Clinical Significance of Cathepsin S Expression in Human Astrocytomas. Am. J. Pathol. 2003, 163, 175–182. [Google Scholar] [CrossRef][Green Version]
- Wang, D.; Loo, J.F.C.; Chen, J.; Yam, Y.; Chen, S.C.; He, H.; Kong, S.K.; Ho, H.P. Recent Advances in Surface Plasmon Resonance Imaging Sensors. Sensors 2019, 19, 1266. [Google Scholar] [CrossRef]
- Pattnaik, P. Surface Plasmon Resonance: Applications in Understanding Receptor—Ligand Interaction. Appl. Biochem. Biotechnol. 2005, 126, 79–92. [Google Scholar] [CrossRef]
- Szymanska, B.; Lukaszewski, Z.; Zelazowska-Rutkowska, B.; Hermanowicz-Szamatowicz, K.; Gorodkiewicz, E. An Spri Biosensor for Determination of the Ovarian Cancer Marker He4 in Human Plasma. Sensors 2021, 21, 3567. [Google Scholar] [CrossRef]
- Bogdan, S.; Puścion-Jakubik, A.; Klimiuk, K.; Socha, K.; Kochanowicz, J.; Gorodkiewicz, E. UCHL1 and Proteasome in Blood Serum in Relation to Dietary Habits, Concentration of Selected Antioxidant Minerals and Total Antioxidant Status among Patients with Alzheimer’s Disease. J. Clin. Med. 2022, 11, 412. [Google Scholar] [CrossRef] [PubMed]
- Falkowski, P.; Mrozek, P.; Miluski, P.; Lukaszewski, Z.; Gorodkiewicz, E. A Comparison of Various Chips Used for the Manufacture of Biosensors Applied in Non-Fluidic Array SPRi, Based on the Example of Determination of Cathepsin D. Biosensors 2022, 12, 21. [Google Scholar] [CrossRef] [PubMed]
- Falkowski, P.; Mrozek, P.; Lukaszewski, Z.; Oldak, L.; Gorodkiewicz, E. An Immunosensor for the Determination of Cathepsin s in Blood Plasma by Array Spri—A Comparison of Analytical Properties of Silver–Gold and Pure Gold Chips. Biosensors 2021, 11, 298. [Google Scholar] [CrossRef]
- Gorodkiewicz, E. Surface Plasmon Resonance Imaging Sensor for Cathepsin Determination Based on Immobilized Cystatin. Protein Pept. Lett. 2009, 16, 23–29. [Google Scholar] [CrossRef] [PubMed]
- Gorodkiewicz, E.; Regulska, E. SPR Imaging Biosensor for Aspartyl Cathepsins: Sensor Development and Application for Biological Material. Protein Pept. Lett. 2010, 17, 1148–1154. [Google Scholar] [CrossRef] [PubMed]
- Oldak, L.; Sankiewicz, A.; Żelazowska-Rutkowska, B.; Cylwik, B.; Lukaszewski, Z.; Skoczylas, M.; Gorodkiewicz, E. Two SPRi Biosensors for the Determination of Cathepsin S in Blood Plasma. Talanta 2021, 225, 121900. [Google Scholar] [CrossRef]
- Pillet, F.; Romera, C.; Trévisiol, E.; Bellon, S.; Teulade-Fichou, M.P.; Franois, J.M.; Pratviel, G.; Leberre, V.A. Surface Plasmon Resonance Imaging (SPRi) as an Alternative Technique for Rapid and Quantitative Screening of Small Molecules, Useful in Drug Discovery. Sens. Actuators B Chem. 2011, 157, 304–309. [Google Scholar] [CrossRef]
- Puiu, M.; Bala, C. SPR and SPR Imaging: Recent Trends in Developing Nanodevices for Detection and Real-Time Monitoringof Biomolecular Events. Sensors 2016, 16, 870. [Google Scholar] [CrossRef]
- Tan, G.-J.; Peng, Z.-K.; Lu, J.-P.; Tang, F.-Q. Cathepsins Mediate Tumor Metastasis. World J. Biol. Chem. 2013, 4, 91–101. [Google Scholar] [CrossRef]
- Masson, J.F. Surface Plasmon Resonance Clinical Biosensors for Medical Diagnostics. ACS Sens. 2017, 2, 16–30. [Google Scholar] [CrossRef]
- Merkaj, S.; Bahar, R.C.; Zeevi, T.; Lin, M.; Ikuta, I.; Bousabarah, K.; Cassinelli Petersen, G.I.; Staib, L.; Payabvash, S.; Mongan, J.T.; et al. Review Machine Learning Tools for Image-Based Glioma Grading and the Quality of Their Reporting: Challenges and Opportunities. Cancers 2022, 14, 2623. [Google Scholar] [CrossRef] [PubMed]


| Control Group/Tumor Grade | |||||||
|---|---|---|---|---|---|---|---|
| Variable | Control n = 48 | G1 n = 3 | G2 n = 10 | G3 n = 7 | G4 n = 37 | Age Difference between Control and G1–G4 A | |
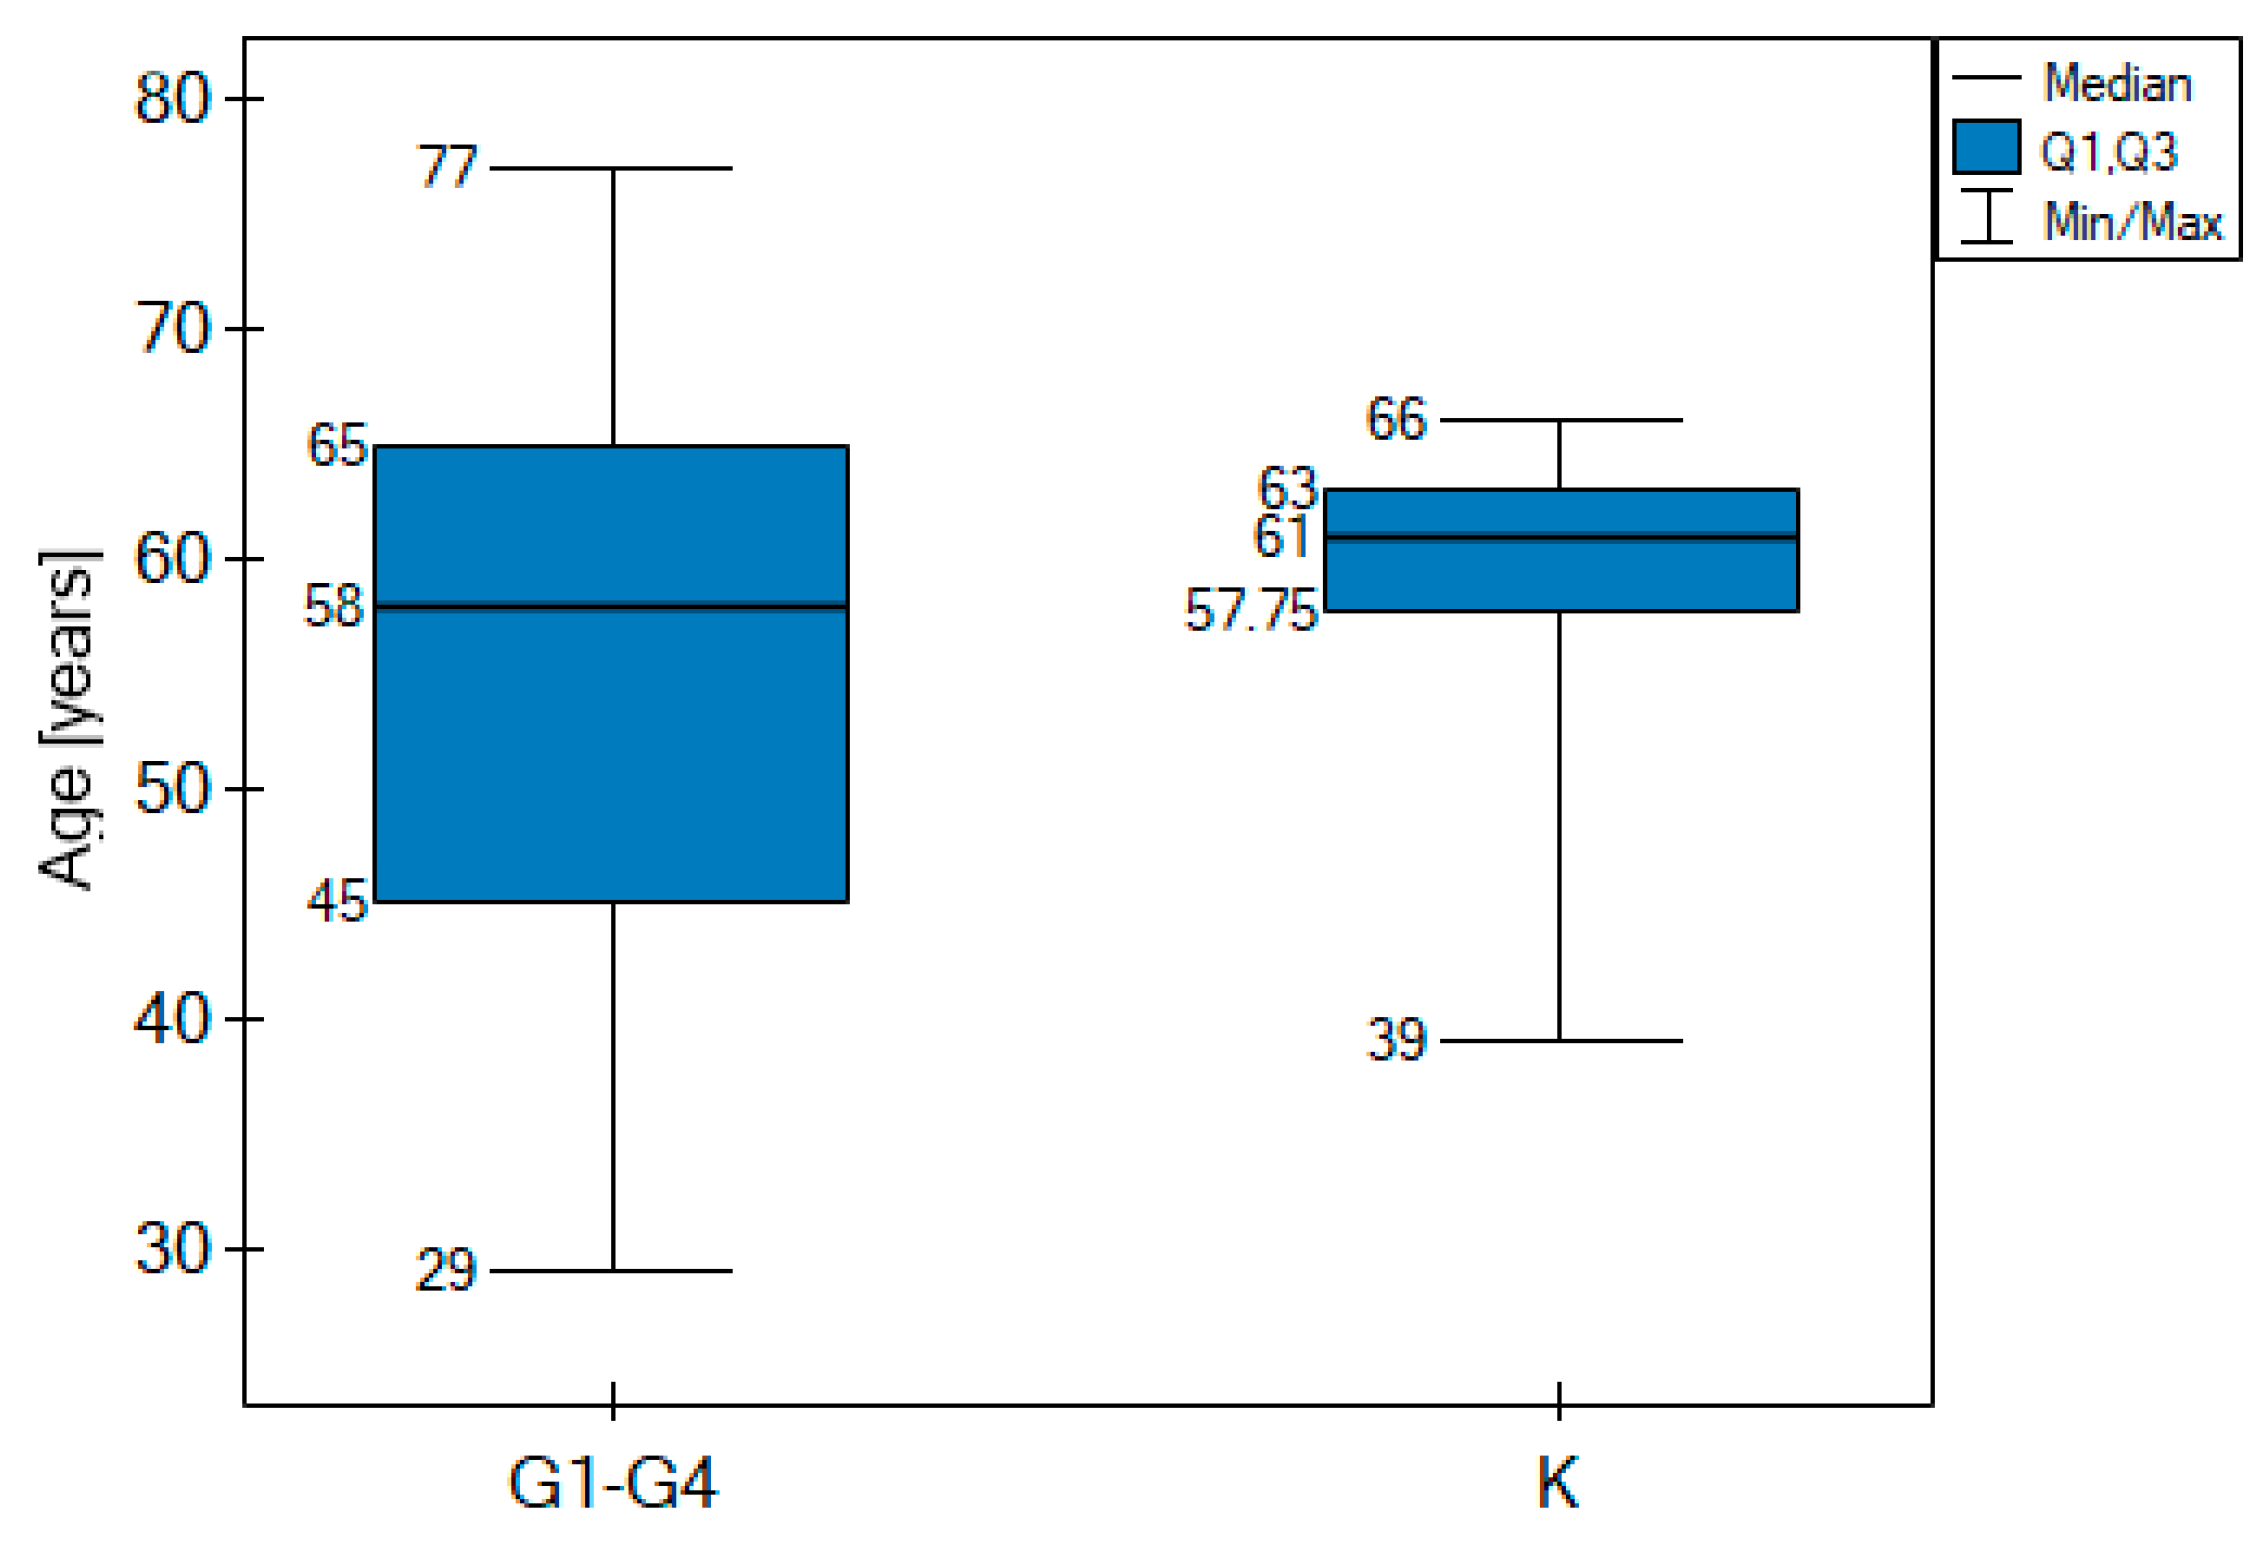
| Age [years] | range | 39–66 | 29–43 | 30–57 | 38–72 | 33–77 | No statistically significant difference (p > 0.05) |
| median | 61 | 39 | 43.5 | 45 | 60 | ||
| 61 | 58 | ||||||
| Gender | male | 27 | 1 | 5 | 3 | 26 | |
| female | 21 | 2 | 5 | 4 | 11 | ||
| Tumor size [cm2] | <15 | 2 | 2 | 3 | 10 | ||
| >15 | 1 | 2 | 1 | 10 | |||
| The presence of other neo-plasms in the immediate family | yes | 0 | 6 | 3 | 17 | ||
| no | 3 | 4 | 4 | 20 | |||
| Concomitant non-cancerous diseases | yes | 2 | 3 | 3 | 21 | ||
| no | 1 | 7 | 4 | 16 | |||
| Histological type of tumors | oligodendroglial | 0 | 1 | 3 | 0 | ||
| astrocytic | 3 | 9 | 4 | 37 | |||
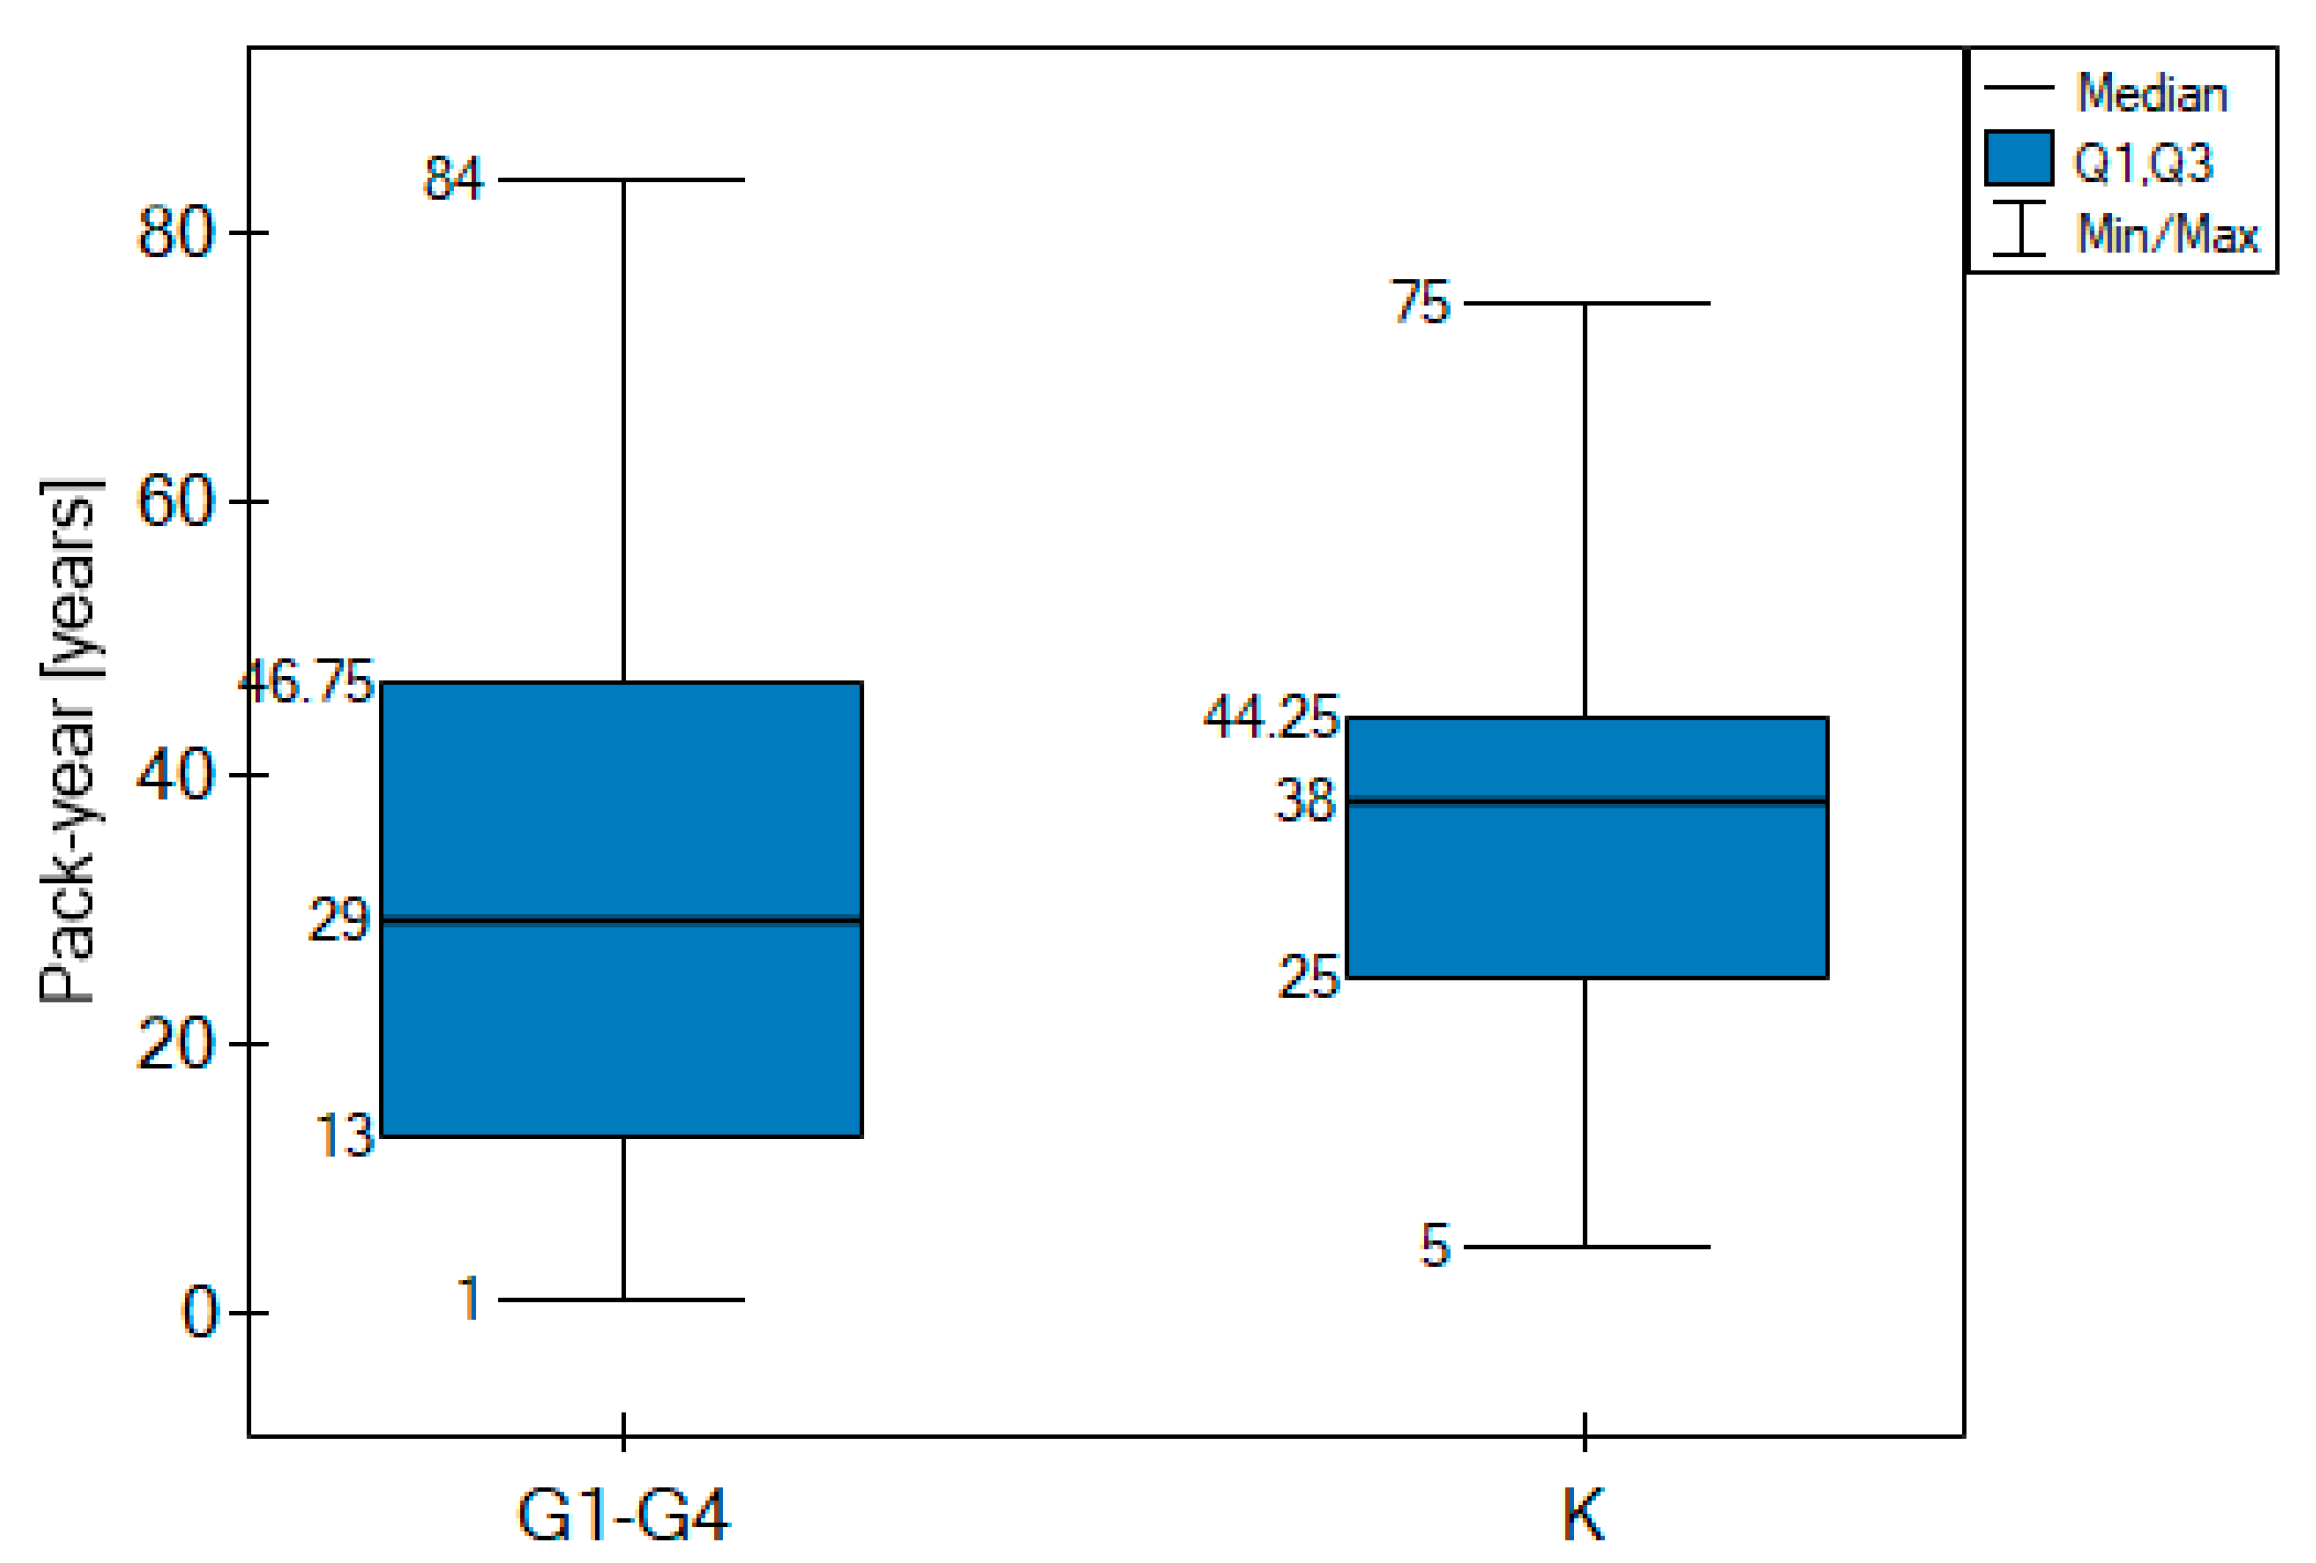
| Number of smokers | Number of cases | 48 | 1 | 6 | 4 | 22 | Pack-years difference between control and G1–G4 B |
| Pack-year (median) | 38 | 0 C | 8 | 26 | 38.5 | No statistically significant difference (p > 0.05) | |
| 38 | 29 | ||||||
| IDH 1/2 mutation | yes | 0 | 10 | 5 | 10 | ||
| no | 3 | 0 | 2 | 27 | |||
| p53 mutation | yes | 1 | 10 | 7 | 34 | ||
| no | 2 | 0 | 0 | 3 | |||
| EGFR expression | yes | 0 | 6 | 2 | 29 | ||
| no | 3 | 4 | 5 | 8 | |||
| Parameter | Cath B Concentration [ng/mL] | Cath D Concentration [ng/mL] | Cath S Concentration [ng/mL] | ||||||
|---|---|---|---|---|---|---|---|---|---|
| Range | Median | p-Value | Range | Median | p-Value | Range | Median | p-Value | |
| Tumor grade (G1–G2 vs. G3–G4) | |||||||||
| G1 (3) | 3.25–4.17 | 3.68 | <<0.01 | 2.13–2.66 | 2.51 | <<0.01 | 2.30–2.54 | 2.32 | <<0.01 |
| G2 (10) | 3.44–4.83 | 3.72 | 2.27–3.88 | 3.11 | 2.86–3.98 | 3.40 | |||
| G3 (7) | 6.46–9.66 | 6.87 | 4.36–5.97 | 5.22 | 5.00–7.97 | 6.98 | |||
| G4 (37) | 6.40–10.23 | 8.31 | 3.07–8.43 | 6.56 | 2.81–9.97 | 8.32 | |||
| Tumor size [cm2] | |||||||||
| <15 (17) | 3.25–9.66 | 8.02 | 0.835 (NS) | 2.51–8.36 | 5.62 | 0.677 (NS) | 2.32–9.97 | 7.97 | 0.427 (NS) |
| >15 (14) | 3.45–9.43 | 7.91 | 2.66–8.07 | 5.56 | 2.54–9.65 | 7.45 | |||
| The presence of other neoplasms in the family | |||||||||
| YES (26) | 3.45–10.23 | 7.91 | 0.949 (NS) | 2.94–7.72 | 5.49 | 0.563 (NS) | 2.81–9.61 | 7.22 | 0.955 (NS) |
| NO (29) | 3.25–9.66 | 7.75 | 2.13–8.43 | 5.98 | 2.30–9.97 | 7.54 | |||
| Concomitant non-cancerous diseases | |||||||||
| YES (29) | 3.25–9.58 | 7.83 | 0.805 (NS) | 2.27–8.43 | 5.79 | 0.643 (NS) | 2.32–9.97 | 7.64 | 0.420 (NS) |
| NO (28) | 3.44–10.23 | 7.91 | 2.13–8.07 | 5.56 | 2.30–9.65 | 7.22 | |||
| AUC | p-Value | PPV [%] | NPV [%] | Sensitivity [%] | Specificity [%] | Cut-Off Point | |
|---|---|---|---|---|---|---|---|
| Cath B | 0.91 | <0.001 | 100.0 | 78.7 | 77.2 | 100 | 6.40 |
| Cath D | 0.79 | <0.001 | 85.7 | 66.7 | 63.2 | 87.5 | 4.62 |
| Cath S | 0.85 | <0.001 | 100.0 | 76.2 | 73.7 | 100 | 5.00 |
Publisher’s Note: MDPI stays neutral with regard to jurisdictional claims in published maps and institutional affiliations. |
© 2022 by the authors. Licensee MDPI, Basel, Switzerland. This article is an open access article distributed under the terms and conditions of the Creative Commons Attribution (CC BY) license (https://creativecommons.org/licenses/by/4.0/).
Share and Cite
Oldak, L.; Milewska, P.; Chludzinska-Kasperuk, S.; Grubczak, K.; Reszec, J.; Gorodkiewicz, E. Cathepsin B, D and S as Potential Biomarkers of Brain Glioma Malignancy. J. Clin. Med. 2022, 11, 6763. https://doi.org/10.3390/jcm11226763
Oldak L, Milewska P, Chludzinska-Kasperuk S, Grubczak K, Reszec J, Gorodkiewicz E. Cathepsin B, D and S as Potential Biomarkers of Brain Glioma Malignancy. Journal of Clinical Medicine. 2022; 11(22):6763. https://doi.org/10.3390/jcm11226763
Chicago/Turabian StyleOldak, Lukasz, Patrycja Milewska, Sylwia Chludzinska-Kasperuk, Kamil Grubczak, Joanna Reszec, and Ewa Gorodkiewicz. 2022. "Cathepsin B, D and S as Potential Biomarkers of Brain Glioma Malignancy" Journal of Clinical Medicine 11, no. 22: 6763. https://doi.org/10.3390/jcm11226763
APA StyleOldak, L., Milewska, P., Chludzinska-Kasperuk, S., Grubczak, K., Reszec, J., & Gorodkiewicz, E. (2022). Cathepsin B, D and S as Potential Biomarkers of Brain Glioma Malignancy. Journal of Clinical Medicine, 11(22), 6763. https://doi.org/10.3390/jcm11226763