
Current Advances in Lung Ultrasound in COVID-19 Critically Ill Patients: A Narrative Review


Abstract
:1. Introduction
2. Technique and Practical Approach
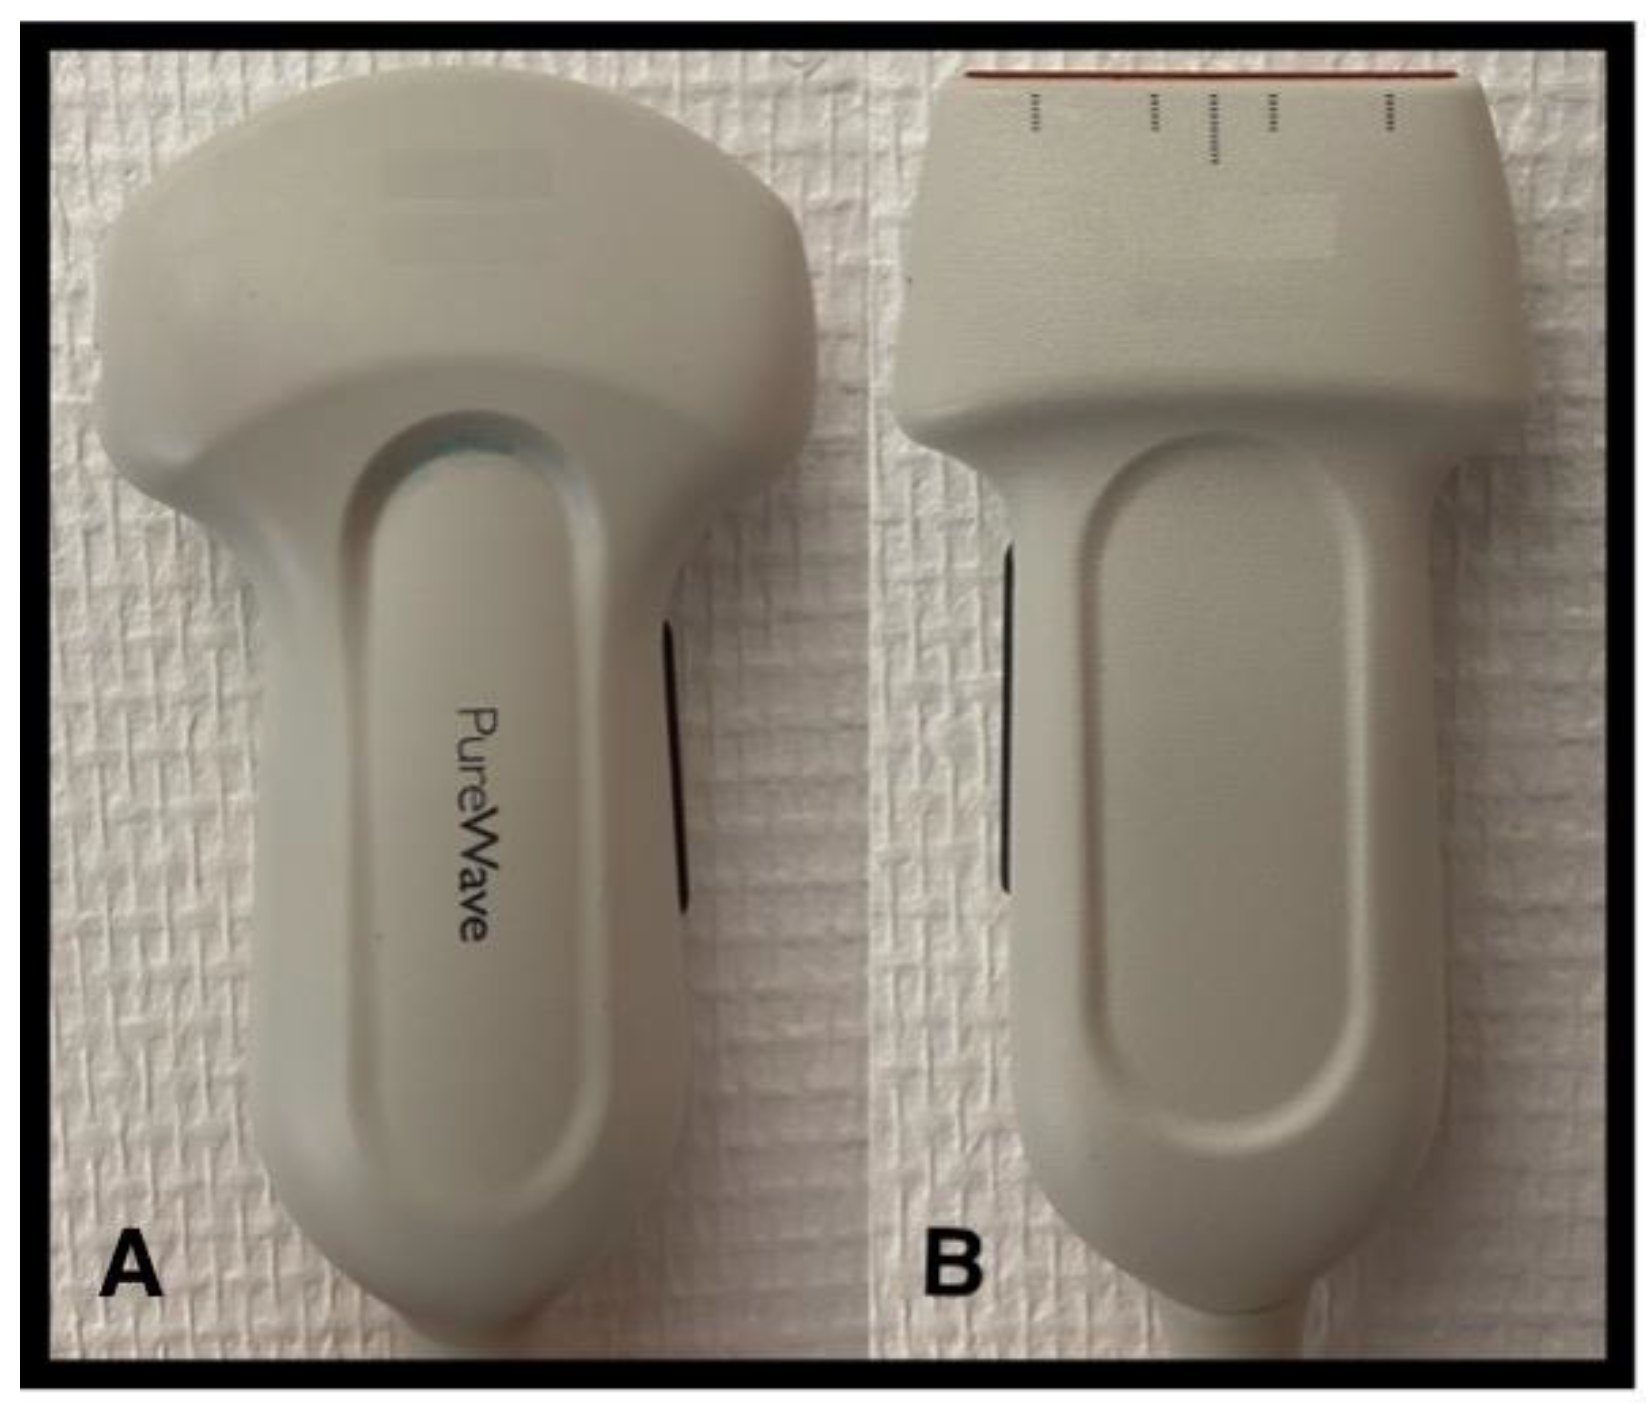
2.1. Which Probe to Choose and How to Use It?
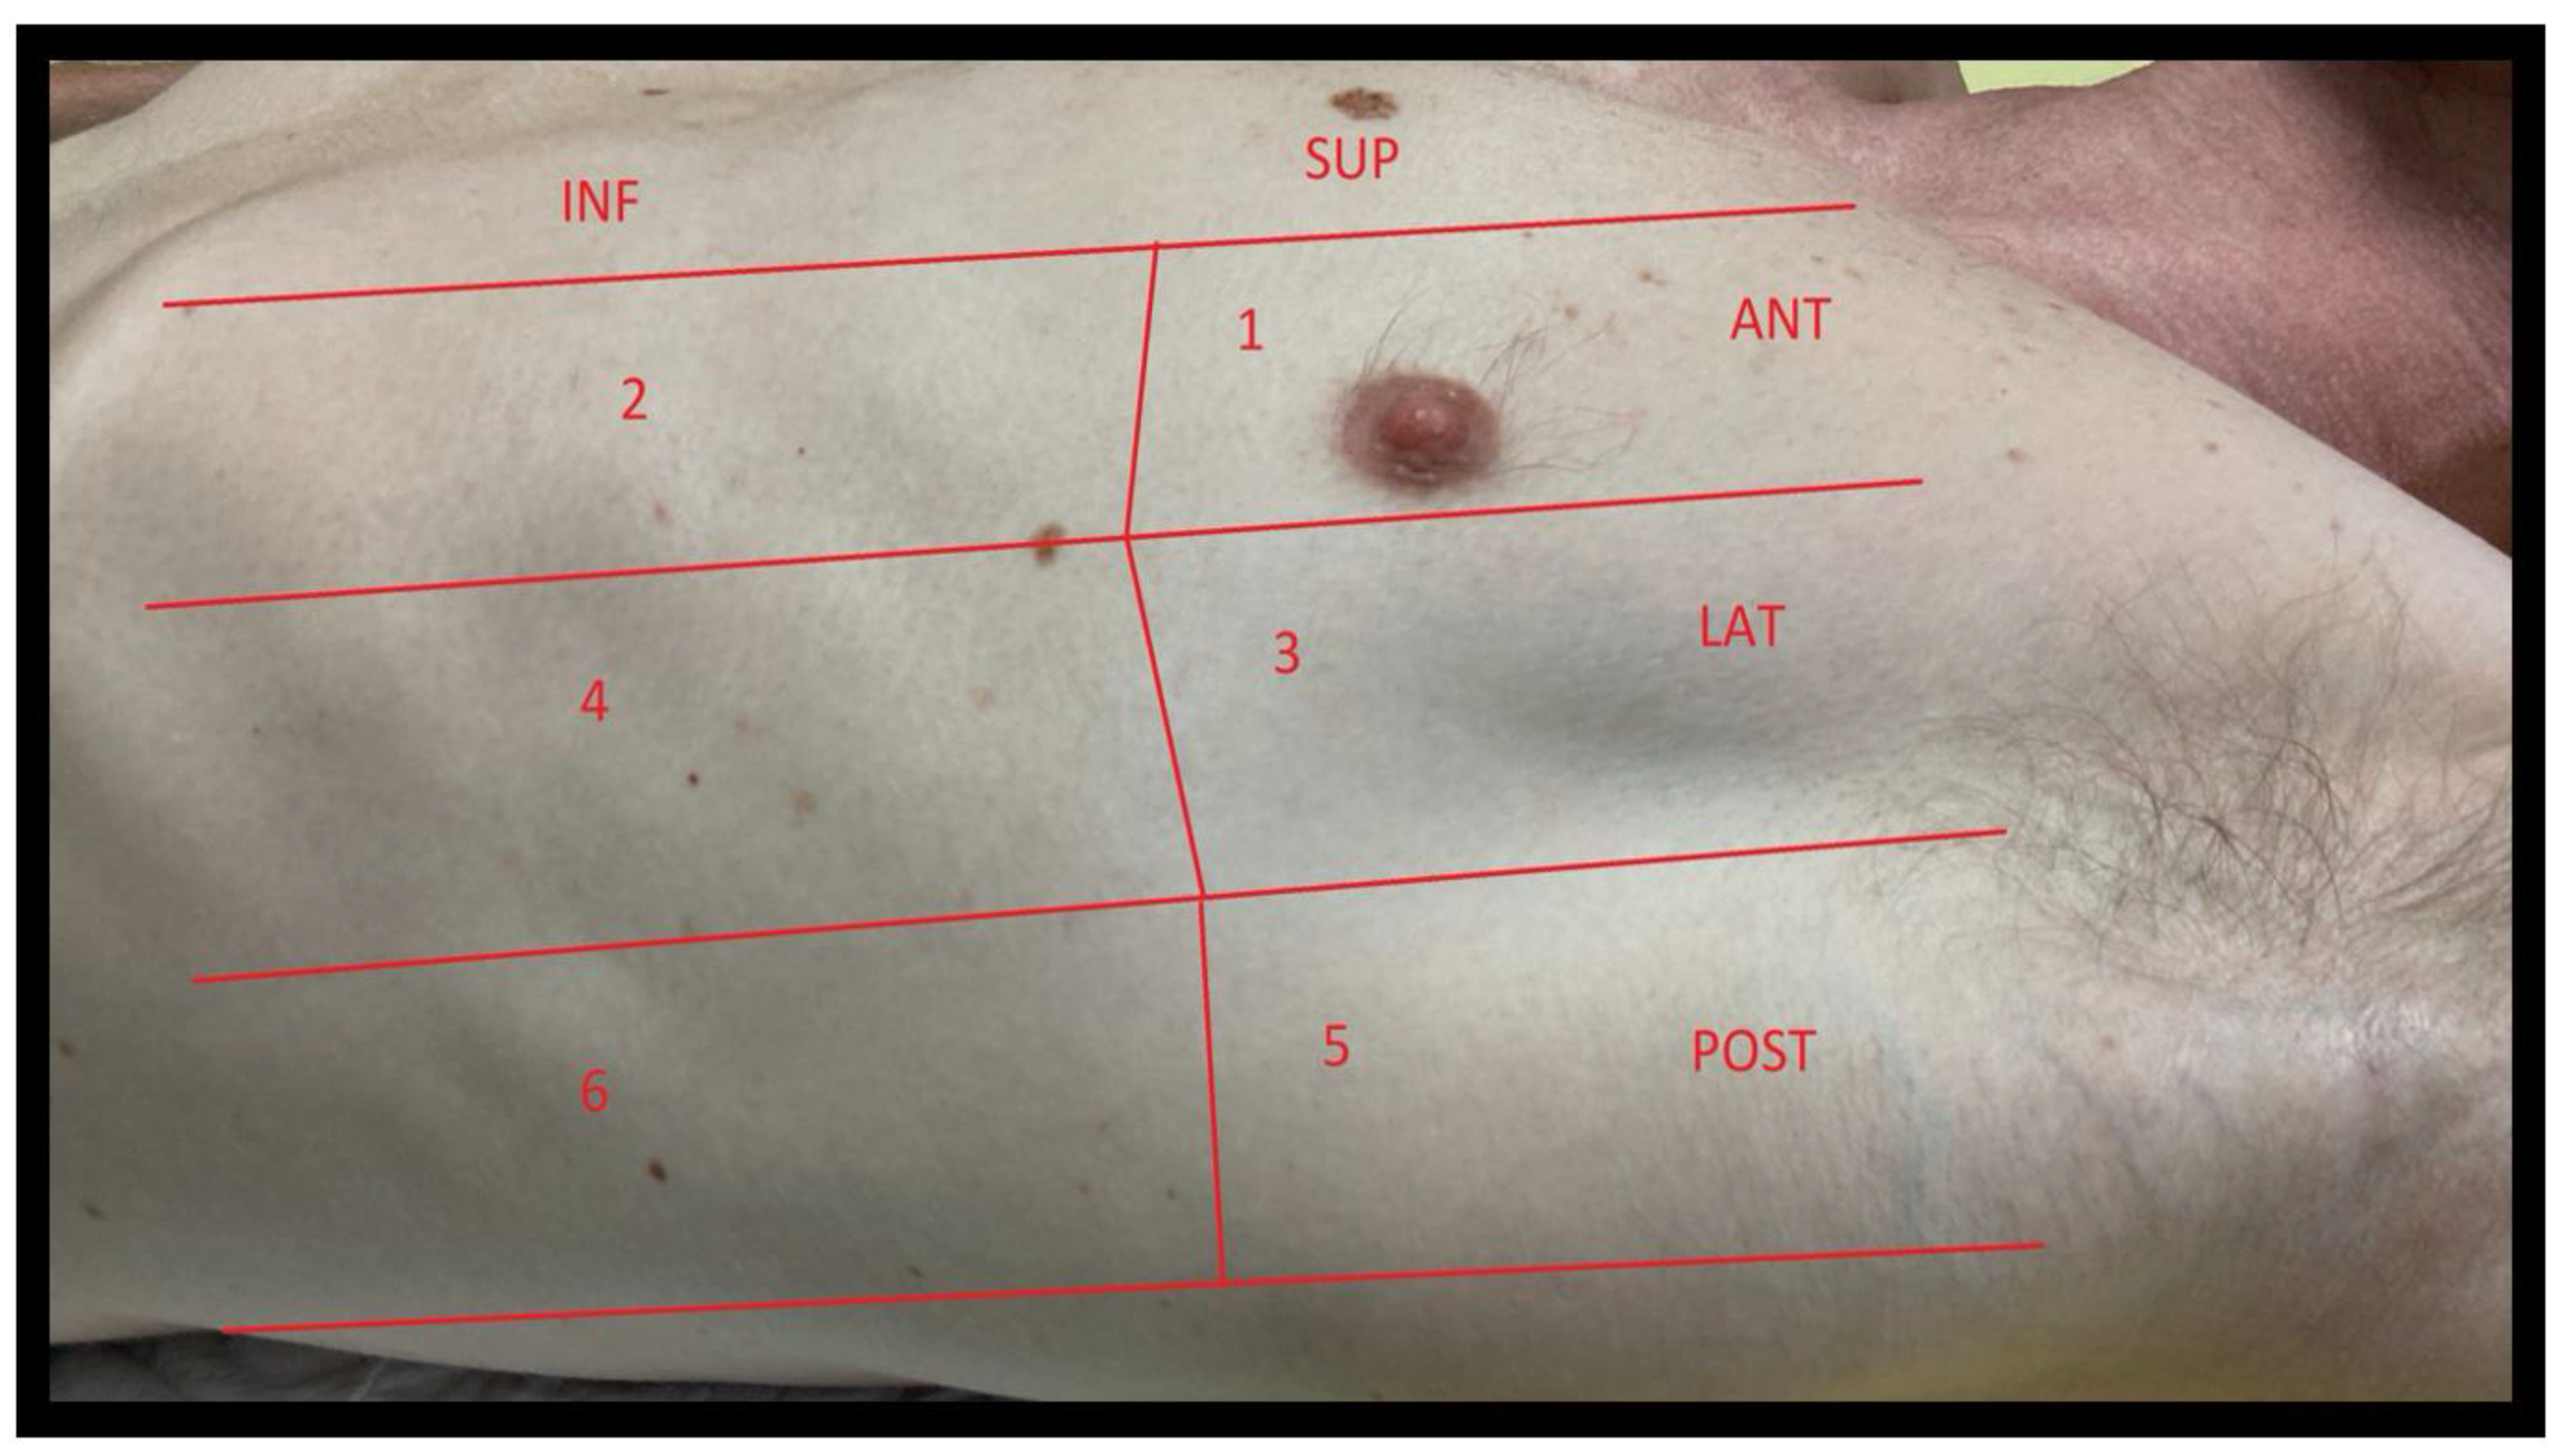
2.2. Windows
2.2.1. Windows
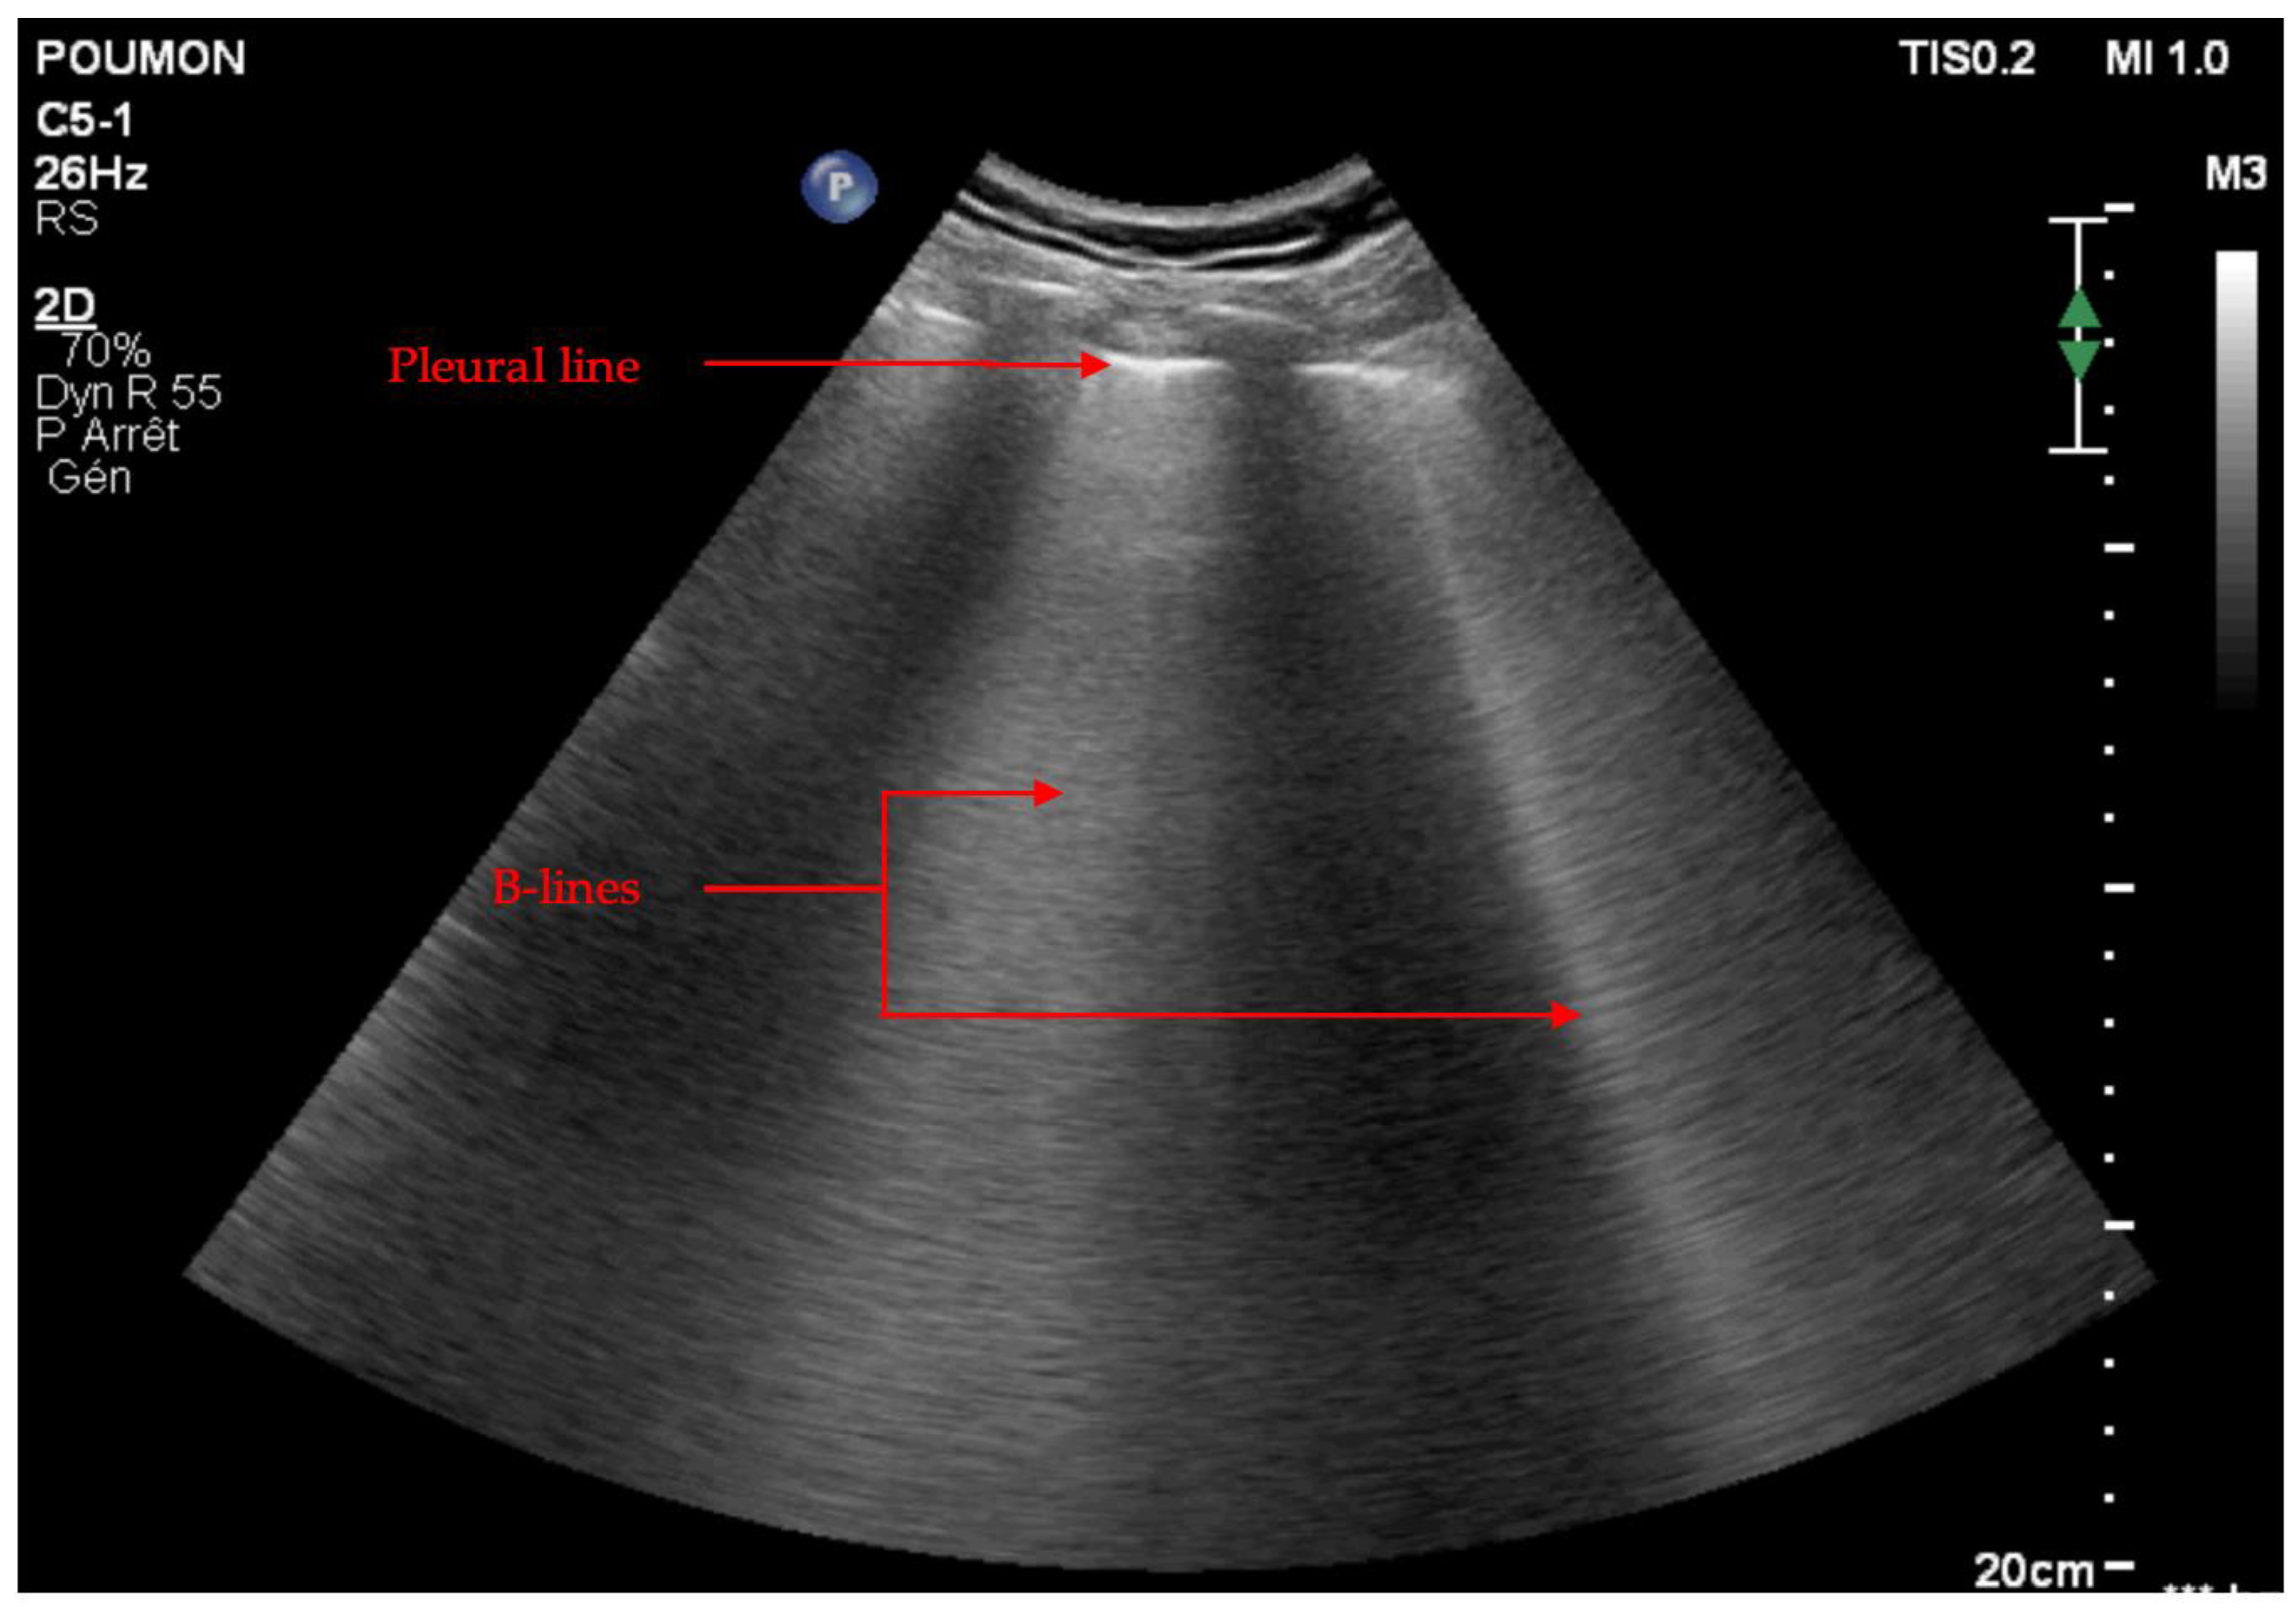
2.2.2. LUS Semeiotic Signs
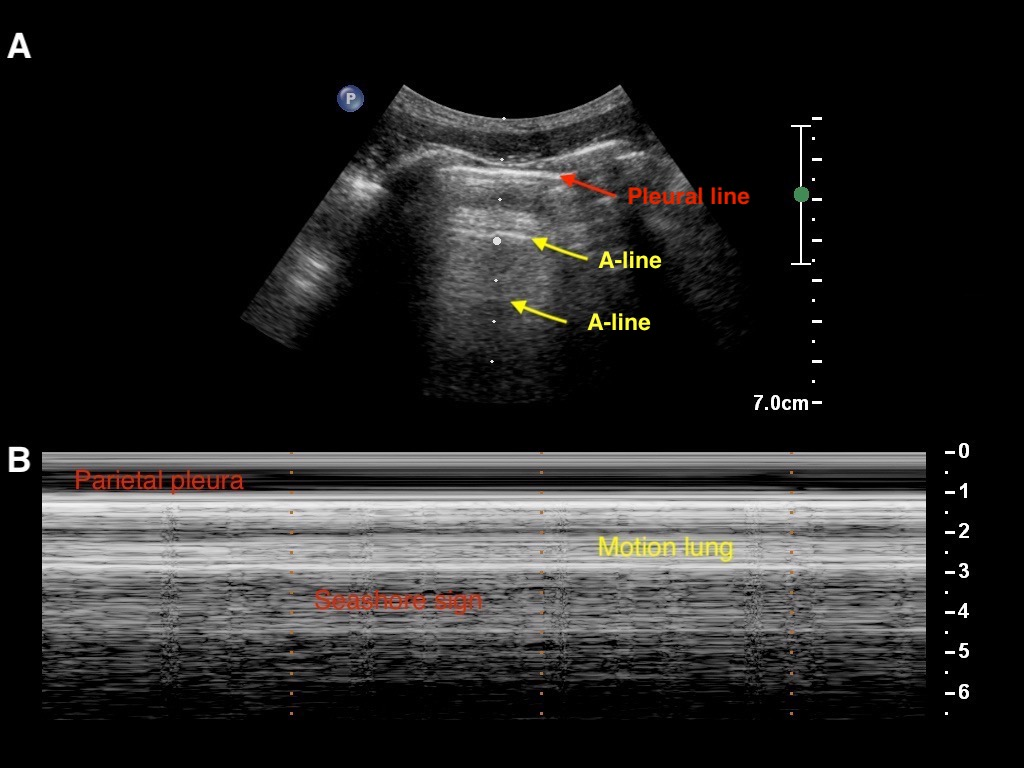
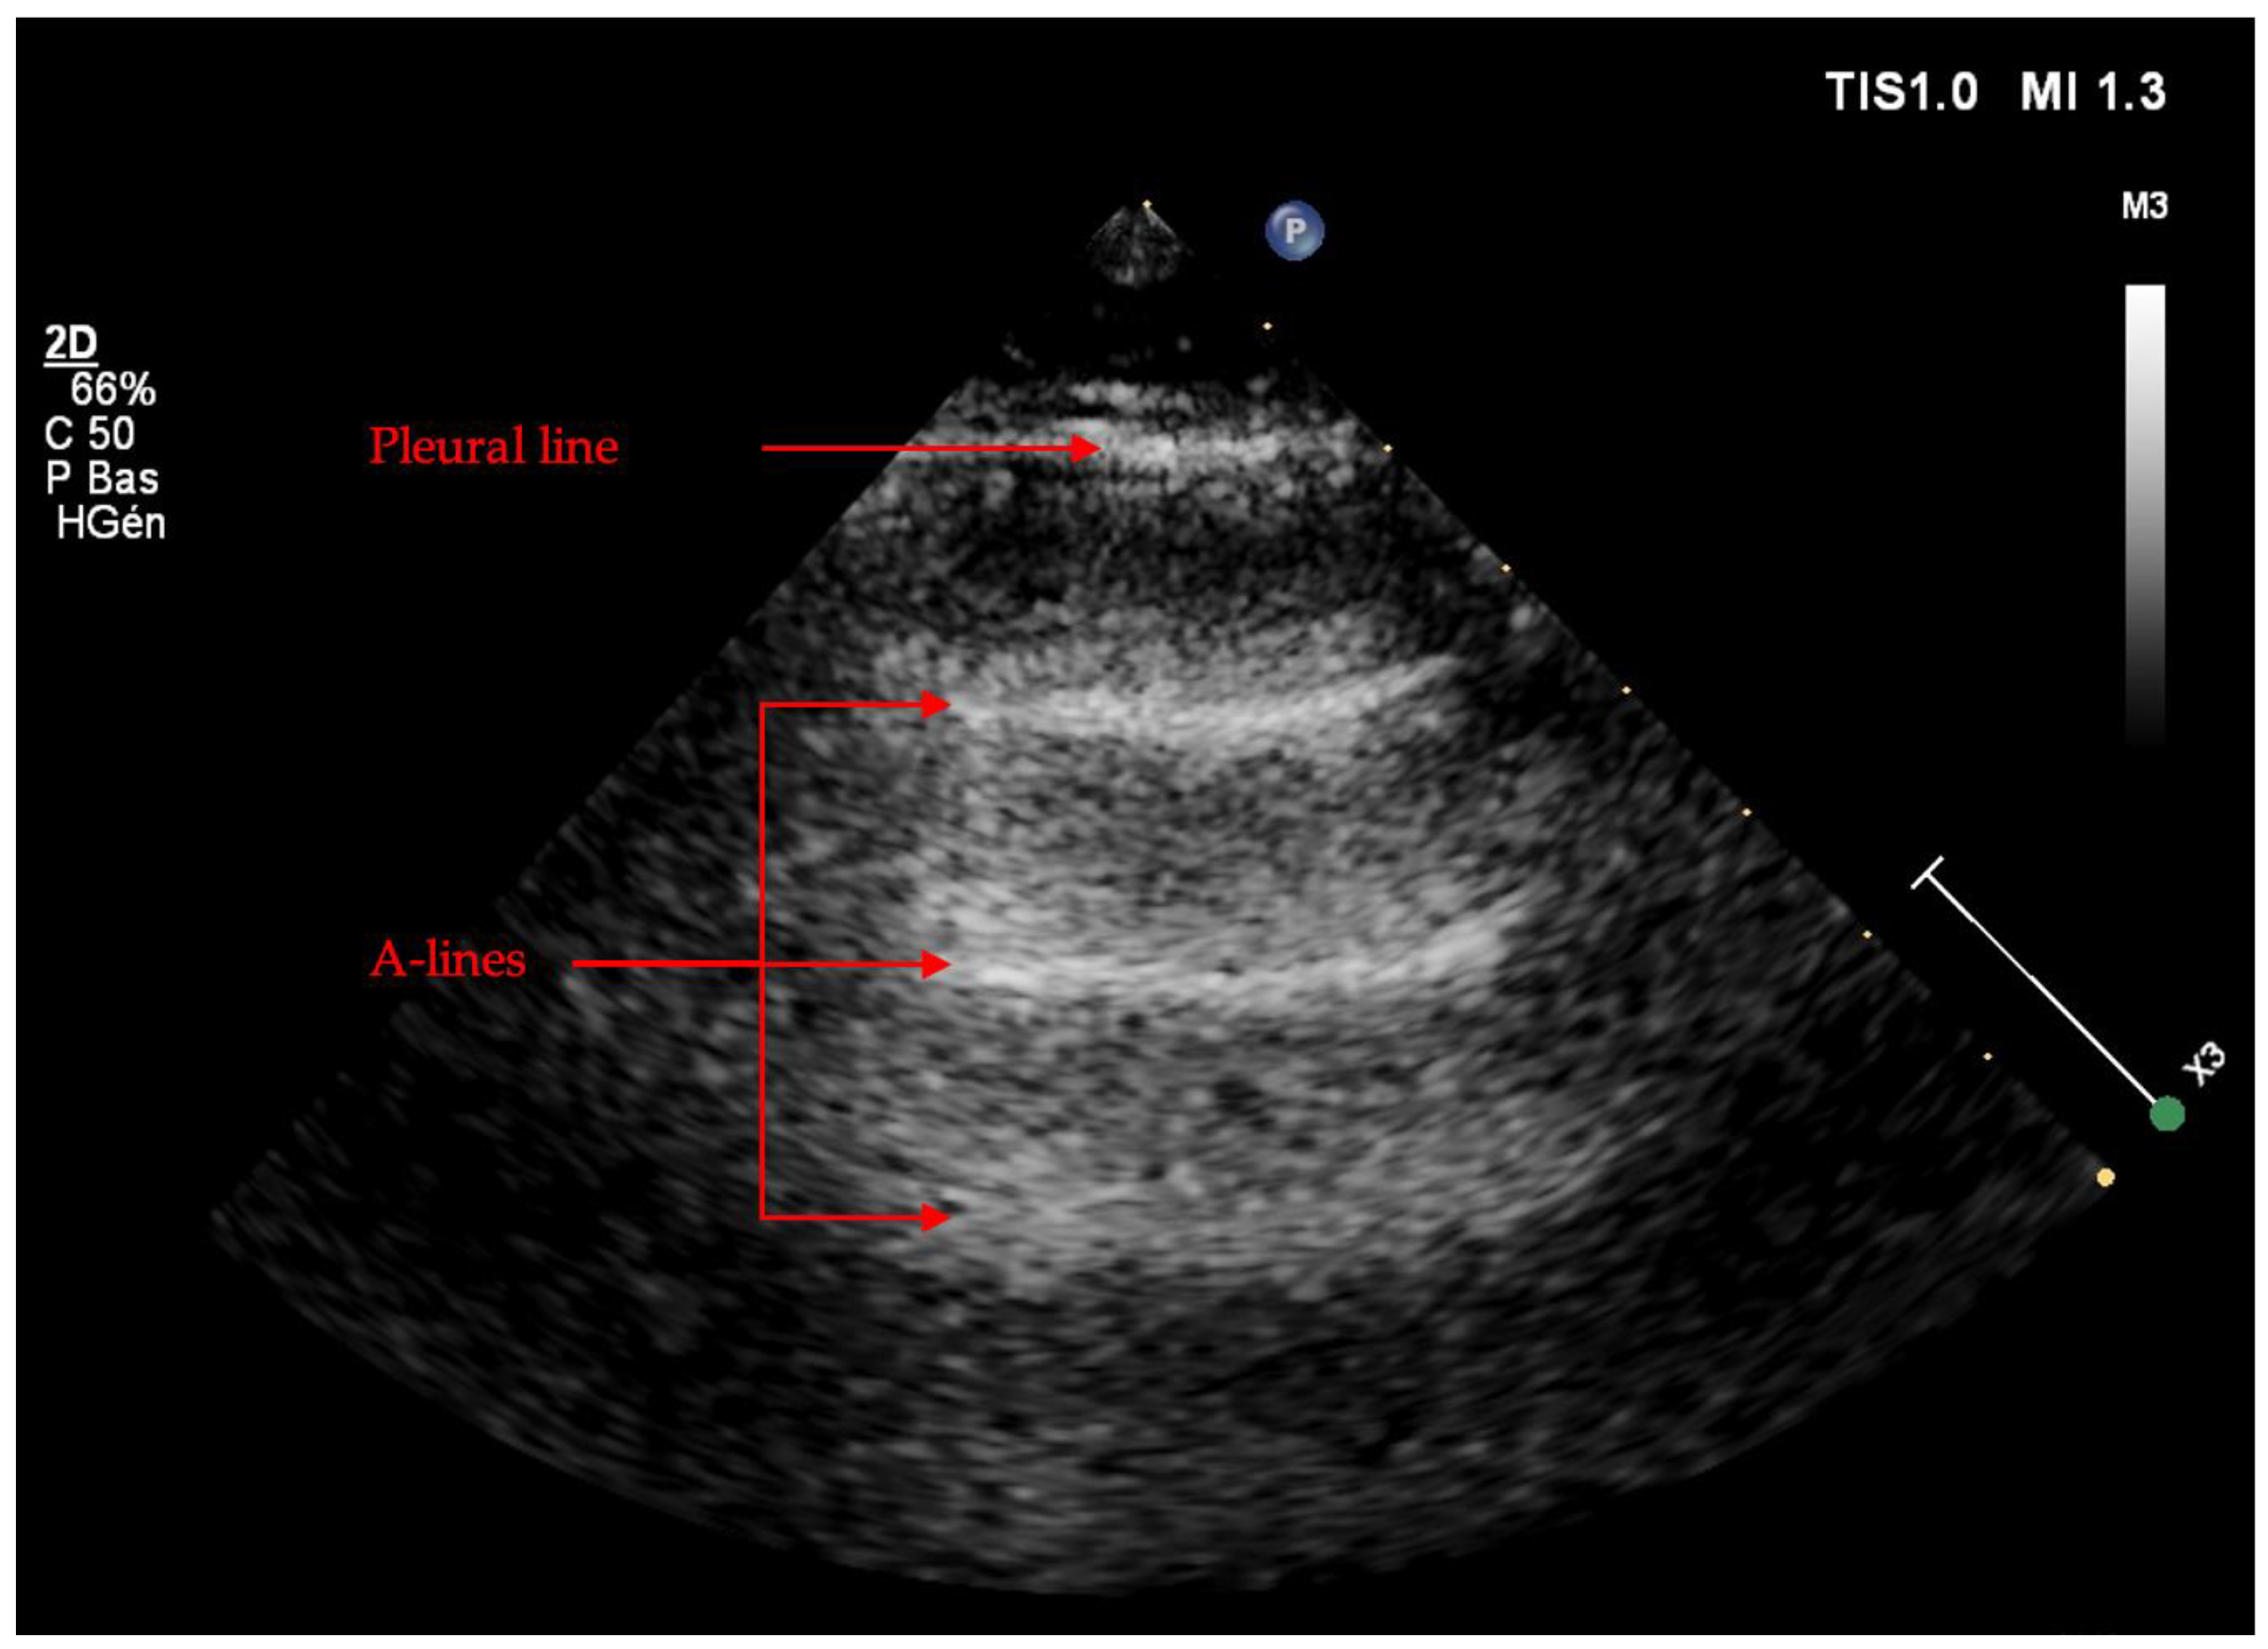
Artifacts
Real Images
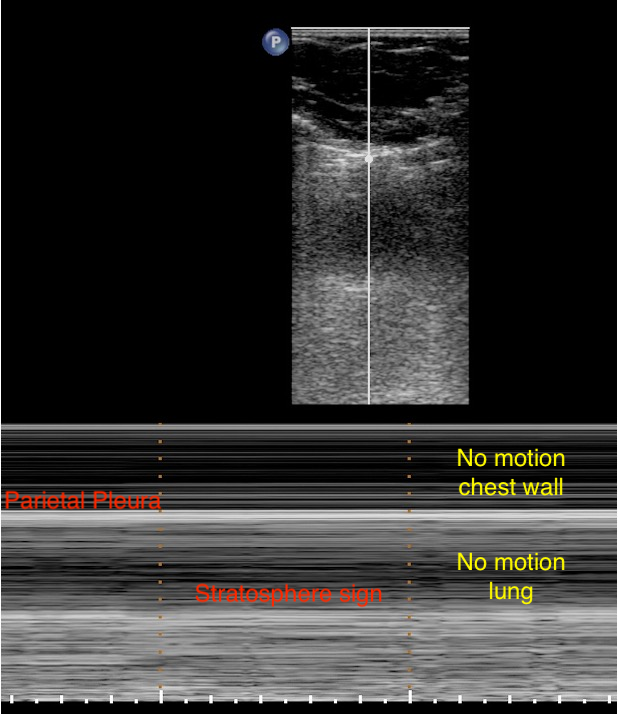
Pneumothorax
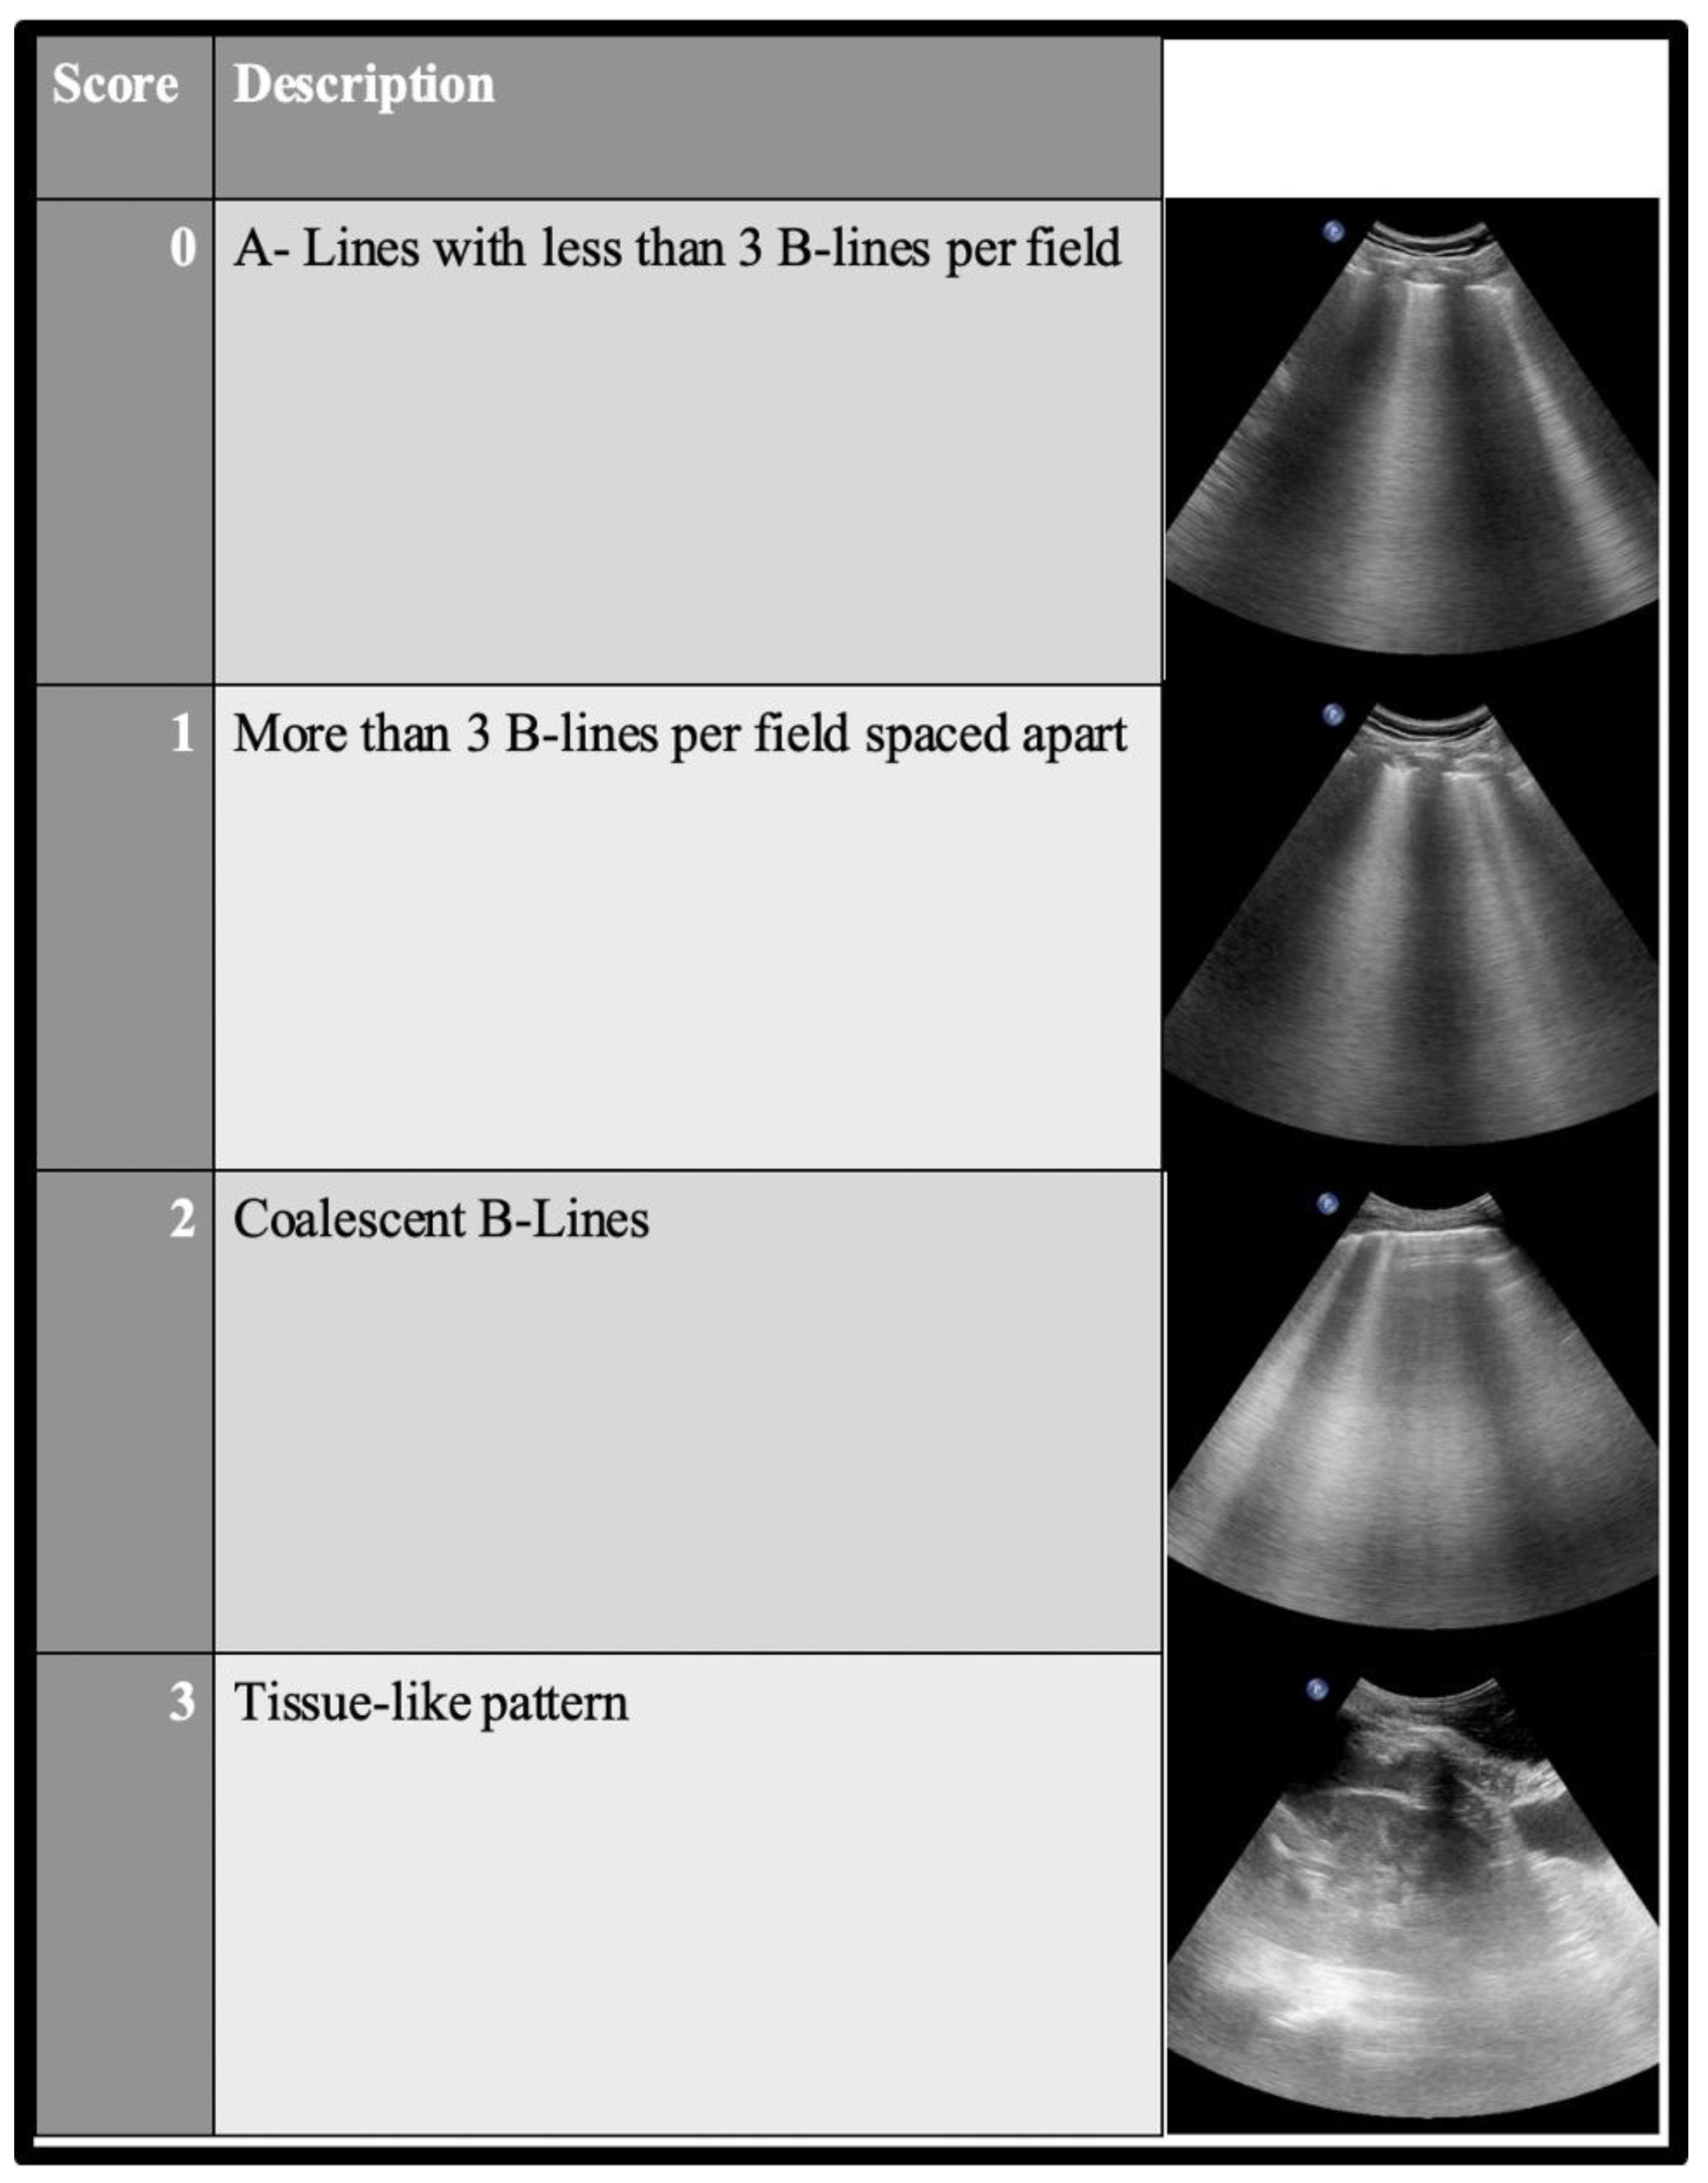
Patterns in the LUS Examination
2.3. Learning Curve and Inter- and Intra-Individual Agreement
2.4. Usefulness as a Non-Irradiated Imagery Technique
3. Diagnosis of COVID-19 Pneumonia
3.1. COVID-19 Pattern in LUS Examination
3.2. Differential Diagnosis from Other LUS Patterns
3.3. Correlation between Lung Ultrasound and CT
4. LUS Use in the Management of COVID-19 Patients
4.1. Early Management of COVID 19 Patients: Identification and Triage
4.2. Management of Critically Ill COVID-19 Patients
4.2.1. Detection of Secondary Complications
4.2.2. Monitoring Alveolar Recruitment
4.2.3. Mechanical Ventilation Weaning
5. Prediction of the Prognosis of the COVID-19 Pneumonia Course
6. LUS Use in the Management of Pregnant COVID-19 Women
7. Conclusions
8. Key Points
- Lung ultrasound is a widely available, easy-to-learn bedside technique with a rapid learning curve.
- Lung ultrasound allows us to rule in or rule out COVID-19 pneumonia combined with a compatible medical history by detecting alveolar or interstitial syndrome following the LUS score or the BLUE protocol.
- Specific signs of COVID-19 are rare. Further studies are needed to assess the sensitivity and specificity of the « light beam » sign.
- Lung ultrasound is helpful in screening, triage and treatment allocation in both the emergency and ICU departments.
- The LUS score at admission could predict evolution toward pneumonia progression or death with moderate accuracy.
- The LUS score could be used to monitor lung lesion progression and to detect complications in mechanically ventilated patients (pneumothorax and pleural effusion).
- Little evidence exists regarding the utility of LUS in assessing alveolar recruitment efficiency.
Author Contributions
Funding
Institutional Review Board Statement
Informed Consent Statement
Data Availability Statement
Acknowledgments
Conflicts of Interest
References
- Lichtenstein, D.A.; Mezière, G.A. Relevance of lung ultrasound in the diagnosis of acute respiratory failure: The BLUE protocol. Chest 2008, 134, 117–125. [Google Scholar] [CrossRef] [PubMed]
- Volpicelli, G.; Elbarbary, M.; Blaivas, M.; Lichtenstein, D.A.; Mathis, G.; Kirkpatrick, A.W.; Melniker, L.; Gargani, L.; Noble, V.E.; Via, G.; et al. International evidence-based recommendations for point-of-care lung ultrasound. Intensive Care Med. 2012, 38, 577–591. [Google Scholar] [CrossRef] [PubMed]
- Bouhemad, B.; Mongodi, S.; Via, G.; Rouquette, I. Ultrasound for “lung monitoring” of ventilated patients. Anesthesiology 2015, 122, 437–447. [Google Scholar] [CrossRef] [PubMed]
- Manivel, V.; Lesnewski, A.; Shamim, S.; Carbonatto, G.; Govindan, T. CLUE: COVID-19 lung ultrasound in emergency department. Emerg. Med. Australas 2020, 32, 694–696. [Google Scholar] [CrossRef] [PubMed]
- Volpicelli, G.; Mussa, A.; Garofalo, G.; Cardinale, L.; Casoli, G.; Perotto, F.; Fava, C.; Frascisco, M. Bedside lung ultrasound in the assessment of alveolar-interstitial syndrome. Am. J. Emerg. Med. 2006, 24, 689–696. [Google Scholar] [CrossRef]
- Lichtenstein, D.A. Lung ultrasound in the critically ill. Ann. Intensive Care 2014, 4, 1. [Google Scholar] [CrossRef]
- Lichtenstein, D.; Mezière, G.; Biderman, P.; Gepner, A. The “lung point”: An ultrasound sign specific to pneumothorax. Intensive Care Med. 2000, 26, 1434–1440. [Google Scholar] [CrossRef]
- Lichtenstein, D.A.; Lascols, N.; Mezière, G.; Gepner, A. Ultrasound diagnosis of alveolar consolidation in the critically ill. Intensive Care Med. 2004, 30, 276–281. [Google Scholar] [CrossRef]
- Lichtenstein, D.; Mézière, G.; Biderman, P.; Gepner, A.; Barré, O. The comet-tail artifact. An ultrasound sign of alveolar-interstitial syndrome. Am. J. Respir. Crit. Care Med. 1997, 156, 1640–1646. [Google Scholar] [CrossRef]
- Lichtenstein, D.; Mezière, G. A lung ultrasound sign allowing bedside distinction between pulmonary edema and COPD: The comet-tail artifact. Intensive Care Med. 1998, 24, 1331–1334. [Google Scholar] [CrossRef]
- Chiem, A.T.; Chan, C.H.; Ander, D.S.; Kobylivker, A.N.; Manson, W.C. Comparison of expert and novice sonographers’ performance in focused lung ultrasonography in dyspnea (FLUID) to diagnose patients with acute heart failure syndrome. Acad. Emerg. Med. 2015, 22, 564–573. [Google Scholar] [CrossRef] [PubMed]
- Gullett, J.; Donnelly, J.P.; Sinert, R.; Hosek, B.; Fuller, D.; Hill, H.; Feldman, I.; Galetto, G.; Auster, M.; Hoffmann, B. Interobserver agreement in the evaluation of B-lines using bedside ultrasound. J. Crit. Care 2015, 30, 1395–1399. [Google Scholar] [CrossRef]
- Rouby, J.J.; Arbelot, C.; Gao, Y.; Zhang, M.; Lv, J.; An, Y.; Chunyao, W.; Bin, D.; Valente Barbas, C.S.; Dexheimer Neto, F.L.; et al. Training for Lung Ultrasound Score Measurement in Critically Ill Patients. Am. J. Respir. Crit. Care Med. 2018, 198, 398–401. [Google Scholar] [CrossRef] [PubMed]
- Wolstenhulme, S.; McLaughlan, J.R. Lung ultrasound education: Simulation and hands-on. Br. J. Radiol. 2021, 94, 20200755. [Google Scholar] [CrossRef] [PubMed]
- Gargani, L.; Soliman-Aboumarie, H.; Volpicelli, G.; Corradi, F.; Pastore, M.C.; Cameli, M. Why, when, and how to use lung ultrasound during the COVID-19 pandemic: Enthusiasm and caution. Eur. Heart J. Cardiovasc. Imaging 2020, 21, 941–948. [Google Scholar] [CrossRef]
- Brogi, E.; Bignami, E.; Sidoti, A.; Shawar, M.; Gargani, L.; Vetrugno, L.; Volpicelli, G.; Forfori, F. Could the use of bedside lung ultrasound reduce the number of chest X-rays in the intensive care unit? Cardiovasc. Ultrasound 2017, 15, 23. [Google Scholar] [CrossRef] [PubMed]
- Peng, Q.Y.; Wang, X.T.; Zhang, L.N. Findings of lung ultrasonography of novel corona virus pneumonia during the 2019–2020 epidemic. Intensive Care Med. 2020, 46, 849–850. [Google Scholar] [CrossRef]
- Volpicelli, G.; Lamorte, A.; Villén, T. What’s new in lung ultrasound during the COVID-19 pandemic. Intensive Care Med. 2020, 46, 1445–1448. [Google Scholar] [CrossRef]
- Peyrony, O.; Marbeuf-Gueye, C.; Truong, V.; Giroud, M.; Rivière, C.; Khenissi, K.; Legay, L.; Simonetta, M.; Elezi, A.; Principe, A.; et al. Accuracy of Emergency Department Clinical Findings for Diagnosis of Coronavirus Disease 2019. Ann. Emerg. Med. 2020, 76, 405–412. [Google Scholar] [CrossRef]
- Volpicelli, G.; Gargani, L. Sonographic signs and patterns of COVID-19 pneumonia. Ultrasound J. 2020, 12, 22. [Google Scholar] [CrossRef]
- Mojoli, F.; Bouhemad, B.; Mongodi, S.; Lichtenstein, D. Lung Ultrasound for Critically Ill Patients. Am. J. Respir. Crit. Care Med. 2019, 199, 701–714. [Google Scholar] [CrossRef] [PubMed]
- Zieleskiewicz, L.; Markarian, T.; Lopez, A.; Taguet, C.; Mohammedi, N.; Boucekine, M.; Baumstarck, K.; Besch, G.; Mathon, G.; Duclos, G.; et al. Comparative study of lung ultrasound and chest computed tomography scan in the assessment of severity of confirmed COVID-19 pneumonia. Intensive Care Med. 2020, 46, 1707–1713. [Google Scholar] [CrossRef] [PubMed]
- Yang, Y.; Huang, Y.; Gao, F.; Yuan, L.; Wang, Z. Lung ultrasonography versus chest CT in COVID-19 pneumonia: A two-centered retrospective comparison study from China. Intensive Care Med. 2020, 46, 1761–1763. [Google Scholar] [CrossRef] [PubMed]
- De Alencar, J.C.G.; Marchini, J.F.M.; Marino, L.O.; da Costa Ribeiro, S.C.; Bueno, C.G.; da Cunha, V.P.; Lazar Neto, F.; Brandão Neto, R.A.; Souza, H.P. Lung ultrasound score predicts outcomes in COVID-19 patients admitted to the emergency department. Ann. Intensive Care 2021, 11, 6. [Google Scholar] [CrossRef] [PubMed]
- Volpicelli, G.; Gargani, L.; Perlini, S.; Spinelli, S.; Barbieri, G.; Lanotte, A.; Casasola, G.G.; Nogué-Bou, R.; Lamorte, A.; Agricola, E.; et al. Lung ultrasound for the early diagnosis of COVID-19 pneumonia: An international multicenter study. Intensive Care Med. 2021, 47, 444–454. [Google Scholar] [CrossRef]
- Brahier, T.; Meuwly, J.Y.; Pantet, O.; Brochu Vez, M.J.; Gerhard Donnet, H.; Hartley, M.A.; Hugli, O.; Boillat-Blanco, N. Lung Ultrasonography for Risk Stratification in Patients with Coronavirus Disease 2019 (COVID-19): A Prospective Observational Cohort Study. Clin. Infect. Dis. 2021, 73, e4189–e4196. [Google Scholar] [CrossRef]
- Biasucci, D.G.; Buonsenso, D.; Piano, A.; Bonadia, N.; Vargas, J.; Settanni, D.; Bocci, M.G.; Grieco, D.L.; Carnicelli, A.; Scoppettuolo, G.; et al. Lung ultrasound predicts non-invasive ventilation outcome in COVID-19 acute respiratory failure: A pilot study. Minerva Anestesiol. 2021, 87, 1006–1016. [Google Scholar] [CrossRef]
- Rubio-Gracia, J.; Giménez-López, I.; Garcés-Horna, V.; López-Delgado, D.; Sierra-Monzón, J.L.; Martínez-Lostao, L.; Josa-Laorden, C.; Ruiz-Laiglesia, F.; Pérez-Calvo, J.I.; Crespo-Aznarez, S.; et al. Point-of-care lung ultrasound assessment for risk stratification and therapy guiding in COVID-19 patients: A prospective noninterventional study. Eur. Respir. J. 2021, 58, 2004283. [Google Scholar] [CrossRef]
- Hussain, A.; Via, G.; Melniker, L.; Goffi, A.; Tavazzi, G.; Neri, L.; Villen, T.; Hoppmann, R.; Mojoli, F.; Noble, V.; et al. Multi-organ point-of-care ultrasound for COVID-19 (PoCUS4COVID): International expert consensus. Crit. Care 2020, 24, 702. [Google Scholar] [CrossRef]
- Agricola, E.; Beneduce, A.; Esposito, A.; Ingallina, G.; Palumbo, D.; Palmisano, A.; Ancona, F.; Baldetti, L.; Pagnesi, M.; Melisurgo, G.; et al. Heart and Lung Multimodality Imaging in COVID-19. JACC Cardiovasc. Imaging 2020, 13, 1792–1808. [Google Scholar] [CrossRef]
- Soldati, G.; Smargiassi, A.; Inchingolo, R.; Buonsenso, D.; Perrone, T.; Briganti, D.F.; Perlini, S.; Torri, E.; Mariani, A.; Mossolani, E.E.; et al. Proposal for International Standardization of the Use of Lung Ultrasound for Patients with COVID-19: A Simple, Quantitative, Reproducible Method. J. Ultrasound Med. 2020, 39, 1413–1419. [Google Scholar] [CrossRef] [PubMed]
- Smith, M.J.; Hayward, S.A.; Innes, S.M.; Miller, A.S.C. Point-of-care lung ultrasound in patients with COVID-19—A narrative review. Anaesthesia 2020, 75, 1096–1104. [Google Scholar] [CrossRef] [PubMed]
- Lichter, Y.; Topilsky, Y.; Taieb, P.; Banai, A.; Hochstadt, A.; Merdler, I.; Gal Oz, A.; Vine, J.; Goren, O.; Cohen, B.; et al. Lung ultrasound predicts clinical course and outcomes in COVID-19 patients. Intensive Care Med. 2020, 46, 1873–1883. [Google Scholar] [CrossRef] [PubMed]
- Ji, L.; Cao, C.; Gao, Y.; Zhang, W.; Xie, Y.; Duan, Y.; Kong, S.; You, M.; Ma, R.; Jiang, L.; et al. Prognostic value of bedside lung ultrasound score in patients with COVID-19. Crit. Care 2020, 24, 700. [Google Scholar] [CrossRef] [PubMed]
- Yasukawa, K.; Minami, T.; Boulware, D.R.; Shimada, A.; Fischer, E.A. Point-of-Care Lung Ultrasound for COVID-19: Findings and Prognostic Implications from 105 Consecutive Patients. J. Intensive Care Med. 2021, 36, 334–342. [Google Scholar] [CrossRef]
- Bonadia, N.; Carnicelli, A.; Piano, A.; Buonsenso, D.; Gilardi, E.; Kadhim, C.; Torelli, E.; Petrucci, M.; Di Maurizio, L.; Biasucci, D.G.; et al. Lung Ultrasound Findings Are Associated with Mortality and Need for Intensive Care Admission in COVID-19 Patients Evaluated in the Emergency Department. Ultrasound Med. Biol. 2020, 46, 2927–2937. [Google Scholar] [CrossRef] [PubMed]
- Vetrugno, L.; Bove, T.; Orso, D.; Barbariol, F.; Bassi, F.; Boero, E.; Ferrari, G.; Kong, R. Our Italian experience using lung ultrasound for identification, grading and serial follow-up of severity of lung involvement for management of patients with COVID-19. Echocardiography 2020, 37, 625–627. [Google Scholar] [CrossRef]
- Torres-Macho, J.; Sánchez-Fernández, M.; Arnanz-González, I.; Tung-Chen, Y.; Franco-Moreno, A.I.; Duffort-Falcó, M.; Beltrán-Romero, L.; Rodríguez-Suaréz, S.; Bernabeu-Wittel, M.; Urbano, E.; et al. Prediction Accuracy of Serial Lung Ultrasound in COVID-19 Hospitalized Patients (Pred-Echovid Study). J. Clin. Med. 2021, 10, 4818. [Google Scholar] [CrossRef]
- Lichtenstein, D.A.; Menu, Y. A bedside ultrasound sign ruling out pneumothorax in the critically ill. Lung sliding. Chest 1995, 108, 1345–1348. [Google Scholar] [CrossRef]
- Kirkpatrick, A.W.; Sirois, M.; Laupland, K.B.; Liu, D.; Rowan, K.; Ball, C.G.; Hameed, S.M.; Brown, R.; Simons, R.; Dulchavsky, S.A.; et al. Hand-held thoracic sonography for detecting post-traumatic pneumothoraces: The Extended Focused Assessment with Sonography for Trauma (EFAST). J. Trauma 2004, 57, 288–295. [Google Scholar] [CrossRef]
- Soldati, G.; Testa, A.; Sher, S.; Pignataro, G.; La Sala, M.; Silveri, N.G. Occult traumatic pneumothorax: Diagnostic accuracy of lung ultrasonography in the emergency department. Chest 2008, 133, 204–211. [Google Scholar] [CrossRef] [PubMed]
- Lock, C.; Nix, C.M. Use of point-of-care lung ultrasonography in the critical care setting as an aid to identifying the correct diagnosis in an acutely desaturating patient with COVID-19-related acute respiratory distress syndrome. BMJ Case Rep. 2021, 14, e240891. [Google Scholar] [CrossRef] [PubMed]
- Dargent, A.; Chatelain, E.; Si-Mohamed, S.; Simon, M.; Baudry, T.; Kreitmann, L.; Quenot, J.P.; Cour, M.; Argaud, L. Lung ultrasound score as a tool to monitor disease progression and detect ventilator-associated pneumonia during COVID-19-associated ARDS. Heart Lung 2021, 50, 700–705. [Google Scholar] [CrossRef] [PubMed]
- Chiumello, D.; Mongodi, S.; Algieri, I.; Vergani, G.L.; Orlando, A.; Via, G.; Crimella, F.; Cressoni, M.; Mojoli, F. Assessment of Lung Aeration and Recruitment by CT Scan and Ultrasound in Acute Respiratory Distress Syndrome Patients. Crit. Care Med. 2018, 46, 1761–1768. [Google Scholar] [CrossRef] [PubMed]
- Bouhemad, B.; Brisson, H.; Le-Guen, M.; Arbelot, C.; Lu, Q.; Rouby, J.J. Bedside ultrasound assessment of positive end-expiratory pressure-induced lung recruitment. Am. J. Respir. Crit. Care Med. 2011, 183, 341–347. [Google Scholar] [CrossRef]
- Stevic, N.; Chatelain, E.; Dargent, A.; Argaud, L.; Cour, M.; Guérin, C. Lung Recruitability Evaluated by Recruitment-to-Inflation Ratio and Lung Ultrasound in COVID-19 Acute Respiratory Distress Syndrome. Am. J. Respir. Crit. Care Med. 2021, 203, 1025–1027. [Google Scholar] [CrossRef]
- Taniguchi, H.; Ohta, S.; Honzawa, H.; Takahashi, K.; Iwashita, M.; Abe, T.; Takeuchi, I. Usefulness of serial lung ultrasound for a severe COVID-19 patient on extracorporeal membrane oxygenation. Respir. Med. Case Rep. 2021, 33, 101383. [Google Scholar] [CrossRef]
- Mongodi, S.; Pozzi, M.; Orlando, A.; Bouhemad, B.; Stella, A.; Tavazzi, G.; Via, G.; Iotti, G.A.; Mojoli, F. Lung ultrasound for daily monitoring of ARDS patients on extracorporeal membrane oxygenation: Preliminary experience. Intensive Care Med. 2018, 44, 123–124. [Google Scholar] [CrossRef]
- Møller-Sørensen, H.; Gjedsted, J.; Lind Jørgensen, V.; Lindskov Hansen, K. COVID-19 Assessment with Bedside Lung Ultrasound in a Population of Intensive Care Patients Treated with Mechanical Ventilation and ECMO. Diagnostics 2020, 10, 447. [Google Scholar] [CrossRef]
- Ferré, A.; Guillot, M.; Lichtenstein, D.; Mezière, G.; Richard, C.; Teboul, J.L.; Monnet, X. Lung ultrasound allows the diagnosis of weaning-induced pulmonary oedema. Intensive Care Med. 2019, 45, 601–608. [Google Scholar] [CrossRef]
- Bouhemad, B.; Mojoli, F.; Nowobilski, N.; Hussain, A.; Rouquette, I.; Guinot, P.G.; Mongodi, S. Use of combined cardiac and lung ultrasound to predict weaning failure in elderly, high-risk cardiac patients: A pilot study. Intensive Care Med. 2020, 46, 475–484. [Google Scholar] [CrossRef] [PubMed]
- Perrone, T.; Soldati, G.; Padovini, L.; Fiengo, A.; Lettieri, G.; Sabatini, U.; Gori, G.; Lepore, F.; Garolfi, M.; Palumbo, I.; et al. A New Lung Ultrasound Protocol Able to Predict Worsening in Patients Affected by Severe Acute Respiratory Syndrome Coronavirus 2 Pneumonia. J. Ultrasound Med. 2021, 40, 1627–1635. [Google Scholar] [CrossRef] [PubMed]
- Casella, F.; Barchiesi, M.; Leidi, F.; Russo, G.; Casazza, G.; Valerio, G.; Torzillo, D.; Ceriani, E.; Del Medico, M.; Brambilla, A.M.; et al. Lung ultrasonography: A prognostic tool in non-ICU hospitalized patients with COVID-19 pneumonia. Eur. J. Intern. Med. 2021, 85, 34–40. [Google Scholar] [CrossRef]
- Dargent, A.; Chatelain, E.; Kreitmann, L.; Quenot, J.P.; Cour, M.; Argaud, L. Lung ultrasound score to monitor COVID-19 pneumonia progression in patients with ARDS. PLoS ONE 2020, 15, e0236312. [Google Scholar] [CrossRef] [PubMed]
- Deng, Q.; Zhang, Y.; Wang, H.; Chen, L.; Yang, Z.; Peng, Z.; Liu, Y.; Feng, C.; Huang, X.; Jiang, N.; et al. Semiquantitative lung ultrasound scores in the evaluation and follow-up of critically ill patients with COVID-19: A single-center study. Acad. Radiol. 2020, 27, 1363–1372. [Google Scholar] [CrossRef] [PubMed]
- Palmese, F.; Caroli, B.; Graziani, A.; Zanframundo, G.; Del Toro, R.; Sagrini, E.; Cataleta, P.; Domenicali, M. Daily Evaluation of COVID-19 Patients Primarily Based on Lung Ultrasound: In Times of Emergency, It’s Time to Change Some Paradigms. Am. J. Trop. Med. Hyg. 2020, 103, 922–923. [Google Scholar] [CrossRef] [PubMed]
- Shokoohi, H.; Duggan, N.M.; García-de-Casasola Sánchez, G.; Torres-Arrese, M.; Tung-Chen, Y. Lung ultrasound monitoring in patients with COVID-19 on home isolation. Am. J. Emerg. Med. 2020, 38, e2755–e2759. [Google Scholar] [CrossRef]
- Tung-Chen, Y. Lung ultrasound in the monitoring of COVID-19 infection. Clin. Med. 2020, 20, e62–e65. [Google Scholar] [CrossRef]
- De Almeida Monteiro, R.A.; Duarte-Neto, A.N.; Ferraz da Silva, L.F.; de Oliveira, E.P.; do Nascimento, E.C.T.; Mauad, T.; Saldiva, P.; Dolhnikoff, M. Ultrasound assessment of pulmonary fibroproliferative changes in severe COVID-19: A quantitative correlation study with histopathological findings. Intensive Care Med. 2021, 47, 199–207. [Google Scholar] [CrossRef]
- Moro, F.; Buonsenso, D.; Moruzzi, M.C.; Inchingolo, R.; Smargiassi, A.; Demi, L.; Larici, A.R.; Scambia, G.; Lanzone, A.; Testa, A.C. How to perform lung ultrasound in pregnant women with suspected COVID-19. Ultrasound Obstet. Gynecol. 2020, 55, 593–598. [Google Scholar] [CrossRef] [Green Version]
- Buonsenso, D.; Raffaelli, F.; Tamburrini, E.; Biasucci, D.G.; Salvi, S.; Smargiassi, A.; Inchingolo, R.; Scambia, G.; Lanzone, A.; Testa, A.C.; et al. Clinical role of lung ultrasound for diagnosis and monitoring of COVID-19 pneumonia in pregnant women. Ultrasound Obstet. Gynecol. 2020, 56, 106–109. [Google Scholar] [CrossRef] [PubMed]
- Inchingolo, R.; Smargiassi, A.; Moro, F.; Buonsenso, D.; Salvi, S.; Del Giacomo, P.; Scoppettuolo, G.; Demi, L.; Soldati, G.; Testa, A.C. The diagnosis of pneumonia in a pregnant woman with coronavirus disease 2019 using maternal lung ultrasound. Am. J. Obstet. Gynecol. 2020, 223, 9–11. [Google Scholar] [CrossRef] [PubMed]
- Vetrugno, L.; Sala, A.; Orso, D.; Meroi, F.; Fabbro, S.; Boero, E.; Valent, F.; Cammarota, G.; Restaino, S.; Vizzielli, G.; et al. Lung Ultrasound Signs and Their Correlation with Clinical Symptoms in COVID-19 Pregnant Women: The “PINK-CO” Observational Study. Front. Med. 2021, 8, 768261. [Google Scholar] [CrossRef] [PubMed]


Publisher’s Note: MDPI stays neutral with regard to jurisdictional claims in published maps and institutional affiliations. |
© 2022 by the authors. Licensee MDPI, Basel, Switzerland. This article is an open access article distributed under the terms and conditions of the Creative Commons Attribution (CC BY) license (https://creativecommons.org/licenses/by/4.0/).
Share and Cite
Lê, M.P.; Jozwiak, M.; Laghlam, D. Current Advances in Lung Ultrasound in COVID-19 Critically Ill Patients: A Narrative Review. J. Clin. Med. 2022, 11, 5001. https://doi.org/10.3390/jcm11175001
Lê MP, Jozwiak M, Laghlam D. Current Advances in Lung Ultrasound in COVID-19 Critically Ill Patients: A Narrative Review. Journal of Clinical Medicine. 2022; 11(17):5001. https://doi.org/10.3390/jcm11175001
Chicago/Turabian StyleLê, Minh Pierre, Mathieu Jozwiak, and Driss Laghlam. 2022. "Current Advances in Lung Ultrasound in COVID-19 Critically Ill Patients: A Narrative Review" Journal of Clinical Medicine 11, no. 17: 5001. https://doi.org/10.3390/jcm11175001
APA StyleLê, M. P., Jozwiak, M., & Laghlam, D. (2022). Current Advances in Lung Ultrasound in COVID-19 Critically Ill Patients: A Narrative Review. Journal of Clinical Medicine, 11(17), 5001. https://doi.org/10.3390/jcm11175001