
Prolonged Sitting Causes Leg Discomfort in Middle Aged Adults: Evaluation of Shear Wave Velocity, Calf Circumference, and Discomfort Questionaries

 ,
,
Abstract
1. Introduction
1.1. Lower Leg Discomfort Symptoms Due to Prolonged Sitting
1.2. Prolonged Sitting and Shear Wave Velocity (SWV) Changes Related to Pressure Changes in the Muscle Compartment
2. Methods
2.1. Subjects
2.2. Sample Size
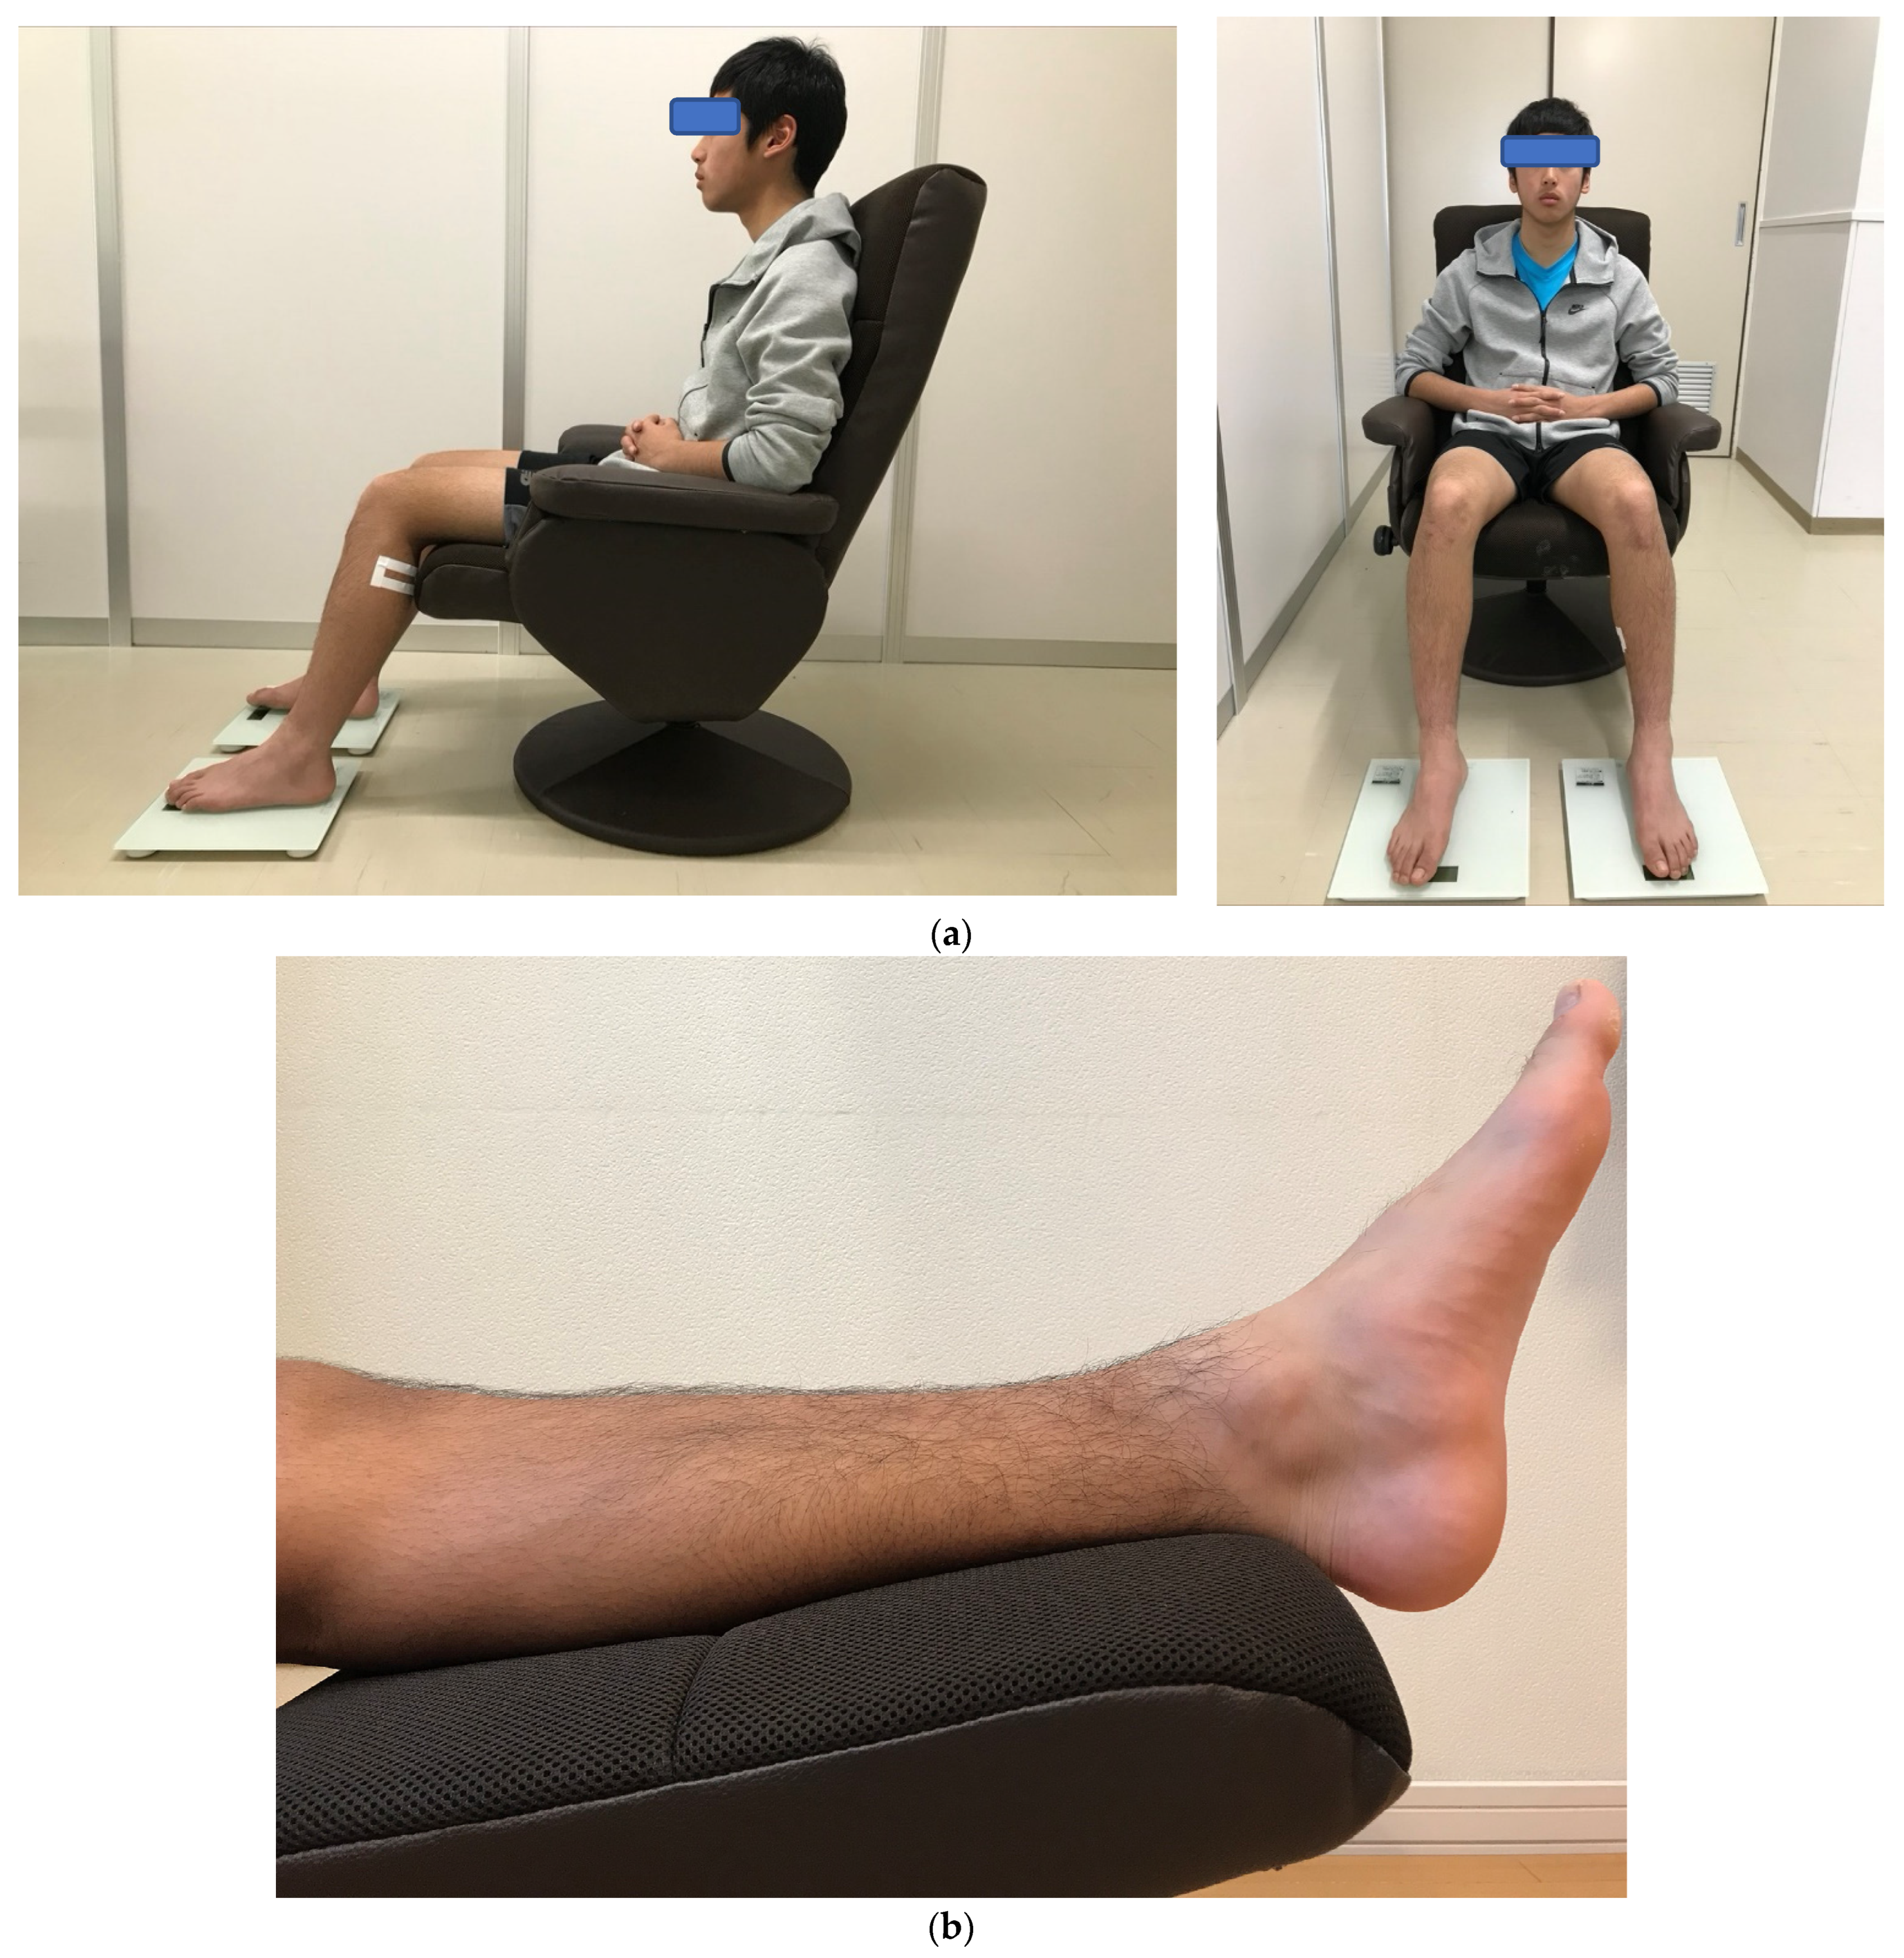
2.3. Seated Posture
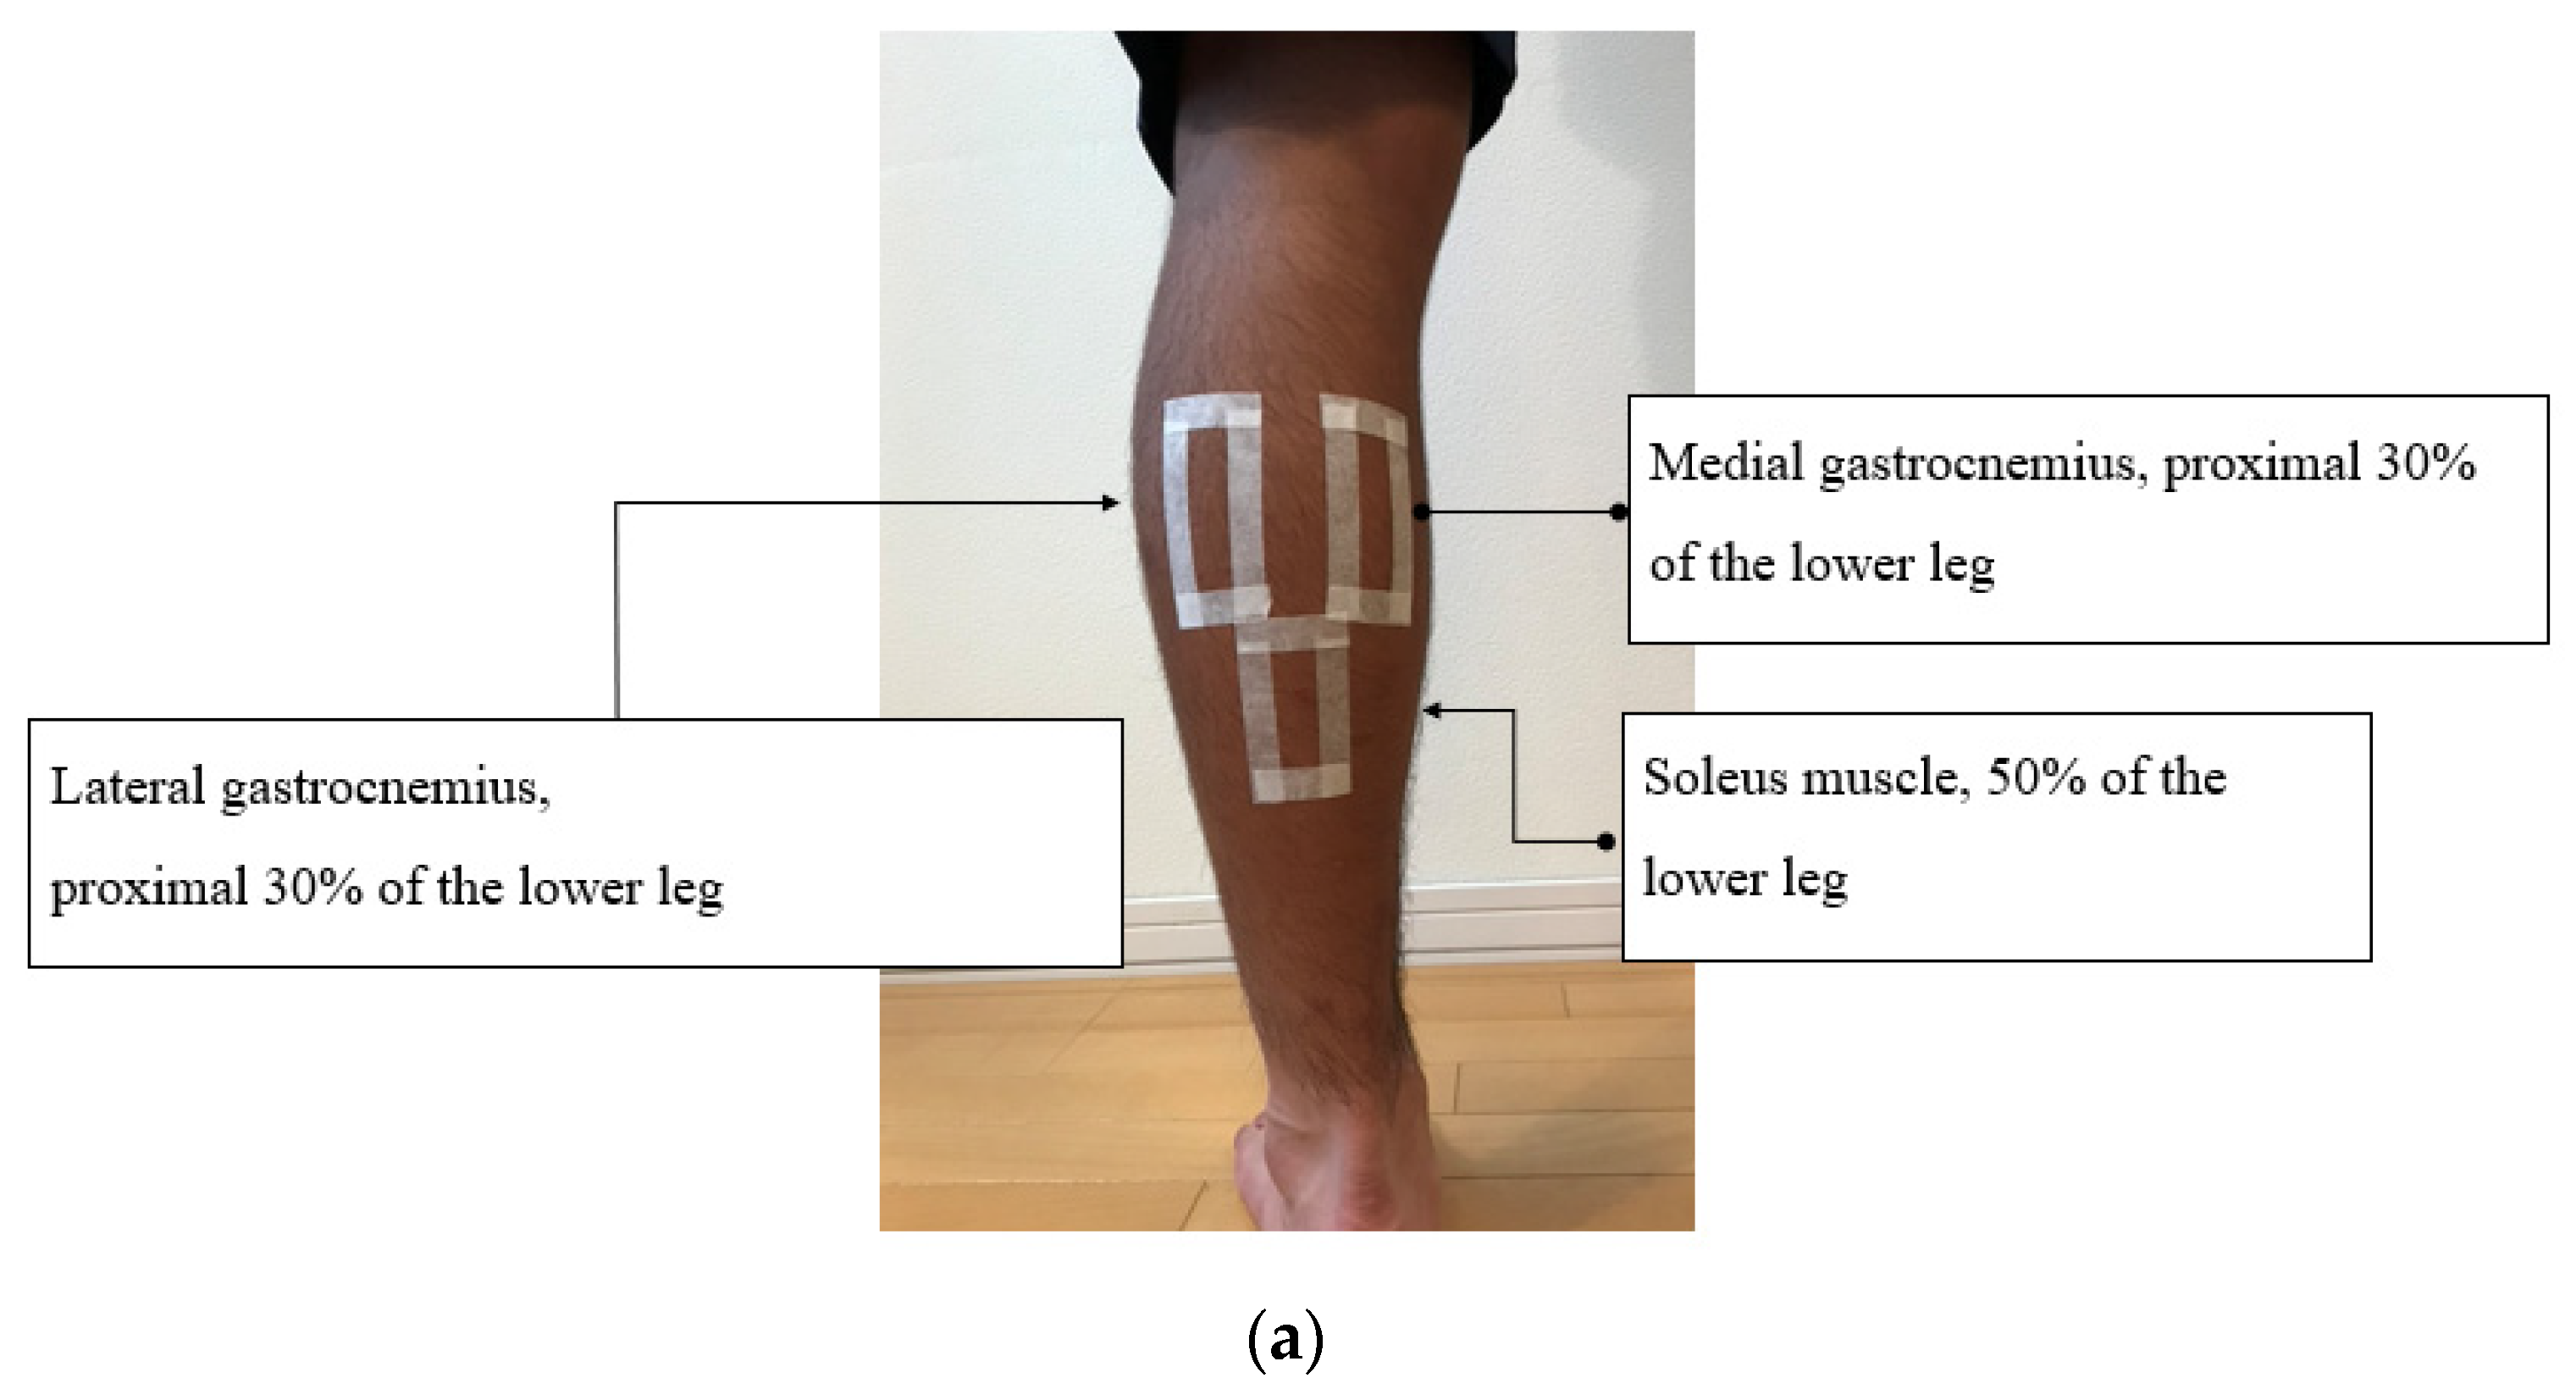
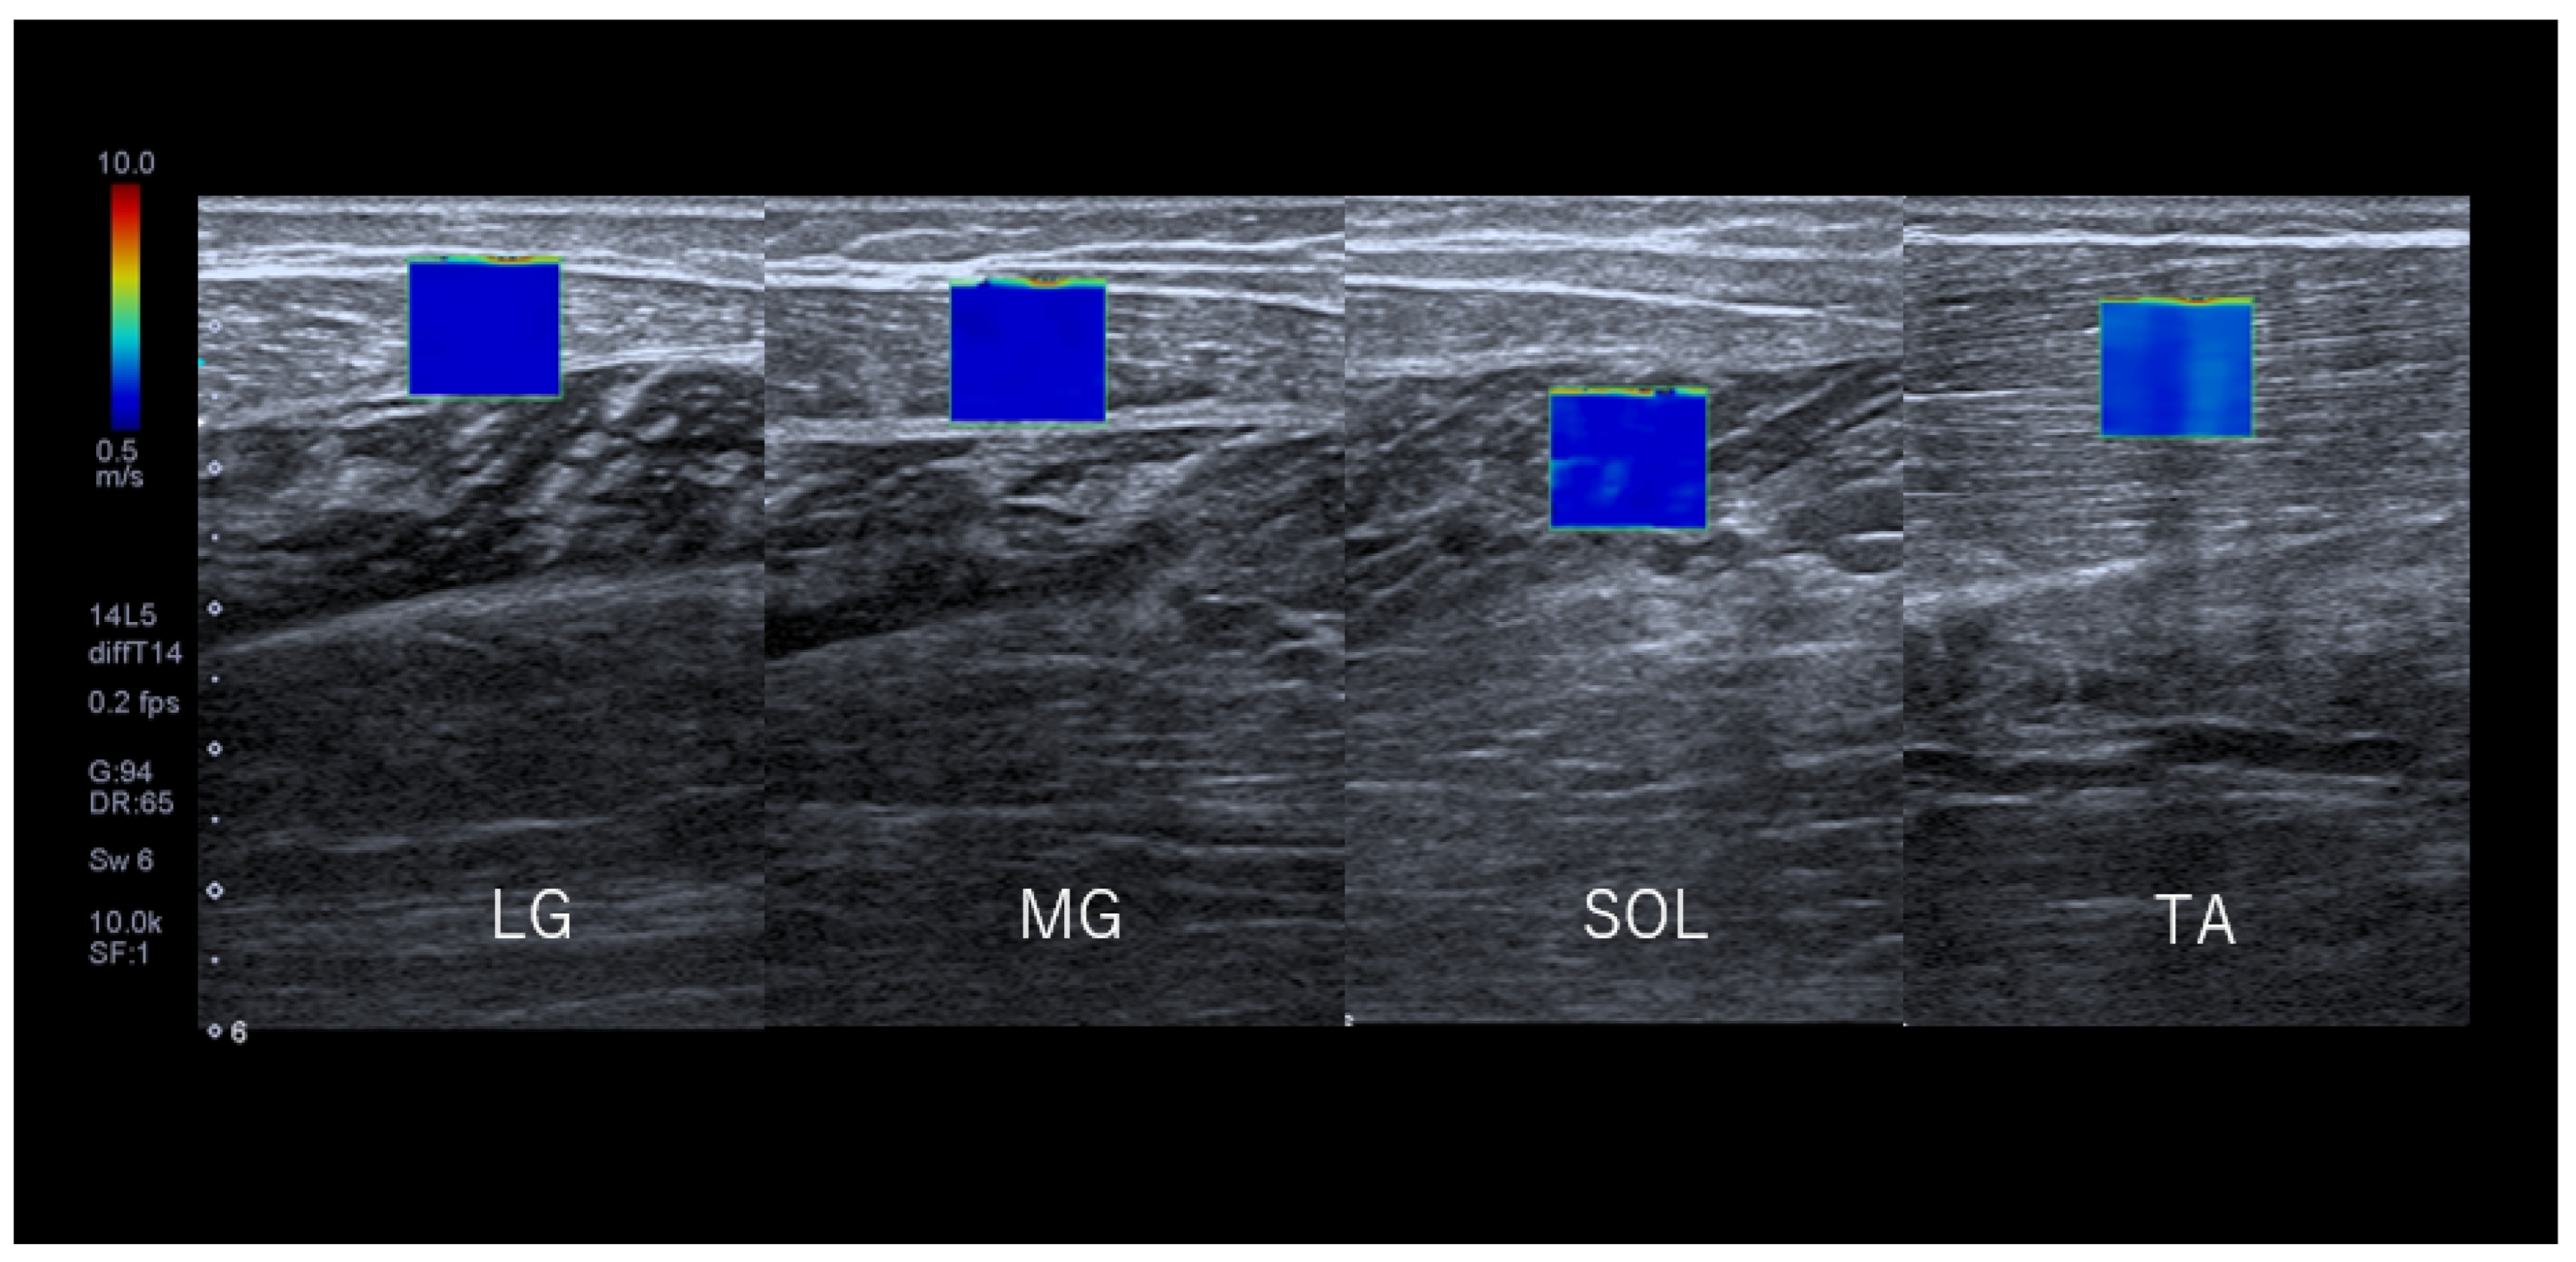
2.4. Measurement of SWV
2.5. Accuracy of SWV
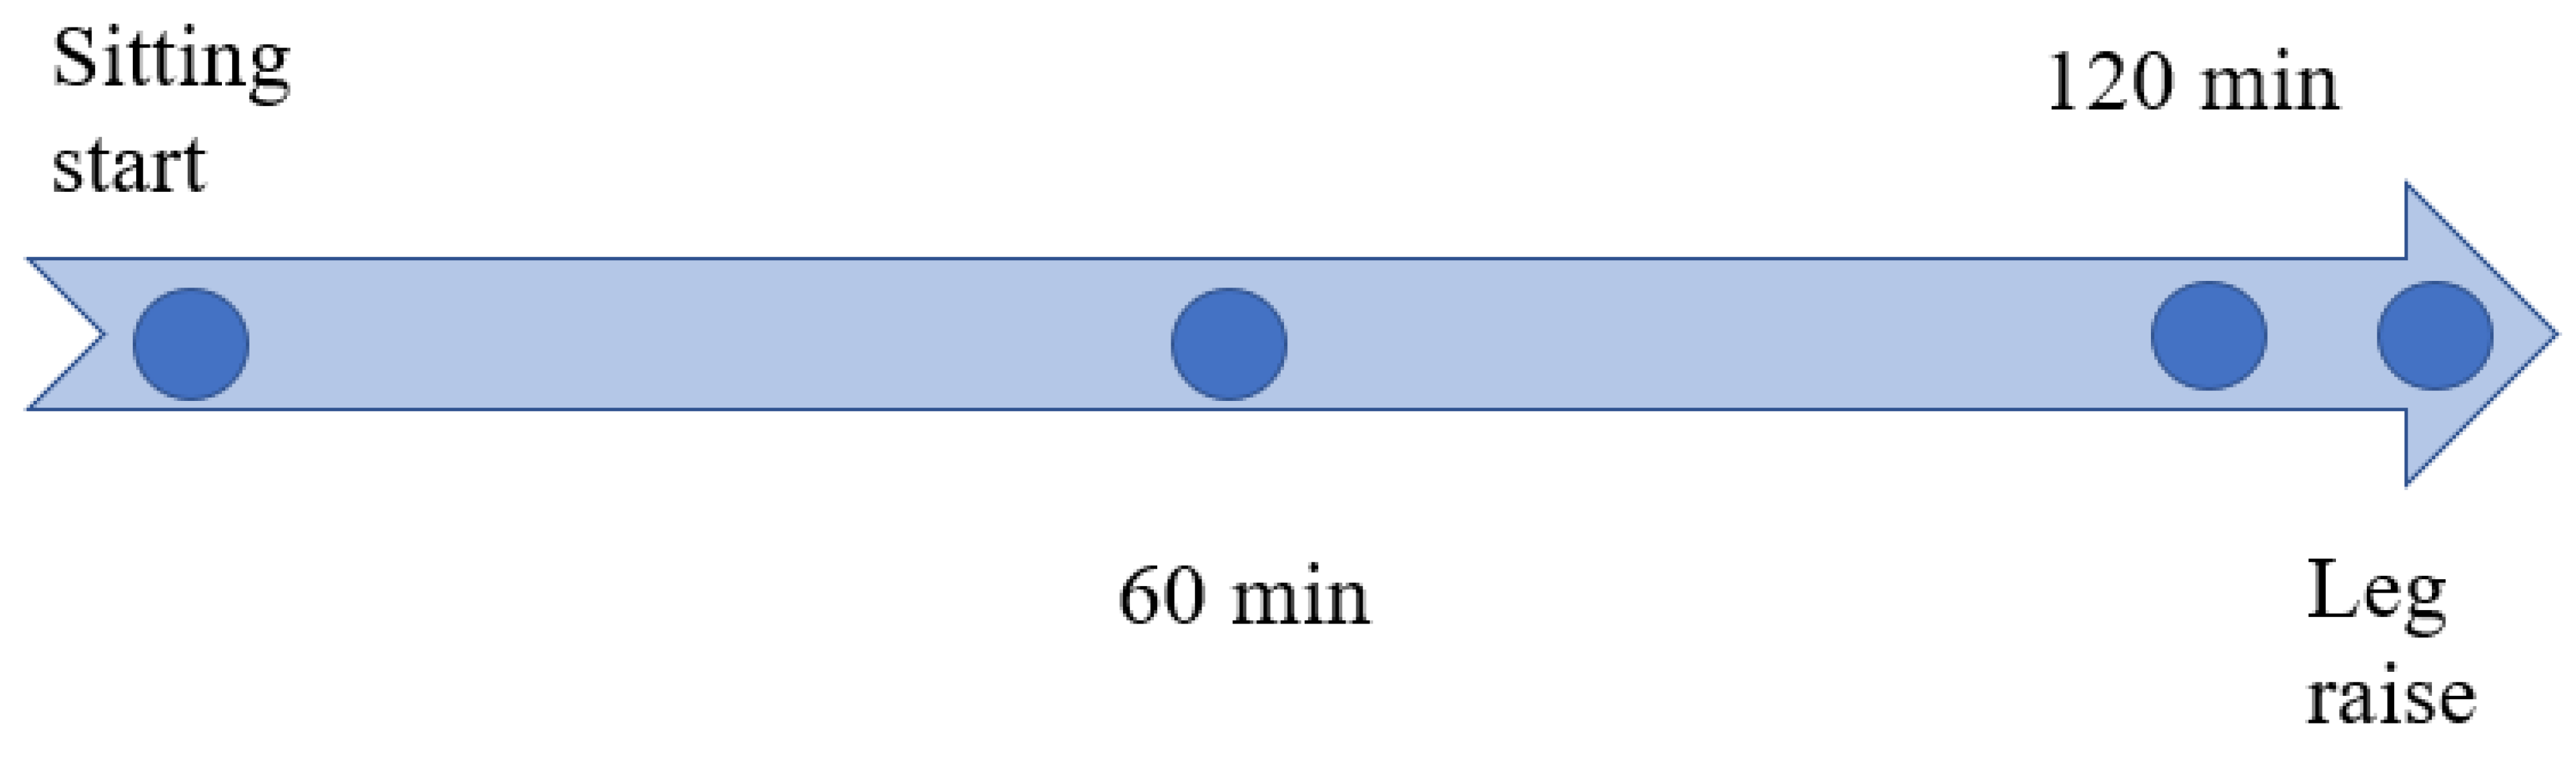
2.6. SWV Measurements
2.7. Reliability Analysis of SWV Measurements
2.8. Surface Electromyography Measurement
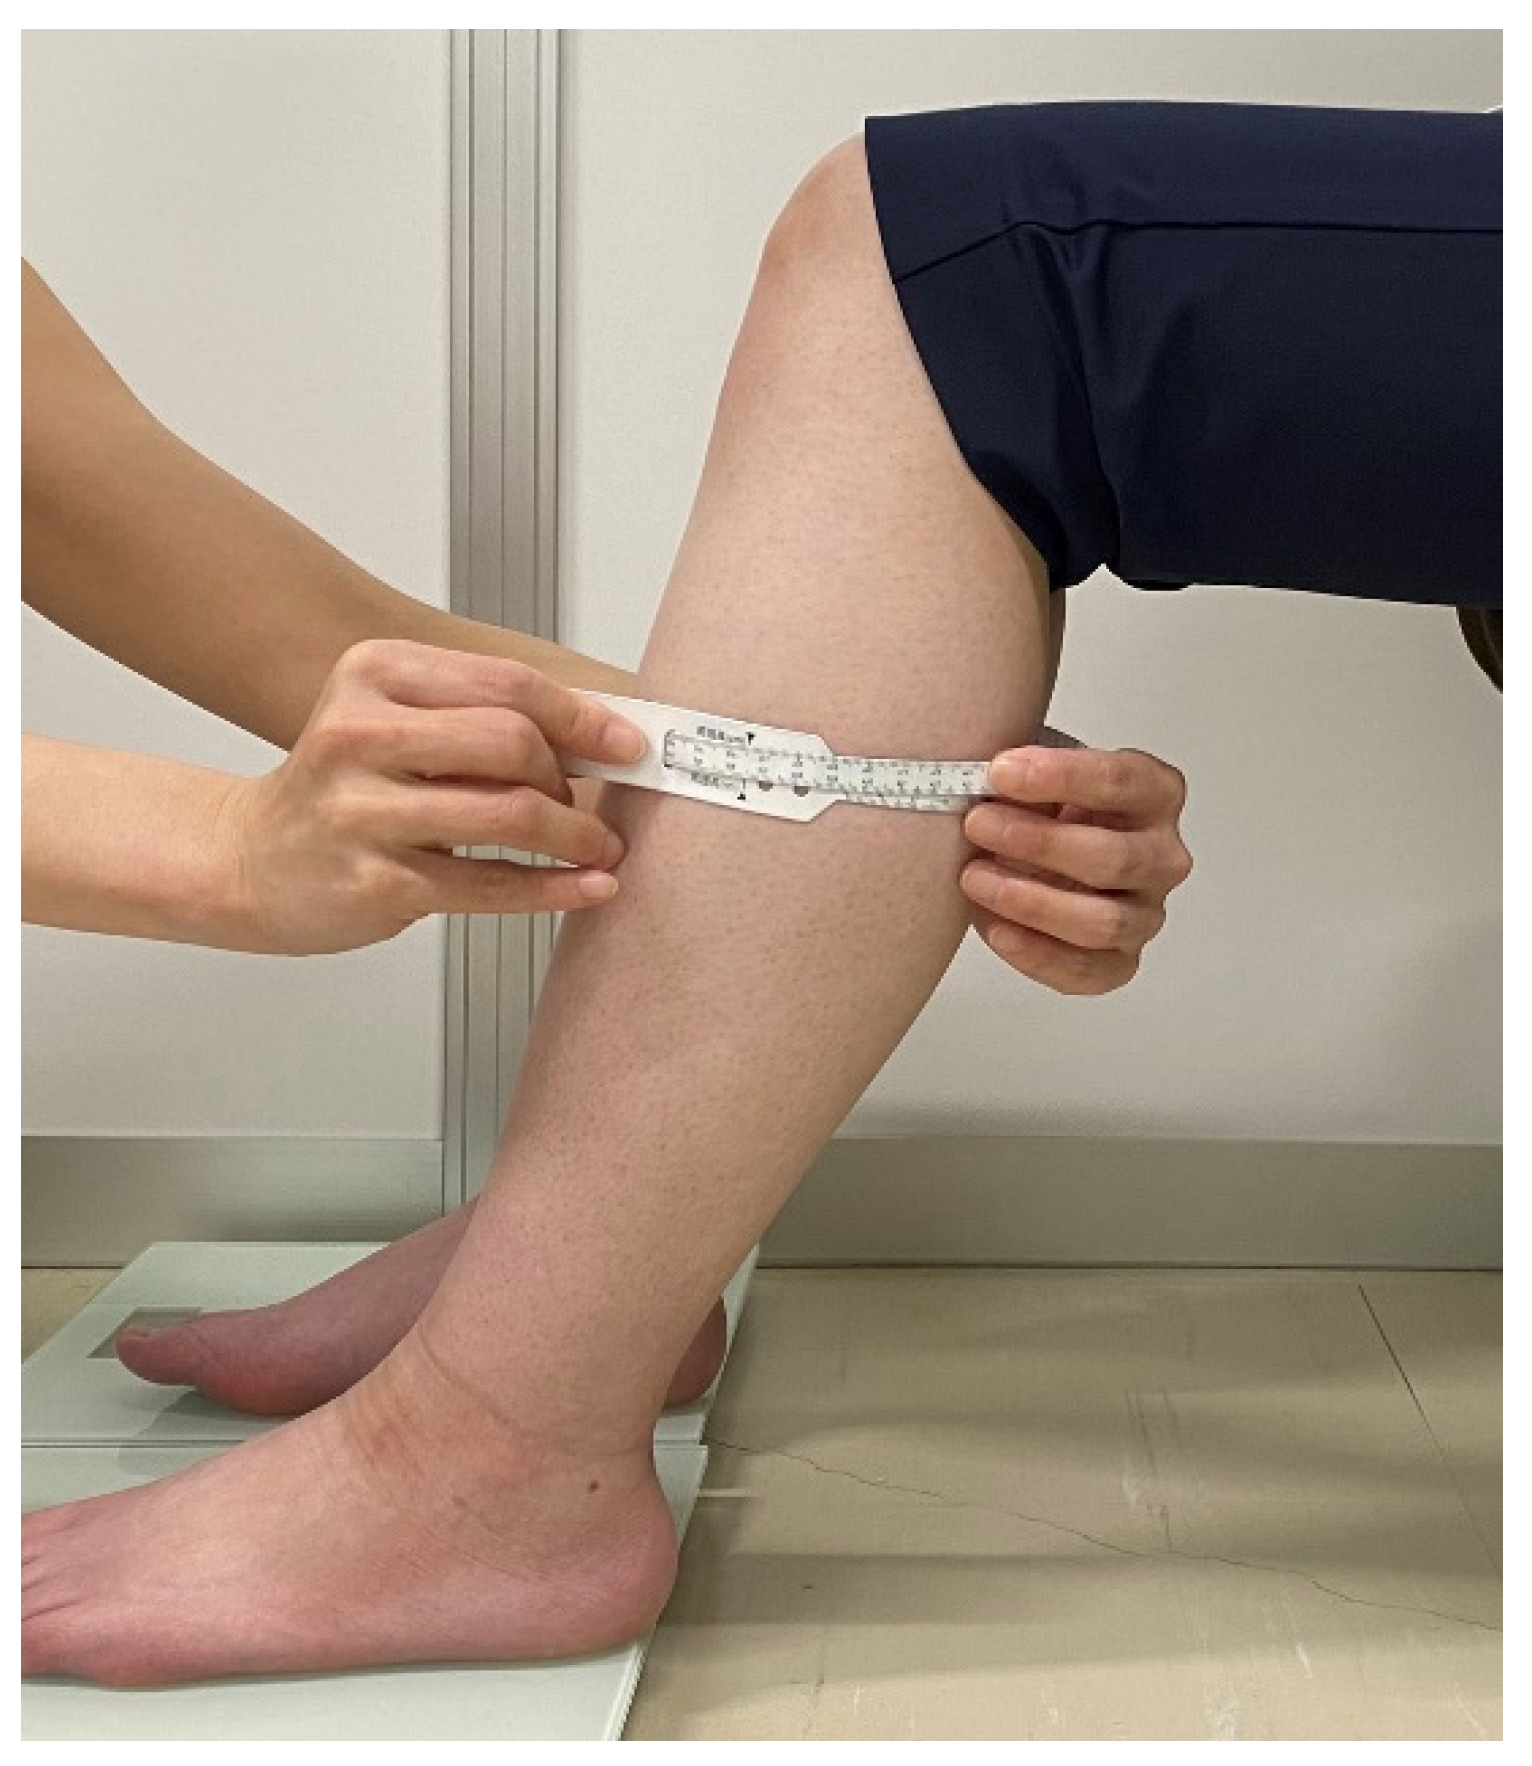
2.9. Lower Leg Circumference Measurement
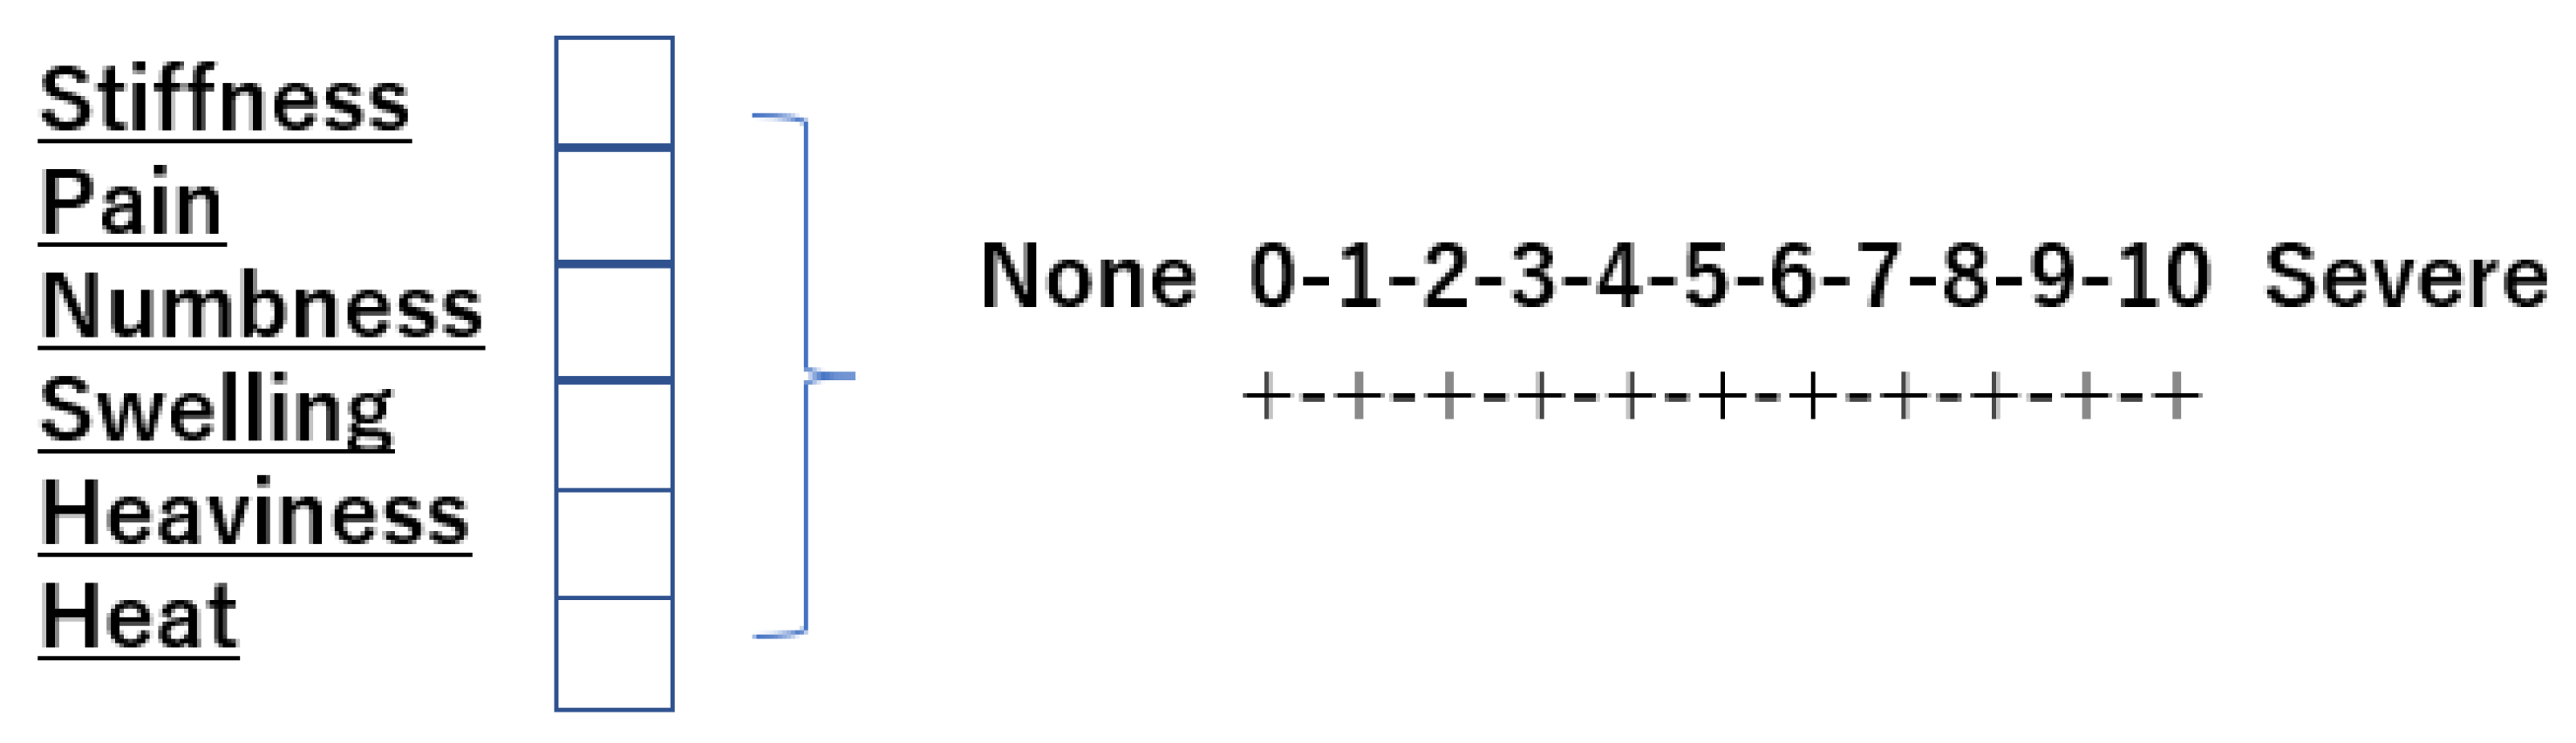
2.10. Lower Leg Discomfort Symptom Assessment
2.11. Statistical Analysis
3. Results
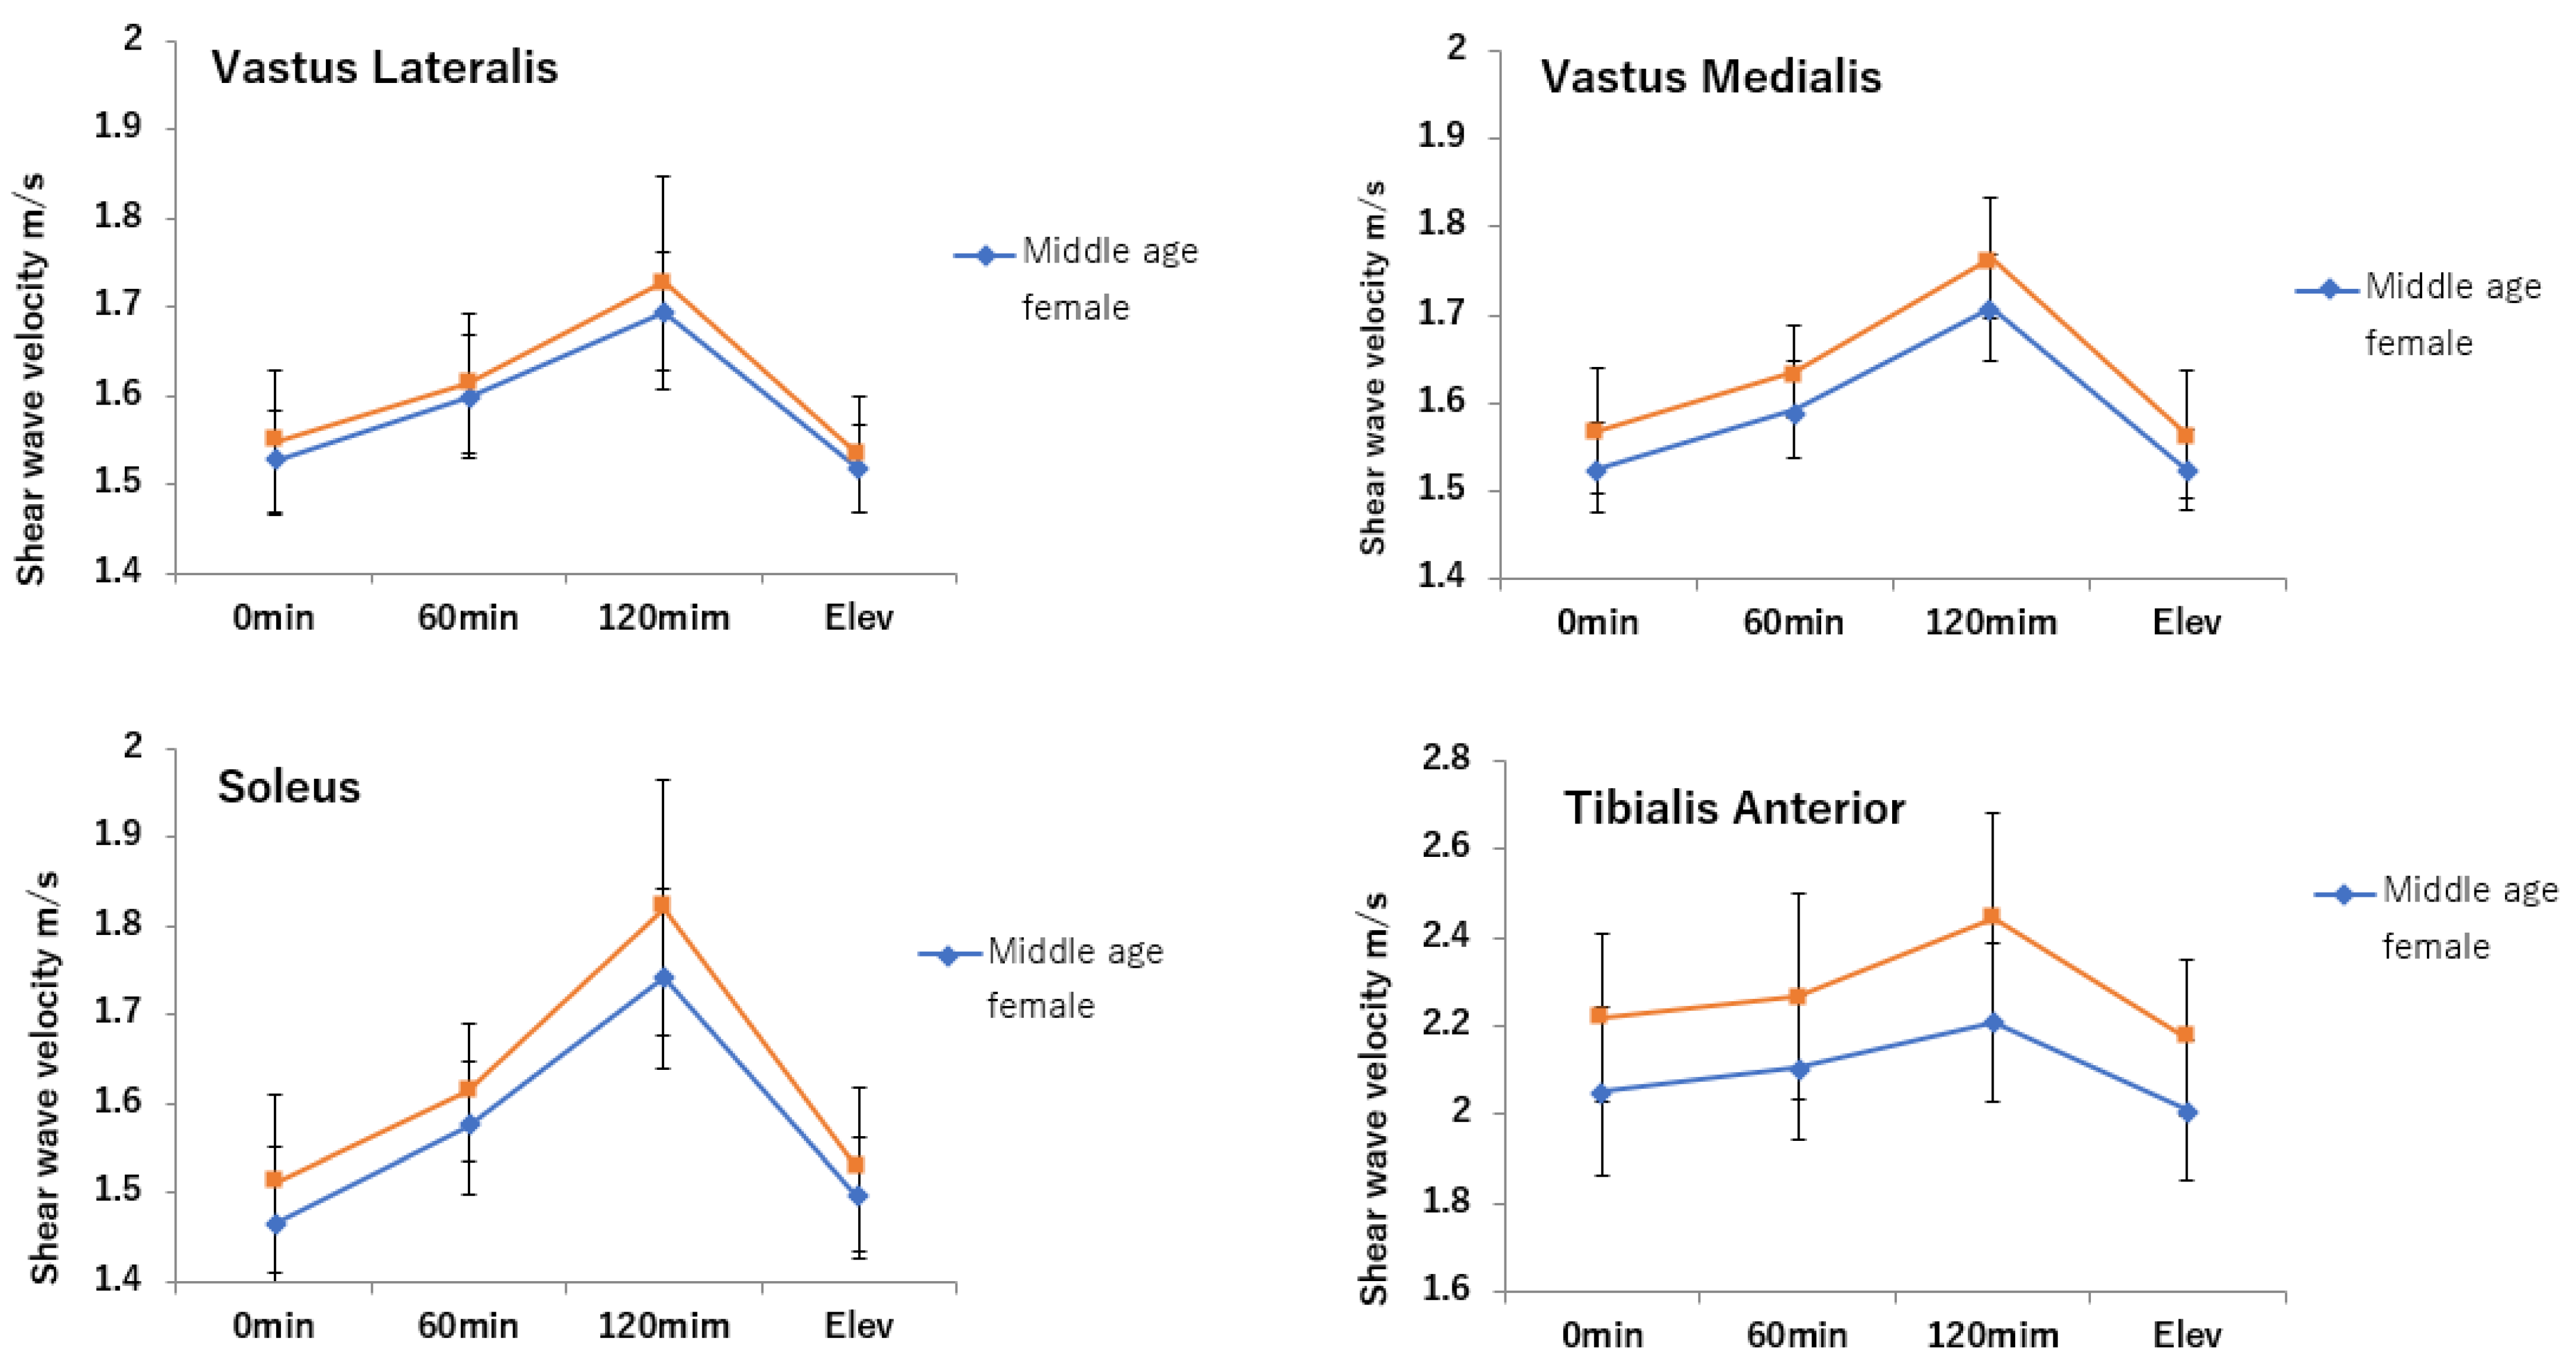
3.1. SWV
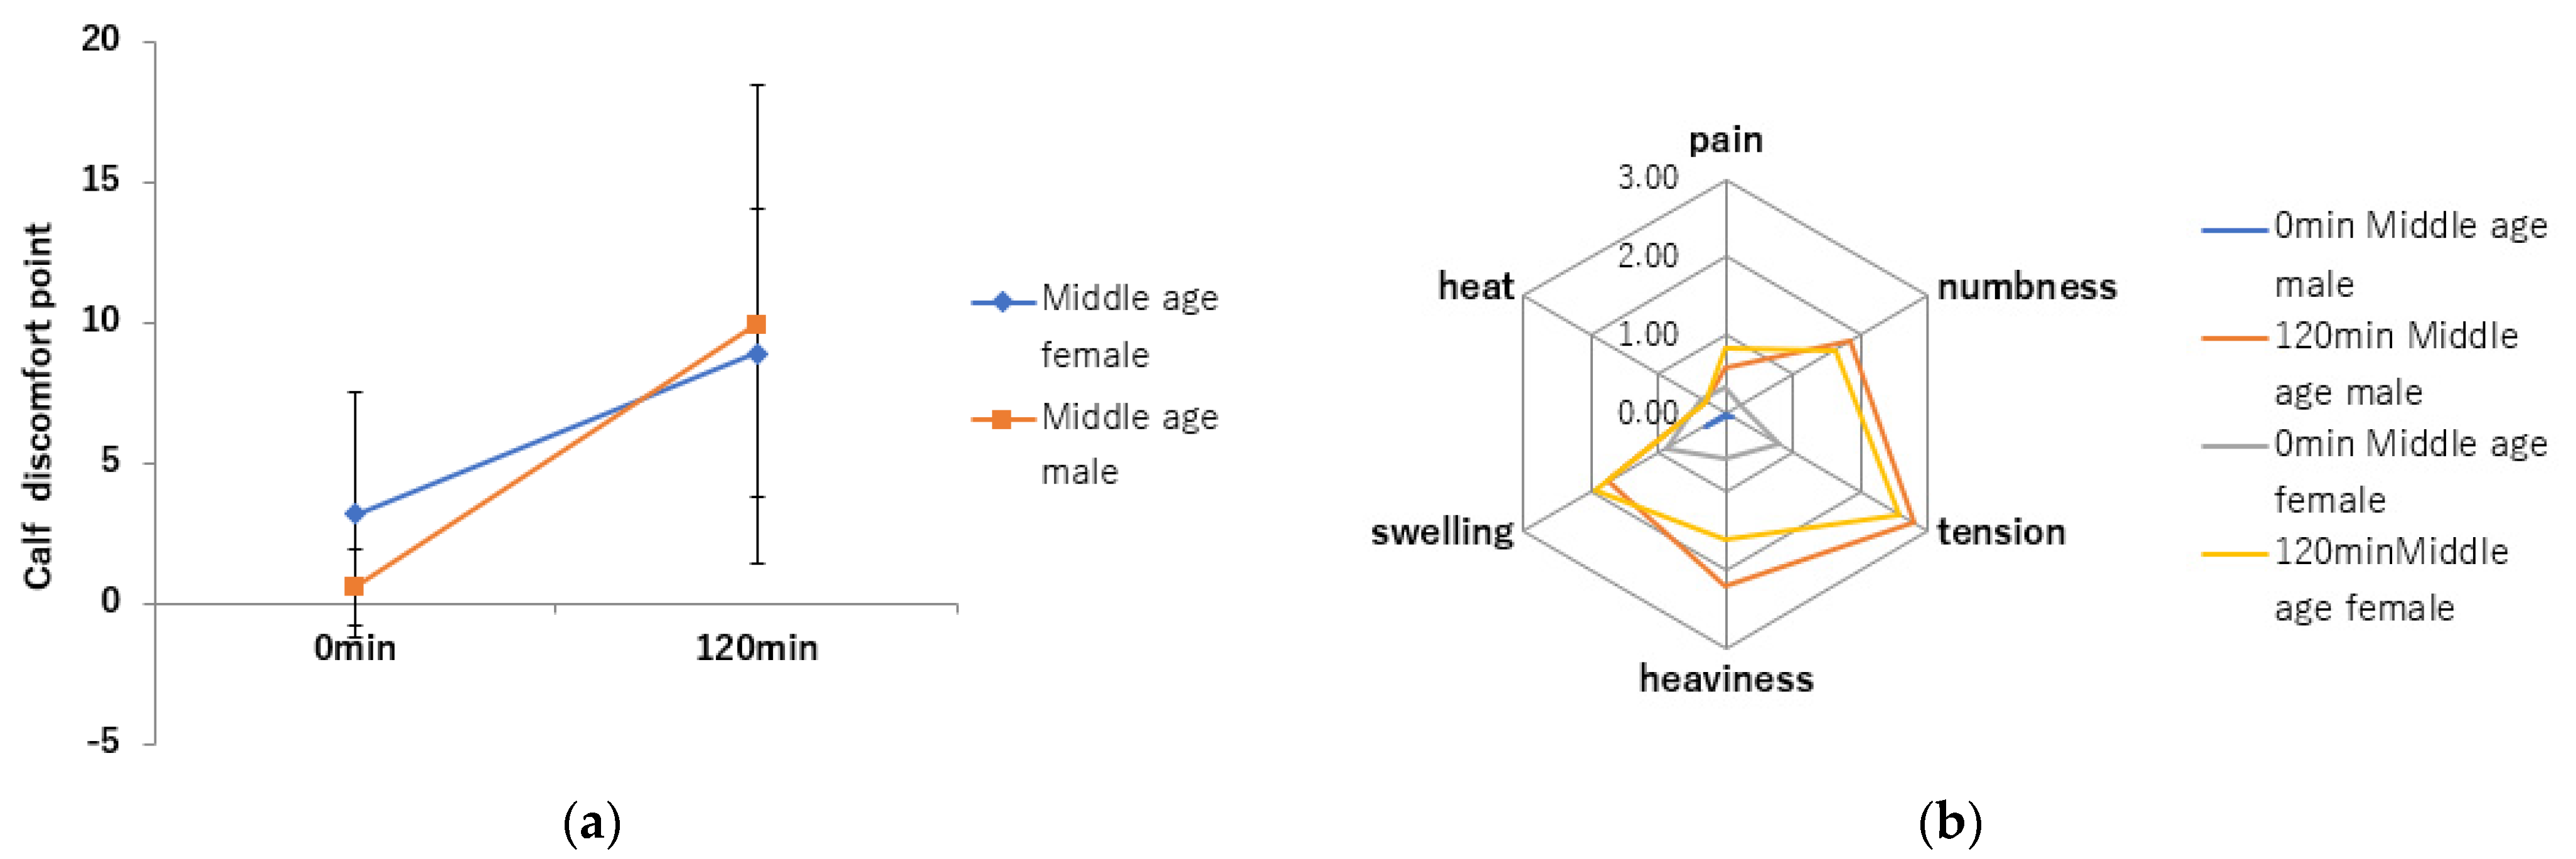
3.2. Lower Leg Discomfort Symptom Assessment
4. Discussions
4.1. Changes in SWV
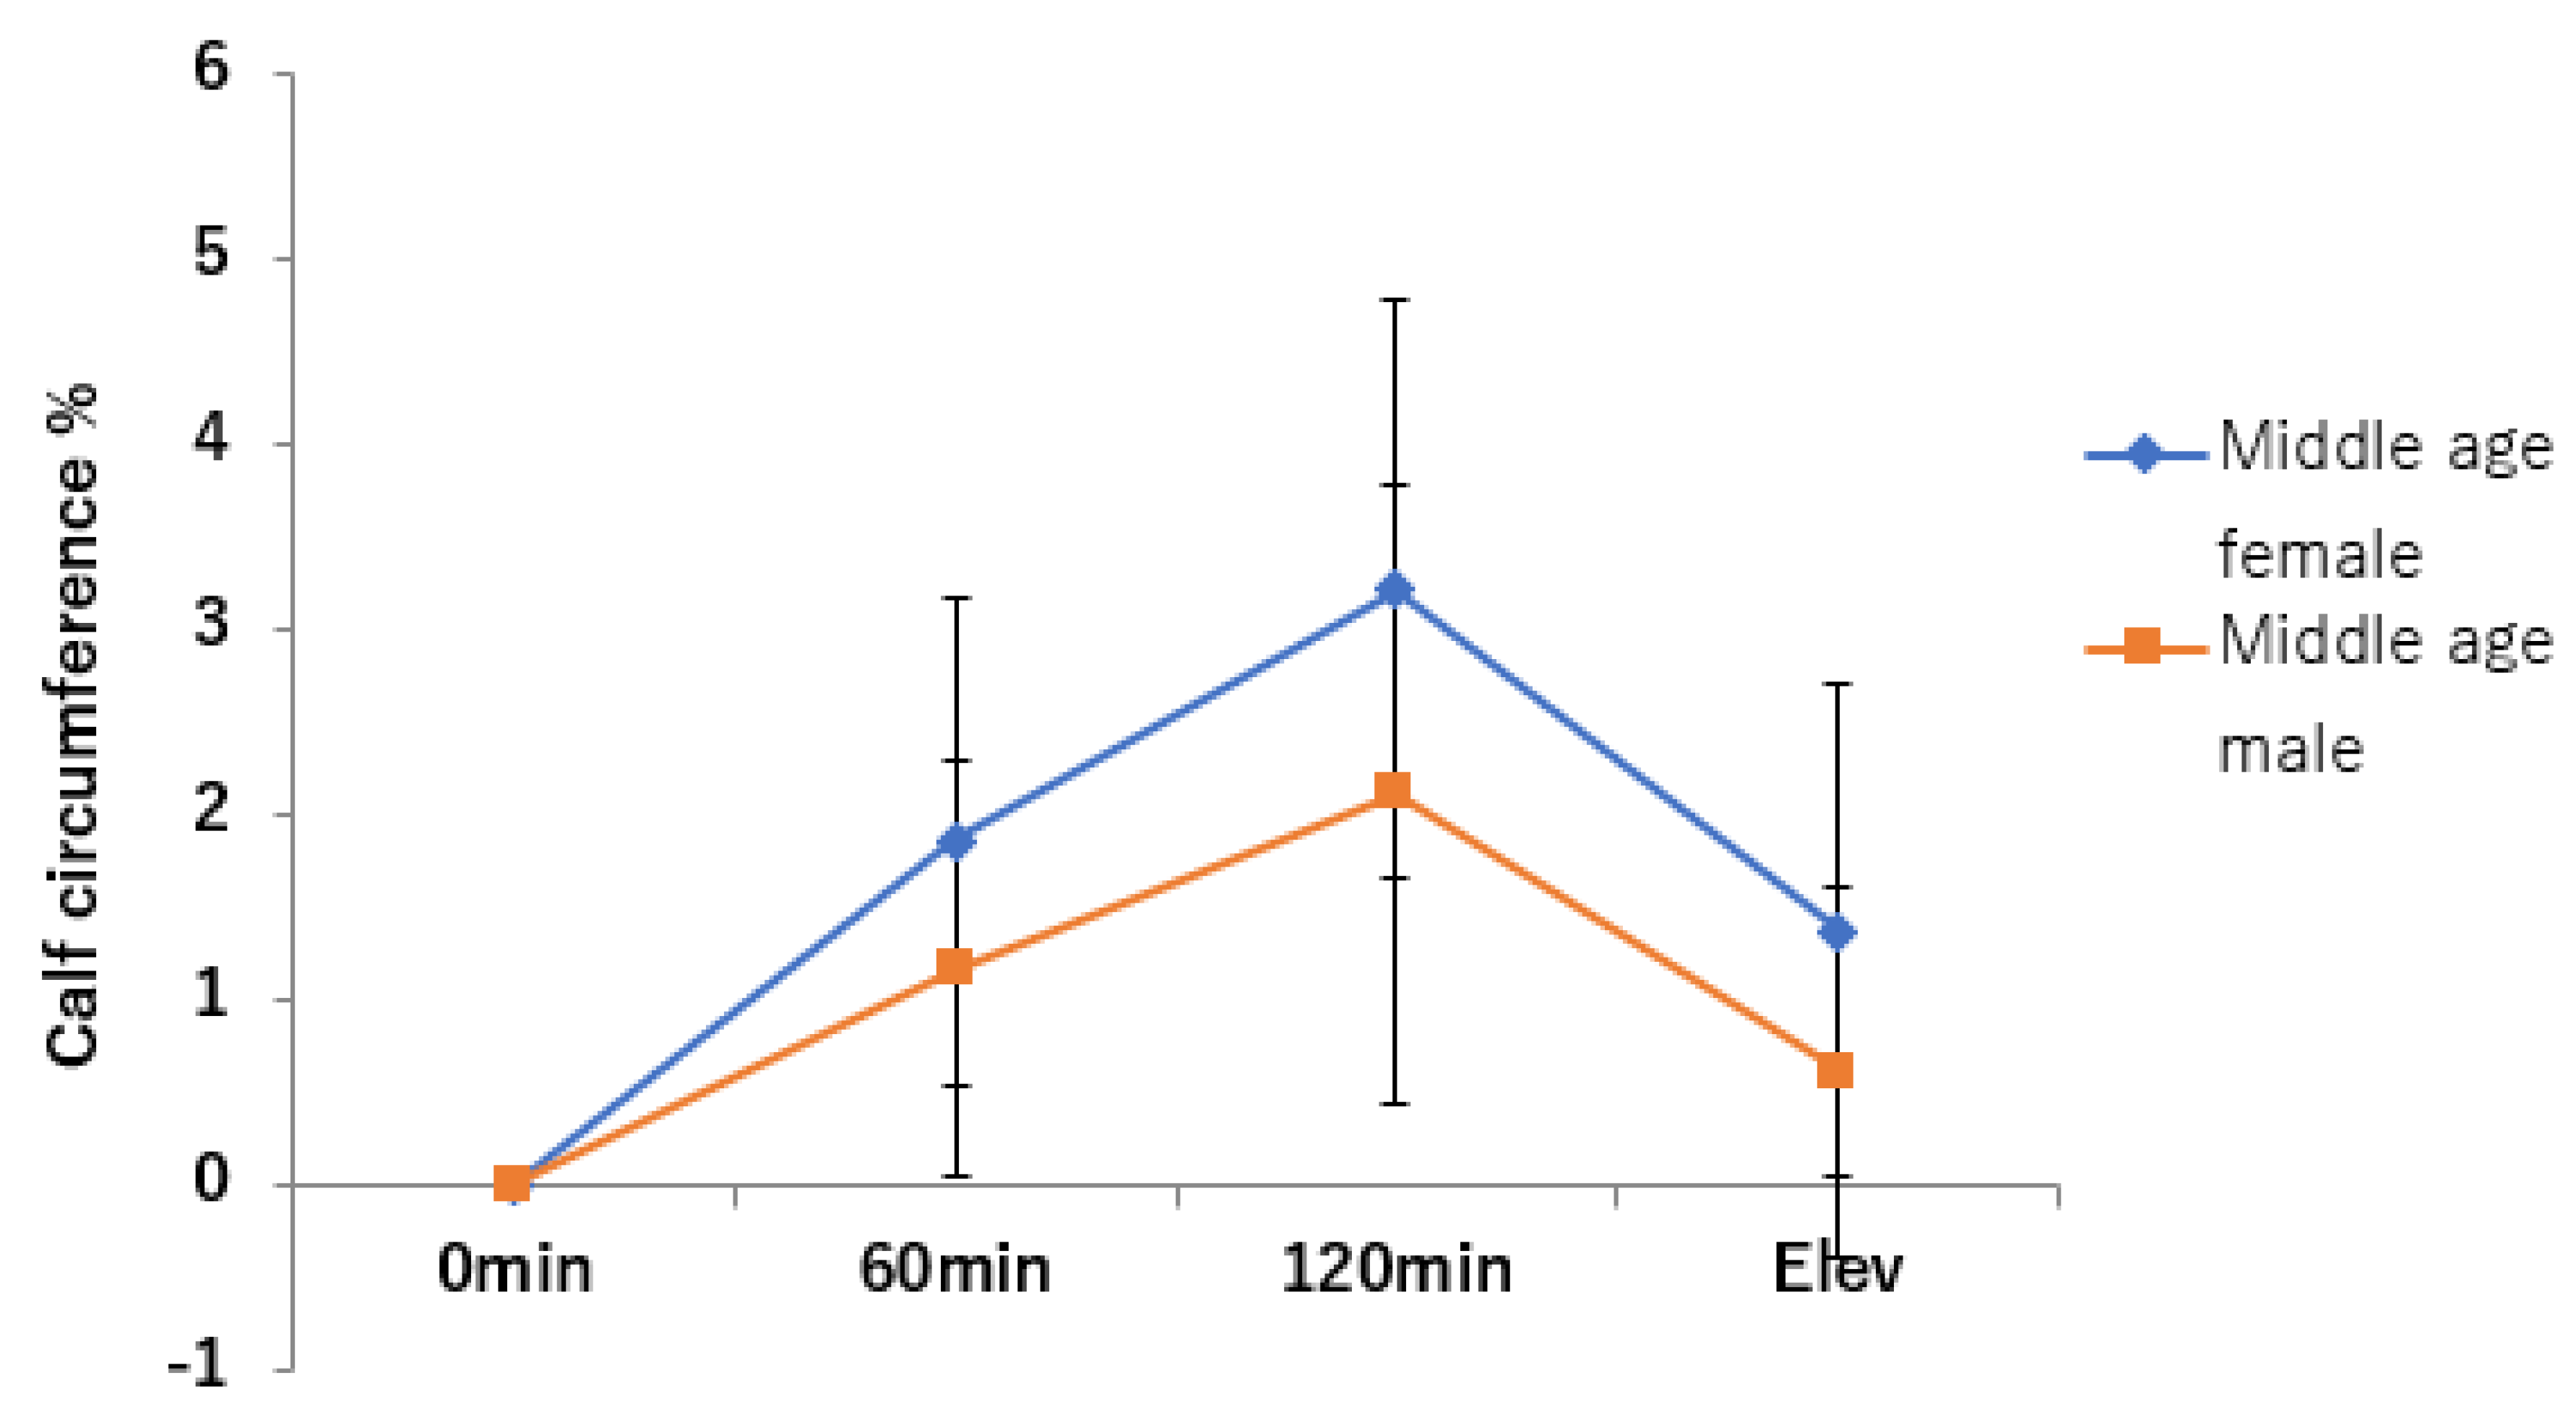
4.2. Leg Circumference
4.3. Reduction of SWV and Leg Circumference by Lower Leg Raising
4.4. Body Composition and Lower Limb Circumference
4.5. Assessment of Lower Leg Discomfort Symptoms
4.6. Sedentary Lifestyle Linked to Musculoskeletal Disease
4.7. Future Study
4.8. Research Limitations
4.8.1. Measurement of Muscle at Rest
4.8.2. Measurement up to 2 h
4.8.3. Venous Hemodynamics
5. Conclusions
Author Contributions
Funding
Institutional Review Board Statement
Informed Consent Statement
Data Availability Statement
Conflicts of Interest
References
- Patterson, R.; McNamara, E.; Taino, M.; de Sa, T.H.; Smith, A.D.; Sharp, S.I.; Edwards, P.; Woodcock, J.; Brage, S.; Wijndaele, K. Sedentary behavior and risk of all-cause, cardiovascular and cancer mortality, and incident type 2 diabetes: A systematic review and dose response meta-analysis. Eur. J. Epidemiol. 2018, 33, 811–829. [Google Scholar] [CrossRef] [PubMed]
- World Health Organization. Physical Inactivity: A Global Public Health Problem; World Health Organization: Geneva, Switzerland, 2020; Available online: https://www.who.int/dietphysicalactivity/factsheet_inactivity/en/ (accessed on 16 June 2022).
- Fennell, C.; Barkley, J.E.; Lepp, A. The relationship between cell phone use, physical, and sedentary behavior in adults aged 18-80. Comput. Hum. Behav. 2019, 90, 53–59. [Google Scholar] [CrossRef]
- Park, J.H.; Moon, J.H.; Kim, H.J.; Kong, M.H.; Oh, Y.H. Sedentary lifestyle, Overview of updated evidence of potential health risks. Korean J. Fam. Med. 2020, 41, 365–373. [Google Scholar] [CrossRef] [PubMed]
- Winkel, J. Swelling of the lower leg in sedentary work—A pilot study. J. Hum. Ergol. 1981, 10, 139–149. [Google Scholar] [CrossRef]
- Widmer, L.K.; Sliva, A.D. Peripheral Venous Disorders: Prevalence and Socio-Medical Importance. Observations in 4529 Apparently Healthy Persons; Basle Study 3; Hans Huber: Bern, Switzerland, 1978; pp. 1–90. ISBN 9783456806778. [Google Scholar]
- Suehiro, K.; Morikage, N.; Murakami, M.; Yamashita, O.; Ueda, K.; Samura, M.; Hamano, K. A study of leg edema in immobile patients. Circ. J. 2014, 78, 1733–1739. [Google Scholar] [CrossRef]
- Belczak, C.E.Q.; de Godoy, J.M.P.; Seidel, A.C.; Belczak, S.; Ramos, R.N.; Caffaro, R.A. Comparison of 15-20mmhg compression stockings in reducing occupational oedema in standing and seated healthy individuals. Int. J. Vasc. Med. 2018, 2018, 2053985. [Google Scholar] [CrossRef]
- Saito, J.; Muraki, S. Research of uncomfortable pain due to prolonged walking and standing. J. Biomech. 2016, 40, 121–130. (In Japanese) [Google Scholar] [CrossRef][Green Version]
- Sudo, M.; Chiba, A.; Ueno, K.; Yada, Y.; Akataki, K.; Mita, K. A psychological study about swelling and fatigue on lower limbs inworking females—An investigation by questionnaire and psychologica1measurement. Jp. Soc. Psychosom. Obstet. Gynecol. 2010, 15, 175–182. (In Japanese) [Google Scholar] [CrossRef]
- Homans, J. Thrombosis of the deep leg veins due to prolonged sitting. N. Engl. J. Med. 1954, 250, 148–149. [Google Scholar] [CrossRef]
- Lapostolle, F.; Surget, V.; Borron, S.W.; Desmaizieres, M.; Sordelet, D.; Lapandry, C.; Cupa, M.; Adnet, F. Severe pulmonary embolism associated with air travel. N. Engl. J. Med. 2001, 345, 779–783. [Google Scholar] [CrossRef]
- Schobersberger, W.; Mittermayr, M.; Innerhofer, P.; Sumann, G.; Schobersberger, B.; Klingler, A.; Simmer, M.; Streif, W.; Fischbach, U.; Fries, D. Coagulation changes and edema formation during long-distance bus travel. Blood Coagul. Fibrinolysis 2004, 15, 419–425. [Google Scholar] [CrossRef] [PubMed]
- Mittermayr, M.; Fries, D.; Gruber, H.; Peer, S.; Klingler, A.; Fischbach, U.; Gunga, H.-C.; Koralewski, E.; Faulhaber, M.; Simmer, M.; et al. Leg edema formation and venous blood velocity during a simulated long-haul flight. Thromb. Res. 2007, 120, 497–504. [Google Scholar] [CrossRef] [PubMed]
- Taylor, A.E. Capillary fluid filtration. Starling forces and lymph flow. Circ. Res. 1981, 49, 557–575. [Google Scholar] [CrossRef]
- Singh, B.; Yadollahi, A.; Lyons, O.; Alshaer, H.; Bradley, T.D. The effect of sitting and calf activity on leg fluid and snoring. Respir. Physiol. Neurobiol. 2017, 240, 1–7. [Google Scholar] [CrossRef]
- Fukui, Y.; Yamamoto, K.; Takamata, A. Effect of calf heating and muscle injury on calf venous compliance and capillary filtration coefficient. Jpn. J. Biometeor. 2007, 44, 13–19. (In Japanese) [Google Scholar]
- Gennisson, J.L.; Deffieux, T.; Mace, E.; Montaldo, G.; Fink, M.; Tanter, M. Viscoelastic and anisotropic mechanical properties of in vivo muscle tissue assessed by supersonic shear imaging. Ultrasound Med. Biol. 2010, 36, 789–801. [Google Scholar] [CrossRef]
- Lacourpaille, L.; Hug, F.; Bouillard, K.; Hogrel, J.Y.; Nordez, A. Supersonic shear imaging provides a reliable measurement of resting muscle shear elastic modulus. Physiol. Meas. 2012, 33, 19–28. [Google Scholar] [CrossRef]
- Maisetti, O.; Hug, F.; Bouillard, K.; Nordez, A. Characterization of passive elastic properties of the human medial gastrocnemius muscle belly using supersonic shear imaging. J. Biomech. 2012, 45, 978–984. [Google Scholar] [CrossRef]
- Okino, K.; Aoki, M.; Yamane, M.; Kohmura, C. Effect of prolonged sitting immobility on shear wave velocity of the lower leg muscles in healthy adults: A proof-of-concept study. PLoS ONE 2021, 16, e0251532. [Google Scholar] [CrossRef]
- Toyoshima, Y.; Webb, J.; Gregory, A.; Fatemi, M.; Alizard, A.; Zhao, C. Ultrasound shear wave elastography for measuring intra-compartmental pressure of compartment syndrome using a turkey hind limb mode. J. Biomech. 2020, 98, 109427. [Google Scholar] [CrossRef]
- Kato, T.; Kanamasu, N.; Kitagawa, K. Physiological examination of plane-seat equipped ankle exerciser to deal with traveler’s thrombosis. Res. J. Phys. Educ. Chukyo Univ. 2003, 44, 17–23. [Google Scholar]
- Kitamura, Y.; Shirai, M.; Sasaki, Y.; Ushi, K. Time-dependent changes in the leg circumference of elderly with prolonged wheelchairs use. J. Jap. Soc. Gerontol. Nurs. 2012, 17, 91–97. (In Japanese) [Google Scholar]
- Sato, A.; Dai, M.; Fujimoto, Y.; Iuchi, T.; Tsuchiya, S.; Tabata, K.; Okuwa, M.; Sugama, J. A prospective observational study of changes in the severity and extent of oedema among elderly inmates of long term care facilities. J. Jap. Soc. WOCM 2016, 20, 329–340. (In Japanese) [Google Scholar] [CrossRef]
- Iuchi, T.; Kobayashi, M.; Tsuchiya, S.; Ohno, N.; Dai, M.; Matsumoto, M.; Ogai, K.; Sato, A.; Sawazaki, T.; Miyati, T.; et al. Objective assessment of leg edema using ultrasonography with a gel pad. PLoS ONE 2017, 12, e0182042. [Google Scholar] [CrossRef] [PubMed]
- Cohen, J. Quantitative methods in psychology. A power primer. Psychol. Bull. 1992, 112, 155–159. [Google Scholar] [CrossRef]
- Taniguchi, K.; Shinohara, M.; Nozaki, S.; Katayose, M. Acute decrease in the stiffness of resting muscle belly due to static stretching. Scand. J. Med. Sci. Sports 2015, 25, 32–40. [Google Scholar] [CrossRef]
- Liu, C.L.; Zhou, J.P.; Sun, P.T.; Chen, B.Z.; Zhang, J.; Tang, C.Z.; Zhang, Z.-J. Influence of different knee and ankle ranges of motion on the elasticity of triceps surae muscles, Achilles tendon, and plantar fascia. Sci. Rep. 2020, 10, 6643. [Google Scholar] [CrossRef]
- Suh, C.H.; Yoon, H.M.; Jung, S.C.; Choi, Y.J. Accuracy and precision of ultrasound shear wave elasticity measurements according to target elasticity and acquisition depth: A phantom study. PLoS ONE 2019, 14, e0219621. [Google Scholar] [CrossRef]
- Saeki, J.; Ikezoe, T.; Yoshimi, S.; Nakamura, M.; Ichihashi, N. Menstrual cycle variation and gender difference in muscle stiffness of triceps surae. Clin. Biomech. 2019, 61, 222–226. [Google Scholar] [CrossRef]
- Hirata, K.; Kanehisa, H.; Mikami-Miyamoto, E.; Miyamoto, N. Evidence for intermuscle difference in slack angle in human triceps surae. J. Biomech. 2015, 48, 1210–1213. [Google Scholar] [CrossRef]
- Hermens, H.J.; Freriks, B.; Dsselhorst-Klug, C.; Rau, G. Development of recommendations for SEMG sensors and sensor placement procedures. J. Electromyogr. Kinesiol. 2000, 10, 361–374. [Google Scholar] [CrossRef]
- Aoyanagi, S.; Arisawa, M. New anthropometric reference values for Japanese, Measuring instrument and technique. Nutr. Assess. Treat. 2002, 19, 1–81. (In Japanese) [Google Scholar]
- Japanese Anthropometric Reference Data: JARD2001_06.pdf. Available online: biglobe.ne.jp (accessed on 1 May 2022).
- Labs, K.H.; Tschoepl, M.; Gamba, G.; Aschwanden, M.; Jaeger, K.A. The reliability of leg circumference assessment: A comparison of spring tape measurements and optoelectronic volumetry. Vasc. Med. 2000, 5, 69–74. [Google Scholar] [CrossRef] [PubMed]
- Miura, K.; Nagai, M.; Ohkubo, T. Epidemiology of Hypertension in Japan—Where Are We Now? Circ. J. 2013, 77, 2226–2231. [Google Scholar] [CrossRef] [PubMed]
- Ely, J.W.; Osheroff, J.A.; Chambliss, M.L.; Ebell, M.H. Approach to leg edema of unclear etiology. J. Am. Board Fam. Med. 2006, 19, 148–160. [Google Scholar] [CrossRef] [PubMed]
- Hitos, K.; Cannon, M.; Cannon, S.; Garth, S.; Fletcher, J.P. Effect of leg exercise on popliteal venous blood flow during prolonged immobility of seated subjects: Implications for prevention of travel-related deep vein thrombosis. J. Thromb. Haemost. 2007, 5, 1890–1895. [Google Scholar] [CrossRef]
- Yamamoto, K.; Nishiki, M. Multi-frequency bioelectrical impedance method for the assessment of body composition in Japanese. Med. J. Hiroshima Univ. 2000, 48, 259–266. [Google Scholar] [CrossRef]
- Lee, S.H.; Son, C.; Yeo, S.; Ha, I.H. Cross-sectional analysis of self-reported sedentary behaviors and chronic knee pain among South Korean adults over 50 years of age in KNHANES 2013–2015. BMC Public Health 2019, 19, 1375. [Google Scholar] [CrossRef]
- Yoshimura, N.; Muraki, S.; Oka, H.; Mabuchi, A.; En-Yo, Y.; Yoshida, M.; Saika, A.; Yoshida, H.; Suzuki, T.; Yamamoto, S.; et al. Prevalence of knee osteoarthritis, lumbar spinal spondylosis, and osteoporosis in Japanese men and women: The research on osteoarthritis/osteoporosis against disability study. J. Bone Miner Metab. 2009, 27, 620–628. [Google Scholar] [CrossRef]
- Mow, V.C.; Holmes, M.H.; Lai, W.M. Fluid transport and mechanical properties of articular cartilage and meniscus. A review. J. Biomech. 1984, 17, 377–394. [Google Scholar] [CrossRef]
- Diaz, K.M.; Duran, A.T.; Colabianchi, N.; Judd, S.E.; Howard, V.J.; Hooker, S.P. Potential effects on mortality of replacing sedentary time with short sedentary bouts or physical activity: A national cohort study. Am. J. Epidemiol. 2019, 188, 537–544. [Google Scholar] [CrossRef] [PubMed]
- Eby, S.F.; Song, P.; Chen, S.; Chen, Q.; Greenleaf, J.F.; An, K.N. Validation of shear wave elastography in skeletal muscle. J. Biomech. 2013, 46, 2381–2387. [Google Scholar] [CrossRef] [PubMed]
- Alimi, Y.S.; Barthelemy, P.; Juhan, C. Venous pump of the calf: A study of venous and muscular pressures. J. Vasc. Surg. 1994, 20, 728–735. [Google Scholar] [CrossRef]
- Recek, C. Calf pump activity influencing venous hemodynamic in lower extremity. Int. J. Angiol. 2013, 22, 23–30. [Google Scholar] [CrossRef]


| Height | Weight | BMI | Body Fat | Body Water | Leg Muscle | Body Fat | Body Water | Leg Muscle | |
|---|---|---|---|---|---|---|---|---|---|
| (m) | (kg) | (kg) | (kg) | (kg) | (%) | % | (%) | ||
| Middle age male | 168 (6.5) | 65.6 (8.5) | 23.6 (5.3) | 14.3 (5.3) | 35.8 (4.4) | 8.7 (1.1) | 21.8 (7.4) | 54.7 (5.2) | 13.1 (0.9) |
| (n = 21) | |||||||||
| Middle age female | 156.6 (6.5) | 52.1 (7.5) | 21.4 (3.2) | 15.2 (6.5) | 27.0 (2.5) | 6.0 (0.5) | 27.1 (7.6) | 52.3 (5.2) | 11.7 (1.3) |
| (n = 19) | |||||||||
| Mean (SD) |
| LG | MG | SOL | TA | ||
|---|---|---|---|---|---|
| Middle age male | 0 min | 1.55 (0.08) | 1.57 (0.07) | 1.51 (0.10) | 2.22 (0.19) |
| (n = 21) | 60 min | 1.61 (0.08) | 1.63 (0.05) | 1.61 (0.08) | 2.27 (0.23) |
| 120 min | 1.73 (0.12) | 1.76 (0.07) | 1.82 (0.14) | 2.44 (0.24) | |
| Leg raising | 1.53 (0.06) | 1.56 (0.07) | 1.53 (0.09) | 2.17 (0.18) | |
| Middle age female | 0 min | 1.53 (0.06) | 1.53 (0.05) | 1.46 (0.09) | 2.05 (0.19) |
| (n = 19) | 60 min | 1.60 (0.07) | 1.59 (0.06) | 1.57 (0.08) | 2.11 (0.16) |
| 120 min | 1.70 (0.07) | 1.71 (0.06) | 1.74 (0.10) | 2.21 (0.18) | |
| Leg raising | 1.52 (0.05) | 1.52 (0.05) | 1.49 (0.07) | 2.01 (0.16) | |
| Unit: m/s | |||||
| Mean (SD) |
| Increase in Calf Circumference | ||
|---|---|---|
| Middle age male | 0 min | 0 (0) |
| (n = 15) | 60 min | 1.16 (1.13) |
| 120 min | 1.85 (1.52) | |
| Leg raising | 0.61 (1.00) | |
| Middle age female | 0 min | 0 (0) |
| (n = 16) | 60 mis | 1.86 (1.32) |
| 120 min | 3.20 (1.55) | |
| Leg raising | 1.37 (1.32) | |
| Relative calf circumference: Circumference values of 60 min, 120 min, and Leg raising/Circumference value of 0 min | ||
| Unit: % | ||
| Mean (SD) | ||
Publisher’s Note: MDPI stays neutral with regard to jurisdictional claims in published maps and institutional affiliations. |
© 2022 by the authors. Licensee MDPI, Basel, Switzerland. This article is an open access article distributed under the terms and conditions of the Creative Commons Attribution (CC BY) license (https://creativecommons.org/licenses/by/4.0/).
Share and Cite
Okino, K.; Aoki, M.; Yamane, M.; Kataoka, Y.; Nitta, A.; Kohmura, C. Prolonged Sitting Causes Leg Discomfort in Middle Aged Adults: Evaluation of Shear Wave Velocity, Calf Circumference, and Discomfort Questionaries. J. Clin. Med. 2022, 11, 4024. https://doi.org/10.3390/jcm11144024
Okino K, Aoki M, Yamane M, Kataoka Y, Nitta A, Kohmura C. Prolonged Sitting Causes Leg Discomfort in Middle Aged Adults: Evaluation of Shear Wave Velocity, Calf Circumference, and Discomfort Questionaries. Journal of Clinical Medicine. 2022; 11(14):4024. https://doi.org/10.3390/jcm11144024
Chicago/Turabian StyleOkino, Kumiko, Mitsuhiro Aoki, Masahiro Yamane, Yoshiaki Kataoka, Asami Nitta, and Chikashi Kohmura. 2022. "Prolonged Sitting Causes Leg Discomfort in Middle Aged Adults: Evaluation of Shear Wave Velocity, Calf Circumference, and Discomfort Questionaries" Journal of Clinical Medicine 11, no. 14: 4024. https://doi.org/10.3390/jcm11144024
APA StyleOkino, K., Aoki, M., Yamane, M., Kataoka, Y., Nitta, A., & Kohmura, C. (2022). Prolonged Sitting Causes Leg Discomfort in Middle Aged Adults: Evaluation of Shear Wave Velocity, Calf Circumference, and Discomfort Questionaries. Journal of Clinical Medicine, 11(14), 4024. https://doi.org/10.3390/jcm11144024