
Construction of a Glycaemia-Based Signature for Predicting Acute Kidney Injury in Ischaemic Stroke Patients after Endovascular Treatment


 and
and
Abstract
:1. Introduction
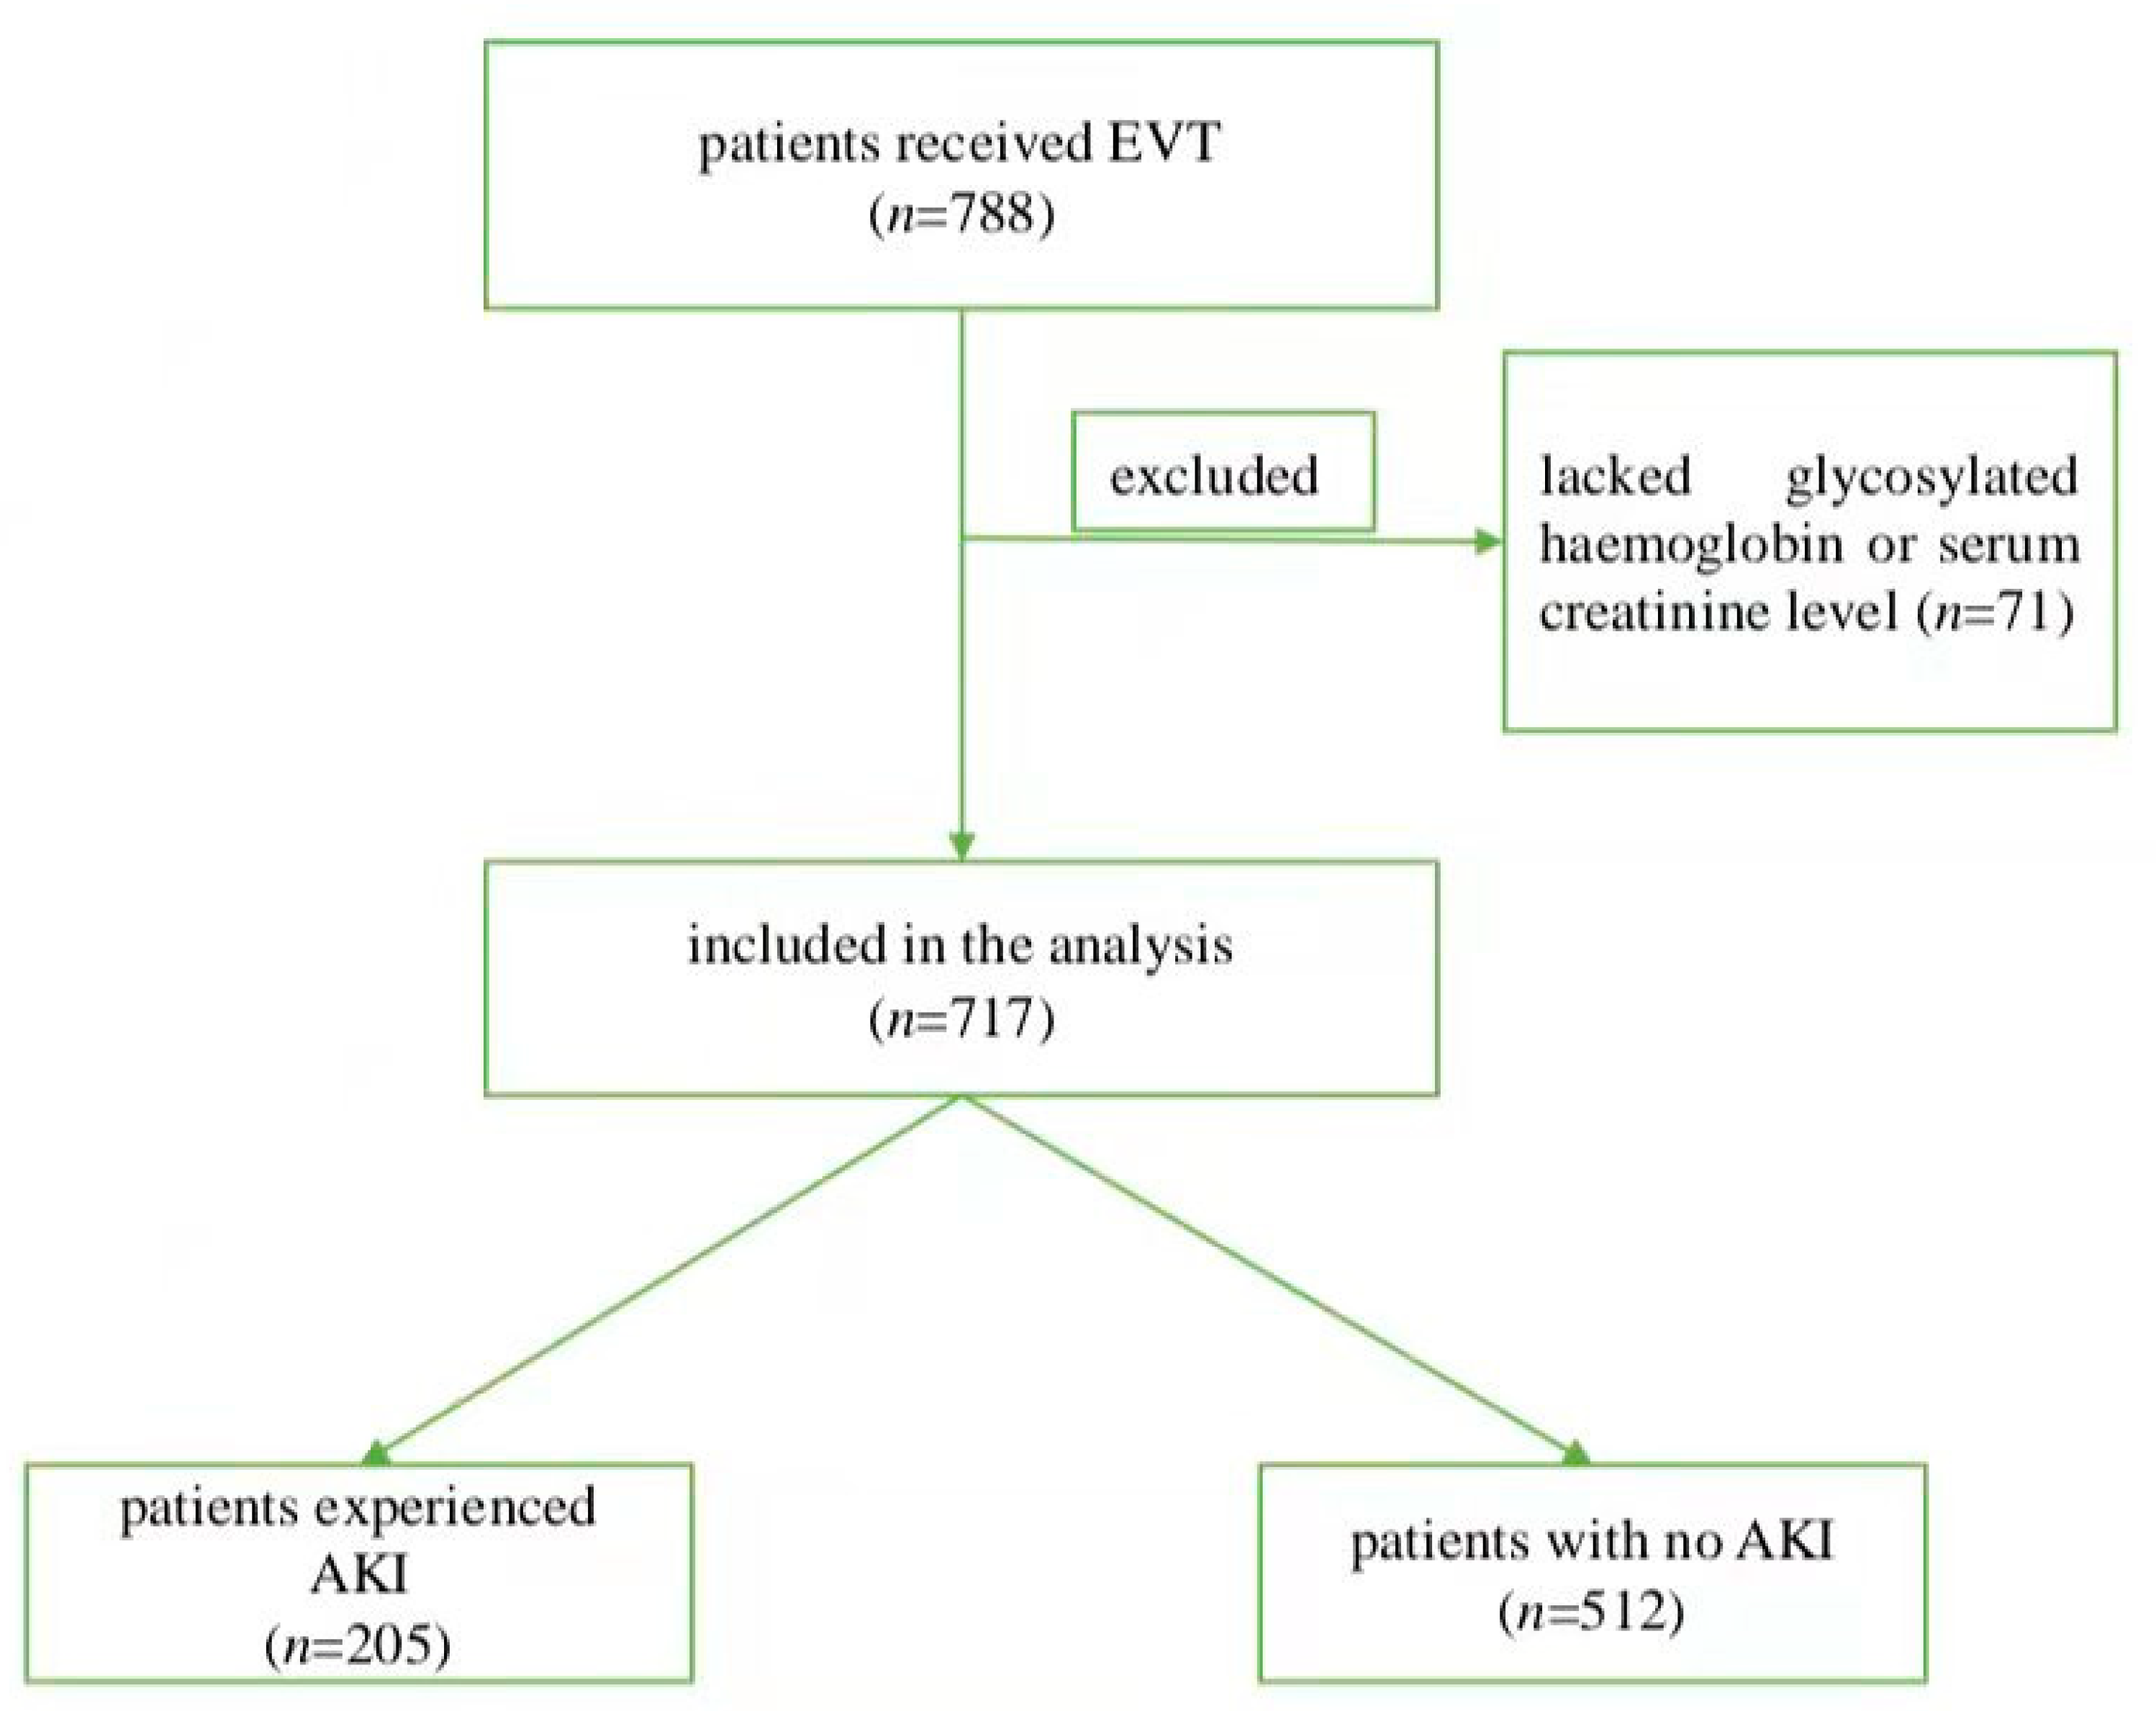
2. Methods
3. Statistical Analysis
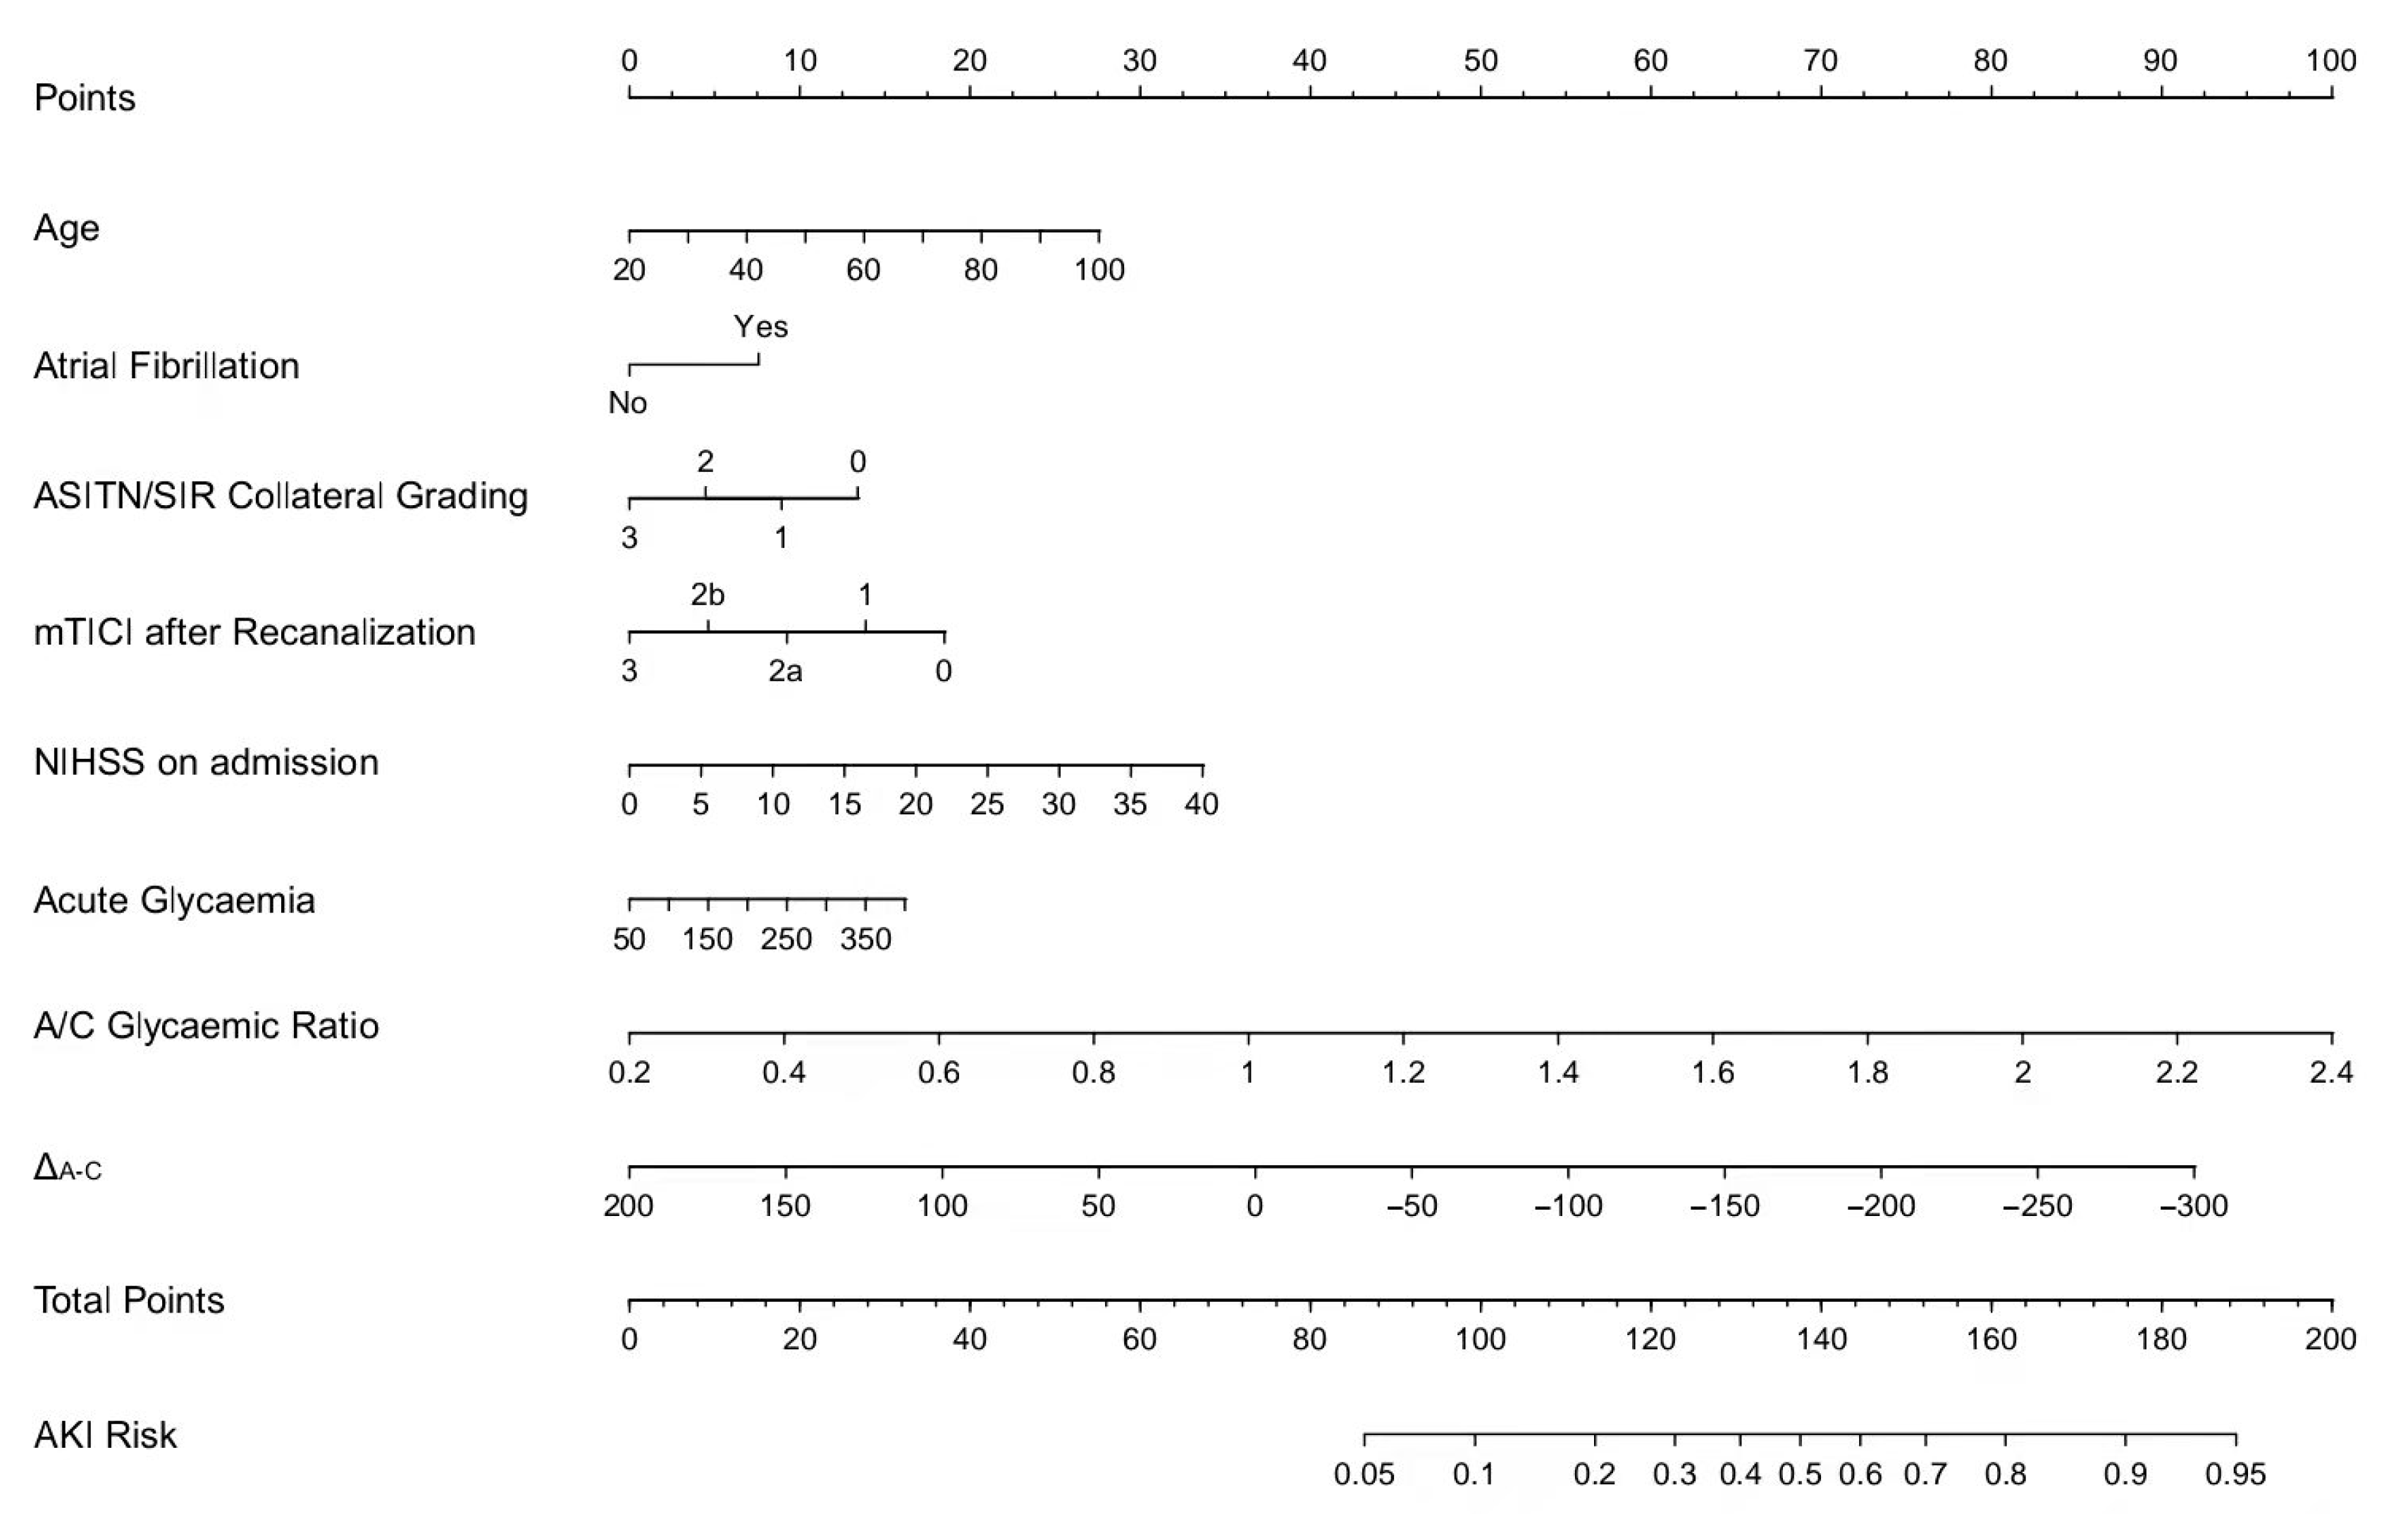
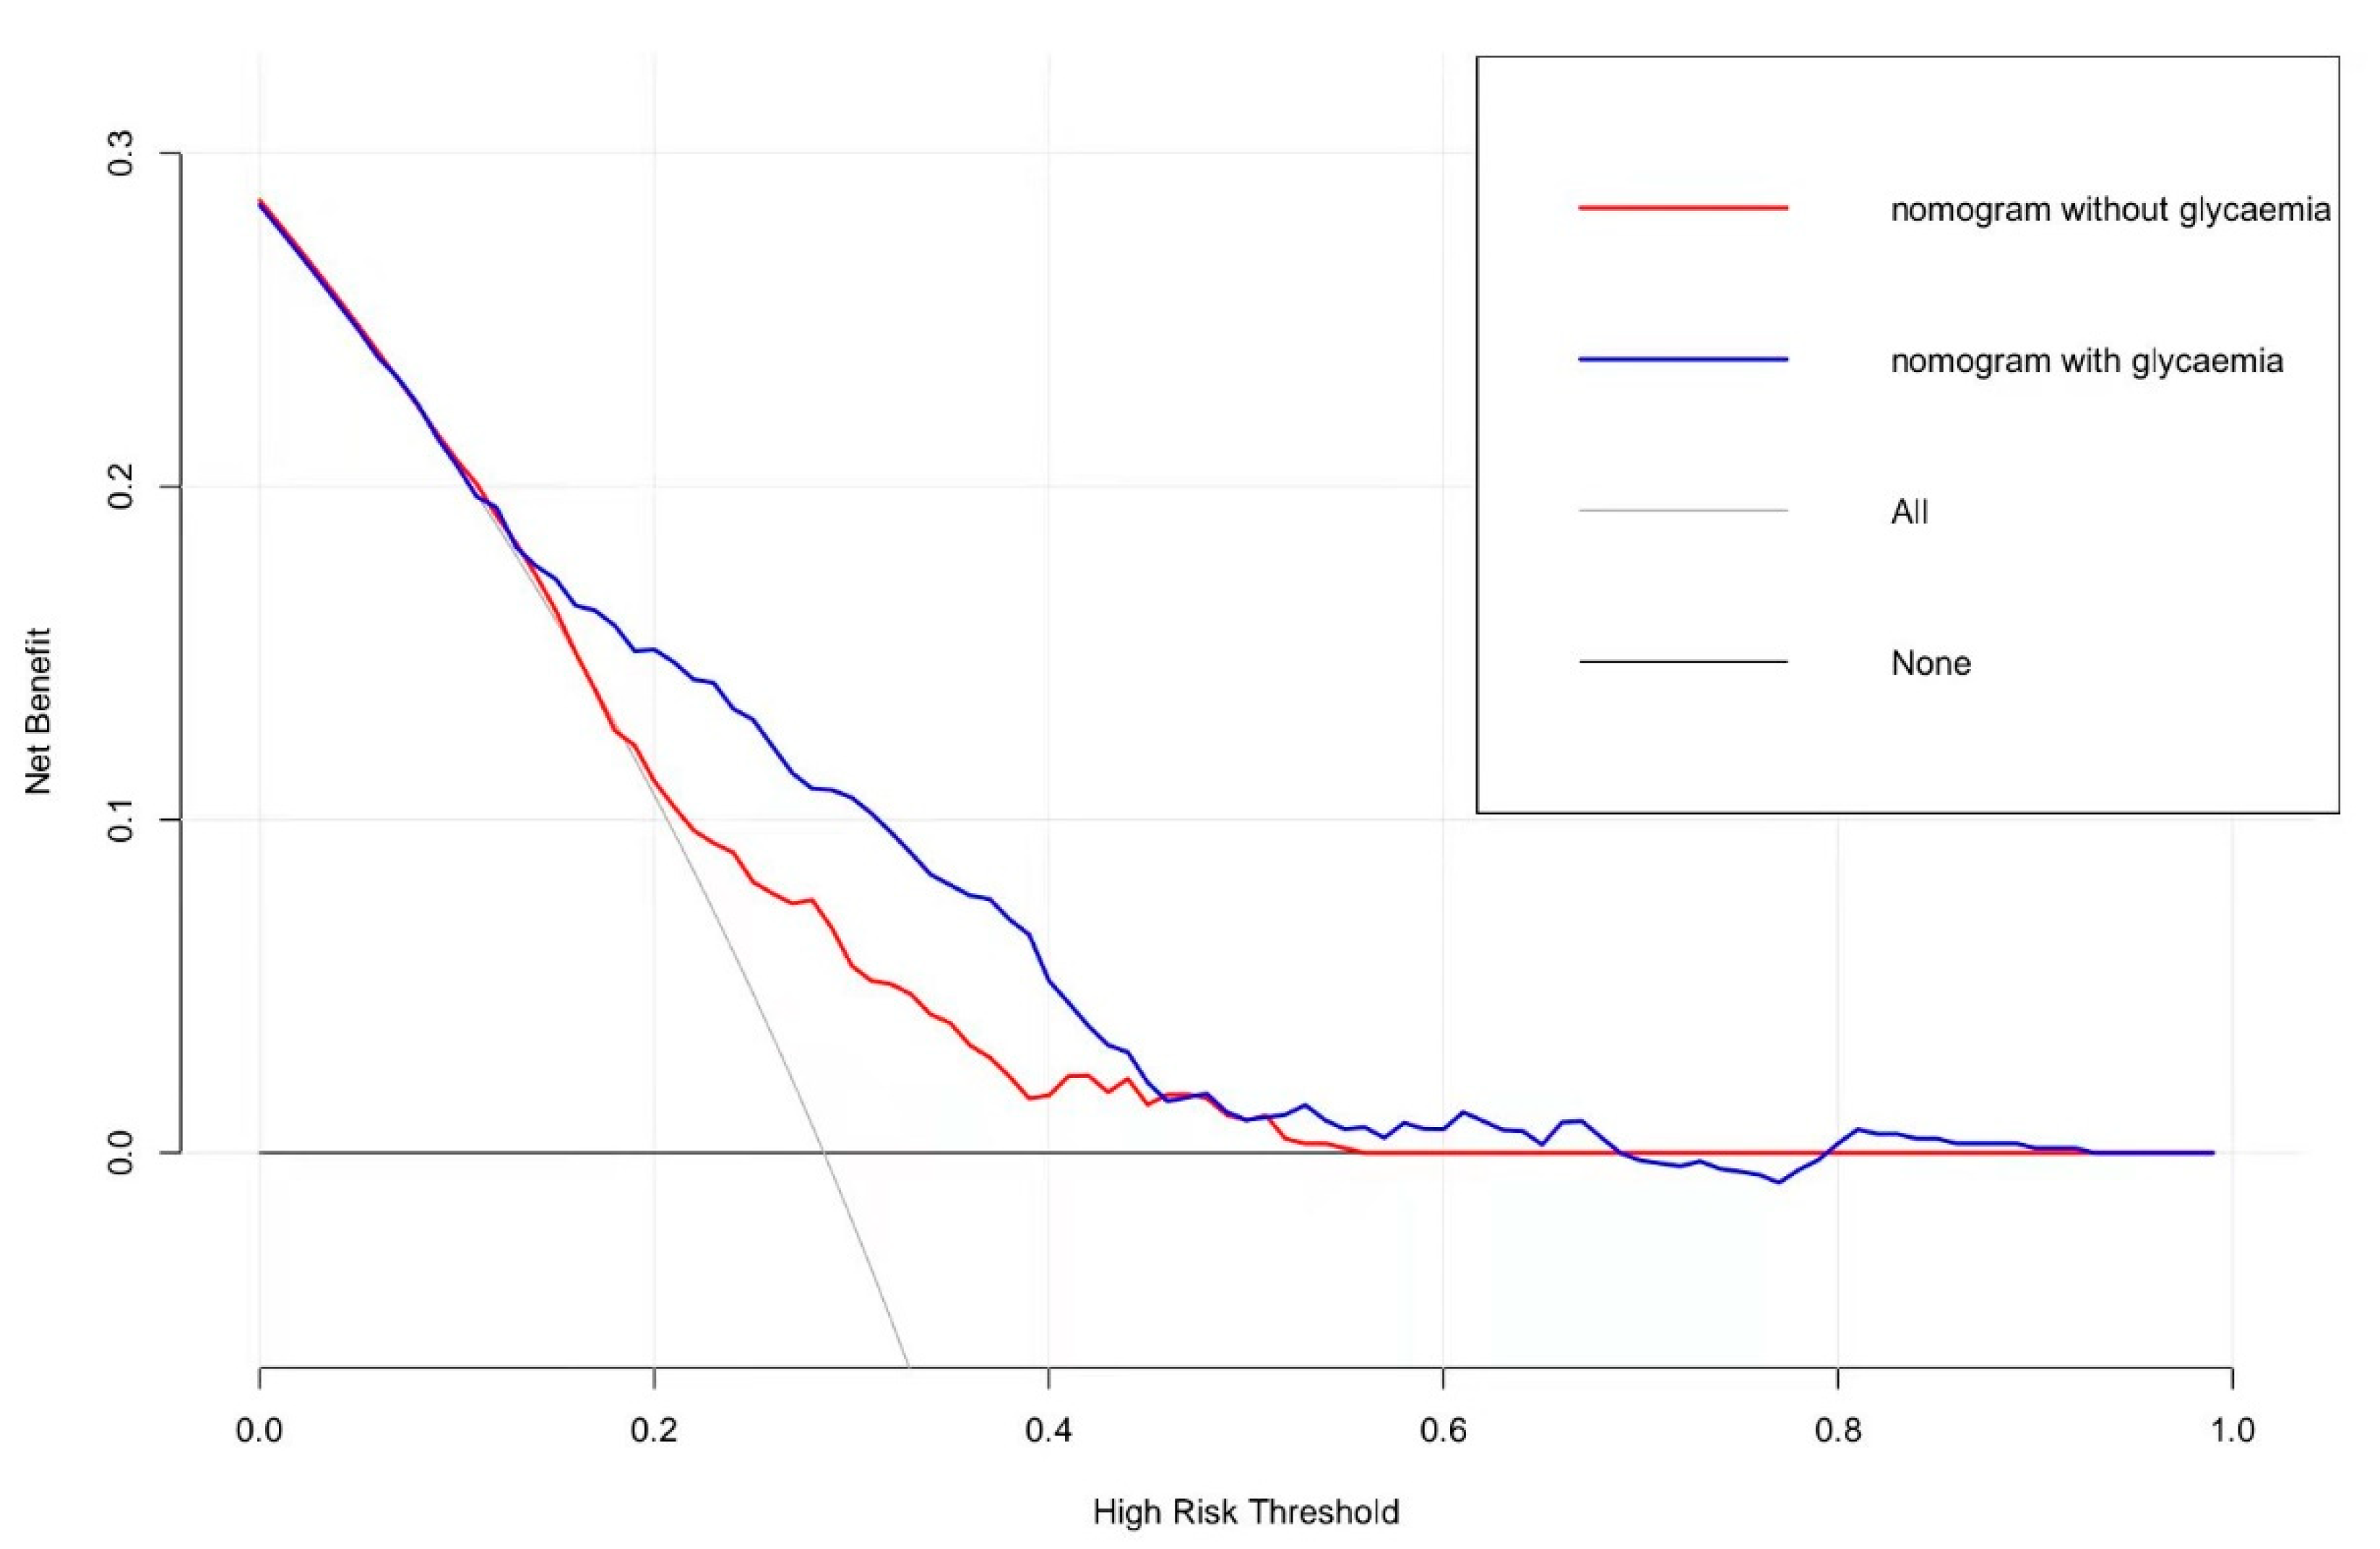
4. Results
5. Discussion
6. Conclusions
Supplementary Materials
Author Contributions
Funding
Institutional Review Board Statement
Informed Consent Statement
Data Availability Statement
Conflicts of Interest
References
- Goyal, M.; Menon, B.K.; Van Zwam, W.H.; Dippel, D.W.J.; Mitchell, P.J.; Demchuk, A.M.; Dávalos, A.; Majoie, C.B.L.M.; Van Der Lugt, A.; De Miquel, M.A.; et al. Endovascular thrombectomy after large-vessel ischaemic stroke: A meta-analysis of individual patient data from five randomised trials. Lancet 2016, 387, 1723–1731. [Google Scholar] [CrossRef]
- Linfante, I.; Starosciak, A.K.; Walker, G.R.; Dabus, G.; Castonguay, A.C.; Gupta, R.; Sun, C.-H.J.; Martin, C.; Holloway, W.E.; Mueller-Kronast, N.; et al. Predictors of poor outcome despite recanalization: A multiple regression analysis of the NASA registry. J. Ineurointerv. Surg. 2016, 8, 224–229. [Google Scholar] [CrossRef]
- Diprose, W.; Sutherland, L.J.; Wang, M.T.M.; Barber, P.A. Contrast-Associated Acute Kidney Injury in Endovascular Thrombectomy Patients with and without Baseline Renal Impairment. Stroke 2019, 50, 3527–3531. [Google Scholar] [CrossRef] [PubMed]
- Yoo, J.; Hong, J.-H.; Lee, S.-J.; Kim, Y.-W.; Hong, J.M.; Kim, C.-H.; Choi, J.W.; Kang, D.-H.; Kim, Y.-S.; Hwang, Y.-H.; et al. Acute Kidney Injury after Endovascular Treatment in Patients with Acute Ischemic Stroke. J. Clin. Med. 2020, 9, 1471. [Google Scholar] [CrossRef] [PubMed]
- Fandler-Höfler, S.; Odler, B.; Kneihsl, M.; Wünsch, G.; Haidegger, M.; Poltrum, B.; Beitzke, M.; Deutschmann, H.; Enzinger, C.; Rosenkranz, A.R.; et al. Acute and Chronic Kidney Dysfunction and Outcome After Stroke Thrombectomy. Transl. Stroke Res. 2021, 12, 791–798. [Google Scholar] [CrossRef] [PubMed]
- Chamorro, Á.; Brown, S.; Amaro, S.; Hill, M.; Muir, K.W.; Dippel, D.W.; van Zwam, W.; Butcher, K.; Ford, G.A.; Hertog, H.M.D.; et al. Glucose Modifies the Effect of Endovascular Thrombectomy in Patients with Acute Stroke. Stroke 2019, 50, 690–696. [Google Scholar] [CrossRef] [Green Version]
- Perez-Vega, C.; Domingo, R.A.; Tripathi, S.; Ramos-Fresnedo, A.; Kashyap, S.; Quinones-Hinojosa, A.; Lin, M.P.; Fox, W.C.; Tawk, R.G. Influence of glucose levels on clinical outcome after mechanical thrombectomy for large-vessel occlusion: A systematic review and meta-analysis. J. Neurointerv. Surg. 2022, 14. [Google Scholar] [CrossRef]
- Rinkel, L.A.; Nguyen, T.T.M.; Guglielmi, V.; Groot, A.E.; Posthuma, L.; Roos, Y.B.; Majoie, C.B.; Nijeholt, G.J.L.; Emmer, B.J.; van der Worp, H.B.; et al. High Admission Glucose Is Associated with Poor Outcome After Endovascular Treatment for Ischemic Stroke. Stroke 2020, 51, 3215–3223. [Google Scholar] [CrossRef]
- Kim, J.T.; Jahan, R.; Saver, J.L.; Swift Investigators. Impact of Glucose on Outcomes in Patients Treated with Mechanical Thrombectomy: A Post Hoc Analysis of the Solitaire Flow Restoration with the Intention for Thrombectomy Study. Stroke 2016, 47, 120–127. [Google Scholar] [CrossRef] [Green Version]
- Robbins, N.M.; Swanson, R.A. Opposing effects of glucose on stroke and reperfusion injury: Acidosis, oxidative stress, and energy metabolism. Stroke 2014, 45, 1881–1886. [Google Scholar] [CrossRef] [Green Version]
- Yong, M.; Kaste, M. Dynamic of hyperglycemia as a predictor of stroke outcome in the ECASS-II trial. Stroke 2008, 39, 2749–2755. [Google Scholar] [CrossRef] [Green Version]
- Merlino, G.; Smeralda, C.; Sponza, M.; Gigli, G.L.; Lorenzut, S.; Marini, A.; Surcinelli, A.; Pez, S.; Vit, A.; Gavrilovic, V.; et al. Dynamic Hyperglycemic Patterns Predict Adverse Outcomes in Patients with Acute Ischemic Stroke Undergoing Mechanical Thrombectomy. J. Clin. Med. 2020, 9, 1932. [Google Scholar] [CrossRef] [PubMed]
- Li, F.; Ren, Y.; Cui, X.; Liu, P.; Chen, F.; Zhao, H.; Han, Z.; Huang, Y.; Ma, Q.; Luo, Y. Postoperative hyperglycemia predicts symptomatic intracranial hemorrhage after endovascular treatment in patients with acute anterior circulation large artery occlusion. J. Neurol. Sci. 2020, 409, 116588. [Google Scholar] [CrossRef] [PubMed]
- Yuan, L.; Sun, Y.; Huang, X.; Xu, X.; Xu, J.; Xu, Y.; Yang, Q.; Zhu, Y.; Zhou, Z. Fasting Blood-Glucose Level and Clinical Outcome in Anterior Circulation Ischemic Stroke of Different Age Groups After Endovascular Treatment. Neuropsychiatr. Dis. Treat. 2022, 18, 575–583. [Google Scholar] [CrossRef] [PubMed]
- Osei, E.; Den Hertog, H.M.; Berkhemer, O.A.; Fransen, P.S.S.; Roos, Y.B.W.E.M.; Beumer, D.; van Oostenbrugge, R.J.; Schonewille, W.J.; Boiten, J.; Zandbergen, A.A.M.; et al. Increased admission and fasting glucose are associated with unfavorable short-term outcome after intra-arterial treatment of ischemic stroke in the MR CLEAN pretrial cohort. J. Neurol. Sci. 2016, 371, 1–5. [Google Scholar] [CrossRef] [PubMed]
- Su, Y.W.; Hsu, C.Y.; Guo, Y.W.; Chen, H.S. Usefulness of the plasma glucose concentration-to-HbA1c ratio in predicting clinical outcomes during acute illness with extreme hyperglycaemia. Diabetes Metab. 2017, 43, 40–47. [Google Scholar] [CrossRef]
- Chen, G.; Ren, J.; Huang, H.; Shen, J.; Yang, C.; Hu, J.; Pan, W.; Sun, F.; Zhou, X.; Zeng, T.; et al. Admission Random Blood Glucose, Fasting Blood Glucose, Stress Hyperglycemia Ratio, and Functional Outcomes in Patients with Acute Ischemic Stroke Treated with Intravenous Thrombolysis. Front. Aging Neurosci. 2022, 14, 782282. [Google Scholar] [CrossRef]
- Chen, X.; Liu, Z.; Miao, J.; Zheng, W.; Yang, Q.; Ye, X.; Zhuang, X.; Peng, F. High Stress Hyperglycemia Ratio Predicts Poor Outcome after Mechanical Thrombectomy for Ischemic Stroke. J. Stroke Cerebrovasc. Dis. 2019, 28, 1668–1673. [Google Scholar] [CrossRef]
- Higashida, R.T.; Furlan, A.J. Trial design and reporting standards for intra-arterial cerebral thrombolysis for acute ischemic stroke. Stroke 2003, 34, e109–e137. [Google Scholar] [CrossRef]
- Powers, W.J.; Rabinstein, A.A.; Ackerson, T.; Adeoye, O.M.; Bambakidis, N.C.; Becker, K.; Biller, J.; Brown, M.; Demaerschalk, B.M.; Hoh, B.; et al. Guidelines for the Early Management of Patients With Acute Ischemic Stroke: 2019 Update to the 2018 Guidelines for the Early Management of Acute Ischemic Stroke: A Guideline for Healthcare Professionals From the American Heart Association/American Stroke Association. Stroke 2019, 50, e344–e418. [Google Scholar]
- Nathan, D.M.; Kuenen, J.; Borg, R.; Zheng, H.; Schoenfeld, D.; Heine, R.J.; A1c-Derived Average Glucose (ADAG) Study Group. Translating the A1C assay into estimated average glucose values. Diabetes Care 2008, 31, 1473–1478. [Google Scholar] [CrossRef] [PubMed] [Green Version]
- Khwaja, A. KDIGO clinical practice guidelines for acute kidney injury. Nephron Clinical practice. 2012, 120, c179–c184. [Google Scholar] [CrossRef] [PubMed]
- Arnold, J.; Ng, K.P.; Sims, D.; Gill, P.; Cockwell, P.; Ferro, C. Incidence and impact on outcomes of acute kidney injury after a stroke: A systematic review and meta-analysis. BMC Nephrol. 2018, 19, 283. [Google Scholar] [CrossRef] [PubMed] [Green Version]
- Tsagalis, G.; Akrivos, T.; Alevizaki, M.; Manios, E.; Theodorakis, M.; Laggouranis, A.; Vemmos, K.N. Long-term prognosis of acute kidney injury after first acute stroke. Clin. J. Am.Soc. Nephrol. 2009, 4, 616–622. [Google Scholar] [CrossRef] [PubMed] [Green Version]
- Jannot, A.-S.; Burgun, A.; Thervet, E.; Pallet, N. The Diagnosis-Wide Landscape of Hospital-Acquired AKI. Clin. J. Am. Soc. Nephrol. 2017, 12, 874–884. [Google Scholar] [CrossRef]
- Gaillard, T.; Miller, E. Guidelines for Stroke Survivors with Diabetes Mellitus. Stroke 2018, 49, e215–e217. [Google Scholar] [CrossRef]
- Lu, G.-D.; Ren, Z.-Q.; Zhang, J.-X.; Zu, Q.-Q.; Shi, H.-B. Effects of Diabetes Mellitus and Admission Glucose in Patients Receiving Mechanical Thrombectomy: A Systematic Review and Meta-analysis. Neurocritical Care 2018, 29, 426–434. [Google Scholar] [CrossRef]
- Chang, J.Y.; Kim, W.-J.; Kwon, J.H.; Kim, B.J.; Kim, J.-T.; Lee, J.; Cha, J.K.; Kim, D.-H.; Cho, Y.-J.; Hong, K.-S.; et al. Prestroke Glucose Control and Functional Outcome in Patients with Acute Large Vessel Occlusive Stroke and Diabetes After Thrombectomy. Diabetes Care 2021, 44, 2140–2148. [Google Scholar] [CrossRef]
- Saeed, F.; Adil, M.M.; Khursheed, F.; Daimee, U.A.; Branch Jr, L.A.; Vidal, G.A.; Qureshi, A.I. Acute renal failure is associated with higher death and disability in patients with acute ischemic stroke: Analysis of nationwide inpatient sample. Stroke 2014, 45, 1478–1480. [Google Scholar] [CrossRef] [Green Version]
- Qureshi, A.I.; Aslam, H.; Zafar, W.; Huang, W.; Lobanova, I.; Naqvi, S.H.; Malhotra, K.; Arora, N.; Chandrasekaran, P.N.; Siddiq, F.; et al. Acute Kidney Injury in Acute Ischemic Stroke Patients in Clinical Trials. Crit. Care Med. 2020, 48, 1334–1339. [Google Scholar] [CrossRef]
- Jiang, F.; Su, L.; Xiang, H.; Zhang, X.; Xu, D.; Zhang, Z.; Peng, Z. Incidence, Risk factors, and Biomarkers Predicting Ischemic or Hemorrhagic Stroke Associated Acute Kidney Injury and Outcome: A Retrospective Study in a General Intensive Care Unit. Blood Purif. 2019, 47, 317–326. [Google Scholar] [CrossRef] [PubMed]
- Fang, H.S.A.; Gao, Q.; Tan, W.Y.; Lee, M.L.; Hsu, W.; Tan, N.C. The effect of oral diabetes medications on glycated haemoglobin (HbA1c) in Asians in primary care: A retrospective cohort real-world data study. BMC Med. 2022, 20, 22. [Google Scholar] [CrossRef] [PubMed]
- Osei, E.; den Hertog, H.M.; Berkhemer, O.A.; Fransen, P.S.; Roos, Y.B.; Beumer, D.; van Oostenbrugge, R.J.; Schonewille, W.J.; Boiten, J.; Zandbergen, A.A.; et al. Admission Glucose and Effect of Intra-Arterial Treatment in Patients with Acute Ischemic Stroke. Stroke 2017, 48, 1299–1305. [Google Scholar] [CrossRef] [PubMed]
- Yang, C.-J.; Liao, W.-I.; Wang, J.-C.; Tsai, C.-L.; Lee, J.-T.; Peng, G.-S.; Lee, C.-H.; Hsu, C.-W.; Tsai, S.-H. Usefulness of glycated hemoglobin A1c-based adjusted glycemic variables in diabetic patients presenting with acute ischemic stroke. Am. J. Emerg. Med. 2017, 35, 1240–1246. [Google Scholar] [CrossRef] [PubMed]
- Roberts, G.; Sires, J.; Chen, A.; Thynne, T.; Sullivan, C.; Quinn, S.; Chen, W.S.; Meyer, E. A comparison of the stress hyperglycemia ratio, glycemic gap, and glucose to assess the impact of stress-induced hyperglycemia on ischemic stroke outcome. J. Diabetes. 2021, 13, 1034–1042. [Google Scholar] [CrossRef]
- Stolker, J.M.; McCullough, P.A.; Rao, S.; Inzucchi, S.E.; Spertus, J.A.; Maddox, T.M.; Masoudi, F.A.; Xiao, L.; Kosiborod, M. Pre-procedural glucose levels and the risk for contrast-induced acute kidney injury in patients undergoing coronary angiography. J. Am. Coll. Cardiol. 2010, 55, 1433–1440. [Google Scholar] [CrossRef] [Green Version]
- Deedwania, P.; Kosiborod, M.; Barrett, E.; Ceriello, A.; Isley, W.; Mazzone, T.; Raskin, P. Hyperglycemia and acute coronary syndrome: A scientific statement from the American Heart Association Diabetes Committee of the Council on Nutrition, Physical Activity, and Metabolism. Circulation 2008, 117, 1610–1619. [Google Scholar] [CrossRef]
- Wang, G.; Yang, L.; Ye, N.; Bian, W.; Ma, C.; Zhao, D.; Liu, J.; Hao, Y.; Yang, N.; Cheng, H. In-hospital acute kidney injury and atrial fibrillation: Incidence, risk factors, and outcome. Ren. Fail. 2021, 43, 949–957. [Google Scholar] [CrossRef]
- Hu, W.S.; Lin, C.L. Comparison of incidence of acute kidney injury, chronic kidney disease and end-stage renal disease between atrial fibrillation and atrial flutter: Real-world evidences from a propensity score-matched national cohort analysis. Intern. Emerg. Med. 2019, 14, 1113–1118. [Google Scholar] [CrossRef]
- Chan, L.; Mehta, S.; Chauhan, K.; Poojary, P.; Patel, S.; Pawar, S.; Patel, A.; Correa, A.; Patel, S.; Garimella, P.S.; et al. National Trends and Impact of Acute Kidney Injury Requiring Hemodialysis in Hospitalizations with Atrial Fibrillation. J. Am. Heart Assoc. 2016, 5, e004509. [Google Scholar] [CrossRef] [Green Version]
- Van den Berghe, G.; Wilmer, A.; Milants, I.; Wouters, P.J.; Bouckaert, B.; Bruyninckx, F.; Bouillon, R.; Schetz, M. Intensive insulin therapy in mixed medical/surgical intensive care units: Benefit versus harm. Diabetes 2006, 55, 3151–3159. [Google Scholar] [CrossRef] [PubMed] [Green Version]
- Schetz, M.; Vanhorebeek, I.; Wouters, P.J.; Wilmer, A.; Berghe, G.V.D. Tight blood glucose control is renoprotective in critically ill patients. J. Am. Soc. Nephrol. 2008, 19, 571–578. [Google Scholar] [CrossRef] [PubMed]
- Mehran, R.; Dangas, G.D.; Weisbord, S.D. Contrast-Associated Acute Kidney Injury. N. Engl. J. Med. 2019, 380, 2146–2155. [Google Scholar] [CrossRef] [PubMed]


| Total (717) | AKI (n = 205) | No AKI (n = 512) | p | |
|---|---|---|---|---|
| Age (years), mean ± SD | 70.2 ± 11.9 | 74.5 ± 11.0 | 68.6 ± 12.0 | <0.001 |
| Sex, male, n (%) | 461 (64.3%) | 124 (60.5%) | 337 (65.8%) | 0.178 |
| Medical history, n (%) | ||||
| Hypertension | 539 (75.2%) | 163 (79.5%) | 376 (73.4%) | 0.089 |
| Diabetes | 230 (32.1%) | 68 (33.2%) | 162 (31.6%) | 0.692 |
| Atrial fibrillation | 323 (45.0%) | 125 (61.0%) | 198 (38.7%) | <0.001 |
| Prior stroke | 149 (20.8%) | 37 (18.1%) | 112 (21.9%) | 0.261 |
| Laboratory examination, mean ± SD | ||||
| Acute glycaemia, mg/dL | 128 ± 45 | 143 ± 50 | 123 ± 42 | <0.001 |
| HbA1c, % | 6.3 ± 1.4 | 6.3 ± 1.3 | 6.3 ± 1.3 | 0.716 |
| Average chronic glycaemia, mg/dL | 135 ± 40 | 136 ± 40 | 135 ± 40 | 0.716 |
| A/C glycaemic ratio | 0.97 ± 0.28 | 1.08 ± 0.31 | 0.93 ± 0.25 | <0.001 |
| ΔA-C, mg/dL | −6 ± 43 | 7 ± 47 | −12 ± 40 | <0.001 |
| Baseline serum creatinine, μmol/L | 77.5 ± 32.9 | 83.3 ± 39.7 | 75.2 ± 29.5 | 0.003 |
| eGFR, mL/min/1.73 m2 | 99 ± 34 | 91 ± 32 | 101 ± 35 | <0.001 |
| Total cholesterol, mg/dL | 76 ± 21 | 76 ± 23 | 77 ± 21 | 0.856 |
| Triglycerides, mg/dL | 23 ± 16 | 23 ± 20 | 23 ± 14 | 0.839 |
| HDL, mg/dL | 20 ± 6 | 21 ± 6 | 20 ± 6 | 0.855 |
| LDL, mg/dL | 46 ± 17 | 45 ± 18 | 46 ± 17 | 0.856 |
| antidiabetic drugs, n (%) | 100 (13.9%) | 24 (11.7%) | 76 (14.8%) | 0.273 |
| Baseline NIHSS score, median (IQR) | 14 (11–19) | 17 (13–21) | 13 (10–18) | <0.001 |
| Infarct circulation, n (%) | 0.514 | |||
| Anterior | 608 (84.8%) | 171 (83.4%) | 437 (85.4%) | |
| Posterior | 109 (15.2%) | 34 (16.6%) | 75 (10.5%) | |
| Stroke subtypes, n (%) | <0.001 | |||
| LAA | 327 (45.6%) | 66 (32.2%) | 261 (51.0%) | |
| CE | 336 (42.9%) | 130 (63.4%) | 206 (40.2%) | |
| SOE | 21 (2.9%) | 2 (1.0%) | 19 (3.7%) | |
| SUE | 33 (4.6%) | 7 (3.4%) | 26 (5.1%) | |
| ASITN/SIR, median (IQR) | 2 (1–2) | 1 (1–2) | 2 (1–2) | <0.001 |
| Interval time, min, median (IQR) | ||||
| Onset to door | 171 (85–300) | 160 (70–297) | 175 (90–300) | 0.353 |
| Door to groin puncture | 105 (80–140) | 110 (80–143) | 105 (79–137) | 0.692 |
| Door to first recanalization | 181 (148–225) | 190 (155–242) | 180 (145–220) | 0.163 |
| Intravenous thrombolysis, n (%) | 302 (42.1%) | 74 (36.1%) | 228 (44.5%) | 0.039 |
| Number of devices passed, median (IQR) | 2 (1–3) | 2 (1–3) | 2 (1–3) | 0.002 |
| mTICI score, n (%) | 0.002 | |||
| 2b-3 | 626 (87.3%) | 166 (81.0%) | 460 (89.8%) | |
| 0–2a | 91 (12.7%) | 39 (19.0%) | 52 (10.2%) |
| Crude OR (95% CI) | p | Adjusted OR (95% CI) | p | |
|---|---|---|---|---|
| Acute glycaemia | 1.009 (1.006–1.013) | <0.001 | 1.007 (1.003–1.011) | <0.001 |
| Chronic glycaemia | 1.001 (0.997–1.005) | 0.715 | ||
| A/C glycaemic ratio | 7.333 (3.957–13.588) | <0.001 | 4.455 (2.237–8.871) | <0.001 |
| ΔA-C | 1.012 (1.007–1.016) | <0.001 | 1.008 (1.004–1.013) | <0.001 |
| Age | 1.044 (1.028–1.061) | <0.001 | 1.024 (1.006–1.043) | 0.010 |
| Hypertension | 1. 404 (0.949–2.077) | 0.090 | ||
| Atrial fibrillation | 2.478 (1.777–3.454) | <0.001 | 1.555 (1.027–2.354) | 0.037 |
| Baseline NIHSS score | 1.072 (1.049–1.096) | <0.001 | 1.049 (1.025–1.074) | <0.001 |
| Stroke subtypes | 1.091 (0.927–1.286) | 0.295 | ||
| ASITN/SIR | 0.553 (0.432–0.707) | <0.001 | 0.695 (0.531–0.911) | 0.008 |
| Intravenous thrombolysis | 0.704 (0.504–0.983) | 0.039 | 0.725 (0.503–1.043) | 0.083 |
| Number of devices passed | 1.262 (1.115–1.428) | <0.001 | 1.107 (0.960–1.276) | 0.161 |
| mTICI score | 0.481 (0.306–0.756) | 0.001 | 0.563 (0.336–0.941) | 0.029 |
Publisher’s Note: MDPI stays neutral with regard to jurisdictional claims in published maps and institutional affiliations. |
© 2022 by the authors. Licensee MDPI, Basel, Switzerland. This article is an open access article distributed under the terms and conditions of the Creative Commons Attribution (CC BY) license (https://creativecommons.org/licenses/by/4.0/).
Share and Cite
Liu, C.; Li, X.; Xu, Z.; Wang, Y.; Jiang, T.; Wang, M.; Deng, Q.; Zhou, J. Construction of a Glycaemia-Based Signature for Predicting Acute Kidney Injury in Ischaemic Stroke Patients after Endovascular Treatment. J. Clin. Med. 2022, 11, 3865. https://doi.org/10.3390/jcm11133865
Liu C, Li X, Xu Z, Wang Y, Jiang T, Wang M, Deng Q, Zhou J. Construction of a Glycaemia-Based Signature for Predicting Acute Kidney Injury in Ischaemic Stroke Patients after Endovascular Treatment. Journal of Clinical Medicine. 2022; 11(13):3865. https://doi.org/10.3390/jcm11133865
Chicago/Turabian StyleLiu, Chengfang, Xiaohui Li, Zhaohan Xu, Yishan Wang, Teng Jiang, Meng Wang, Qiwen Deng, and Junshan Zhou. 2022. "Construction of a Glycaemia-Based Signature for Predicting Acute Kidney Injury in Ischaemic Stroke Patients after Endovascular Treatment" Journal of Clinical Medicine 11, no. 13: 3865. https://doi.org/10.3390/jcm11133865
APA StyleLiu, C., Li, X., Xu, Z., Wang, Y., Jiang, T., Wang, M., Deng, Q., & Zhou, J. (2022). Construction of a Glycaemia-Based Signature for Predicting Acute Kidney Injury in Ischaemic Stroke Patients after Endovascular Treatment. Journal of Clinical Medicine, 11(13), 3865. https://doi.org/10.3390/jcm11133865