Review

A Systematic Review and Meta-Analysis on Metabolic Bone Disease in Patients with Primary Sclerosing Cholangitis

by
Claudiu Marinel Ionele
1,†,
Adina Turcu-Stiolica
2,*,
Mihaela Simona Subtirelu
2,†,
Bogdan Silviu Ungureanu
3,4,†,
George Ovidiu Cioroianu
1 and
Ion Rogoveanu
3,4
1
Doctoral School, University of Medicine and Pharmacy of Craiova, 200349 Craiova, Romania
2
Department of Pharmacoeconomics, University of Medicine and Pharmacy of Craiova, 200349 Craiova, Romania
3
Research Center of Gastroenterology and Hepatology, University of Medicine and Pharmacy of Craiova, 200638 Craiova, Romania
4
Department of Gastroenterology, University of Medicine and Pharmacy of Craiova, 200349 Craiova, Romania
*
Author to whom correspondence should be addressed.
These authors contributed equally to this work.
J. Clin. Med. 2022, 11(13), 3807; https://doi.org/10.3390/jcm11133807
Submission received: 7 June 2022 / Revised: 25 June 2022 / Accepted: 28 June 2022 / Published: 30 June 2022
(This article belongs to the Special Issue Secondary Osteoporosis and Metabolic Bone Diseases)

Abstract

:
Data about the association between primary sclerosing cholangitis (PSC) and metabolic bone disease are still unclear. PSC is a chronic cholestatic liver disease (CCLD) which affects the biliary tract, and it has a highly variable natural history. We systematically searched until 28 February 2022 MEDLINE, Cochrane Central Register of Controlled Trials, the ISI Web of Science, and SCOPUS, for studies in patients with PSC. We identified 343 references to potential studies. After screening them, we included eight studies (893 PSC patients, 398 primary biliary cirrhosis (PBC) patients, and 673 healthy controls) for the present meta-analysis. Pooled analyses found no difference in BMD-LS (Z = 0.02, p-value = 0.98) between PSC patients and healthy controls. BMD-LS was statistically lower in PBC patients than in PSC patients (Mean Difference, MD, 0.06, 95% CI 0.03 to 0.09, p-value = 0.0007). The lumbar spine T-score was higher in the PSC patients compared with PBC patients (MD 0.23, 95% CI 0.04 to 0.42, p-value = 0.02). Given the limited literature available, better designed, and larger scale primary studies will be required to confirm our conclusion.

1. Introduction

Primary sclerosing cholangitis (PSC) is characterized by strictures in the biliary tree which lead to biliary fibrosis and progress to end-stage liver disease [1]. PSC mainly affects young and middle-aged male adults and may be associated with inflammatory bowel disease (IBD) [2,3]. The majority of PSC patients are asymptomatic for a long time. The disease may also have an aggressive course, leading to recurrent biliary tract obstruction, repetitive episodes of cholangitis, and may progress to end-stage liver disease in a shorter time [1]. Several immunologic markers and serum autoantibodies are found in most patients with PSC, although none is specific to the disease [4,5].
While no available therapy has proven its efficacy in stopping disease progression, the only curative option remains liver transplantation. PSC is well known as one of the leading indications in Europe for liver transplants; however, the graft loss incidence remains the highest among all other indications [6]. Moreover, it may be associated with malignancies either hepatobiliary, cholangiocarcinoma or hepatocellular carcinoma, and colorectal cancer, especially in patients with IBD [6,7,8].
All chronic cholestatic liver disease (CCLD) is frequently associated with osteoporosis; however, the data on PSC is scarce. There are a few risk factors associated with bone disorders including malnutrition; alcohol abuse; kidney disease; tobacco use; liver cirrhosis; neoplastic illness; prolonged glucocorticoid treatment (prednisone 5 mg/day for >3 months); some hormonal disturbances such as diabetes, hyperthyroidism, hypogonadism, and hyperparathyroidism; Cushing syndrome; hypercalciuria; and Vitamin D deficiency [9,10].
The prevalence of osteoporosis in patients with chronic liver disease was reported to be approximately 30% [11]. In addition, its prevalence was higher in patients with CCLD, and the prevalence of fractures was reported to be 7–35% [12]. Compared to the occurrence of osteoporosis accompanied by the low bone formation in primary biliary cholangitis (PBC), which has been reported frequently, this pattern is still unclear for PSC [13,14,15]. Osteoporosis is a health condition that weakens bones; it is a systemic skeletal disease that is characterized by low bone density and microarchitectural disruption of bone tissue, with a consequent high skeletal fragility and fracture incidence [16].
While it has been studied extensively in patients with PBC, bone impairment in other CCLD such as PSC may also be encountered [17]. A couple of studies have suggested that PSC might be associated with a higher risk of osteoporosis [18,19]. In the last few years, a series of developments improved our knowledge about the management of osteoporosis and its pathogenic mechanisms [20,21,22]. However, there is still no unanimity on the guidelines for the diagnosis and treatment of bone diseases as a complication of CCLD. Many controversies remain to be argued in these type of patients [23]. Therefore, additional studies should be performed on the topic of bone diseases in patients with CCLD in the future. In this paper, we highlight the definitions of related terms, guidelines for bone diseases and chronic liver disease, actual knowledge of pathogenesis, and finally target the management of bone diseases in patients with chronic liver disease. Hence, we conducted a systematic review and meta-analysis to evaluate the relationship between PSC and osteoporosis.

2. Materials and Methods

We followed the 27 items for the Systematic reviews and Meta-Analysis (PRISMA) [24]. We systematically searched MEDLINE, Cochrane Central Register of Controlled Trials, the ISI Web of Science, and SCOPUS, for studies in patients with PSC. Two authors (C.M.I. and M.S.S.) independently screened until 28 February 2022, the articles published until 31 January 2022 for inclusion and extracted data. Disagreements were solved by the third author (A.T.S.). Criteria for considering studies for this meta-analysis respected the PICO standards (Patient, Intervention, Comparator, Outcomes). We included in this meta-analysis, the original articles when the following criteria were fulfilled: (1) clinical-study or cohort design; (2) PSC used as an exposure factor; (3) osteopenia, osteoporosis, or fracture as an outcome; and (4) mean differences (MD) with 95% Confidence Intervals (CI) or Odds Ratio with 95% CI were calculated for assessing the differences among the PSC patients and the controls (PBC patients or Healthy). For each group of patients, we have included only complete study analysis or the most recent largest sample size. Exclusion criteria included (1) case-report article, review article, meta-analyses, abstracts, or letters, (2) incomplete data or lack of measuring, (3) only abstract (without accessible full-text article), (4) other types of chronic liver disease than PSC or PBC, (5) studies without bone mineral density evaluation, (6) studies that involved only animals and/or ex vivo samples, (7) studies of low methodological quality, (8) studies with insufficient data, and (9) studies in languages other than English and French. Our core search consisted of the terms “primary sclerosis cholangitis” and “osteoporosis”. We extracted data on measurements for lumbar spine bone mineral density (BMD), hip BMD, T-score, Z-score, calcium, vitamin D, bilirubin, alkaline phosphatase, and fractures outcomes. When necessary, we contacted the correspondence authors to obtain additional information. Studies must report mean values of outcomes, along with SDs or SEs, or the number of events for PSC patients and controls (PBC or healthy).
Two authors (C.M.I. and M.S.S.) independently conducted a quality assessment of included studies using the Newcastle–Ottawa Quality Assessment Scale (NOS) for observational studies (cross-sectional, case–control, or cohort), scoring them from 1 to 9 as follows: low quality (1–3), moderate (4–6), and high quality (7–9) [25,26].
Statistical analysis was performed using the Review Manager (Rev Man) software version 5.4.1 (The Cochrane Collaboration, 2020) and R package Metafor [27] (version 4.1, R foundation, Vienna, Austria). Mean differences (MD) with 95% Confidence Intervals (CI) or Odds Ratio with 95% CI were calculated for assessing the differences among the PSC patients and the controls (PBC patients or Healthy) [28]. The meta-analysis was conducted using the standardized mean difference (MD) or odds ratio (OR) as the outcome measure. We quantified Chi2 and its p-value to simply test whether effect sizes depart from homogeneity; Tau2 that evaluates the amount of heterogeneity; and Q-test and I2 that express the proportion of dispersion due to heterogeneity. In case of any level of heterogeneity, a prediction interval for the true outcome was provided. We examined if studies may be outliers and/or influential in the context of the model performing Cook’s distances. The funnel plot asymmetry is largely subjectively interpreted, so the publication bias was checked using the Begg and Mazumdar’s rank correlation test and the regression Egger’s test. A value for p-value less than 0.05 was considered statistically significant.

3. Results

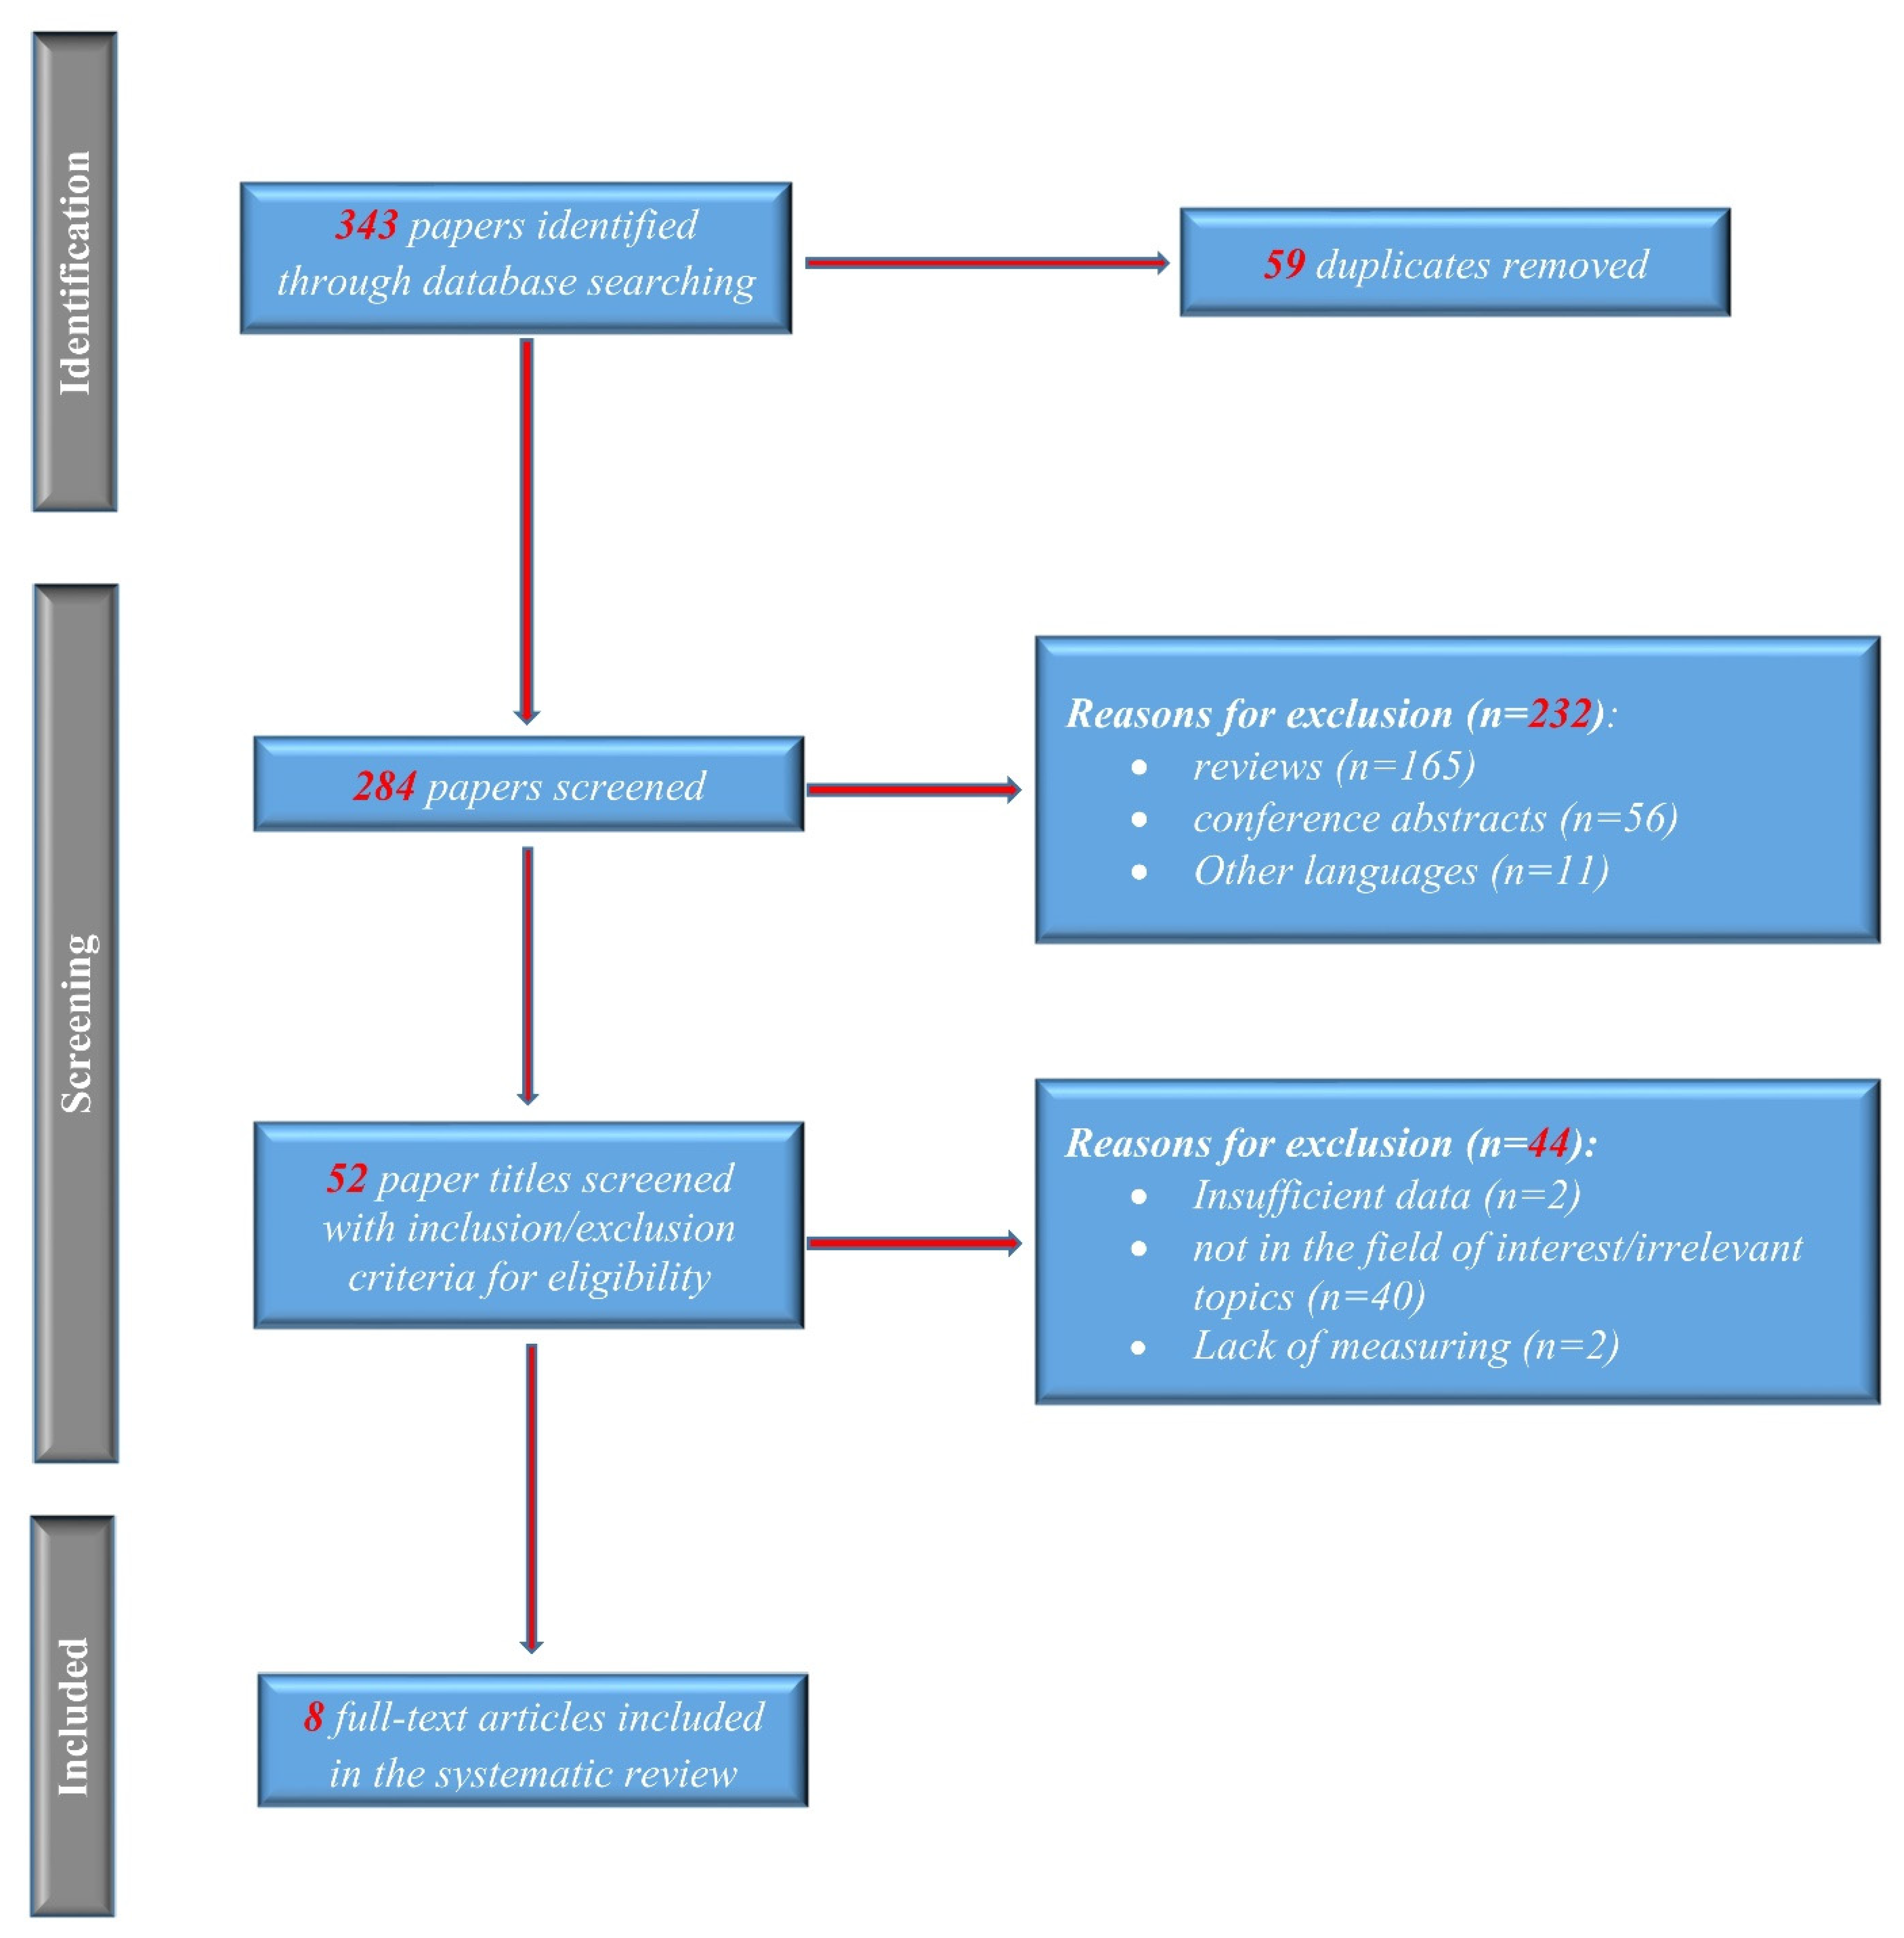
3.1. Study Selection and Characteristics of Included Studies

The association between the risk of osteoporosis and PSC remains controversial. To solve this issue, we conducted a meta-analysis in which we identified 343 references to potential studies. After screening them as in Figure 1, we included eight studies (893 PSC patients, 398 PBC patients, and 673 healthy controls) for meta-analysis. To our knowledge, this is the first meta-analysis to explore the potential relationship between PSC and osteoporosis (Table 1).

3.2. Lumbar Spine BMD

3.2.1. PSC vs. Healthy

BMD-LS was reported in three studies that included 300 PSC patients, as in Figure 2. The values for control healthy patients were considered from Hologic data. High heterogeneity between studies was found (Chi2 = 15.62, I2 = 87%, p = 0.0004). Figure 2A shows, in random effects, no difference in BMD-LS (overall effect Z = 0.27, p = 0.79) between PSC patients (n = 300) and healthy patients (n = 300). According to the Q-test (Q = 19.4644, p < 0.0001, Tau2 = 0.00), the outcomes were demonstrated to be heterogeneous.
An evaluation of the studentized residuals showed that the study Wyszomirska 2015 [25] may be a potential outlier in the context of this model. None of the studies could be overly influential, according to Cook’s distances; all the studies are balanced, having almost the same weight. Egger’s regression test indicated a value of 1.149, p = 0.250 with no funnel plot asymmetry, as in Figure 2B. The same results were demonstrated through the Rank correlation test with value = 0.333 and p = 1.00.

3.2.2. PSC vs. PBC

Pooling the results about the association between PSC and lumbar spine BMD, in comparison with PBC, only one study was found comparing PSC patients (n = 204) with PBC patients (n = 156). BMD of lumbar spine was statistically lower in PBC patients (MD 0.06, 95% CI 0.03 to 0.09, p-value = 0.0007), as in Figure 3.

3.3. Lumbar Spine T-Score

As shown in Figure 4, the lumbar spine T-score was higher in the 436 PSC patients than the 383 PBC patients (MD = 0.23, 95%CI 0.04 to 0.42). The data from the two studies were pooled using a fixed effects model since no heterogeneity was found (I2 = 0%, Chi2 = 0.37, p = 0.54).

3.4. Lumbar Spine Z-Score

Two studies examined the values of the Z-score for PSC patients (n = 436) and PBC patients (n = 383). We pooled the data to evaluate the association between PBC and Z-score with a fixed-effects model analysis, as in Figure 5. There was a trend to a smaller value of z score for PSC patients than for PBC patients (SMD −0.15, 95%CI −0.34 to 0.03, p = 0.11).

3.5. Hip BMD

Concerning hip BMD, no studies were found comparing PSC patients with PBC patients, but only PSC patients with healthy patients as control group. Angulo et al. demonstrated statistically higher hip BMD for PSC patients than for healthy people, as in Figure 6.

3.5.1. Vitamin D PSC vs. Healthy

A number of five studies was included in the meta-analysis with 610 PSC patients and 610 healthy patients. The amount of heterogeneity is high (Tau2 = 3.17, Q = 12.608, I2 = 69%, p = 0.01) and a random-effects model was fitted to the data, as in Figure 7A. Vitamin D level did not differ significantly between PSC patients and healthy patients. Although the average outcome is estimated to be positive (MD = 1.00, 95%CI −0.99 to 3.00), in some studies, the true outcome may in fact be negative. An evaluation of the studentized residuals revealed that the study Hay 1991 may be a potential outlier in the context of this model. None of the studies could be considered to be overly influential according to Cook’s distances; Angulo et al. had the biggest weight.
Egger’s regression value (−1.343) and its p-value (0.179) together with its Rank correlation test value (−0.600) and its p-value (0.233) did not indicate any funnel plot, as in Figure 7B.

3.5.2. Calcium PSC vs. Healthy

A total of three studies were included in this analysis. There was a trend towards lower calcium level for PSC patients than for healthy ones (SMD −0.29, 95% CI −0.59 to 0.00, p = 0.05), with the majority of estimates being negative. According to the Q-test, the studies appear to be heterogeneous (Tau2 = 0.07, Chi2 = 55.12, Q = 41.0255, p < 0.00001, I2 = 96%). A 95% prediction interval for the true outcomes is given by −3.4148 to 1.4321. Hence, although the average outcome is estimated to be negative, in some studies the true outcome may in fact be positive. According to the studentized residuals, the study Keller et al. [26] may be a potential outlier in the context of this model, as in Figure 8A. An examination of Cook’s distances revealed none of the studies could be considered to be overly influential, the weight of them being balanced.
As in Figure 8B, neither the rank correlation (−0.333, p = 1.00) nor the Egger’s regression test (−1.687, p = 0.0915) indicated any funnel plot asymmetry.

3.5.3. Bilirubin PSC vs. Healthy

A total of six studies were included in the analysis. According to the Q-test, the outcomes appeared heterogeneous (Tau2 = 6.37, Q = 698.64, p < 0.00001, I2 = 99%) and the random-effects model was estimated, as in Figure 9A. The bilirubin was found to be higher in PSC patients. An examination of the studentized residuals revealed there was no indication of outliers in the context of this model. None of the studies could be overly influential. According to Cook’s distances, all the studies have almost the same weight, 16–17%.
Both Rank correlation test (value = 0.867, p = 0.017) and Egger’s regression test (value = 2.134, p = 0.033) indicated potential funnel plot asymmetry, as in Figure 9B.

3.5.4. Alkaline Phosphatase PSC vs. Healthy

A total of five studies were included in this analysis, as in Figure 10A. The pooled data revealed a significantly higher value of alkaline phosphatase for PSC patients than for healthy ones. According to the Q-test (Tau2 = 292798.79, Q = 796.386, Chi2 = 1580.88, p < 0.00001, I2 = 100%), the studies are heterogenous and the random-effects model was used. An examination of the studentized residuals revealed that Angulo et al. may be a potential outlier in the context of this model.
Checking for funnel plot asymmetry, the Egger’s regression test indicated asymmetry (7.969, p < 0.001), but not the Rank correlation test (0.40, p = 0.483). The funnel plot from Figure 10B suggests the presence of publication bias as smaller studies (which appear toward the bottom) were not included into this analysis.

3.6. Prevalence of Fractures

Two studies inspected the effects of PSC compared with PBC on fractures, including 442 PSC patients and 398 PBC patients. We observed low heterogeneity between the studies (Chi2 = 0.01, p-value = 0.92, I2 = 0%). Pooling the results with a fixed-effects model, as in Figure 11, the tendency was to report less fracture events in PSC patients than in PBC patients (OR = 0.68, 95% CI 0.46 to 1.00, p-value = 0.05).

4. Discussion

CCLD increases the risk of mineral bone depletion, particularly in PBC and PSC [35]. In recent years, a number of studies have indicated that osteoporosis occurs at a substantially higher rate among PSC patients than in age- and sex-matched healthy controls [31]. The incidence of bone disease was associated with elevated Mayo risk scores and advanced histological stages [14]. It remains uncertain when and how often the bone density measurement needs to be repeated in patients with PSC, but it is necessary to screen these patients at diagnosis and every 2 to 3 years for bone mineral deficiency.
Our meta-analysis does not show a potential link between PSC and osteoporosis, but the heterogeneity of our studies (different age for the patients included in our studies: mean age ± SD, 35.3 ± 13.38 [34] vs. 45.5 ± 0.8 [19], 46.9 ± 13.4 [18]) could be the reason for our outcomes.
We found in particular, a higher prevalence of osteoporosis in PSC patients when compared with PBC, but not with a significantly reduced Z-score (p-value = 0.11). The prevalence of osteoporosis in CCLD patients ranges from as low as 13% to as high as 95% [3,36]. A higher prevalence is reported in the Indian population, between 68 and 95% versus 13 and 70% in Western countries [12]. Bone turnover laboratory parameters showed noticeably increased levels of ALP and high bilirubin levels in PSC patients. We reviewed data from five clinical studies and three cohort studies with PSC vs. PBC patients and PSC vs. healthy controls, including 398 PBC patients and 893 PSC patients. Although most included studies reported a positive trend, each study had a relatively small sample size.
Along with liver disease advancement, lower levels of vitamin D might be encountered. This was studied by Hay et al. who highlighted that advanced PSC patients have a lower level of vitamin D than newly diagnosed PSC patients. However, they did not correlate the presence of osteopenia [37]. Moreover, when an osteoporosis stage is reached, vitamin D levels will be even lower [19]. In the current meta-analysis, we assessed vitamin D and calcium levels and found a lower trend for calcium levels in patients with PSC than for healthy patients, with no significant differences in vitamin D in line with the current studies. This is likely due to the small homogeneity for the patients included in the studies.
A noteworthy finding of our study is that the T-score is significantly increased in PSC adults than in PBC adults, whereas our pooled data demonstrated no differences in Z-scores. These results are similar to other studies which quantified the T-score in the lumbar spine suggesting discrepancies between PBC and PSC, with significantly lower values. In addition, Janes et al. pointed out that in PBC patients, bone resorption was lower than in patients diagnosed with PSC [38].
In recent years, the term “hepatic osteodystrophy” [39,40] has been used to define the presence of bone disorders in cirrhotic patients with cholestasis. In this context, we found that bilirubin values were significantly higher in patients with PSC compared with controls. It is accepted that cholestasis can contribute to bone impairment in patients with CCLD leading to metabolic bone abnormalities and osteoporosis. Serum bilirubin did correlate inversely with serum osteocalcin [29,41]. The incidence of osteodystrophy seems to be directly related to the body mass index decrease, with increasing disease duration, age, as well as disease severity, although the last factor was not confirmed and fully understood [33,40,41].
Only one study [30] reported higher BMD–LS in PSC than PBC, which might be related to the severity index for liver disease as assessed by a score based on multiple risk factors exemplified in 210 PBC [42] and 37 PSC patients [43]. However, controversial results were pooled in our meta-analysis from studies comparing PSC patients with healthy adults, indicating no differences of BMD-LS between them.
We found significantly higher alkaline phosphatase values related to PSC patients. de Vries et al. [44] demonstrated that ALP predicts the prognosis in PSC. The data indicated that values at 1-year post-diagnosis have slightly higher predictive power than at diagnosis, justifying further studies to explore the use of ALP as a surrogate endpoint for clinical trials.
Our meta-analysis showed a lower risk of bone fractures associated with PSC than with PBC. However, these findings remain uncertain due to the small number of studies and should be addressed in future studies. However, we suggest the need for more specific prevention and treatment strategies for osteoporosis. If osteopenia is detected in patients with a high risk of bone disease, they should be treated with daily vitamin D 400 IU (10 μg) and calcium supplements if calculated dietary calcium intake is insufficient [45]. This collected data can be used for feature guidelines regarding the frequency of bone demineralization screening in these patients. More than half of patients with PSC present with a T-score in the range of osteopenia or osteoporosis. Therefore, it seems reasonable to measure the bone density in all patients at the time of diagnosis of PSC.
The main limitations were the small number of included studies and their heterogeneity. The small number of studies did not permit performing a meta-regression to test differences between subgroups. In addition, we did not perform subgroup analysis according to duration and severity of cholestasis, histological stage, or bone turnover laboratory parameter analysis, due to insufficient information and limited studies. This can be attributed to the heterogeneity of the studies, which included patients with inflammatory bowel disease, menopausal status for females, smoking history, current alcohol consumption, and hepatic decompensation (ascites, variceal bleeding, or hepatic encephalopathy). The included studies evaluated advanced and newly PSC patients without differentiating the outcomes for each group. In the present article, we discovered that only five out of eight articles briefly mentioned the use of steroids for IBD patients. We saw in Table 1 that the studies included in this meta-analysis mentioned use of steroids, cumulative dose or a mg per day dose. We presume that all the indications for corticosteroid administration were in line with the guidelines for IBD patients [46]. Medication exposure was recorded including intake of bisphosphonates, vitamin D supplements, oral administration of steroids, ursodeoxycholic acid, calcium supplements, prednisone, oral contraceptives, and hormone replacement therapy [2,6,18,19,30,33].

5. Conclusions

In conclusion, the current meta-analysis demonstrates that PSC is not significantly associated with osteoporosis compared to healthy controls. Patients of a younger age do not impact BMD. However, we observed different results of BMD-LS between PSC and PBC, with lower rates of fractures for PSC patients. In order to benefit from an accurate screening of bone status and for more specific prevention strategies, more clinical management should be performed with caution in PSC patients. Therefore, based on the limited number of studies included, additional and specifically designed studies are needed in order to extend our results and determine the mechanisms underpinning the relationship between PBC and osteoporosis risk.

Author Contributions

Conceptualization, C.M.I. and I.R.; software, A.T.-S.; validation, B.S.U., G.O.C. and I.R.; formal analysis, A.T.-S.; data curation, C.M.I. and M.S.S.; writing—original draft preparation, C.M.I., A.T.-S. and M.S.S.; writing—review and editing, B.S.U. and I.R.; supervision, I.R. All authors have read and agreed to the published version of the manuscript.

Funding

The Article Processing Charges were funded by the University of Medicine and Pharmacy of Craiova, Romania.

Institutional Review Board Statement

Not applicable.

Informed Consent Statement

Not applicable.

Data Availability Statement

Not applicable.

Conflicts of Interest

The authors declare no conflict of interest.

References

  1. Hirschfield, G.M.; Karlsen, T.H.; Lindor, K.D.; Adams, D.H. Primary sclerosing cholangitis. Lancet 2013, 382, 1587–1599. [Google Scholar] [CrossRef]
  2. Talwalkar, J.A.; Lindor, K.D. Primary sclerosing cholangitis. Inflamm. Bowel Dis. 2005, 11, 62–72. [Google Scholar] [CrossRef] [PubMed]
  3. Rouillard, S.; Lane, N.E. Hepatic osteodystrophy. Hepatology 2001, 33, 301–307. [Google Scholar] [CrossRef] [PubMed]
  4. Angulo, P.; Peter, J.B.; Gershwin, M.; DeSotel, C.K.; Shoenfeld, Y.; Ahmed, A.E.; Lindor, K.D. Serum autoantibodies in patients with primary sclerosing cholangitis. J. Hepatol. 2000, 32, 182–187. [Google Scholar] [CrossRef]
  5. Hov, J.R.; Boberg, K.M.; Karlsen, T.H. Autoantibodies in primary sclerosing cholangitis. World J. Gastroenterol. 2008, 14, 3781–3791. [Google Scholar] [CrossRef]
  6. Connolly, M.P.; Melodi, K.K. Projection of liver transplant activity per indication in France and United Kingdom. J. Hepatol. 2020, 73, S123–S400. [Google Scholar] [CrossRef]
  7. Yadlapati, S.; Judge, T.A. Risk of hepatobiliary-gastrointestinal malignancies and appropriate cancer surveillance in patients with primary sclerosing cholangitis. Cureus 2021, 13, e19922. [Google Scholar] [CrossRef]
  8. Ghosh, S.; Cowen, S.; Hannan, W.J.; Ferguson, A. Low bone mineral density in Crohn’s disease, but not in ulcerative colitis, at diagnosis. Gastroenterology 1994, 107, 1031–1039. [Google Scholar] [CrossRef]
  9. Lopez-Larramona, G.; Lucendo, A.J.; Gonzalez-Castillo, S.; Tenias, J.M. Hepatic osteodystrophy: An important matter for consideration in chronic liver disease. World J. Hepatol. 2011, 3, 300–307. [Google Scholar] [CrossRef]
  10. Lupoli, R.; Di Minno, A.; Spadarella, G.; Ambrosino, P.; Panico, A.; Tarantino, L.; Lupoli, G.; Lupoli, G.; Di Minno, M.N.D. The risk of osteoporosis in patients with liver cirrhosis: A meta-analysis of literature studies. Clin. Endocrinol. 2016, 84, 30–38. [Google Scholar] [CrossRef]
  11. Karoli, Y.; Karoli, R.; Fatima, J.; Manhar, M. Study of Hepatic Osteodystrophy in Patients with Chronic Liver Disease. J. Clin. Diagn. Res. 2016, 10, OC31–OC34. [Google Scholar] [CrossRef] [PubMed]
  12. Ranjan, R.; Rampal, S.; Jaiman, A.; Tokgöz, M.A.; Koong, J.K.; Ramayah, K.; Rajaram, R. Common musculoskeletal disorders in chronic liver disease patients. Jt. Dis. Relat. Surg. 2021, 32, 818–823. [Google Scholar] [CrossRef] [PubMed]
  13. Vestergaard, P.; Krogh, K.; Rejnmark, L.; Laurberg, S.; Mosekilde, L. Fracture risk is increased in Crohn’s disease, but not in ulcerative colitis. Gut 2000, 46, 176–181. [Google Scholar] [CrossRef] [PubMed]
  14. Seki, A.; Ikeda, F.; Miyatake, H.; Takaguchi, K.; Hayashi, S.; Osawa, T.; Fujioka, S.; Tanaka, R.; Ando, M.; Seki, H.; et al. Risk of secondary osteoporosis due to lobular cholestasis in non-cirrhotic primary biliary cholangitis. J. Gastroenterol. Hepatol. 2017, 32, 1611–1616. [Google Scholar] [CrossRef] [PubMed] [Green Version]
  15. Wariaghli, G.; Allali, F.; El Maghraoui, A.; Hajjaj-Hassouni, N. Osteoporosis in patients with primary biliary cirrhosis. Eur. J. Gastroenterol. Hepatol. 2010, 22, 1397–1401. [Google Scholar] [CrossRef] [PubMed]
  16. Guañabens, N.; Parés, A.; Ros, I.; Caballería, L.; Pons, F.; Vidal, S.; Monegal, A.; Peris, P.; Rode, J. Severity of cholestasis and advanced histological stage but not menopausal status are the major risk factors for osteoporosis in primary biliary cirrhosis. J. Hepatol. 2005, 42, 573–577. [Google Scholar] [CrossRef]
  17. Wariaghli, G.; Mounach, A.; Achemlal, L.; Benbaghdadi, I.; Aouragh, A.; Bezza, A.; El Maghraoui, A. Osteoporosis in chronic liver disease: A case-control study. Rheumatol. Int. 2010, 30, 893–899. [Google Scholar] [CrossRef]
  18. Campbell, M.S.; Lichtenstein, G.R.; Rhim, A.D.; Pazianas, M.; Faust, T. Severity of liver disease does not predict osteopenia or low bone mineral density in primary sclerosing cholangitis. Liver Int. 2005, 25, 311–316. [Google Scholar] [CrossRef]
  19. Angulo, P.; Grandison, G.A.; Fong, D.G.; Keach, J.C.; Lindor, K.D.; Bjornsson, E.; Koch, A. Bone disease in patients with primary sclerosing cholangitis. Gastroenterology 2011, 140, 180–188. [Google Scholar] [CrossRef] [Green Version]
  20. Compston, J.E.; McClung, M.R.; Leslie, W.D. Osteoporosis. Lancet 2019, 393, 364–376. [Google Scholar] [CrossRef]
  21. Tu, K.N.; Lie, J.D.; Wan, C.K.V.; Cameron, M.; Austel, A.G.; Nguyen, J.K.; Van, K.; Hyun, D. Osteoporosis: A review of treatment options. Pharm. Ther. 2018, 43, 92–104. [Google Scholar]
  22. Eastell, R.; Rosen, C.J.; Black, D.M.; Cheung, A.M.; Murad, M.H.; Shoback, D. Pharmacological management of osteoporosis in postmenopausal women: An endocrine society* clinical practice guideline. J. Clin. Endocrinol. Metab. 2019, 104, 1595–1622. [Google Scholar] [CrossRef] [PubMed] [Green Version]
  23. Danford, C.J.; Trivedi, H.D.; Bonder, A. Bone health in patients with liver diseases. J. Clin. Densitom. 2020, 23, 212–222. [Google Scholar] [CrossRef] [PubMed]
  24. Page, M.J.; McKenzie, J.E.; Bossuyt, P.M.; Boutron, I.; Hoffmann, T.C.; Mulrow, C.D.; Shamseer, L.; Tetzlaff, J.M.; Akl, E.A.; Brennan, S.E.; et al. The PRISMA 2020 statement: An updated guideline for reporting systematic reviews. BMJ 2021, 372, n71. [Google Scholar] [CrossRef] [PubMed]
  25. Wells, G.; Shea, B.; O’Connell, D.; Peterson, J.; Welch, V.; Losos, M.; Tugwel, P. The Newcastle Ottawa Scale (NOS) for Assessing the Quality of Nonrandomized Studies in Meta-Analyses; 2011. Available online: http://www.ohri.ca/programs/clinical_epidemiology/oxford.asp (accessed on 21 January 2022).
  26. McPheeters, M.L.; Kripalani, S.; Peterson, N.B.; Idowu, R.T.; Jerome, R.N.; Potter, S.A.; Andrews, J.C. Closing the quality gap: Revisiting the state of the science (vol. 3: Quality improvement interventions to address health disparities). Evid. Rep. Technol. Assess 2012, 208.3, 1–475. [Google Scholar]
  27. Viechtbauer, W. Conducting Meta-Analyses in R with the Metafor Package. J. Stat. Softw. 2010, 36, 1–48. [Google Scholar] [CrossRef] [Green Version]
  28. Lacher, D.A.; Hughes, J.P.; Carroll, M.D. Biological variation of laboratory analytes based on the 1999-2002 National Health and Nutrition Examination Survey. Natl. Health Stat. Rep. 2010, 21, 1–7. [Google Scholar]
  29. Angulo, P.; Therneau, T.M.; Jorgensen, R.A.; DeSotel, C.K.; Egan, K.S.; Dickson, E.R.; Hay, J.E.; Lindor, K.D. Bone disease in patients with primary sclerosing cholangitis: Prevalence, severity and prediction of progression. J. Hepatol. 1998, 29, 729–735. [Google Scholar] [CrossRef]
  30. Guichelaar, M.M.J.; Kendall, R.; Malinchoc, M.; Hay, J.E. Bone mineral density before and after OLT: Long-term follow-up and predictive factors. Liver. Transplant. 2006, 12, 1390–1402. [Google Scholar] [CrossRef]
  31. Hay, J.E.; Lindor, K.D.; Wiesner, R.H.; Dickson, E.R.; Krom, R.A.; LaRusso, N.F. The metabolic bone disease of primary sclerosing cholangitis. Hepatology 1991, 14, 257–261. [Google Scholar] [CrossRef]
  32. Keller, S.; Ittrich, H.; Schramm, C.; Lohse, A.W.; Amling, M.; Adam, G.; Yamamura, J. Diffusion-weighted MRI for detection of hepatic osteodystrophy in primary sclerosing cholangitis: A comparison study with dual-energy X-ray absorptiometry. Jpn. J. Radiol. 2016, 34, 677–683. [Google Scholar] [CrossRef] [PubMed]
  33. Schmidt, T.; Schwinge, D.; Rolvien, T.; Jeschke, A.; Schmidt, C.; Neven, M.; Butscheidt, S.; Kriz, M.; Kunzmann, L.; Mussawy, H.; et al. Th17 cell frequency is associated with low bone mass in primary sclerosing cholangitis. J. Hepatol. 2019, 70, 941–953. [Google Scholar] [CrossRef] [PubMed]
  34. Raszeja-Wyszomirska, J.; Kucharski, R.; Zygmunt, M.; Safranow, K.; Miazgowski, T. The impact of fragility fractures on health-related quality of life in patients with primary sclerosing cholangitis. Hepat. Mon. 2015, 15, e25539. [Google Scholar] [CrossRef] [PubMed] [Green Version]
  35. The National Institutes of Health (NIH) Consensus Development Program: Osteoporosis Prevention, Diagnosis, and Therapy. Available online: https://consensus.nih.gov/2000/2000osteoporosis111html.htm (accessed on 21 January 2022).
  36. George, J.; Ganesh, H.K.; Acharya, S.; Bandgar, T.R.; Shivane, V.; Karvat, A.; Bhatia, S.J.; Shah, S.; Menon, P.S.; Shah, N. Bone mineral density and disorders of mineral metabolism in chronic liver disease. World J. Gastroenterol. 2009, 15, 3516–3522. [Google Scholar] [CrossRef]
  37. Chapman, R.; Fevery, J.; Kalloo, A.; Nagorney, D.M.; Boberg, K.M.; Shneider, B.; Gores, G.J. American Association for the Study of Liver Diseases. Diagnosis and management of primary sclerosing cholangitis. Hepatology 2010, 51, 660–678. [Google Scholar] [CrossRef]
  38. Janes, C.H.; Dickson, E.R.; Okazaki, R.; Bonde, S.; McDonagh, A.F.; Riggs, B.L. Role of hyperbilirubinemia in the impairment of osteoblast proliferation associated with cholestatic jaundice. J. Clin. Investig. 1995, 95, 2581–2586. [Google Scholar] [CrossRef] [Green Version]
  39. Gasser, R.W. Cholestasis and metabolic bone disease—A clinical review. Wien. Med. Wochenschr. 2008, 158, 553–557. [Google Scholar] [CrossRef]
  40. Gatta, A.; Verardo, A.; Di Pascoli, M.; Giannini, S.; Bolognesi, M. Hepatic osteodystrophy. Clin. Cases Miner. Bone Metab. 2014, 11, 185–191. [Google Scholar] [CrossRef]
  41. Steinberg, K.K.; Bonkovsky, H.L.; Caudill, S.P.; Bernhardt, R.K.; Hawkins, M. Osteocalcin and bone alkaline phosphatase in the serum of women with liver disease. Ann. Clin. Lab. Sci. 1991, 21, 305–314. [Google Scholar]
  42. Porayko, M.K.; Wiesner, R.H.; Hay, J.E.; Krom, R.A.; Dickson, E.R.; Beaver, S.; Schwerman, L. Bone disease in liver transplant recipients: Incidence, timing, and risk factors. Transplant. Proc. 1991, 23, 1462–1465. [Google Scholar]
  43. Eastell, R.; Dickson, E.R.; Hodgson, S.F.; Wiesner, R.H.; Porayko, M.K.; Wahner, H.W.; Cedel, S.L.; Riggs, B.L.; Krom, A.F. Rates of vertebral bone loss before and after liver transplantation in women with primary biliary cirrhosis. Hepatology 1991, 14, 296–300. [Google Scholar] [CrossRef] [PubMed]
  44. de Vries, E.M.G.; Wang, J.; Leeflang, M.M.G.; Boonstra, K.; Weersma, R.K.; Beuers, U.H.; Geskus, S.B.; Ponsioen, C.Y. Alkaline phosphatase at diagnosis of primary sclerosing cholangitis and 1 year later: Evaluation of prognostic value. Liver Int. 2016, 36, 1867–1875. [Google Scholar] [CrossRef] [PubMed]
  45. Chapman, M.H.; Thorburn, D.; Hirschfield, G.M.; Webster, G.G.J.; Rushbrook, S.M.; Alexander, G.; Collier, J.; Dyson, J.K.; Jones, D.E.; Patanwala, I.; et al. British Society of Gastroenterology and UK-PSC guidelines for the diagnosis and management of primary sclerosing cholangitis. Gut 2019, 68, 1356–1378. [Google Scholar] [CrossRef] [PubMed] [Green Version]
  46. Lamb, C.A.; Kennedy, N.A.; Raine, T.; Hendy, P.A.; Smith, P.J.; Limdi, J.K.; Hayee, B.; Lomer, M.C.E.; Parkes, G.C.; Selinger, C.; et al. British Society of Gastroenterology consensus guidelines on the management of inflammatory bowel disease in adults. Gut 2019, 68, s1–s106. [Google Scholar] [CrossRef] [PubMed] [Green Version]
Figure 1. PRISMA flow of the selection process.
Jcm 11 03807 g001
Figure 2. (A) Forest plot assuming a random-effects model for BMD-LS PSC vs. Healthy. (B) Funnel plot demonstrating publication bias assessment in model for BMD-LS PSC vs. Healthy [18,19,34].
Jcm 11 03807 g002
Figure 3. Forest plot assuming a random-effects model for BMD-LS PSC vs. PBC [30].
Jcm 11 03807 g003
Figure 4. Forest plot assuming a fixed-effects model for T-score PSC vs. PBC [30,33].
Jcm 11 03807 g004
Figure 5. Forest plot assuming a fixed-effects model for Z-score PSC vs. PBC [30,33].
Jcm 11 03807 g005
Figure 6. Forest plot assuming a random-effects model for BMD-hip PSC vs. Healthy [19].
Jcm 11 03807 g006
Figure 7. (A) Forest plot assuming a random-effects model for Vitamin D PSC vs. Healthy. (B) Funnel plot for publication bias assessment for vitamin D in PSC patients vs. Healthy [19,29,31,32,33].
Jcm 11 03807 g007
Figure 8. (A) Forest plot assuming a random-effects model for calcium PSC vs. Healthy. (B) Funnel plot for publication bias assessment for calcium in PSC patients vs. Healthy [19,29,32].
Jcm 11 03807 g008
Figure 9. (A) Forest plot assuming a random-effects model for bilirubin PSC vs. Healthy. (B) Funnel plot for publication bias assessment for bilirubin in PSC patients vs. Healthy [18,19,29,31,32,34].
Jcm 11 03807 g009
Figure 10. (A) Forest plot assuming a random-effects model for alkaline phosphatase PSC vs. Healthy. (B) Funnel plot for publication bias assessment for alkaline phosphatase in PSC patients vs. Healthy [18,19,29,32,34].
Jcm 11 03807 g010
Figure 11. Forest plot assuming a fixed-effects model for fractures PSC vs. PBC [30,33].
Jcm 11 03807 g011
Table 1. Description of the characteristics of included studies.
Study (Year)CountryStudy TypeGender
Male/Female
PSC, Control
Age (Mean), Years PSC, ControlMean Duration of Disease (Months)Severity of DiseaseTreatmentQuality Assessments (NOS)Number of PSC Patients/ControlsOutcomesOsteodensitometry Machine Used
PSC Mayo Risk ScoreMELD PSC, Control
Angulo P et al., 1998 [29]USAClinical study44/37/NA42.9 ± 11.531 ± 34, NA2.9 ± 1.2NANA881/81Prevalence of osteoporosis, lumbar spine BMDHologic
Angulo P et al., 2011 [19]USACohort study42%/58%, NA45.5 ± 0.8, 45.5 ± 0.863.4 ± 4.6, NA1.19 ± 0.09NABudesonide, biphosphonates
(Cumulative prednisone dose)
9237/237Prevalence of fractures, osteoporosis, lumbar spine BMD and T-score, hip BMD and T-scoreHologic
Campbell MS et al., 2005 [18]USAClinical study25/5, NA46.9 ± 13.4, 46.9 ±13.4NA1.52 ± 1.0710.5 ± 4.5Biphosphonates, steroids (no doses mentioned), calcium, vitamin D, ursodeoxycholic acid830/30Lumbar spine BMDLunar and Norland
Guichelaar MMJ et al., 2006 [30]USACohort study142/ 21846.8 ± 11.0/53.2 ± 8.685.2 ± 63.6 /94.8 ± 63.6NA17.0 ± 8.7/17.6 ± 8.8Glucocorticoids (prednisone 10 mg per day), biphosphonates, ursodeoxycholic acid9204/156Prevalence of fractures and osteoporosis, lumbar spine BMD and T-scoreHologic
Hay JE et al., 1991 [31]USAClinical study19/11, 13/539.4 ± 0.3, 42.7 ± 0.791.44, NANANANA830/18Prevalence of osteopenia, lumbar spine BMD-
Keller S et al., 2016 [32]GermanyClinical study20/20, NA50 ± 12.6, 49.5 ± 13.0102 ± 98.4, NANANAUrsodeoxycholic acid, prednisolone (10 mg per day)840/10Prevalence of osteoporosis, lumbar spine BMD and T- scoreGE Lunar
Schmidt T et al., 2019 [33]GermanyCohort study136/ 102, 132/ 21047.1 ±13.879.1 ± 75.4/71.9 ± 62.7NANAGlucocorticoids, biphosphonates, ursodeoxycholic acid,
Prednisolone (no doses mentioned)
8238/242Prevalence of fractures, osteoporosis, lumbar spine BMD and the femoral neckGE Lunar
Wyszomirska JR et al., 2015 [34]PolandClinical study22/11, NA35.3 ± 13.3840.56 ± 24.2NANANA833/33Prevalence of fracturesHologic
Publisher’s Note: MDPI stays neutral with regard to jurisdictional claims in published maps and institutional affiliations.

