Abstract
The analysis of the predictive validity of a scale allows us to establish objectives in rehabilitation and to make decisions in the clinical setting. The objective of this study was to determine the validity of the Postural Assessment Scale for Stroke (PASS) to predict functionality at each stage of recovery in stroke patients. Methods: A retrospective study was carried out collecting data from patients admitted to a neurorehabilitation hospital. All patients having suffered a stroke less than two months before hospital admission were included in the study. The balance was measured with the PASS scale and the functionality with the Functional Independence Measure (FIM) scale. Simple linear regressions were performed to model the relationship between the PASS and FIM scores in the acute, subacute and chronic stages (6 and 12 months), as well as between the PASS scores at admission and the FIM values in the chronic stage. Results: The PASS scale showed a good predictive validity (R2 values from 0.54 to 0.87; β values from 1.99 to 2.62; p < 0.001) for FIM scores at acute, subacute and chronic stages, with lower goodness-of-fit for PASS scores at admission and FIM scores at 12 months (R2 = 0.383; β = 1.61 (0.96–2.26); p < 0.001). Cut-off points in the PASS scale to predict high functional level were 17.5 for the acute stage and 16.5 for the subacute and chronic stages. A score of 8.5 on the PASS scale measured in the acute phase predicted a high functional level at 12 months. Conclusion: The PASS scale is a useful tool to classify the functionality of stroke patients in the acute, subacute and chronic phases. The PASS score upon admission into the hospital can predict the functionality of the stroke patients after 12 months. However, future studies should be carried out to corroborate our findings with larger sample sizes.
1. Introduction
Stroke is one of the leading causes of disability in adults worldwide [1,2]. In the European Union, stroke constitutes the first cause of death, and one of the main causes of adult disability [3]. Every year approximately 1.1 million inhabitants are affected by a stroke, and it causes 440,000 deaths per year [4,5]. Nevertheless, the survival rate in stroke events is rising, and it is expected to increase over the next few years [6].
Postural control is usually altered after a stroke, which constitutes major social, economic and personal burdens of this population [7,8]. Therefore, to assess postural control is a key element in a rehabilitation context [9,10]. The relationship between postural control and functionality at each moment could guide rehabilitation and help establish functional goals in each stage. The Functional Independence Measure (FIM) has been considered the gold standard in the evaluation of functionality in stroke patients [11]. It provides more accurate information than what is obtained with the Barthel Index (BI). However, it requires prior knowledge of the patient, the observation of the functional development of each task assessed, the evaluation sometimes takes several days/sessions and it is necessary to know and follow a decision flow established in the instructions of the scale [12].
In this context, the analysis of the predictive validity of a scale could allow us to know the ability of that scale to predict the score of another scale or of another event studied. In addition, establishing the predictive validity through a simpler scale allows us to obtain information more quickly, which facilitates its clinical application. To establish objectives in rehabilitation and to make decisions in the clinical setting, it is especially important to have predictive parameters that allow us to anticipate certain events and establish priorities in rehabilitation. In the study of predictive validity in stroke, trunk control and balance have been shown to be good indicators of motor recovery in patients. Postural control is essential for many activities such as breathing, swallowing and all activities of daily living [13]. Different researchers have studied the predictive capacity of the trunk control, studying other constructs like the risk of falls, the ability to walk or dependency in stroke patients [14,15,16,17]. However, to our best knowledge, the predictive validity of balance and postural control to predict functionality in the different stages of recovery after stroke has not been studied.
The Postural Assessment Scale for Stroke (PASS) measures balance in lying down, sitting and standing positions in stroke patients. It consists of 12 items whose score can vary from zero to three, with zero being the lowest level of functionality and three being the highest level. The total score can be 36 [18]. It was developed taking into account the relationship between the ability to maintain a posture and to ensure balance when changing position. PASS scale is sensitive to detect changes even in patients with great postural deficit and has an increasing difficulty in the scale itself that allows its application in patients of different functional levels [19]. In addition, the PASS scale has been shown to be more sensitive than the Berg Balance Scale (BBS) and the balance subscale of the Fugl–Meyer scale (FM-B) in patients with severe stroke in early stages [20], as well as for the assessment of balance in patients with more severe affectations [21]. It has also been shown to be useful in quantifying progress in patients with pusher syndrome [22].
However, to our best knowledge, there are no previous works that have studied the capacity of the PASS scale in predicting functionality in patients with acute, subacute and chronic stroke. Therefore, the objectives of this study were: (1) to analyze the predictive validity of the PASS scale to establish the functionality at each stage of recovery after stroke; and (2) to determine if the PASS score upon admission at the hospital could predict the functionality of the stroke patients after 12 months.
2. Materials and Methods
2.1. Design
A retrospective study was carried out collecting data from patients admitted to Hospital Los Madroños (Madrid), a neurorehabilitation hospital in Madrid, Spain. STROBE (STrengthening the Reporting of OBservational studies in Epidemiology) guidelines were followed to standardize the reporting of this work. The study was approved by the Local Ethics Committee (031020168316).
2.2. Participants
Patient’s data were collected for study purposes from medical records stored in the hospital database (CE-B). The screened period was from October 2016 to May 2017. All patients having suffered a stroke less than 8 weeks before hospital admission were included in the study if: (1) gait and balance treatment had been identified as a goal by the patient and the rehabilitation team, according to SMART goals [23]; (2) stroke was confirmed by a neurologist using either magnetic resonance imaging or computed axial tomography; and (3) all patients should follow the same individual rehabilitation treatment oriented to gait and balance improvements. Those patients with clinical situations unrelated to the stroke that could interfere with their recovery (skeletal muscle pathologies, unstable cardiovascular or neurological situation) were excluded.
2.3. Procedure
The PASS scale was used to measure balance, and the Functional Independence Measure (FIM) was selected to assess the functionality of the patients. Scores of both scales were collected at 4 time points during the rehabilitation process: upon admission, at 3 months (subacute state), at 6 months and at 12 months (chronic state) [24].
The PASS is a balance test. This measure evaluates static balance, in sitting and standing, and dynamic, in position changes including the lying position. It consists of 12 items. Each item is evaluated from 0 to 3, where 0 is the lowest functional level and 3 is the highest functional level. The total score is 36 points [19]. The Spanish version of the PASS was administered [25].
The FIM scale evaluates different aspects of functionality such as self-care, sphincter control, locomotion or mobility. It consists of 18 items, 13 of which evaluate physical function and are related to the Barthle index, and 5 additional items which evaluate cognitive function in aspects such as problem execution and memory, in addition to social interaction [26]. Each item is evaluated in 7 categories (1 is completely independent, 7 is completely independent) [27]. Thus, the lowest score on the scale is 18 and the highest is 126. The FIM scale has shown high sensitivity in general, especially regarding the level of attention required for functional activity [28]. Specifically, it has been shown to be robust, in terms of its psychometric properties, in hospitalized stroke patients [29]. Different studies have established cut-off points to establish categories with respect to functionality using the FIM scale [28,29]. Inouye et al. categorized patients into three groups according to their FIM score (≤36; 37–72; ≥73), corresponding to severe, moderate and mild impairment of functionality, respectively [30].
The psychometric properties of the administered scales (PASS and FIM) have been studied, showing that they are valid and reliable for evaluating their respective constructs in stroke patients [27,31,32].
2.4. Sample Size
The sample size was calculated using the G*Power software (version G*Power 3.1.9.2, Universität Düsseldorf, Düsseldorf, Alemania). The following parameters were considered: bilateral contrast, an effect size of 0.15 (medium), an error alfa of 0.05, a power of 80% and number of predictors (n = 1). The resulting sample size was 55 participants.
2.5. Statistical Analysis
2.5.1. Predictive Models
A single linear regression was performed to model the relationship between the PASS and FIM scores. A model was run for each of the studied time points (acute, subacute and chronic states) and between PASS scores at admission and FIM values in the chronic stage. A 95% confidence interval was established for the β coefficient. The validity of the model was analyzed by calculating the ANOVA, with significance set at p < 0.001. The Durbin and Watson test, and the Kolmogorov–Smirnov test to analyze the normality of residuals in all models, were used.
2.5.2. Cut-Off Points
Receiver operating characteristic (ROC) curves were used to determine the discriminatory power of the PASS for classifying participants into 2 groups based on their FIM score: severe and moderate functional impairment (FIM < 73) and mild functional impairment (FIM ≥ 73) [30].
The accuracy was assessed using the area under the curve (AUC), which can be interpreted as the probability of correctly identifying participants with minor or moderate risk of falls. An AUC value of 0.9 and above indicates high accuracy, 0.7 to 0.9 indicates moderate accuracy, 0.5 to 0.7 indicates low accuracy and 0.5 and below indicates test due to chance [33,34]. The cut-off point of a continuous variable that determines the highest sensitivity and specificity is the value which has the highest Youden index, calculated according to the expression: sensitivity + specificity − 1 [35].
3. Results
Data from 375 patients were retrospectively analyzed. Up to 61 patients (40 males, 21 females; mean age 62.75 ± 13.31 years) met the eligibility criteria and were included. Of them, 47 (77.0%) presented ischemic stroke. Data from the 61 patients were upon admission (17.07 ± 13.21 days) and the subacute state (107.06 ± 13.25 days), from 58 patients at 6 months (197.08 ± 13.25 days; chronic state) and from 42 patients at 12 months (382.06 ± 9.8 days; chronic state). The main reason of patients lost was the discharge from the hospital. The characteristics of participants are presented in Table 1.

Table 1.
Characteristics of participants.
3.1. Predictive Models
Significant relationships were found between PASS scores and FIM scores at each stage of stroke recovery, and between PASS scores upon hospital admission and FIM scores at 12 months. Table 2 shows the parameters of the linear regression models. Both the variability in the target variable which was explained by the regression model and the increase shown by the β coefficient increased when advancing through the sequential stages defined in the rehabilitation process. On the contrary, lower goodness-of-fit was found for PASS scores at admission and FIM scores at 12 months.
Table 2.
Linear Regression Results (PASS–FIM).
3.2. Cut-Off Points
AUC values were 0.828 in the acute stage, 0.877 in the subacute stage, 0.901 in the chronic stage (6 months) and 0.966 in the chronic stage (12 months). In all cases, the AUC was greater than 0.7 and in the chronic stage was greater than 0.9, which indicates that the PASS may be valid to identify stroke patients with mild functional impairment measured with the FIM scale (Figure 1).
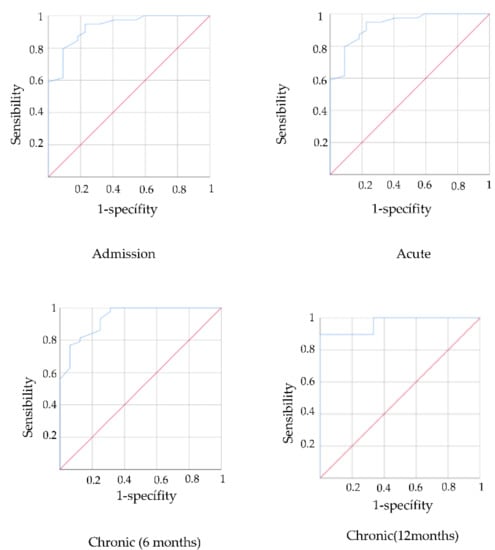
Figure 1.
ROC curves predictive validity PASS for functionality in acute, subacute and chronic stage.
The cut-off point was calculated to establish the level of functionality associated with the PASS scale scores through the Youden Index. The PASS cut-off points were 17.5 for the acute stage and 16.5 for the subacute and chronic stages. Therefore, a value above these scores on the PASS scale would be related to mild functional impairment.
The PASS scale upon hospital admission was also shown to be a valid instrument to predict functionality using the FIM scale at 12 months (AUC = 0.832). The PASS cut-off was 8.5 which indicates that values above this score may predict a high level of functionality at 12 months (Figure 2).
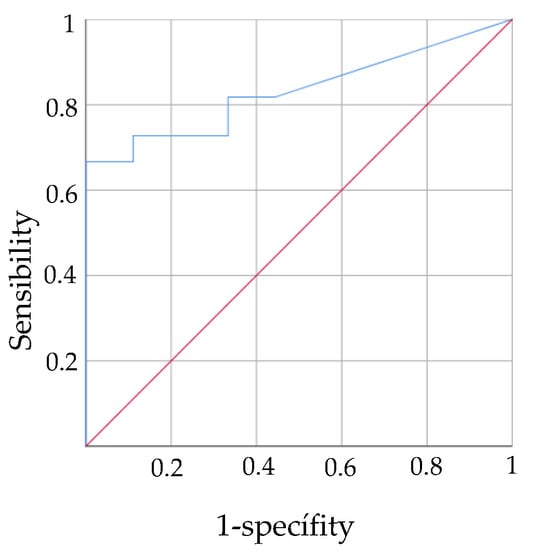
Figure 2.
ROC curves predictive validity PASS in acute stage for functionality in chronic stage.
4. Discussion
The results obtained in this work show that PASS was a useful tool to predict the functionality of stroke patients in the acute, subacute and chronic phases. In addition, the present study established PASS cut-off values predicting mild functional impairment (17.5 at the acute stage and 16.5 at the subacute and chronic stages).
Our results also showed that PASS assessment in the acute phase was a useful tool to predict the functionality of stroke patients at 12 months, establishing that PASS scores above 8.5 points upon hospital admission were able to identify a higher functional level at 12 months in stroke patients. It must be noticed that a FIM score ≥ 73 was considered as a high level of functionality [28]. In this line, another study found that a better FIM score (score ≥ 73) was correlated with a lower risk of falls and functional deterioration [36], so future studies should be conducted to predict these constructs through postural control scales.
The validation of predictive models has been widely studied in rehabilitation. Several factors in the acute phase, such as advanced age, extent of the injury, presence of dysphagia, stroke complications (cerebral edema), absence of sphincter control and paresis of the upper limbs, have been identified to be related with worse functional recovery after stroke [37,38,39]. Trunk control has also been noted as a predictor of walking ability at 12 months and of reduction in the risk of falls [40]. The ability of different trunk control scales to predict functionality has also been studied. However, none of the scales studied has been shown to be complete, in absolute terms, to predict functionality at each stage of recovery and 12 months after the stroke [41].
A predictive validity makes it possible to reduce the number of evaluations necessary to assess the patient’s global condition, allowing to set individualized rehabilitation objectives and good relationships between the two constructs studied [32]. Additionally, postural control has shown to be a predictor of important aspects of recovery, such as walking ability or the risk of falls [42]. In this context, the PASS scale is a scale originally developed for the evaluation of stroke patients. It evaluates both static and dynamic balance and analyzes postural control in basic activities such as postural changes in lying, sitting and standing. In addition, it has shown to be sensitive and effective in highly affected patients and in patients with a high functional level [20]. Our results confirm the predictive relationship that exists between postural control and functionality in the different stages of recovery after a stroke.
Previous studies had analyzed the validity of the PASS scale in acute patients in predicting functionality in the chronic stage. Hsieh et al. [43] analyzed the effect of different factors such as age and functionality in the acute phase (measured with the FIM scale or PASS score), on the ability to perform daily living activities 6 months after stroke, and determined that the PASS score was the main predictive factor. Our results are in accordance with those results and extended this relationship up to 12 months.
Huang et al. [44] also analyzed the ability of the PASS scale to predict walking ability in stroke patients, defining a cut-off value of 12.5 upon admission as a predictor of the ability to walk, with or without technical assistance at discharge (after a mean hospital stay of 18.12 days). In our study, PASS cut-off values in the acute phase predicting a high level of functionality in the subacute and chronic phases were 17.5 and 16.5, respectively. Differences could be interpreted as that greater trunk control and balance are required when attempting to predict global functionality beyond just ambulation. In the present work, the FIM scale was used to evaluate functionality, a scale in which only two of the total eighteen items evaluate locomotion. Although ambulation and functional level are closely related, other competences could be necessary to achieve a higher functional level.
This work presents several limitations. The calculated sample size required 55 participants and, because of discharges to the rehabilitation center, the sample evaluated at 12 months was 42 patients. In addition, the sample size was not large enough to analyze the data according to the type or severity of the stroke, as well as the location of the lesion. Future studies are warranted to corroborate the PASS cut-off values for predicting functionality in patients with stroke in its different described phases. Although this work provides a direct and quantified relationship between postural control and functionality, it would be interesting to be able to establish a multivariate predictive model with larger sample sizes.
5. Conclusions
The PASS scale was a useful tool to predict the functionality of stroke patients in the acute, subacute and chronic phases. The PASS cut-off values to determine a high functional level were 17.5 at the acute stage and 16.5 at the subacute and chronic stages.
The PASS score upon admission in the hospital can predict the functional impairment of the stroke patients after 12 months. We established that a score above 8.5 points in the PASS scale upon admission in the hospital is a cut-off point to identify a higher functional level in the stroke patients at 12 months. A score of 8.5 on the PASS scale measured in the acute phase predicted a high functional level at 12 months. However, future studies should be carried out to corroborate our findings with larger sample sizes.
Author Contributions
Conceptualization, C.E.-B., F.M.-R. and R.C.-d.-l.-C.; methodology, C.E.-B., F.M.-R. and R.C.-d.-l.-C.; software, C.E.-B.; validation, C.E.-B. and I.S.-E.; formal analysis, M.J.G.-M.; investigation, C.E.-B., F.M.-R. and R.C.-d.-l.-C.; resources, I.S.-E.; data curation, C.E.-B. and M.J.G.-M.; writing—original draft preparation, C.E.-B., F.M.-R., R.C.-d.-l.-C., I.S.-E. and M.J.G.-M.; writing—review and editing, C.E.-B., F.M.-R., R.C.-d.-l.-C., I.S.-E. and M.J.G.-M.; visualization, C.E.-B., F.M.-R., R.C.-d.-l.-C., I.S.-E. and M.J.G.-M.; supervision, F.M.-R. and R.C.-d.-l.-C. All authors have read and agreed to the published version of the manuscript.
Funding
This research received no external funding.
Institutional Review Board Statement
The study was conducted in accordance with the Declaration of Helsinki, and approved by an Ethics Committee.
Informed Consent Statement
Informed consent was obtained from all subjects involved in the study.
Data Availability Statement
No new data were created or analyzed in this study.
Conflicts of Interest
The authors declare no conflict of interest.
References
- Thrift, A.G.; Thayabaranathan, T.; Howard, G.; Howard, V.J.; Rothwell, P.M.; Feigin, V.L.; Norrving, B.; Donnan, G.A.; Cadilhac, D.A. Global stroke statistics. Int. J. Stroke 2017, 12, 13. [Google Scholar] [CrossRef] [PubMed]
- Hankey, G.J. Stroke. Lancet 2017, 389, 641–654. [Google Scholar] [CrossRef]
- Wilkins, E.; Wilson, L.; Wickramasinghe, K.; Bhatnagar, P.; Leal, J.; Luengo-Fernandez, R.; Burns, R.; Rayner, M.; Townsend, N. European Cardiovascular Disease Statistics 2017; European Heart Network: Brussels, Belgium, 2017. [Google Scholar]
- Béjot, Y.; Bailly, H.; Durier, J.; Giroud, M. Epidemiology of stroke in Europe and trends for the 21st century. Presse Med. 2016, 45, 391–398. [Google Scholar] [CrossRef] [PubMed]
- OECD. Mortality from heart disease and stroke. In Health at a Glance: Europe. State of Health in the EU Cycle; OECD Publishing: Paris, France, 2016. [Google Scholar]
- Wafa, H.A.; Wolfe, C.D.A.; Emmett, E.; Roth, G.A.; Johnson, C.O.; Wang, Y. Burden of Stroke in Europe: Thirty-Year Projections of Incidence, Prevalence, Deaths, and Disability-Adjusted Life Years. Stroke 2020, 51, 2418–2427. [Google Scholar] [CrossRef]
- Lord, S.E.; McPherson, K.; McNaughton, H.K.; Rochester, L.; Weatherall, M. Community ambulation after stroke: How important and obtainable is it and what measures appear predictive? Arch. Phys. Med. Rehabil. 2004, 85, 234–239. [Google Scholar] [CrossRef]
- Wade, D.T.; Hewer, R.L. Functional abilities after stroke: Measurement, natural history and prognosis. J. Neurol. Neurosurg. Psychiatry 1987, 50, 177–182. [Google Scholar] [CrossRef]
- Harris, J.E.; Eng, J.J. Goal priorities identified through client-centred measurement in individuals with chronic stroke. Physiother. Can. 2004, 56, 171–176. [Google Scholar] [CrossRef]
- Bohannon, R.W.; Andrews, A.W.; Smith, M.B. Rehabilitation goals of patients with hemiplegia. Int. J. Rehabil. Res. 1988, 11, 181–184. [Google Scholar] [CrossRef]
- Maritz, R.; Fellinghauer, C.; Brach, M.; Curt, A.; Gmünder, H.P.; Hopfe, M.; Hund-Georgiadis, M.; Jordan, X.; Scheel-Sailer, A.; Stucki, G. A Rasch-Based Comparison of the Functional Independence Measure and Spinal Cord Independence Measure for Outcome and Quality in the Rehabilitation of Persons with Spinal Cord Injury. J. Rehabil. Med. 2022, 54, 82. [Google Scholar] [CrossRef]
- Smith, P.; Hamilton, B.B.; Granger, C.V. FIM Decision Tree: The Fone FIM; Research Foundation of State University of New York: Albany, NY, USA, 1990. [Google Scholar]
- Verheyden, G.; Nieuwboer, A.; Van de Winckel, A.; De Weerdt, W. Clinical tools to measure trunk performance after stroke: A systematic review of the literature. Clin. Rehabil. 2007, 21, 387–394. [Google Scholar] [CrossRef]
- Duarte, E.; Morales, A.; Pou, M.; Aguirrezábal, A.; Aguilar, J.J.; Escalada, F. Test de control de tronco: Predictor precoz del equilibrio y capacidad de marcha a los 6 meses del ictus [Trunk control test: Early predictor of gait balance and capacity at 6 months of the stroke]. Neurologia 2009, 24, 297–303. [Google Scholar] [PubMed]
- Gatti, M.A.; Portela, M.; Gianella, M.; Freixes, O.; Fernández, S.A.; Rivas, M.E.; Tanga, C.O.; Olmos, L.E.; Rubel, I.F. Walking ability after stroke in patients from Argentina: Predictive values of two tests in subjects with subacute hemiplegia. J. Phys. Ther. Sci. 2015, 27, 2977–2980. [Google Scholar] [CrossRef] [PubMed][Green Version]
- Maeda, N.; Kato, J.; Shimada, T. Predicting the probability for fall incidence in stroke patients using the Berg Balance Scale. J. Int. Med. Res. 2009, 37, 697–704. [Google Scholar] [CrossRef] [PubMed]
- Persson, C.U.; Hansson, P.O.; Sunnerhagen, K.S. Clinical tests performed in acute stroke identify the risk of falling during the first year: Postural stroke study in Gothenburg (POSTGOT). J. Rehabil. Med. 2011, 43, 348–353. [Google Scholar] [CrossRef]
- Chien, C.; Hu, M.; Tang, P.; Sheu, C.; Hsieh, C. A comparison of psychometric properties of the smart balance master system and the postural assessment scale for stroke in people who have had mild stroke. Arch. Phys. Med. Rehabil. 2007, 88, 74–380. [Google Scholar] [CrossRef]
- Benaim, C.; Pérennou, D.A.; Villy, J.; Rousseaux, M.; Pelissier, J.Y. Validation of a standardized assessment of postural control in stroke patients: The Postural Assessment Scale for Stroke Patients (PASS). Stroke 1999, 30, 1862–1868. [Google Scholar] [CrossRef]
- Mao, H.; Hsueh, I.; Tang, P.; Sheu, C.; Hsieh, C. Analysis and comparison of the psychometric properties of three balance measures for stroke patients. Stroke 2002, 33, 1022–1027. [Google Scholar] [CrossRef]
- Huang, Y.J.; Lin, G.H.; Lee, S.C.; Hsieh, C.L. A Comparison of the Responsiveness of the Postural Assessment Scale for Stroke and the Berg Balance Scale in Patients with Severe Balance Deficits after Stroke. J. Geriatr. Phys. Ther. 2020, 43, 194–198. [Google Scholar] [CrossRef]
- Clark, E.; Hill, K.D.; Punt, T.D. Responsiveness of 2 scales to evaluate lateropulsion or pusher syndrome recovery after stroke. Arch. Phys. Med. Rehabil. 2012, 93, 149–155. [Google Scholar] [CrossRef]
- Barnes, M.P. Principles of neurological rehabilitation. J. Neurol. Neurosurg. Psychiatry 2003, 74, 3–7. [Google Scholar] [CrossRef]
- Kiran, S. What is the nature of poststroke language recovery and reorganization? ISRN Neurol. 2012, 2012, 786872. [Google Scholar] [CrossRef] [PubMed]
- Cabanas-Valdés, R.; Girabent-Farrés, M.; Cánovas-Vergé, D.; Caballero-Gómez, F.M.; Germán-Romero, A.; Bagur-Calafat, C. Spanish translation and validation of the Postural Assessment Scale for Stroke Patients (PASS) to assess balance and postural control in adult post-stroke patients. Rev. Neurol. 2015, 60, 151–158. [Google Scholar] [PubMed]
- McPherson, K.M.; Pentland, B.; Cudmore, S.F.; Prescott, R.J. An inter-rater reliability study of the Functional Assessment Measure (FIM+FAM). Disabil. Rehabil. 1996, 18, 341–347. [Google Scholar] [CrossRef] [PubMed]
- Hawley, C.A.; Taylor, R.; Hellawell, D.J.; Pentland, B. Use of the functional assessment measure (FIM + FAM) in head injury rehabilitation: A psychometric analysis. J. Neurol. Neurosurg. Psychiatry 1999, 67, 749–754. [Google Scholar] [CrossRef] [PubMed]
- Dodds, T.A.; Martin, D.P.; Stolov, W.C.; Deyo, R.A. A validation of the functional independence measurement and its performance among rehabilitation inpatients. Arch. Phys. Med. Rehabil. 1993, 74, 531–536. [Google Scholar] [CrossRef]
- Hsueh, I.; Lin, J.; Jeng, J.; Hsieh, C. Comparison of the psychometric characteristics of the functional independence measure, 5 item Barthel index, and 10 item Barthel index in patients with stroke. J. Neurol. Neurosurg. Psychiatry 2002, 73, 188–190. [Google Scholar] [CrossRef]
- Inouye, M.; Hashimoto, H.; Mio, T.; Sumino, K. Influence of admission functional status on functional change after stroke rehabilitation. Am. J. Phys. Med. Rehabil. 2001, 80, 121–125. [Google Scholar] [CrossRef]
- Estrada-Barranco, C.; Cano-de-la-Cuerda, R.; Abuín-Porras, V.; Molina-Rueda, F. Postural Assessment Scale for Stroke Patients in Acute, Subacute and Chronic Stage: A Construct Validity Study. Diagnostics 2021, 11, 365. [Google Scholar] [CrossRef]
- Sangha, H.; Lipson, D.; Foley, N.; Salter, K.; Bhogal, S.; Pohani, G.; Teasell, R.W. A comparison of the Barthel Index and the Functional Independence Measure as outcome measures in stroke rehabilitation: Patterns of disability scale usage in clinical trials. Int. J. Rehabil. Res. 2005, 28, 135–139. [Google Scholar] [CrossRef]
- Balasch i Bernat, M.; Balasch i Parisi, S.; Sebastián, E.N.; Moscardó, L.D.; Ferri Campos, J.; Lopez Bueno, L. Determining cut-off points in functional assessment scales in stroke. NeuroRehabilitation 2015, 37, 165–172. [Google Scholar] [CrossRef]
- Mehrholz, J.; Wagner, K.; Rutte, K.; Meissner, D.; Pohl, M. Predictive validity and responsiveness of the functional ambulation category in hemiparetic patients after stroke. Arch. Phys. Med. Rehabil. 2007, 88, 1314–1319. [Google Scholar] [CrossRef] [PubMed]
- Cerda, J.; Cifuentes, L. Using ROC curves in clinical investigation: Theoretical and practical issues. Rev. Chil. Infectol. 2012, 29, 138–141. [Google Scholar] [CrossRef] [PubMed]
- Forrest, G.P.; Chen, E.; Huss, S.; Giesler, A. A comparison of the Functional Independence Measure and Morse Fall Scale as tools to assess risk of fall on an inpatient rehabilitation. Rehabil. Nurs. 2013, 38, 186–192. [Google Scholar] [CrossRef] [PubMed]
- Craig, L.E.; Wu, O.; Bernhardt, J.; Langhorne, P. Predictors of poststroke mobility: Systematic review. Int. J. Stroke 2011, 6, 321–327. [Google Scholar] [CrossRef]
- Veerbeek, J.M.; Kwakkel, G.; van Wegen, E.E.; Ket, J.C.; Heymans, M.W. Early prediction of outcome of activities of daily living after stroke: A systematic review. Stroke 2011, 42, 1482–1488. [Google Scholar] [CrossRef]
- Meijer, R.; Ihnenfeldt, D.S.; de Groot, I.J.; van Limbeek, J.; Vermeulen, M.; de Haan, R.J. Prognostic factors for ambulation and activities of daily living in the subacute phase after stroke. A systematic review of the literature. Clin. Rehabil. 2003, 17, 119–129. [Google Scholar] [CrossRef]
- Lee, K.; Lee, D.; Hong, S.; Shin, D.; Jeong, S.; Shin, H.; Choi, W.; An, S.; Lee, G. The relationship between sitting balance, trunk control and mobility with predictive for current mobility level in survivors of sub-acute stroke. PLoS ONE 2021, 16, e0251977. [Google Scholar] [CrossRef]
- Fil Balkan, A.; Salcı, Y.; Keklicek, H.; Çetin, B.; Adın, R.M.; Armutlu, K. The trunk control: Which scale is the best in very acute stroke patients? Top. Stroke Rehabil. 2019, 26, 359–365. [Google Scholar] [CrossRef]
- Tyson, S.F.; Hanley, M.; Chillala, J.; Selley, A.B.; Tallis, R.C. The relationship between balance, disability, and recovery after stroke: Predictive validity of the Brunel Balance Assessment. Neurorehabilit. Neural Repair 2007, 21, 341–346. [Google Scholar] [CrossRef]
- Hsieh, C.L.; Sheu, C.F.; Hsueh, I.P.; Wang, C.H. Trunk control as an early predictor of comprehensive activities of daily living function in stroke patients. Stroke 2002, 33, 2626–2630. [Google Scholar] [CrossRef]
- Huang, Y.C.; Wang, W.T.; Liou, T.H.; Liao, C.D.; Lin, L.F.; Huang, S.W. Postural Assessment Scale for Stroke Patients Scores as a predictor of stroke patient ambulation at discharge from the rehabilitation ward. J. Rehabil. Med. 2016, 48, 259–264. [Google Scholar] [CrossRef] [PubMed]
Publisher’s Note: MDPI stays neutral with regard to jurisdictional claims in published maps and institutional affiliations. |
© 2022 by the authors. Licensee MDPI, Basel, Switzerland. This article is an open access article distributed under the terms and conditions of the Creative Commons Attribution (CC BY) license (https://creativecommons.org/licenses/by/4.0/).