
Early Reoperation Rates and Its Risk Factors after Instrumented Spinal Fusion Surgery for Degenerative Spinal Disease: A Nationwide Cohort Study of 65,355 Patients


Abstract
:1. Introduction
2. Materials and Methods
2.1. Database
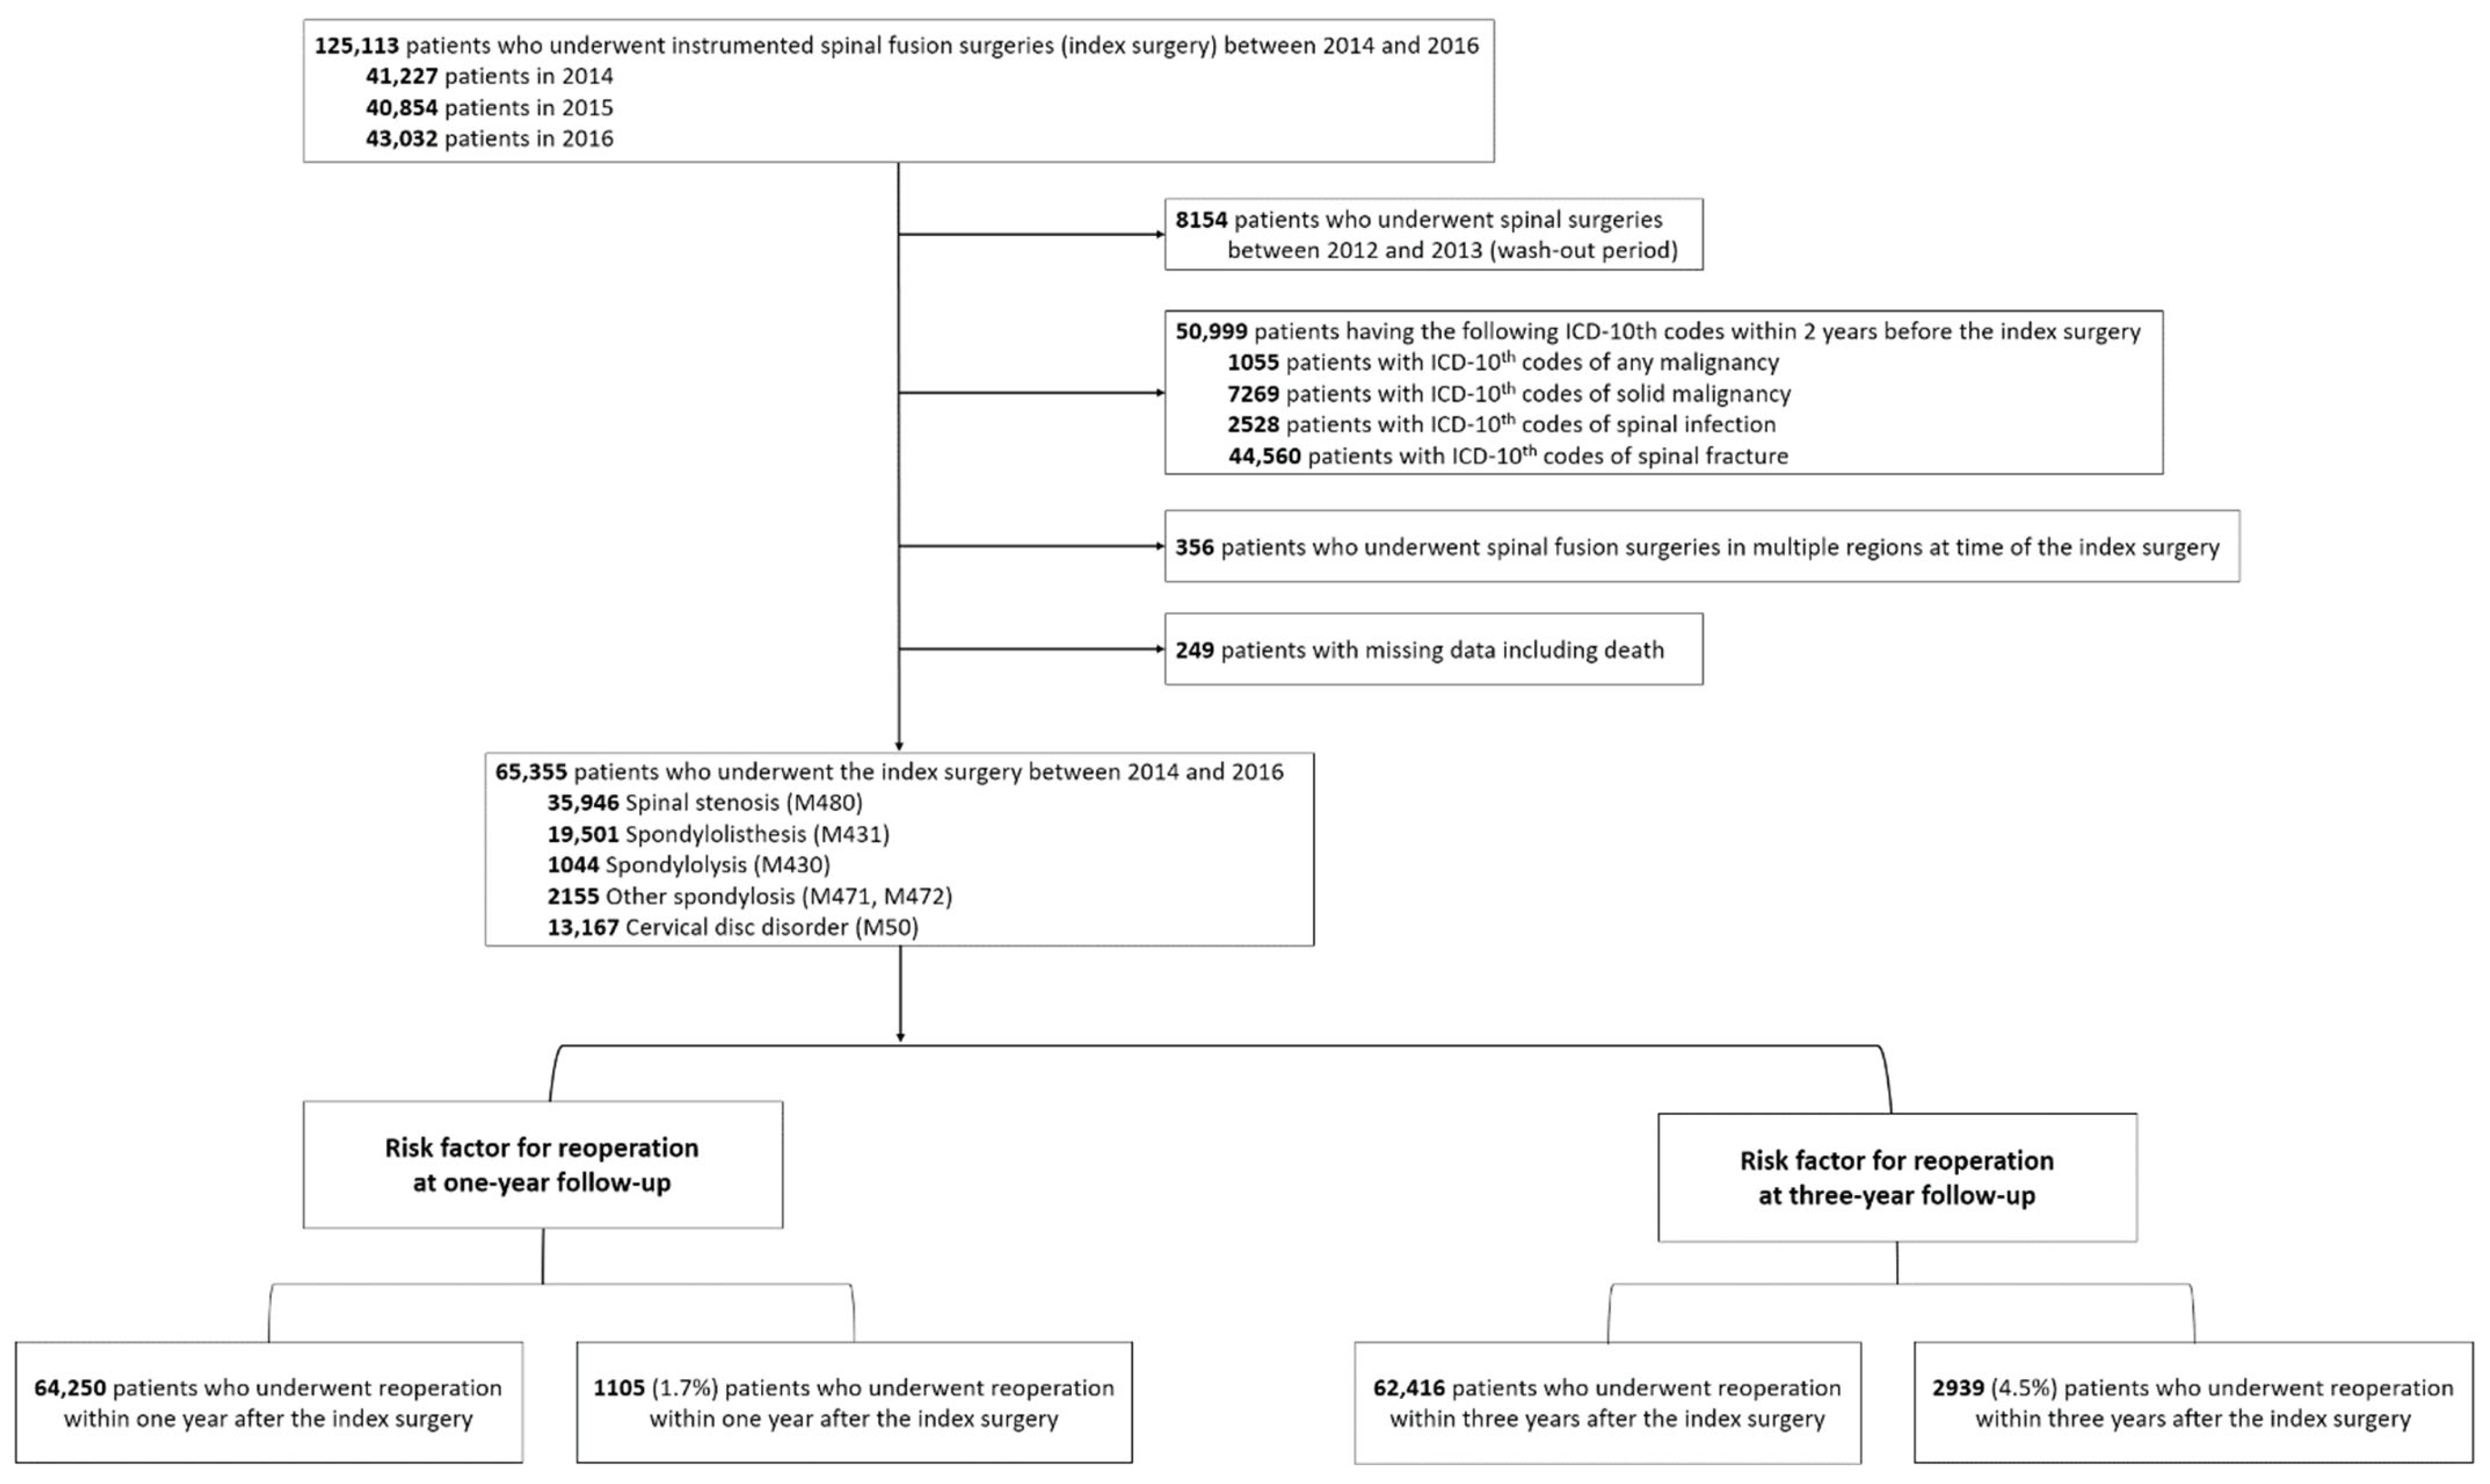
2.2. Study Patients
2.3. Definitions of Reoperation
2.4. Covariates
2.5. Statistical Analysis
3. Results
3.1. Annual Reoperation Rates according to the Spinal Regions
3.2. Annual Reoperation Rates according to Patients’ Characteristics
3.3. Annual Reoperation Rates according to Comorbidities
3.4. Annual Reoperation Rates according to the Surgical Procedures
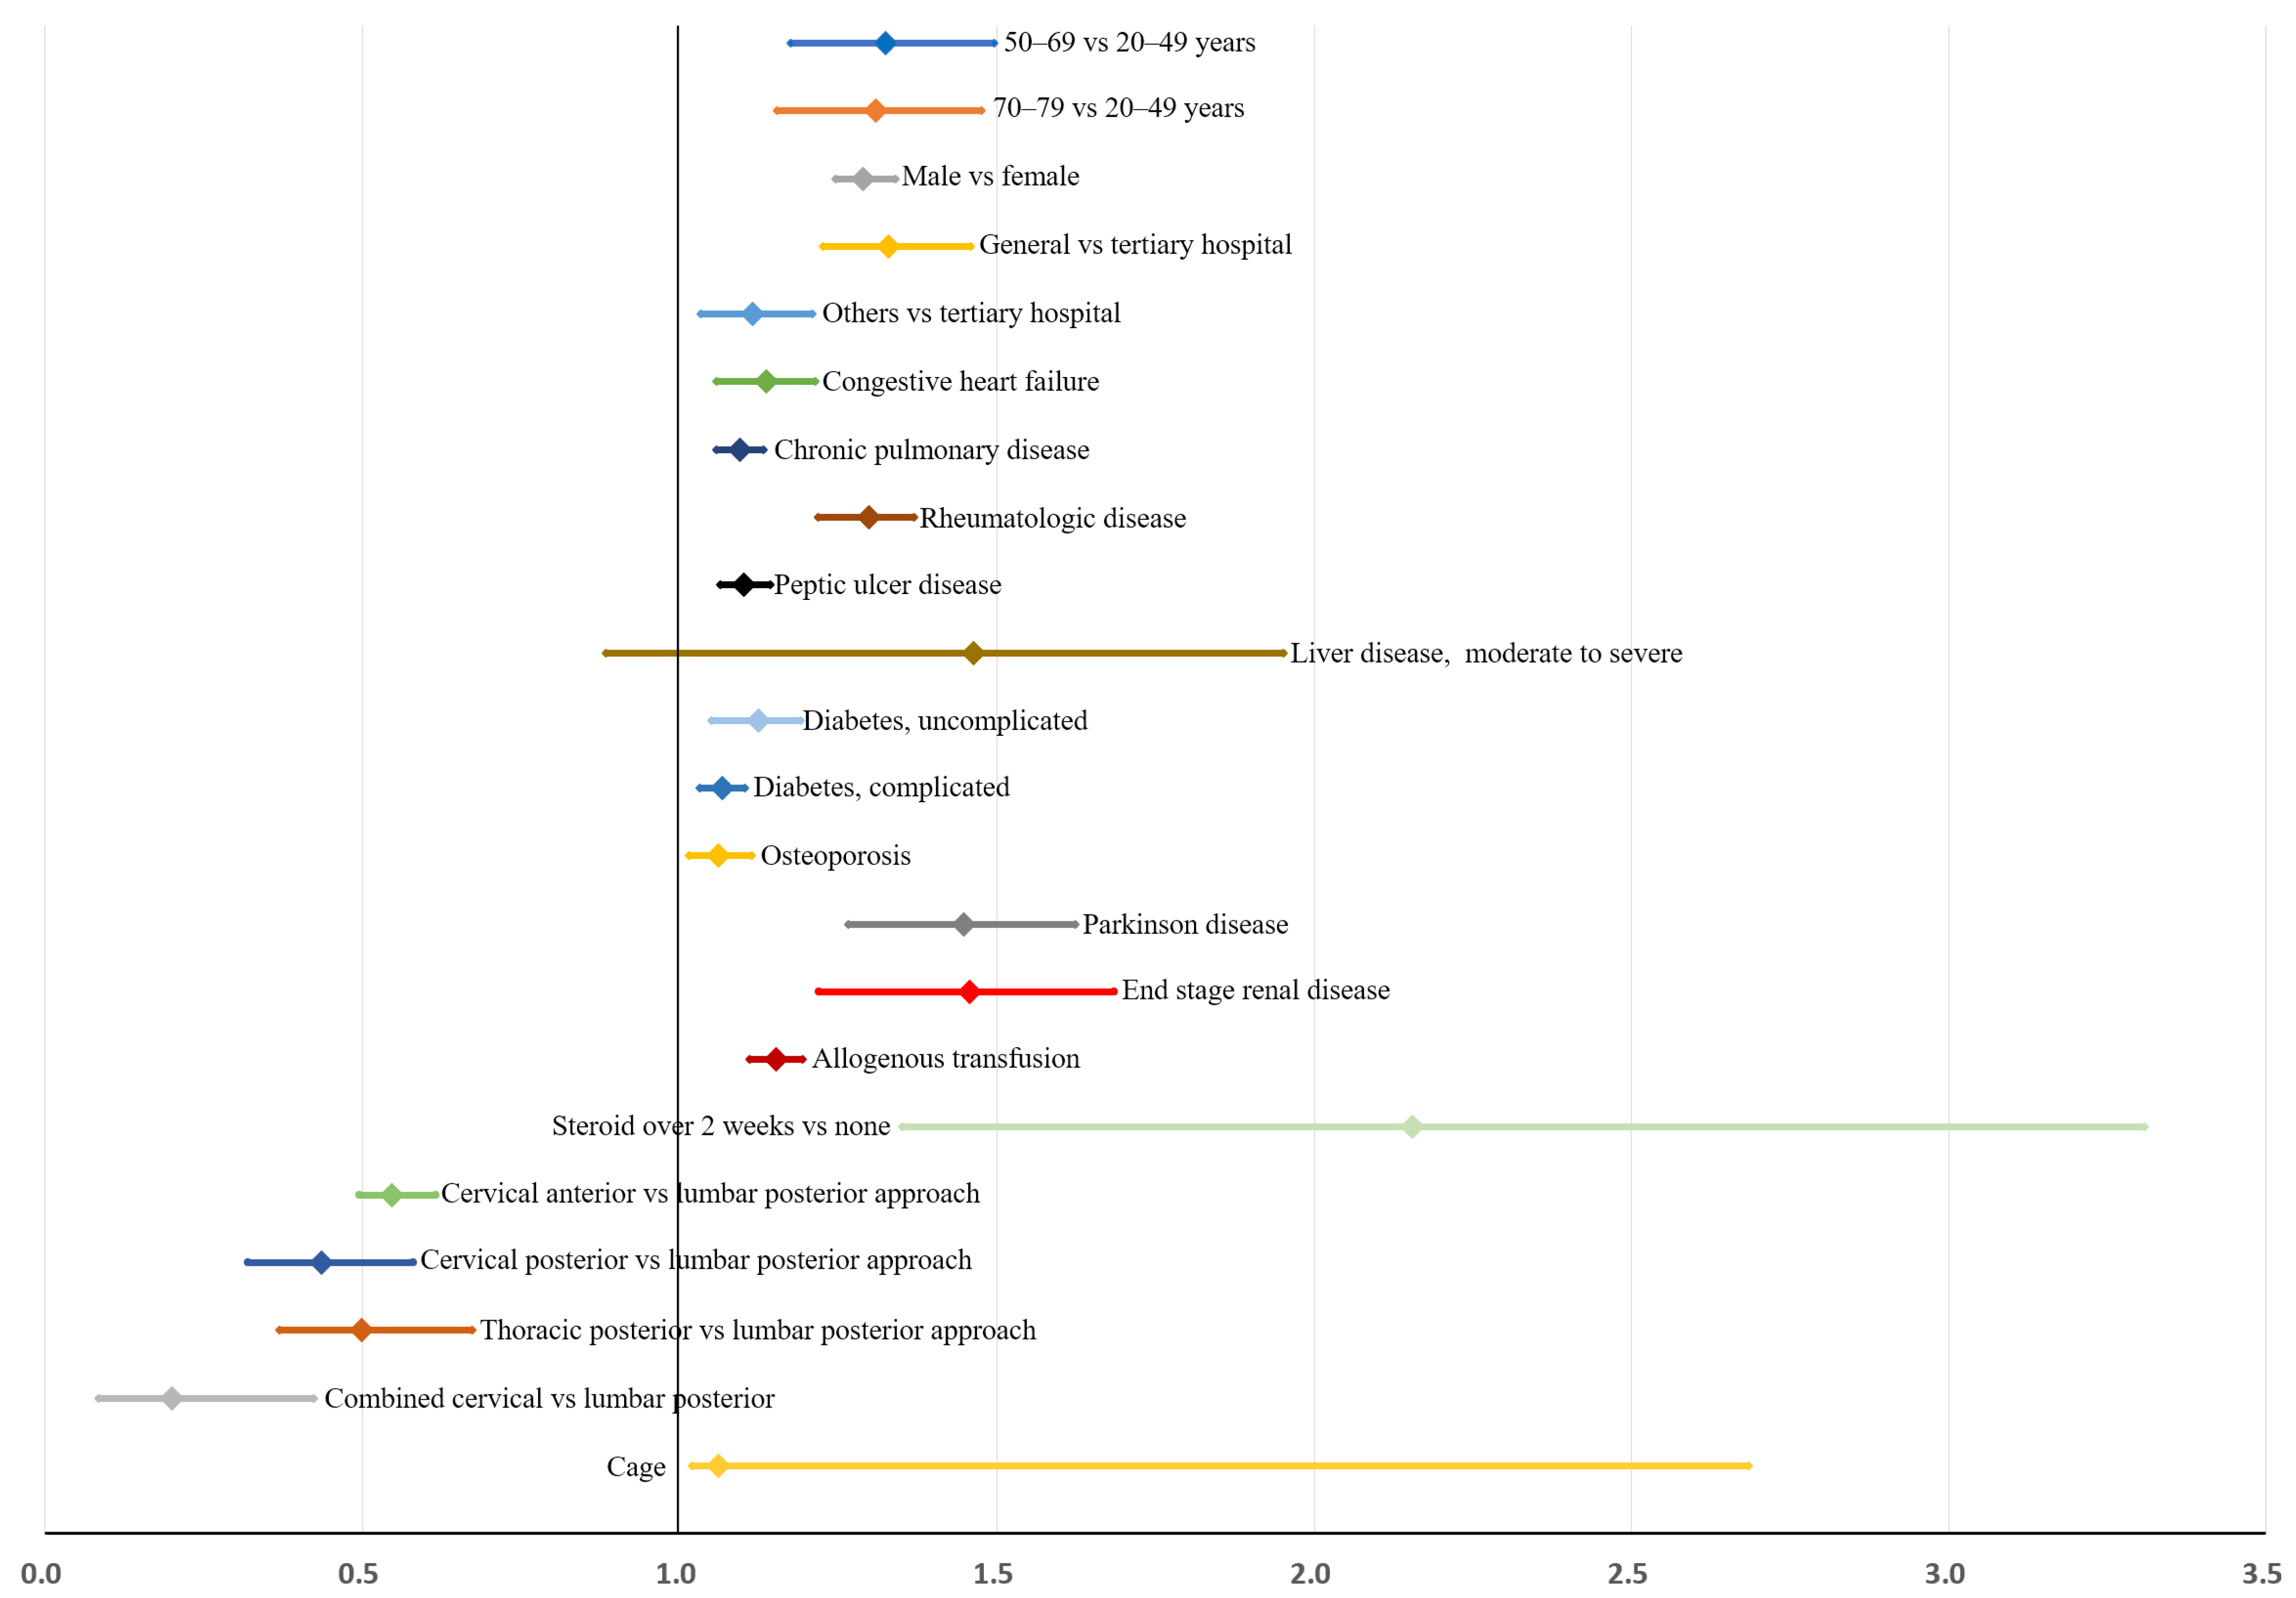
3.5. Risk Factors for Early Reoperation within 3 Years after Instrumented Spinal Fusion Surgeries: Multivariable Analysis
3.6. Validation of the Prediction Model
3.6.1. Bootstrap Validation
3.6.2. Sensitivity Analysis and Bland-Altman Test for Interaction
4. Discussion
Supplementary Materials
Author Contributions
Funding
Institutional Review Board Statement
Informed Consent Statement
Data Availability Statement
Conflicts of Interest
References
- Eichholz, K.M.; Ryken, T.C. Complications of revision spinal surgery. Neurosurg. Focus FOC 2003, 15, 1–4. [Google Scholar] [CrossRef] [PubMed]
- Kalakoti, P.; Missios, S.; Maiti, T.; Konar, S.; Bir, S.; Bollam, P.; Nanda, A. Inpatient Outcomes and Postoperative Complications After Primary Versus Revision Lumbar Spinal Fusion Surgeries for Degenerative Lumbar Disc Disease: A National (Nationwide) Inpatient Sample Analysis, 2002–2011. World Neurosurg. 2016, 85, 114–124. [Google Scholar] [CrossRef] [PubMed]
- Papavero, L.; Lepori, P.; Schmeiser, G. Revision surgery in cervical spine. Eur. Spine J. 2020, 29, 47–56. [Google Scholar] [CrossRef] [PubMed]
- Kobayashi, K.; Ando, K.; Kato, F.; Kanemura, T.; Sato, K.; Hachiya, Y.; Imagama, S. Reoperation within 2 years after lumbar interbody fusion: A multicenter study. Eur. Spine J. 2018, 27, 1972–1980. [Google Scholar] [CrossRef] [PubMed]
- Bari, T.J.; Karstensen, S.; Sørensen, M.D.; Gehrchen, M.; Street, J.; Dahl, B. Revision surgery and mortality following complex spine surgery: 2-year follow-up in a prospective cohort of 679 patients using the Spine AdVerse Event Severity (SAVES) system. Spine Deform. 2020, 8, 1341–1351. [Google Scholar] [CrossRef] [PubMed]
- Shousha, M.; Alhashash, M.; Allouch, H.; Boehm, H. Reoperation rate after anterior cervical discectomy and fusion using standalone cages in degenerative disease: A study of 2078 cases. Spine J. 2019, 19, 2007–2012. [Google Scholar] [CrossRef] [PubMed]
- Kim, C.H.; Chung, C.K.; Choi, Y.; Kim, M.J.; Yim, D.; Yang, S.H.; Park, S.B. The Long-term Reoperation Rate Following Surgery for Lumbar Herniated Intervertebral Disc Disease: A Nationwide Sample Cohort Study With a 10-year Follow-up. Spine 2019, 44, 1382–1389. [Google Scholar] [CrossRef] [PubMed]
- Irmola, T.M.; Häkkinen, A.; Järvenpää, S.; Marttinen, I.; Vihtonen, K.; Neva, M. Reoperation Rates Following Instrumented Lumbar Spine Fusion. Spine 2018, 43, 295–301. [Google Scholar] [CrossRef] [PubMed]
- Leven, D.; Passias, P.G.; Errico, T.J.; Lafage, V.; Bianco, K.; Lee, A.; Gerling, M.C. Risk Factors for Reoperation in Patients Treated Surgically for Intervertebral Disc Herniation: A Subanalysis of Eight-Year SPORT Data. J. Bone Jt. Surg. Am. 2015, 97, 1316–1325. [Google Scholar] [CrossRef] [PubMed] [Green Version]
- Noh, S.H.; Cho, P.G.; Kim, K.N.; Lee, B.; Lee, J.K.; Kim, S.H. Risk factors for reoperation after lumbar spine surgery in a 10-year Korean national health insurance service health examinee cohort. Sci. Rep. 2022, 12, 4606. [Google Scholar] [CrossRef] [PubMed]
- Sato, S.; Yagi, M.; Machida, M.; Yasuda, A.; Konomi, T.; Miyake, A.; Asazuma, T. Reoperation rate and risk factors of elective spinal surgery for degenerative spondylolisthesis: Minimum 5-year follow-up. Spine J. 2015, 15, 1536–1544. [Google Scholar] [CrossRef] [PubMed]
- Jung, J.-M.; Chung, C.K.; Kim, C.H.; Choi, Y.; Kim, M.J.; Yim, D.; Park, S.B. The Long-term Reoperation Rate Following Surgery for Lumbar Stenosis: A Nationwide Sample Cohort Study With a 10-year Follow-up. Spine 2020, 45, 1277–1284. [Google Scholar] [CrossRef] [PubMed]
- Derman, P.B.; Lampe, L.P.; Hughes, A.P.; Pan, T.J.; Kueper, J.; Girardi, F.P.; Lyman, S. Demographic, Clinical, and Operative Factors Affecting Long-Term Revision Rates After Cervical Spine Arthrodesis. JBJS 2016, 98, 1533–1540. [Google Scholar] [CrossRef] [PubMed] [Green Version]
- Yun, Y.I.; Jeon, I.; Kim, S.W.; Yu, D. Risk factors for adjacent segment disease requiring reoperation after posterior lumbar interbody fusion with screw fixation: Focus on paraspinal muscle, facet joint, and disc degeneration. Acta Neurochir. 2022, 164, 913–922. [Google Scholar] [CrossRef] [PubMed]
- Aihara, T.; Kojima, A.; Urushibara, M.; Endo, K.; Sawaji, Y.; Suzuki, H.; Yamamoto, K. Long-term reoperation rates and causes for reoperations following lumbar microendoscopic discectomy and decompression: 10-year follow-up. J. Clin. Neurosci. 2022, 95, 123–128. [Google Scholar] [CrossRef]
- Thygesen, S.K.; Christiansen, C.F.; Christensen, S.; Lashm, T.L.; Sørensen, H.T. The predictive value of ICD-10 diagnostic coding used to assess Charlson comorbidity index conditions in the population-based Danish National Registry of Patients. BMC Med. Res. Methodol. 2011, 11, 83. [Google Scholar] [CrossRef] [PubMed] [Green Version]
- Weir, R.E., Jr.; Lyttle, C.S.; Meltzer, D.O.; Dong, T.S.; Ruhnke, G.W. The Relative Ability of Comorbidity Ascertainment Methodologies to Predict In-Hospital Mortality Among Hospitalized Community-acquired Pneumonia Patients. Med. Care 2018, 56, 950–955. [Google Scholar] [CrossRef] [PubMed]
- Daniel, K. Thinking, Fast and Slow; Farrar, Straus and Giroux: New York, NY, USA, 2017. [Google Scholar]


| Index Regions | All Cases (%) | Reoperation Cases at 1-Year Follow-Up (n) | Reoperation Cases at 2-Year Follow-Up (n) | Reoperation Cases at 3-Year Follow-Up (n) | Reoperation Rates at the 1st Year | Reoperation Rates at the 2nd Year | Reoperation Rates at the 3rd Year |
|---|---|---|---|---|---|---|---|
| Cervical spine | 16,962 (26) | 210 | 340 | 459 | 1.2 [1.1–1.4] | 2.0 [1.8–2.2] | 2.7 [2.5–3.0] |
| Thoracic spine | 1186 (2) | 15 | 29 | 38 | 1.3 [0.6–1.9] | 2.4 [1.6–3.3] | 3.2 [2.2–4.2] |
| Lumbar spine | 47,207 (72) | 880 | 1637 | 2442 | 1.9 [1.7–2.0] | 3.5 [3.3–3.6] | 5.2 [5.0–5.4] |
| All regions | 65,355 | 1105 | 2006 | 2939 | 1.7 [1.6–1.8] | 3.1 [2.9–3.2] | 4.5 [4.3–4.7] |
| Variables | Categories | All | Patients with Reoperation within 1 Year after the Index Surgery | Patients with Reoperation within 2 Years after the Index Surgery | Patients with Reoperation within 3 Years after the Index Surgery | Odds Ratios for Reoperation within 3 Years after the Index Surgery | |
|---|---|---|---|---|---|---|---|
| Number of patients | 65,355 | 1105 (1.7) | 2006 (3.1) | 2939 (4.5) | |||
| Age | Mean ± SD | 61.4 ± 11.5 | 64.0 ± 11.0 | 63.8 ± 10.5 | 63.5 ± 10.4 | 1.02 (1.01–1.02) | <0.001 |
| 20–49 | 10,011 | 109 (1.1) | 187 (1.9) | 278 (2.8) | Reference | ||
| 50–69 | 37,446 | 612 (1.6) | 1157 (3.1) | 1733 (4.6) | 1.70 (1.49–1.93) | <0.001 | |
| 70–79 | 16,058 | 344 (2.1) | 602 (3.7) | 849 (5.3) | 1.95 (1.70–2.24) | <0.001 | |
| 80+ | 1840 | 40 (2.2) | 60 (3.3) | 79 (4.3) | 1.57 (1.22–2.03) | 0.001 | |
| Sex | Male | 29,606 | 608 (2.1) | 1084 (3.7) | 1511 (5.1) | 1.29 (1.20–1.39) | <0.001 |
| Female | 35,749 | 497 (1.4) | 922 (2.6) | 1428 (4.0) | Reference | ||
| Region | Urban | 55,112 | 917 (1.7) | 1634 (3.0) | 2412 (4.4) | Reference | |
| Rural | 10,243 | 188 (1.8) | 372 (3.6) | 527 (5.1) | 1.19 (1.08–1.31) | 0.001 | |
| Hospital | Tertiary | 17,767 | 258 (1.5) | 463 (2.6) | 680 (3.8) | Reference | |
| General | 17,166 | 381 (2.2) | 666 (3.9) | 942 (5.5) | 1.50 (1.32–1.61) | <0.001 | |
| Others | 30,422 | 466 (1.5) | 877 (2.9) | 1317 (4.3) | 1.14 (1.03–1.25) | 0.008 | |
| Transfusion | Autologous transfusion | 313 | 7 (2.2) | 10 (3.2) | 18 (5.8) | 1.30 (0.81–2.09) | 0.285 |
| Allogenous transfusion | 26,142 | 570 (2.2) | 1015 (3.9) | 1487 (5.7) | 1.57 (1.46–1.69) | <0.001 | |
| Systemic steroid | None | 46,894 | 714 (1.5) | 1345 (2.9) | 1978 (4.2) | Reference | |
| within 2 weeks | 17,977 | 386 (2.1) | 648 (3.6) | 944 (5.3) | 1.26 (1.16–1.36) | <0.001 | |
| Over 2 weeks | 214 | 5 (2.3) | 13 (6.1) | 17 (7.9) | 1.96 (1.19–3.22) | <0.001 | |
| Variables | Categories | All | Patients with Reoperation within 1 Year after the Index Surgery | Patients with Reoperation within 2 Years after the Index Surgery | Patients with Reoperation within 3 Years after the Index Surgery | Odds Ratios for Reoperation within 3 Years after the Index Surgery | |
|---|---|---|---|---|---|---|---|
| Number of patients | 65,355 | 1105 (1.7) | 2006 (3.1) | 2939 (4.5) | |||
| Charlson comorbidity index score | Mean ± SD | 1.63 ± 1.82 | 2.04 ± 2.02 | 2.03 ± 2.02 | 2.05 ± 2.00 | 1.13 (1.01–1.15) | <0.001 |
| 0–2 | 45,727 | 690 (1.5) | 1258 (2.8) | 1817 (4.0) | Reference | ||
| 3–5 | 17,292 | 349 (2.0) | 629 (3.6) | 949 (5.5) | 1.40 (1.30–1.52) | <0.001 | |
| ≥6 | 2336 | 66 (2.8) | 119 (5.1) | 173 (7.4) | 1.93 (1.64–2.27) | <0.001 | |
| Comorbidities | Myocardial infarction | 577 | 15 (2.6) | 24 (4.2) | 34 (5.9) | 1.33 (0.94–1.89) | 0.105 |
| Congestive heart failure | 2134 | 62 (2.9) | 100 (4.7) | 142 (6.7) | 1.54 (1.29–1.93) | <0.001 | |
| Peripheral vascular disease | 6712 | 131 (2.0) | 240 (3.6) | 351 (5.2) | 1.20 (1.07–1.34) | 0.002 | |
| Cerebrovascular disease | 6083 | 122 (2.0) | 223 (3.7) | 333 (5.5) | 1.26 (1.12–1.42) | <0.001 | |
| Dementia | 554 | 7 (1.3) | 14 (2.5) | 25 (4.5) | 1.00 (0.67–1.50) | 0.986 | |
| Chronic pulmonary disease | 15,003 | 284 (1.9) | 531 (3.5) | 820 (5.5) | 1.32 (1.21–1.43) | <0.001 | |
| Rheumatologic disease | 3235 | 74 (2.3) | 162 (5.0) | 243 (7.5) | 1.79 (1.56–2.05) | <0.001 | |
| Peptic ulcer disease | 11,878 | 249 (2.1) | 447 (3.8) | 660 (5.6) | 1.32 (1.21–1.44) | <0.001 | |
| Liver disease | |||||||
| Mild | 4151 | 81 (2.0) | 156 (3.8) | 220 (5.3) | 1.20 (1.05–1.39) | 0.010 | |
| Moderate to severe | 61 | 1 (1.6) | 3 (4.9) | 7 (11.5) | 2.76 (1.25–6.06) | 0.012 | |
| Diabetes | |||||||
| Uncomplicated | 14,001 | 309 (2.2) | 553 (3.9) | 774 (5.5) | 1.33 (1.23–1.45) | <0.001 | |
| Complicated | 4375 | 124 (2.8) | 207 (4.7) | 285 (6.5) | 1.53 (1.35–1.74) | <0.001 | |
| Hemiplegia or paraplegia | 654 | 11 (1.7) | 23 (3.5) | 27 (4.1) | 0.91 (0.62–1.35) | 0.648 | |
| Renal disease | 1216 | 49 (4.0) | 63 (5.2) | 84 (6.9) | 1.59 (1.27–1.99) | <0.001 | |
| Osteoporosis | 10,026 | 166 (1.7) | 324 (3.2) | 502 (5.0) | 1.14 (1.04–1.26) | 0.007 | |
| Parkinson disease | 529 | 20 (3.8) | 40 (7.6) | 51 (9.6) | 2.29 (1.71–3.06) | <0.001 | |
| End stage renal disease | 272 | 18 (6.6) | 23 (8.5) | 30 (11.0) | 2.65 (1.81–3.88) | <0.001 | |
| Variables | Cases (%) | Interval * | Reoperation Rates at 1st Year (%) | Reoperation Rates at 2nd Year (%) | Reoperation Rates at 3rd Year (%) | Annual Reoperation Rates and 95% Confidence Intervals | ||||||||
|---|---|---|---|---|---|---|---|---|---|---|---|---|---|---|
| Overall | Revisional Fusion | Revisional Decompression | Overall | Revisional Fusion | Revisional Decompression | Overall | Revisional Fusion | Revisional Decompression | 1st Year | 2nd Year | 3rd Year | |||
| All | 65,355 | 520 (232, 800) | 1105 (1.7) | 752 (1.1) | 353 (0.5) | 2006 (3.1) | 1332 (2.0) | 674 (1.0) | 2939 (4.5) | 1882 (2.9) | 1059 (1.6) | 1.7 [1.6–1.8] | 3.1 [2.9–3.2] | 4.5 [4.3–4.7] |
| Cervical | ||||||||||||||
| Anterior | 15,391 (23.5) | 418 (173, 745) | 193 (1.2) | 126 (0.8) | 67 (0.4) | 310 (1.9) | 205 (1.3) | 105 (0.7) | 419 (2.6) | 273 (1.7) | 146 (0.9) | 1.2 [1.1–1.4] | 1.9 [1.8–2.2] | 2.6 [2.5–3.0] |
| Posterior | 1202 (1.8) | 476 (126, 742) | 13 (1.1) | 11 (0.9) | 2 (0.2) | 25 (2.1) | 22 (1.8) | 3 (0.2) | 34 (2.8) | 29 (2.4) | 5 (0.4) | 1.1 [0.5–1.7] | 2.1 [1.3–2.9] | 2.8 [1.9–3.8] |
| Thoracic | ||||||||||||||
| Anterior | 34 (0.05) | 63 (54, 79) | 3 (8.8) | 1 (2.9) | 2 (5.9) | 3 (8.8) | 1 (2.9) | 2 (5.9) | 3 (8.8) | 1 (2.9) | 2 (5.9) | - | - | 8.8 [0–18.4] |
| Posterior | 1125 (1.7) | 462 (307, 718) | 12 (1.1) | 11(1.0) | 1 (0.1) | 26 (2.3) | 22 (2.0) | 4 (0.4) | 34 (3.0) | 29 (2.6) | 5 (0.4) | 1.1 [0.5–1.7] | 2.3 [1.4–3.2] | 3.0 [2.0–4.0] |
| Lumbar | ||||||||||||||
| Anterior | 1058 (1.6) | 527 (94, 777) | 24 (2.3) | 17 (1.6) | 7 (0.7) | 37 (3.5) | 27 (2.6) | 10 (0.9) | 53 (5.0) | 34 (3.2) | 19 (1.8) | 2.3 [1.4–3.2] | 3.5 [2.4–4.6] | 5.0 [3.7–6.3] |
| Posterior | 41,259 (63.1) | 540 (245, 818) | 773 (1.9) | 549 (1.3) | 224 (0.5) | 1426 (3.5) | 989 (2.4) | 437 (1.1) | 2132 (5.2) | 1418 (3.4) | 714 (1.7) | 1.9 [1.7–2.0] | 3.5 [3.3–3.6] | 5.2 [5.0–5.4] |
| Combined approach # | ||||||||||||||
| Cervical | 369 (0.6) | 160 (57, 671) | 4 (1.1) | 3 (0.8) | 1 (0.3) | 5 (1.4) | 4 (1.1) | 1 (0.3) | 6 (1.6) | 5 (1.4) | 1 (0.3) | 1.1 [0–2.1] | 1.4 [0.2–2.5] | 1.6 [0.3–2.9] |
| Thoracic | 27 (0.04) | 777 (single case) | 0 | 0 | 0 | 0 | 0 | 0 | 1 (3.7) | 1 (3.7) | 0 (0) | - | - | 3.7 [0–10.8] |
| Lumbar | 4890 (7.5) | 557 (289, 800) | 83 (1.7) | 34 (0.7) | 49 (1.0) | 174 (3.6) | 62 (1.3) | 112 (2.3) | 257 (5.3) | 92 (1.9) | 167 (3.4) | 1.7 [1.3–2.1] | 3.6 [3.0–4.1] | 5.3 [4.6–5.9] |
| Cage | 30,977 (47.4) | 560 (258, 826) | 530 (1.7) | 364 (1.2) | 166 (0.5) | 1011 (3.3) | 686 (2.2) | 325 (1.0) | 1531 (4.9) | 996 (3.2) | 535(1.7) | 1.7 [1.6–1.9] | 3.3 [3.1–3.5] | 4.9 [4.7–5.2] |
| Variables | Categories | Model 1 | Model 2 (Backward) | Model 3 (Bootstrap Adjusted) | Bias (%) | ||
|---|---|---|---|---|---|---|---|
| Adjusted Odds Ratio (95% Confidence Interval) | p-Value | Adjusted Odds Ratio (95% Confidence Interval) | p-Value | Adjusted Odds Ratio (95% Confidence Interval) | |||
| Age | 50–69 vs. 20–49 years | 1.30 (1.14–1.50) | <0.001 | 1.32 (1.15–1.51) | <0.001 | 1.32 (1.18–1.50) | −0.3% |
| 70–79 vs. 20–49 years | 1.28 (1.10–1.49) | 0.002 | 1.30 (1.12–1.51) | 0.001 | 1.31 (1.15–1.48) | −2.3% | |
| 80+ vs. 20–49 years | 1.01 (0.77–1.31) | 0.963 | |||||
| Sex | Male vs. female | 1.66 (1.53–1.80) | <0.001 | 1.66 (1.53–1.80) | <0.001 | 1.29 (1.25–1.34) | 22.3% |
| Region | Rural vs. urban | 1.10 (1.00–1.21) | 0.065 | ||||
| Hospital | General vs. tertiary | 1.31 (1.18–1.46) | <0.001 | 1.33 (1.20–1.48) | <0.001 | 1.33 (1.23–1.46) | 0.1% |
| Others vs. tertiary | 1.12 (1.01–1.23) | 0.028 | 1.12 (1.02–1.23) | 0.023 | 1.12 (1.03–1.46) | 3.4% | |
| Charlson comorbidity index score | 3–5 vs. 0–2 | 1.04 (0.85–1.27) | 0.700 | ||||
| ≥6 vs. 0–2 | 0.92 (0.64–1.33) | 0.646 | |||||
| Comorbidities | Congestive heart failure | 1.30 (1.08–1.56) | 0.005 | 1.29 (1.08–1.54) | 0.005 | 1.14 (1.06–1.21) | 49.8% |
| Peripheral vascular disease | 1.04 (0.92–1.17) | 0.538 | |||||
| Cerebrovascular disease | 1.10 (0.97–1.24) | 0.154 | |||||
| Chronic pulmonary disease | 1.63 (0.88–3.02) | 0.123 | 1.20 (1.10–1.30) | <0.001 | 1.10 (1.06–1.13) | 50.2% | |
| Rheumatologic disease | 1.70 (1.48–1.97) | <0.001 | 1.69 (1.47–1.94) | <0.001 | 1.30 (1.22–1.37) | 50.1% | |
| Peptic ulcer disease | 1.21 (1.10–1.33) | <0.001 | 1.21 (1.10–1.33) | <0.001 | 1.10 (1.06–1.14) | 49.2% | |
| Liver disease, mild | 1.10 (0.95–1.28) | 0.199 | |||||
| Liver disease, moderate to severe | 2.40 (1.06–5.42) | 0.035 | 2.41 (1.09–5.34) | 0.031 | 1.46 (0.88–1.95) | 56.8% | |
| Diabetes, uncomplicated | 1.14 (1.04–1.26) | 0.006 | 1.14 (1.05–1.26) | 0.004 | 1.12 (1.05–1.19) | 11.1% | |
| Diabetes, complicated | 1.27 (1.06–1.53) | 0.010 | 1.26 (1.10–1.44) | <0.001 | 1.07 (1.03–1.10) | 71.6% | |
| Renal disease | 1.00 (0.74–1.35) | 0.983 | |||||
| Osteoporosis | 1.12 (1.01–1.25) | 0.038 | 1.12 (1.01–1.25) | 0.034 | 1.06 (1.01–1.11) | 5.2% | |
| Parkinson disease | 2.07 (1.54–2.79) | <0.001 | 2.10 (1.56–2.82) | <0.001 | 1.45 (1.27–1.62) | 31.1% | |
| End stage renal disease | 2.19 (1.36–3.52) | 0.001 | 2.15 (1.45–3.17) | <0.001 | 1.46 (1.22–1.69) | 32.2% | |
| Allogenous transfusion | 1.32 (1.22–1.44) | <0.001 | 1.33 (1.23–1.45) | <0.001 | 1.15 (1.11–1.19) | 13.3% | |
| Systemic steroid | within 2 weeks vs. none | 1.30 (1.12–1.40) | 0.278 | ||||
| Over 2 weeks vs. none | 2.25 (1.33–3.81) | 0.011 | 2.25 (1.33–3.80) | 0.011 | 2.15 (1.35–3.31) | 4.2% | |
| Surgical approach | Cervical anterior vs. lumbar posterior | 0.55 (0.48–0.63) | <0.001 | 0.55 (0.48–0.63) | <0.001 | 0.55 (0.50–0.62) | 0.4% |
| Cervical posterior vs. lumbar posterior | 0.45 (0.32–0.64) | <0.001 | 0.45 (0.31–0.64) | <0.001 | 0.44 (0.32–0.58) | 3.3% | |
| Thoracic posterior vs. lumbar posterior | 0.51 (0.36–0.72) | <0.001 | 0.51 (0.36–0.72) | <0.001 | 0.50 (0.37–0.67) | 2.3% | |
| Combined cervical vs. lumbar posterior | 0.22 (0.10–0.50) | <0.001 | 0.22 (0.09–0.50) | <0.001 | 0.20 (0.08–0.42) | 9.0% | |
| Cage | 1.12 (1.02–1.23) | 0.021 | 1.13 (1.02–1.24) | 0.014 | 1.06 (1.02–2.69) | 6.1% | |
| Odds Ratios for Model 2 of 3rd-Year Reoperation | Odds Ratios for Model 2 of 1st-Year Reoperation | Bland–Altman Test for Interaction | ||||
|---|---|---|---|---|---|---|
| Age | 50–69 vs. 20–49 years | 1.32 (1.15–1.51) | <0.001 | 1.31 (1.06–1.63) | 0.014 | 0.953 |
| 70–79 vs. 20–49 years | 1.30 (1.12–1.51) | 0.001 | 1.54 (1.21–1.95) | <0.001 | 0.238 | |
| Sex | Male vs. female | 1.66 (1.53–1.80) | <0.001 | 1.79 (1.58–2.03) | <0.001 | 0.322 |
| Hospital | General vs. tertiary | 1.33 (1.20–1.48) | <0.001 | 1.39 (1.18–1.63) | <0.001 | 0.653 |
| Comorbidities | Congestive heart failure | 1.29 (1.08–1.54) | 0.005 | 1.46 (1.12–1.90) | 0.005 | 0.463 |
| Rheumatologic disease | 1.69 (1.47–1.94) | <0.001 | 1.35 (1.06–1.72) | 0.016 | 0.115 | |
| Peptic ulcer disease | 1.21 (1.10–1.33) | <0.001 | 1.24 (1.08–1.44) | 0.003 | 0.781 | |
| Diabetes, uncomplicated | 1.14 (1.05–1.26) | 0.004 | 1.20 (1.04–1.38) | 0.013 | 0.550 | |
| Diabetes, complicated | 1.26 (1.10–1.44) | <0.001 | 1.39 (1.13–1.70) | 0.002 | 0.431 | |
| Parkinson disease | 2.10 (1.56–2.82) | <0.001 | 2.03 (1.29–2.20) | 0.002 | 0.868 | |
| End stage renal disease | 2.15 (1.45–3.17) | <0.001 | 3.03 (1.85–4.98) | <0.001 | 0.287 | |
| Allogenous transfusion | 1.33 (1.23–1.45) | <0.001 | 1.47 (1.28–1.69) | <0.001 | 0.224 | |
| Systemic steroid | Over 2 weeks vs. none | 2.25 (1.33–3.80) | 0.011 | 1.43 (1.26–1.62) | <0.001 | 0.100 |
| Surgical approach | Cervical anterior vs. lumbar posterior | 0.55 (0.48–0.63) | <0.001 | 0.69 (0.56–0.86) | 0.001 | 0.080 |
| Cervical posterior vs. lumbar posterior | 0.45 (0.31–0.64) | <0.001 | 0.42 (0.24–0.74) | 0.003 | 0.840 | |
| Cage | 1.13 (1.02–1.24) | 0.014 | 1.27 (1.09–1.47) | 0.002 | 0.596 | |
Publisher’s Note: MDPI stays neutral with regard to jurisdictional claims in published maps and institutional affiliations. |
© 2022 by the authors. Licensee MDPI, Basel, Switzerland. This article is an open access article distributed under the terms and conditions of the Creative Commons Attribution (CC BY) license (https://creativecommons.org/licenses/by/4.0/).
Share and Cite
Kim, J.; Ryu, H.; Kim, T.-H. Early Reoperation Rates and Its Risk Factors after Instrumented Spinal Fusion Surgery for Degenerative Spinal Disease: A Nationwide Cohort Study of 65,355 Patients. J. Clin. Med. 2022, 11, 3338. https://doi.org/10.3390/jcm11123338
Kim J, Ryu H, Kim T-H. Early Reoperation Rates and Its Risk Factors after Instrumented Spinal Fusion Surgery for Degenerative Spinal Disease: A Nationwide Cohort Study of 65,355 Patients. Journal of Clinical Medicine. 2022; 11(12):3338. https://doi.org/10.3390/jcm11123338
Chicago/Turabian StyleKim, Jihye, Hwan Ryu, and Tae-Hwan Kim. 2022. "Early Reoperation Rates and Its Risk Factors after Instrumented Spinal Fusion Surgery for Degenerative Spinal Disease: A Nationwide Cohort Study of 65,355 Patients" Journal of Clinical Medicine 11, no. 12: 3338. https://doi.org/10.3390/jcm11123338
APA StyleKim, J., Ryu, H., & Kim, T.-H. (2022). Early Reoperation Rates and Its Risk Factors after Instrumented Spinal Fusion Surgery for Degenerative Spinal Disease: A Nationwide Cohort Study of 65,355 Patients. Journal of Clinical Medicine, 11(12), 3338. https://doi.org/10.3390/jcm11123338