
Heart Failure with Reduced Ejection Fraction and Prognostic Scales: The Impact of Exercise Modality in Cardiopulmonary Exercise Tests

 , , , and
Abstract
:1. Introduction
2. Materials and Methods
2.1. CPET
2.2. Spirometry
2.3. Statistical Analysis
3. Results
3.1. CPET
3.2. Effort Level
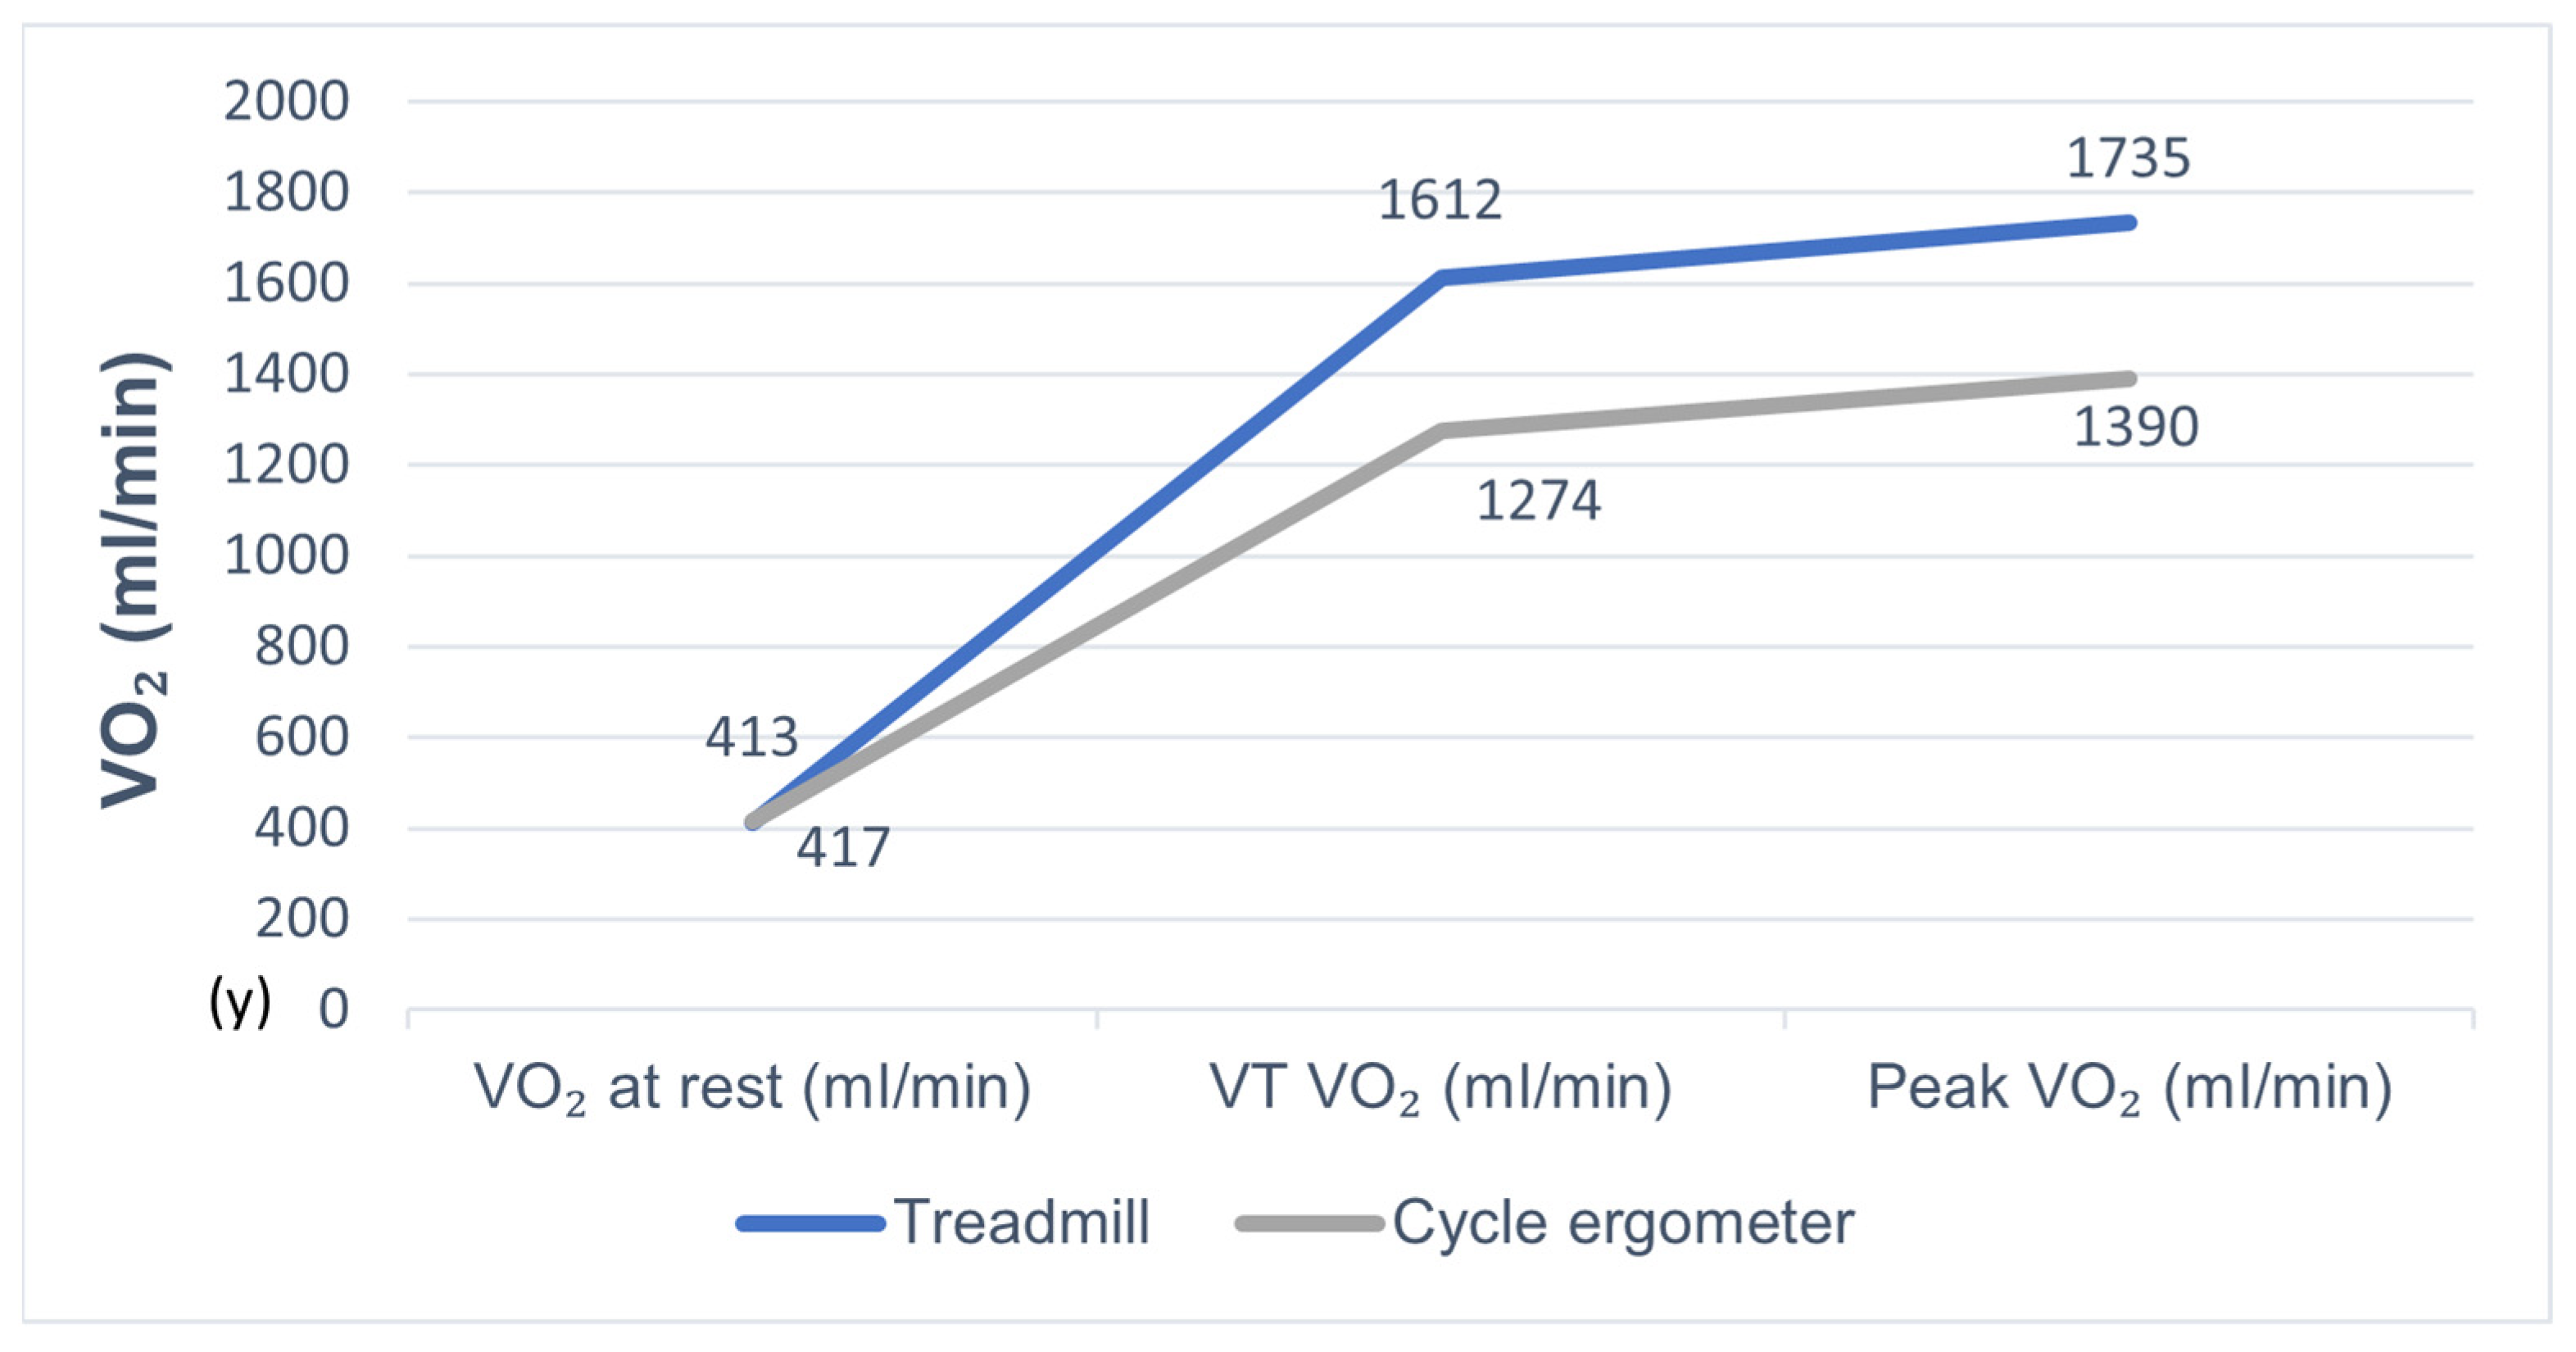
3.3. VO2
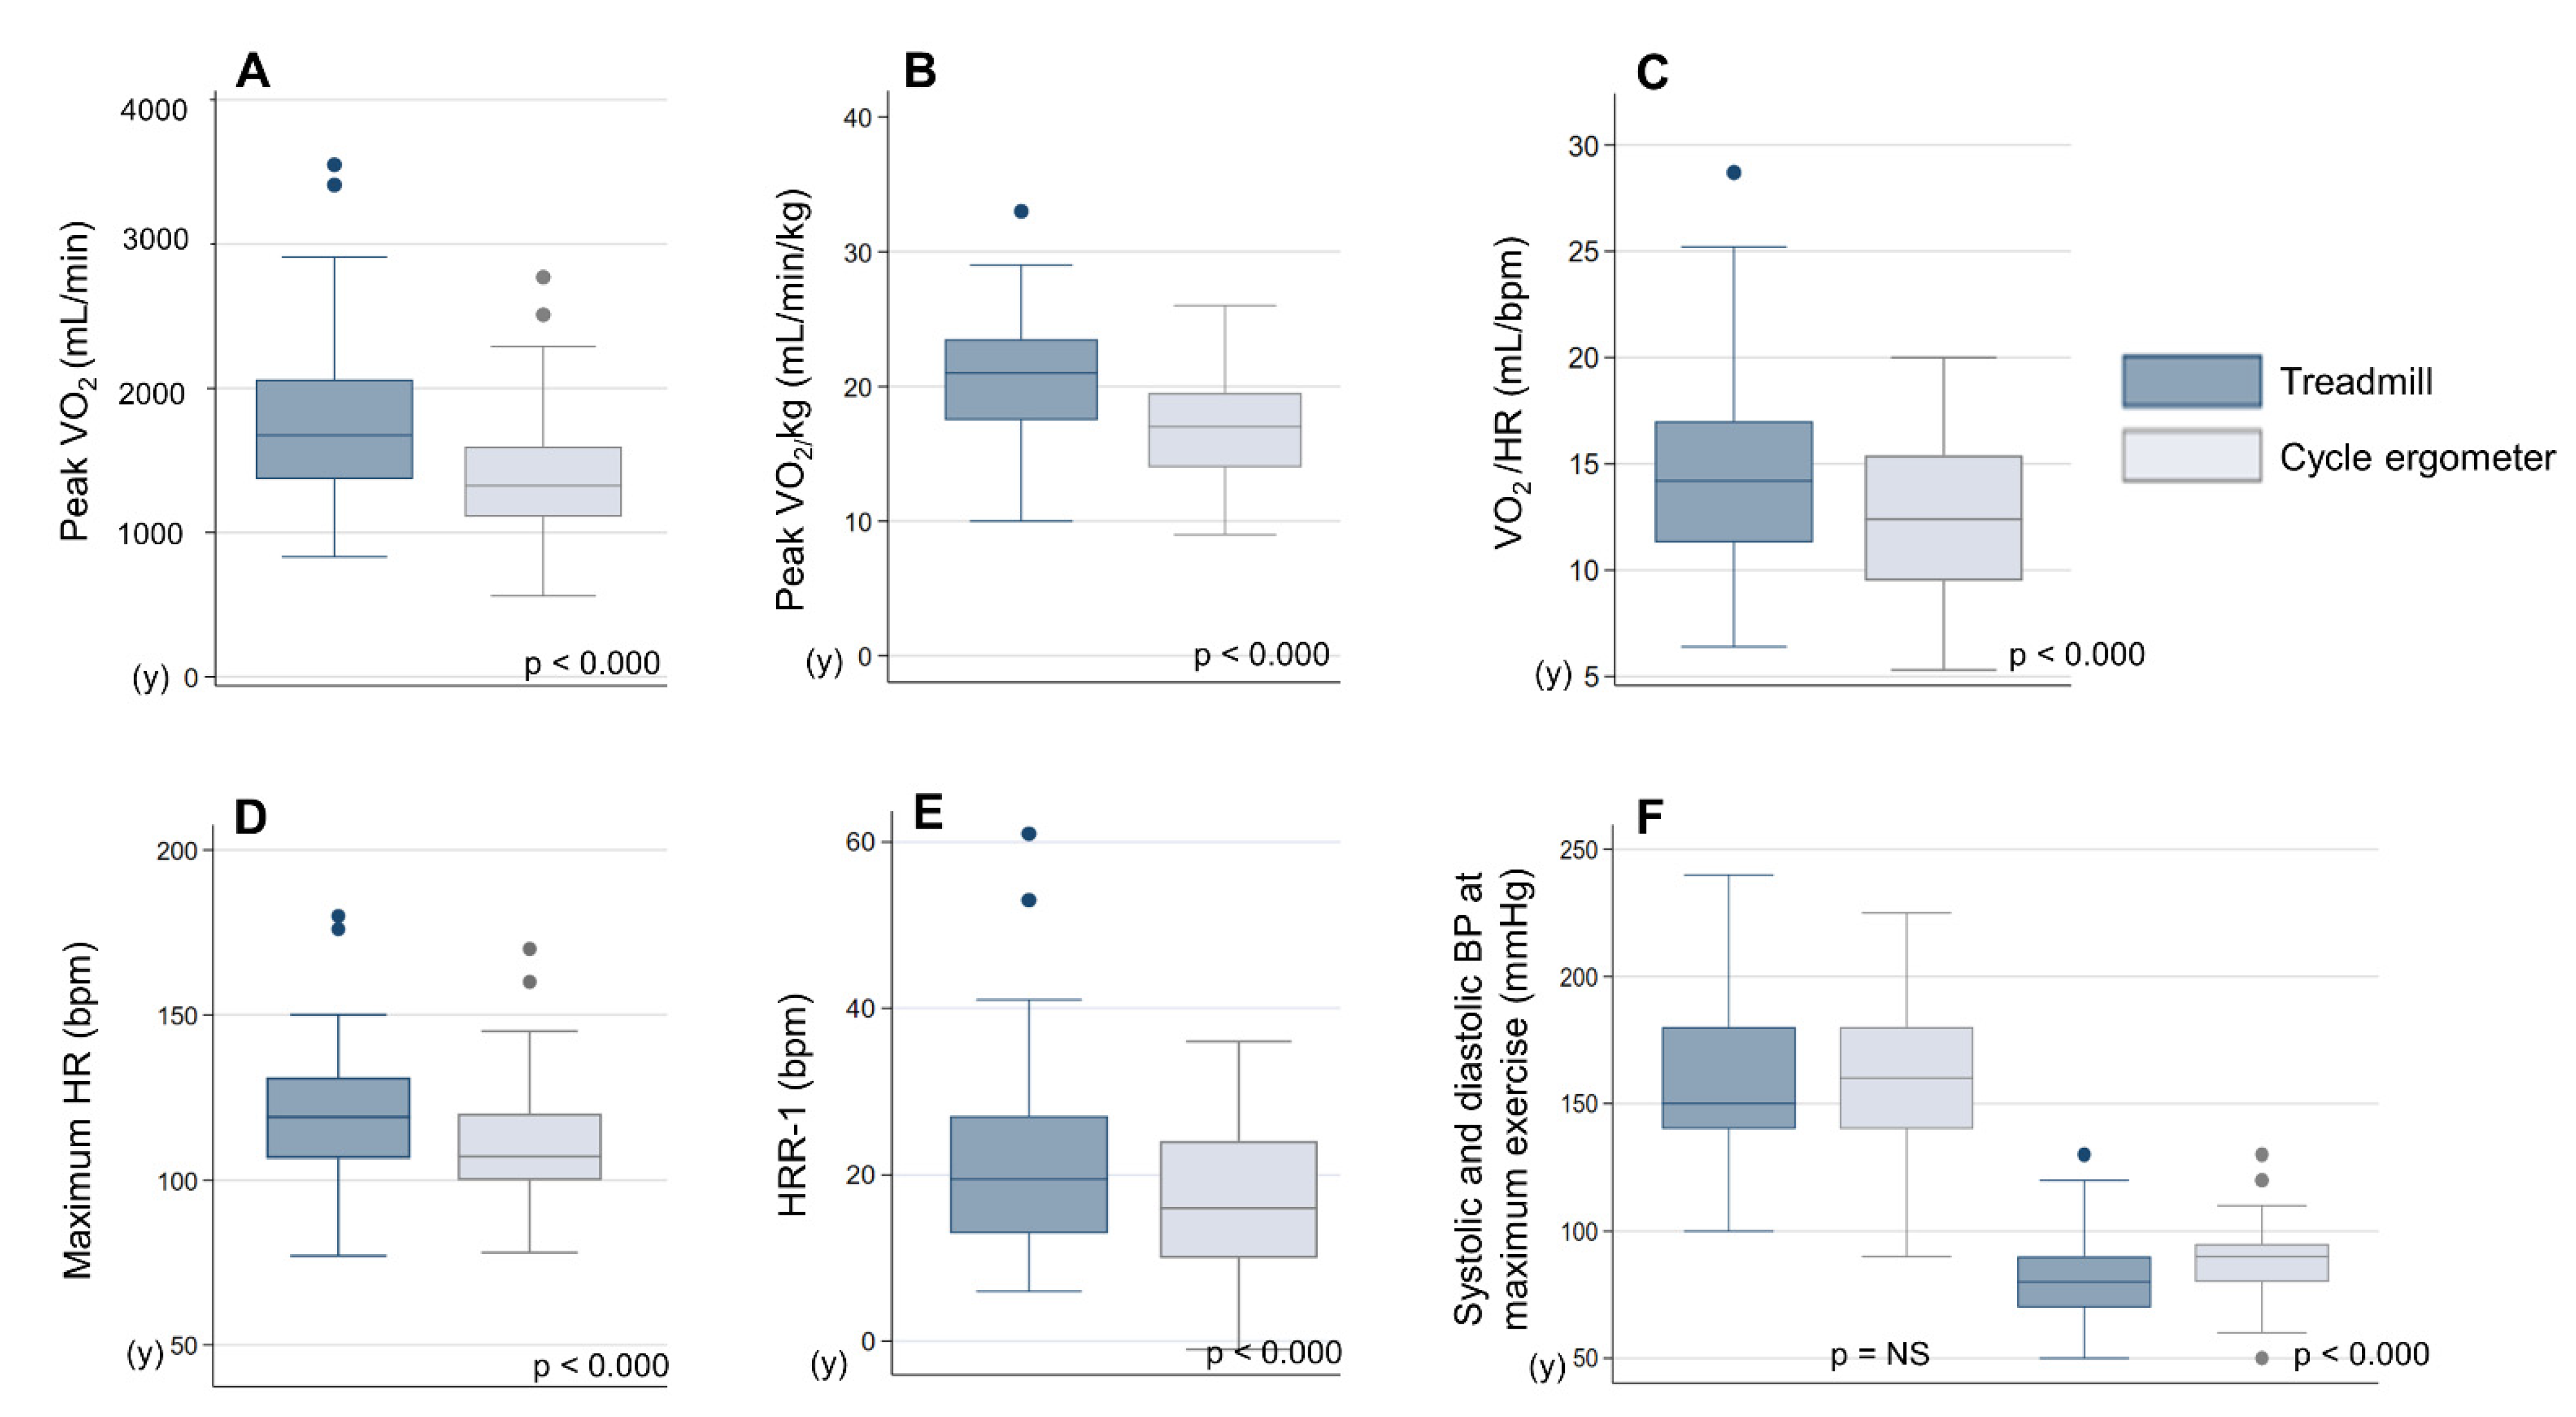
3.4. Cardiovascular Response
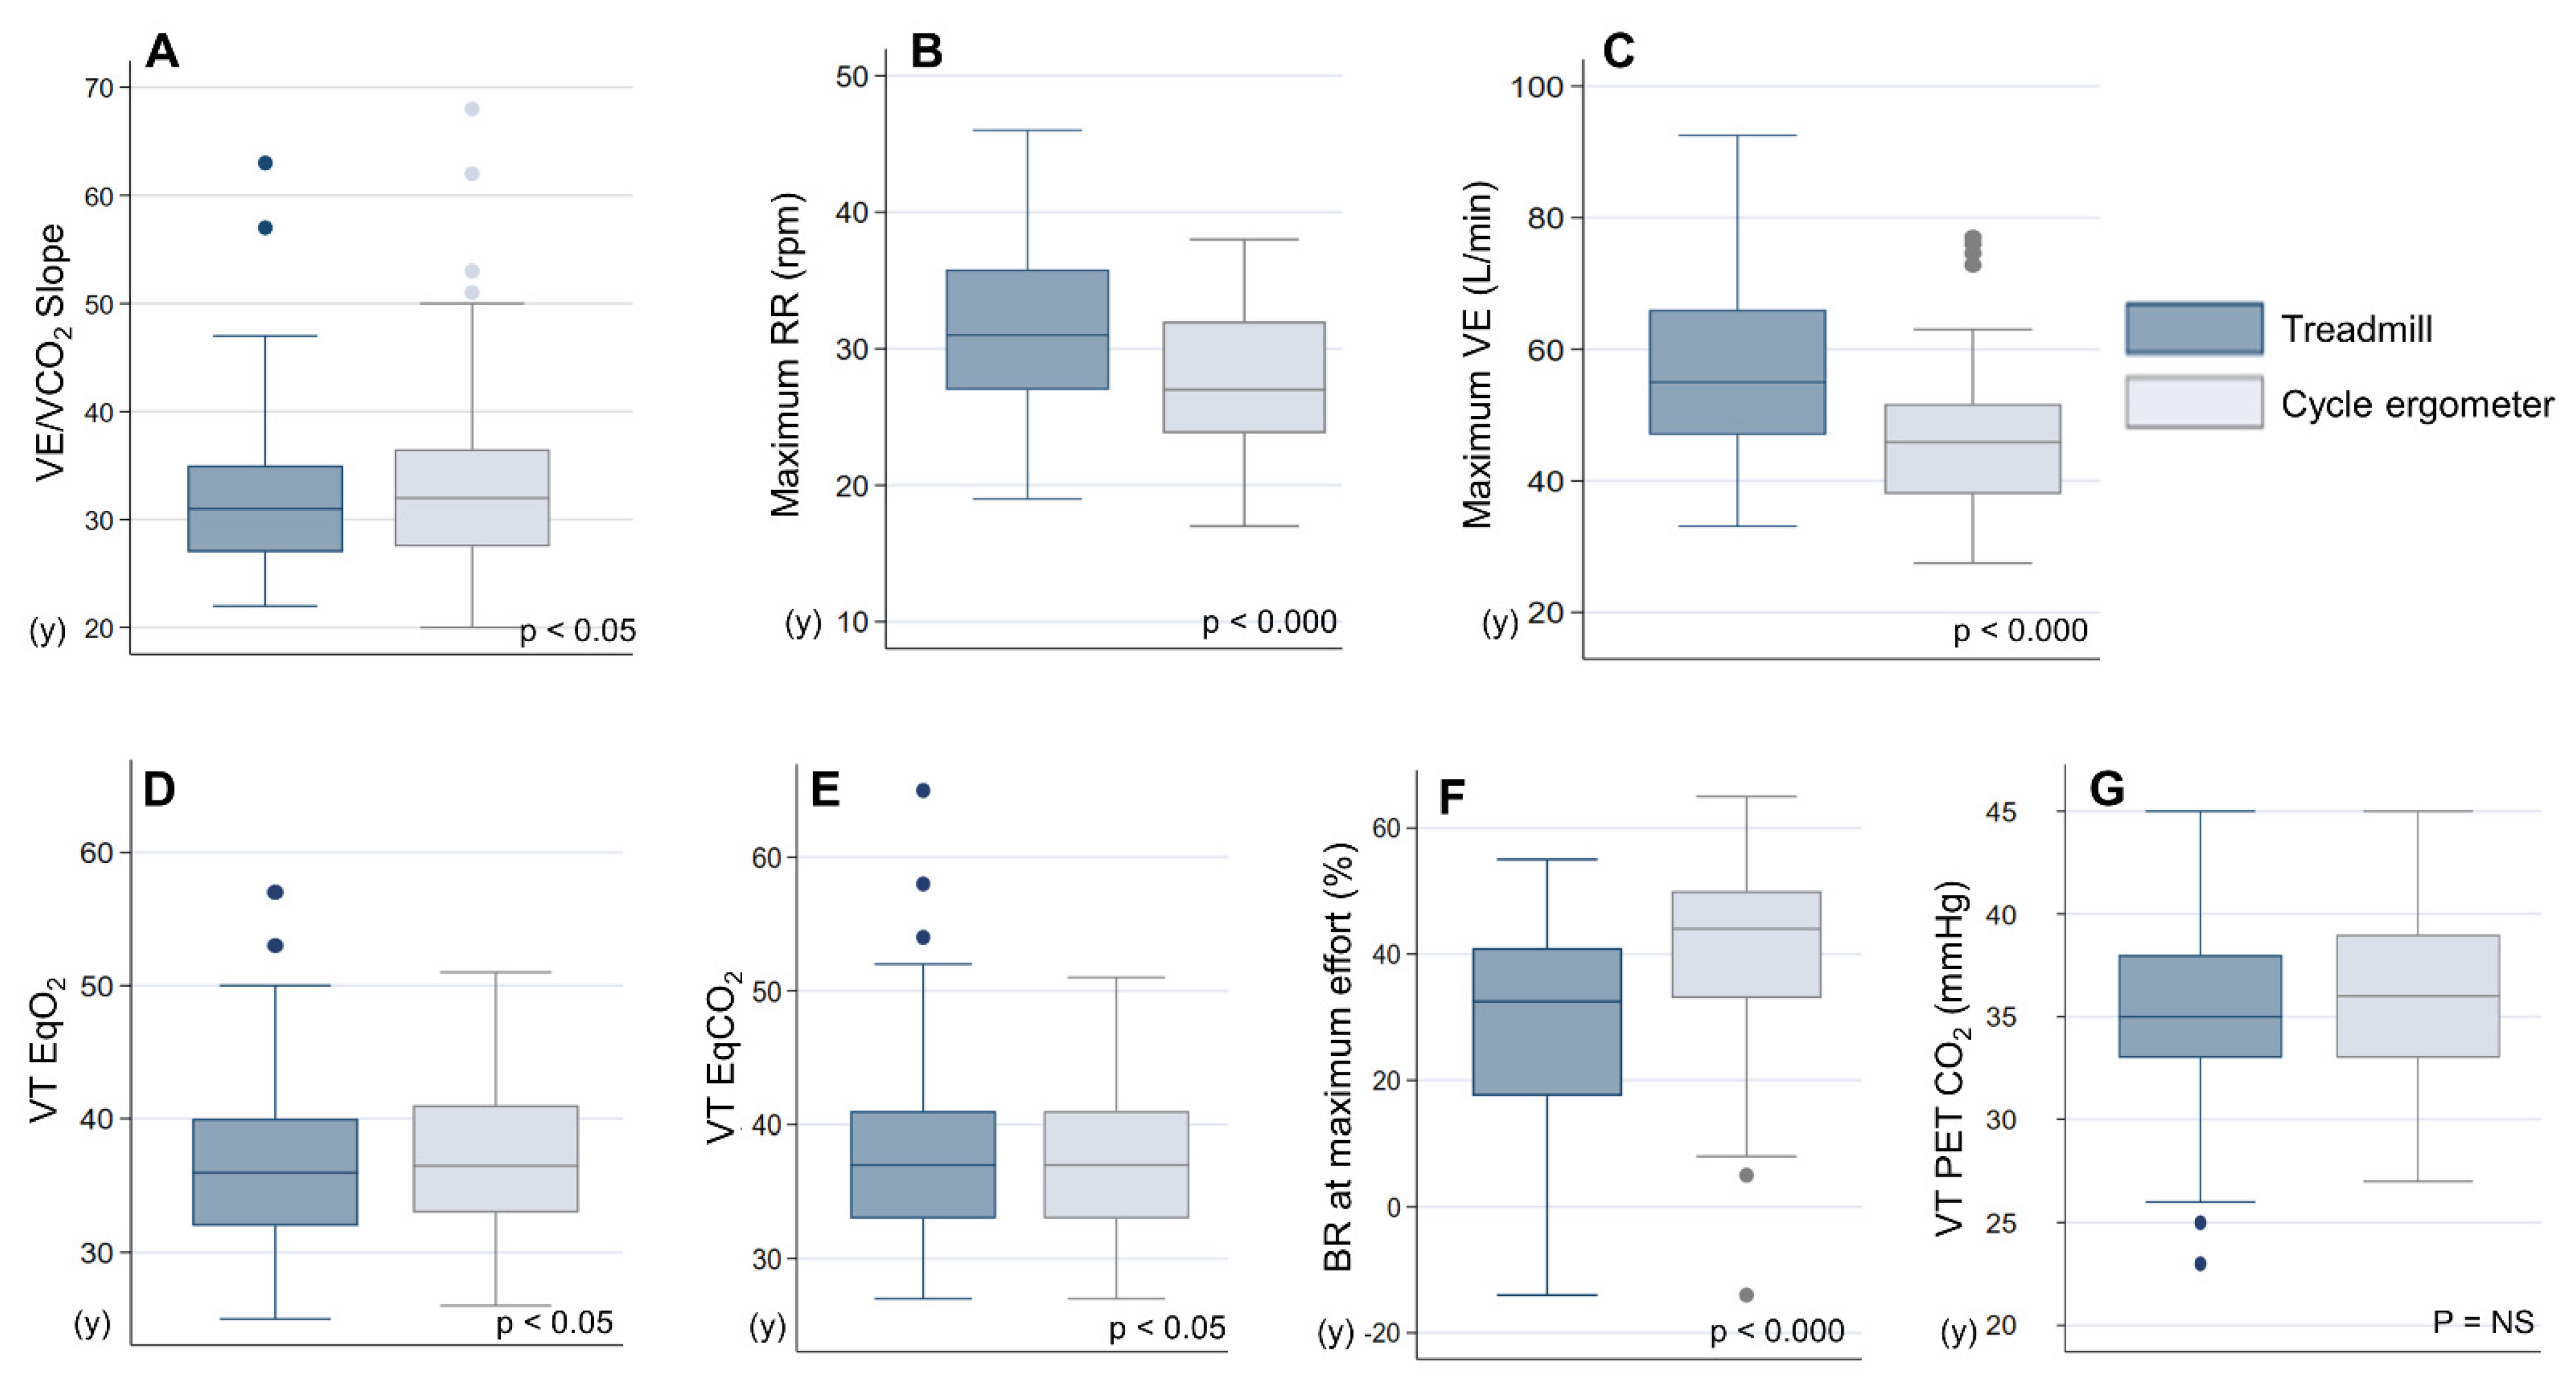
3.5. Ventilatory Response and Gas Exchange
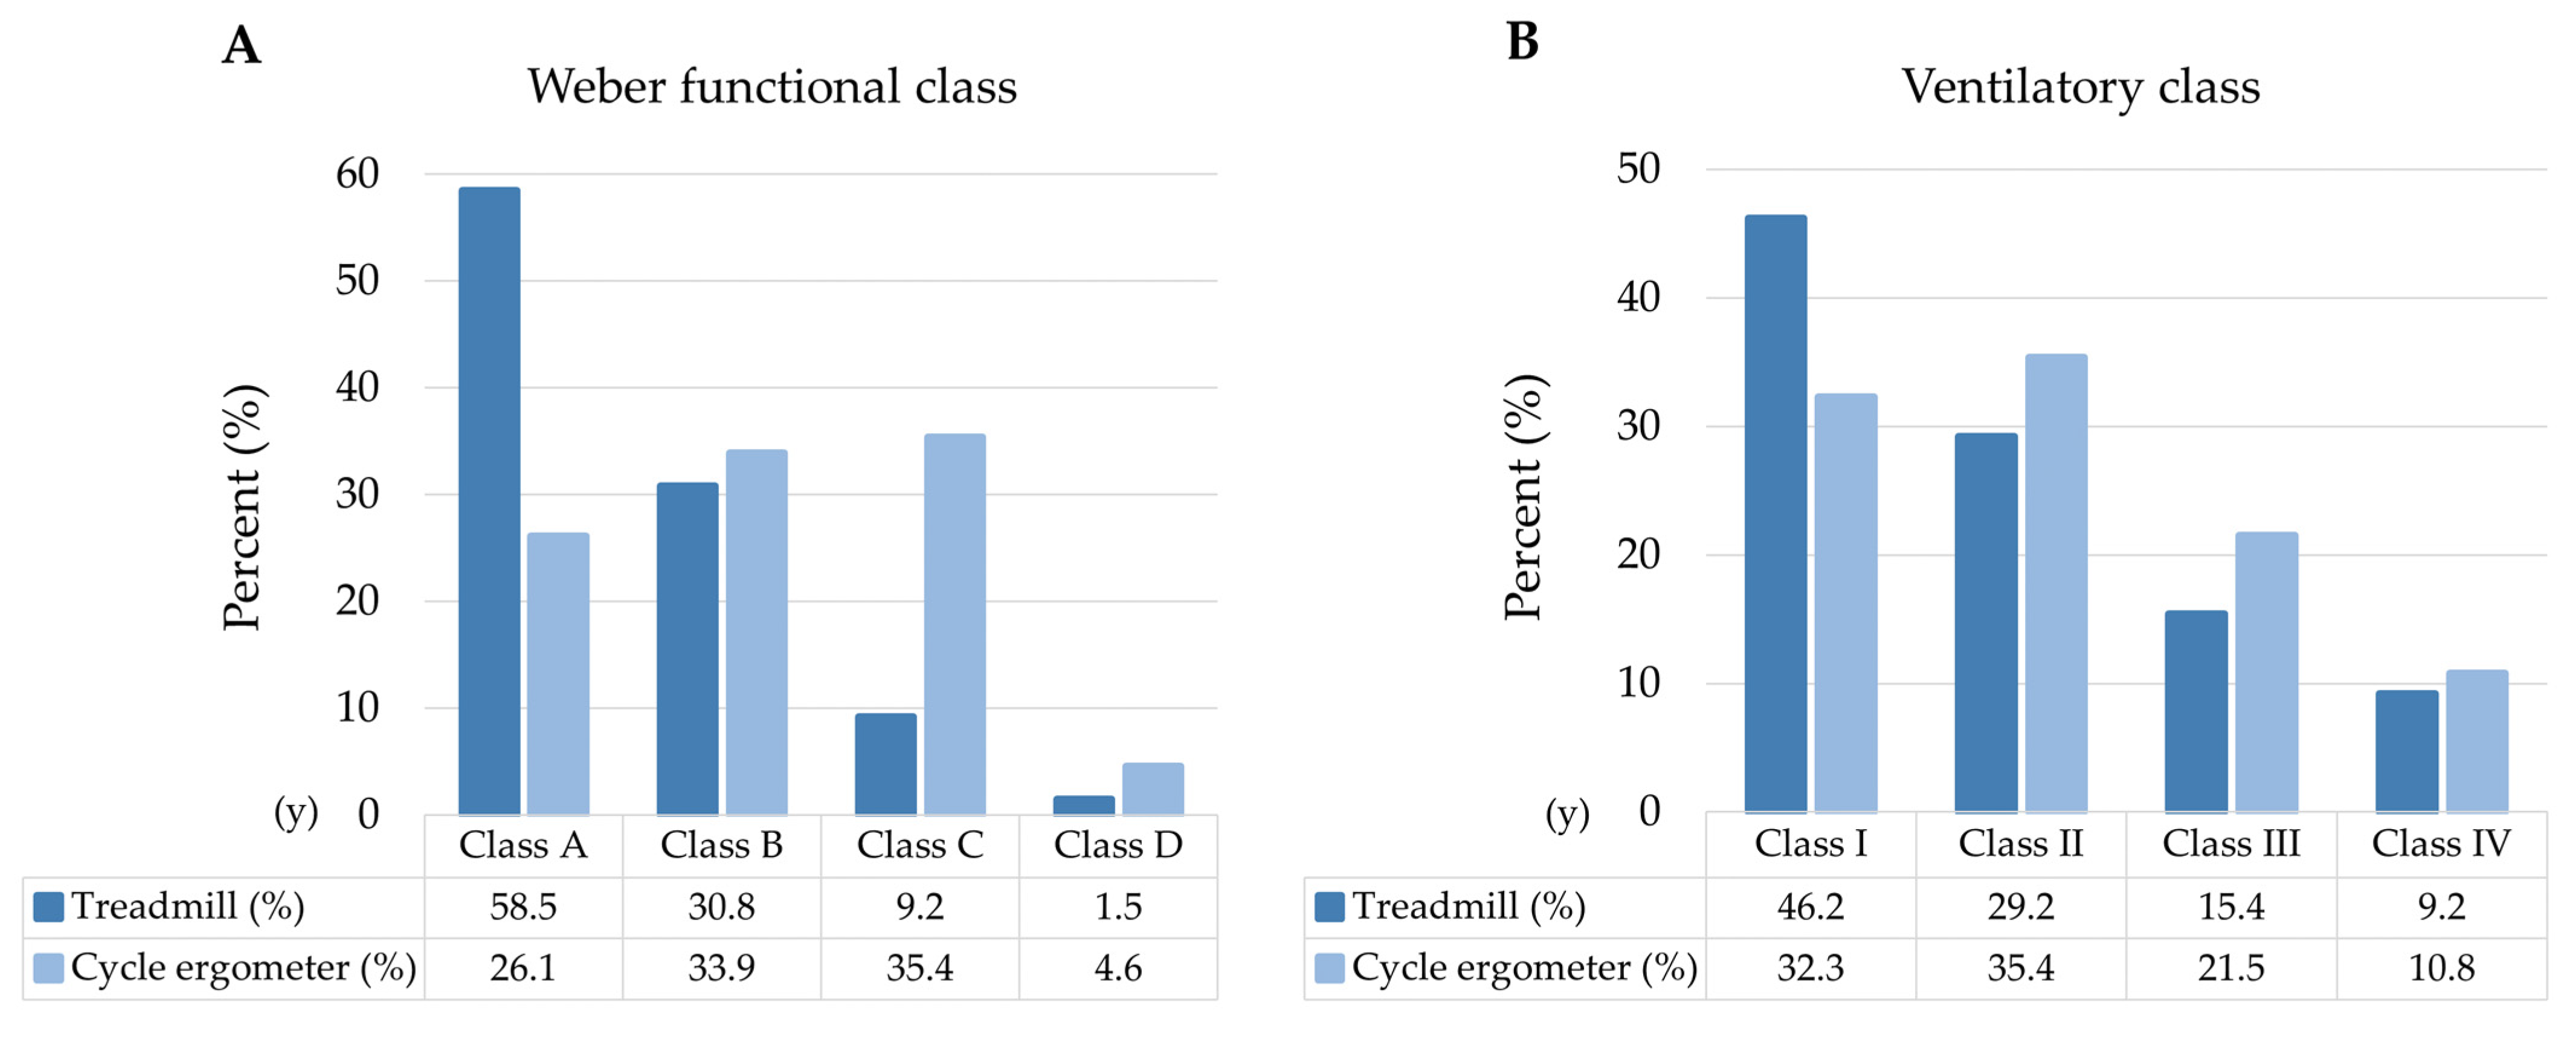
3.6. Prognostic Classification
3.7. Symptomatology and Preferences
4. Discussion
5. Conclusions
Author Contributions
Funding
Institutional Review Board Statement
Informed Consent Statement
Data Availability Statement
Conflicts of Interest
References
- Wasserman, J.; Hansen, D.; Sue, W.; Stringer, B.W. Principles of Exercise Testing and Interpretation, 4th ed; Lippincott Williams & Wilkins: Philadelphia, PA, USA, 2004. [Google Scholar]
- Corrà, U.; Piepoli, M.F.; Adamopoulos, S.; Agostoni, P.; Coats, A.J.; Conraads, V.; Ponikowski, P.P. Cardiopulmonary exercise testing in systolic heart failure in 2014: The evolving prognostic role A position paper from the committee on exercise physiology and training of the heart failure association of the ESC. Eur. J. Heart Fail. 2014, 1, 929–941. [Google Scholar] [CrossRef]
- Palange, P.; Ward, S.A.; Carlsen, K.H.; Carlsen, R.; Casaburi, C.G.; Gallagher, R.; Gosselink, D.E.; O’Donnell, L.; Puente-Maestu, A.M.; Schols, S.; et al. Recommendations on the use of exercise testing in clinical practice. Eur. Respir. J. 2007, 29, 185–209. [Google Scholar] [CrossRef]
- McDonagh, T.A.; Metra, M.; Adamo, M.; Gardner, R.S.; Baumbach, A.; Böhm, M.; Burri, H.; Butler, H.; Čelutkienė, J.; Chioncel, O.; et al. 2021 ESC Guidelines for the diagnosis and treatment of acute and chronic heart failure. Eur. Heart J. 2021, 42, 3599–3726. [Google Scholar] [CrossRef]
- Arena, R.; Myers, J.; Williams, M.A.; Gulati, M.; Kligfield, P.; Balady, G.J.; Collins, E.; Fletcher, G. Assessment of functional capacity in clinical and research settings: A scientific statement from the American Heart Association committee on exercise, rehabilitation, and prevention of the council on clinical cardiology and the council on cardiovascular n. Circulation 2007, 116, 329–343. [Google Scholar] [CrossRef]
- Balady, G.J.; Arena, R.; Sietsema, K.; Myers, J.; Coke, L.; Fletcher, G.F.; Forman, D.; Franklin, B.; Guazzi, M.; Gulati, M.; et al. Clinician’s guide to cardiopulmonary exercise testing in adults: A scientific statement from the American heart association. Circulation 2010, 12, 191–225. [Google Scholar] [CrossRef] [Green Version]
- Weisman, I.M.; Marciniuk, D.; Martinez, F.J.; Sciurba, F.; Sue, D.; Myers, J.; Casaburi, R.; Marciniuk, D.; Beck, K.; Zeballos, J.; et al. ATS/ACCP Statement on cardiopulmonary exercise testing. Am. J. Respir. Crit. Care Med. 2003, 16, 211–277. [Google Scholar] [CrossRef]
- Porszasz, J.; Stringer, W.C.R. Equipment, measurements and quality control. In Clinical Exercise Testing (ERS Monograph); Palange, P., Laveneziana, P., Neder, J.A., Eds.; European Respiratory Society: Sheffield, UK, 2018; pp. 59–81. [Google Scholar] [CrossRef]
- Hermansen, L.; Saltin, B. Oxygen uptake during maximal treadmill and bicycle exercise. J. Appl. Physiol. 1969, 26, 31–37. [Google Scholar] [CrossRef]
- Miyamara, M.; Honda, Y. Oxygen intake and cardiac output during maximal treadmill and bicycle exercise. J. Appl. Physiol. 1972, 32, 185–188. [Google Scholar] [CrossRef]
- Lockwood, P.; Yoder, J.; Deuster, P. Comparison and cross-validation of cycle ergometry estimates of VO2max. Med. Sci. Sport. Exerc. 1997, 29, 1513–1520. [Google Scholar] [CrossRef]
- Fletcher, G.F.; Balady, G.J.; Amsterdam, E.A.; Chaitman, B.; Eckel, R.; Fleg, J.; Froelicher, V.F.; Leon, A.S.; Pina, I.L.; Rodney, R.; et al. Exercise Standards for Testing and Training. Circulation 2001, 104, 1694–1740. [Google Scholar] [CrossRef] [Green Version]
- Malhotra, R.; Bakken, K.; D’Elia, E.; Lewis, G.D. Cardiopulmonary Exercise Testing in Heart Failure. JACC Heart Fail. 2016, 4, 607–616. [Google Scholar] [CrossRef]
- Truby, L.K.; Rogers, J.G. Advanced Heart Failure: Epidemiology, Diagnosis, and Therapeutic Approaches. JACC Heart Fail. 2020, 8, 523–536. [Google Scholar] [CrossRef]
- Potapov, E.V.; Antonides, C.; Crespo-Leiro, M.G.; Combes, A.; Färber, G.; Hannan, M.M.; Kukucka, M.; De Jonge, N.; Loforte, A.; Lund, L.H.; et al. 2019 EACTS Expert Consensus on long-term mechanical circulatory support. Eur. J. Cardio-Thorac. Surg. 2019, 56, 230–270. [Google Scholar] [CrossRef]
- Arena, R.; Myers, J.; Aslam, S.S.; Varughese, E.B.; Peberdy, M.A. Peak VO2 and VE/VCO2 slope in patients with heart failure: A prognostic comparison. Am. Heart J. 2004, 147, 354–360. [Google Scholar] [CrossRef]
- Cornelis, J.; Taeymans, J.; Hens, W.; Beckers, P.; Vrints, C.; Vissers, D. Prognostic respiratory parameters in heart failure patients with and without exercise oscillatory ventilation-A systematic review and descriptive meta-analysis. Int. J. Cardiol. 2015, 182, 476486. [Google Scholar] [CrossRef]
- Riley, M.; Northridge, D.B.; Henderson, E.; Stanford, C.F.; Nicholls, D.P.; Dargie, H.J. The use of an exponential protocol for bicycle and treadmill exercise testing in patients with chronic cardiac failure. Eur. Heart J. 1992, 13, 1363–1367. [Google Scholar] [CrossRef]
- Page, E.; Cohen-Solal, A.; Jondeau, G.; Douard, H.; Roul, G.; Kantelip, J.P.; Bussiere, J.L. Comparison of treadmill and bicycle exercise in patients with chronic heart failure. Chest 1994, 106, 1002–1006. [Google Scholar] [CrossRef]
- Kim, S.; Yamabe, H.; Yokoyama, M. Hemodynamic characteristics during treadmill and bicycle exercise in chronic heart failure: Mechanism for different responses of peak oxygen uptake. Jpn. Circ. J. 1999, 63, 965–970. [Google Scholar] [CrossRef] [Green Version]
- Witte, K.K.A.; Clark, A.L. Cycle exercise causes a lower ventilatory response to exercise in chronic heart failure. Heart 2005, 91, 225–226. [Google Scholar] [CrossRef] [Green Version]
- Maeder, M.T.; Wolber, T.; Ammann, P.; Myers, J.; Brunner-La Rocca, H.P.; Hack, D.; Riesen, W.; Rickli, H. Cardiopulmonary exercise testing in mild heart failure: Impact of the mode of exercise on established prognostic predictors. Cardiology 2008, 110, 135–141. [Google Scholar] [CrossRef] [Green Version]
- Beckers, P.J.; Possemiers, N.M.; Van Craenenbroeck, E.M.; Van Berendoncks, A.M.; Wuyts, K.; Vrints, C.J.; Conraads, V.M. Impact of exercise testing mode on exercise parameters in patients with chronic heart failure. Eur. J. Prev. Cardiol. 2012, 19, 389–395. [Google Scholar] [CrossRef]
- Mazaheri, R.; Sadeghian, M.; Nazarieh, M.; Niederseer, D.; Schmied, C. Performance of heart failure patients with severely reduced ejection fraction during cardiopulmonary exercise testing on treadmill and cycle ergometer; similarities and differences. Int. J. Environ. Res. Public Health 2021, 18, 12958. [Google Scholar] [CrossRef]
- Maddox, T.M.; Januzzi, J.L.; Allen, L.A.; Breathett, K.; Butler, J.; Davis, L.L.; Fonarow, G.C.; Ibrahim, N.E.; Lindenfeld, J.; Masoudi, F.A.; et al. 2021 Update to the 2017 ACC Expert Consensus Decision Pathway for Optimization of Heart Failure Treatment: Answers to 10 Pivotal Issues About Heart Failure With Reduced Ejection Fraction: A Report of the American College of Cardiology Solution Set Oversig. J. Am. Coll. Cardiol. 2021, 77, 772–810. [Google Scholar] [CrossRef]
- Pereiro Alonso, M.E. Capacidad Aeróbica en una Población Adulta Sana y Calidad de Vida Relacionada con la salud. December. 2003. Available online: http://hdl.handle.net/10651/16219 (accessed on 17 October 2021).
- Wilson, R.C.; Jones, P.W. A comparison of the visual analogue scale and modified Borg scale for the measurement of dyspnoea during exercise. Clin. Sci. 1989, 76, 277–282. [Google Scholar] [CrossRef] [Green Version]
- Nanas, S.; Anastasiou-Nana, M.; Dimopoulos, S.; Sakellariou, D.; Alexopoulos, G.; Kapsimalakou, S.; Papazoglou, P.; Tsolakis, E.; Papazachou, O.; Roussos, C.; et al. Early heart rate recovery after exercise predicts mortality in patients with chronic heart failure. Int. J. Cardiol. 2006, 110, 393–400. [Google Scholar] [CrossRef]
- Weber, K.T.; Kinasewitz, G.T.; Janicki, J.S.; Fishman, A.P. Oxygen utilization and ventilation during exercise in patients with chronic cardiac failure. Circulation 1982, 65, 1213–1223. [Google Scholar] [CrossRef] [Green Version]
- Arena, R.; Myers, J.; Abella, J.; Peberdy, M.A.; Bensimhon, D.; Chase, P.; Guazzi, M. Development of a ventilatory classification system in patients with heart failure. Circulation 2007, 115, 2410–2417. [Google Scholar] [CrossRef] [Green Version]
- Quanjer, P.H.; Stanojevic, S.; Cole, T.J.; Baur, X.; Hall, G.L.; Culver, B.H.; Enright, P.L.; Hankinson, J.L.; Ip, M.S.M.; Zheng, J.; et al. Multi-Ethnic Reference Values for Spirometry for the 3-95-Yr Age Range: The Global Lung Function 2012 Equations. Eur. Respir. J. 2012, 40, 1324–1343. [Google Scholar] [CrossRef]
- Fragoso, C.A.V.; Magnussen, H.; Miller, M.R.; Brusasco, V. The Effect of Defining Chronic Obstructive Pulmonary Disease by the Lower Limit of Normal of the FEV1/FVC Ratio. Ann. Am. Thorac. Soc. 2018, 15, 766–767. [Google Scholar] [CrossRef]
- Singh, D.; Agusti, A.; Anzueto, A.; Barnes, P.J.; Bourbeau, J.; Celli, B.R.; Criner, G.J.; Frith, P.; Halpin, D.M.G.; Han, M.; et al. Global Strategy for the Diagnosis, Management, and Prevention of Chronic Obstructive Lung Disease: The GOLD Science Committee Report 2019. Eur. Respir. J. 2019, 53, 1900164. [Google Scholar] [CrossRef]
- Myers, J.; Arena, R.; Dewey, F.; Bensimhon, D.; Abella, J.; Hsu, L.; Chase, P.; Guazzi, M.; Peberdy, M.A. A cardiopulmonary exercise testing score for predicting outcomes in patients with heart failure. Am. Heart J. 2008, 156, 1177–1183. [Google Scholar] [CrossRef]

| Mean (SD)/No (%) | |
|---|---|
| Age (years) | 57.8 ± 9.3 |
| Sex (male) | 49 (75%) |
| Body mass index (kg/m2) | 29.2 ± 4.4 |
Comorbidity
| 12 (18%) 18 (28%) 8 (44%) 9 (50%) 1 (6%) 0 (0%) |
Functional class
| 13 (20%) 41 (63%) 11 (17%) 0 (0%) |
Cause of HFrEF
| 28 (44%) 27 (42%) 6 (9%) 4 (5%) |
| LVEF (%) | 29.5 ± 8.6 |
Laboratory values
| 14.05 ± 1.78 1.19 ± 0.8 71.6 ± 19.09 |
Spirometry (mL/% theoretical)
| 2701 ± 757 (84 ± 16%) 3762 ± 1020 (90 ± 16%) 71 ± 7% |
Chronic treatment
| 63 (97%) 37 (57%) 27 (41%) 37 (57%) 22 (34%) 45 (69%) 2 (3%) 7 (11%) 1 (2%) 4 (6%) |
Implantable cardioverter defibrillator
| 34 (52%) 11 (32%) 23 (68%) |
| CPET Variable | Treadmill | Cycle Ergometer | p Value |
|---|---|---|---|
| Test Duration (minutes) | 10.5 ± 2.7 | 10.2 ± 3.1 | NS |
| Reached VT (%) | 93.8% | 76.9% | p < 0.05 |
| RQ Max | 1.04 ± 0.05 | 1.03 ± 0.06 | NS |
| HR at Rest (bpm) | 69.6 ± 10.9 | 68.8 ± 11.0 | NS |
| HR at Maximum Effort (bpm) | 117.3 ± 15.7 | 107.5 ± 15.2 | p < 0.000 |
| HR Recovery Index (bpm) | 22.4 ± 12.8 | 16.4 ± 8.8 | p < 0.000 |
| SBP at Rest (mmHg) | 123.3 ± 21.6 | 125.3 ± 21.8 | NS |
| SBP at the End of Exercise (mmHg) | 158.7 ± 33.5 | 161.4 ± 30.9 | NS |
| DBP at Rest (mmHg) | 75.8 ± 10.8 | 78.9 ± 12.2 | p < 0.05 |
| DBP at the End of Exercise (mmHg) | 81.5 ± 16.6 | 87.4 ± 16.2 | p < 0.000 |
| Initial O2 Saturation (%) | 97.0 ± 1.3 | 97.2 ± 1.2 | NS |
| Final O2 Saturation (%) | 96.4 ± 1.8 | 97.2 ± 1.4 | p < 0.000 |
| Resting VO2 (mL/min) | 412.7 ± 162.2 | 416.6 ± 166.1 | NS |
| Peak VO2 (mL/min) | 1734.9 ± 549.9 | 1390.5 ± 427.0 | p < 0.000 |
| Peak VO2/kg (mL/min/kg) | 21.0 ± 5.1 | 16.9 ± 4.1 | p < 0.000 |
| VO2 at VT (mL/min) | 1612.5 ± 382.5 | 1274.0 ± 361.8 | p < 0.000 |
| VCO2 at VT (mL/min) | 1587.7 ± 376.2 | 1259.0± 354.3 | p < 0.000 |
| O2 pulse at VT (mL/bpm) | 14.6 ± 3.6 | 12.5 ± 3.3 | p < 0.000 |
| VE/VCO2 Slope | 32.2 ± 7.9 | 33.9 ± 8.8 | p < 0.05 |
| VE Max (L/min) | 54.7 ± 16.3 | 45.8 ± 11.4 | p < 0.000 |
| RR Max (rpm) | 30.5 ± 5.6 | 27.3 ± 5.0 | p < 0.000 |
| EqO2 at VT | 35.6 ± 4.9 | 37.0 ± 5.5 | p < 0.05 |
| EQCO2 at VT | 36.3 ± 5.0 | 37.4 ± 5.4 | p < 0.05 |
| PETCO2 at Rest (mmHg) | 32.0 ± 4.4 | 32.8 ± 4.9 | NS |
| PETCO2 at VT (mmHg) | 36.2 ± 4.2 | 36.1 ± 4.5 | NS |
| ΔPETCO2(mmHg) | 3.8 ± 4.0 | 2.3 ± 4.7 | p < 0.05 |
| BR at Maximum Effort (%) | 28.4 ± 17.1 | 41.1 ± 15.2 | p < 0.000 |
| Exercise Oscillatory Ventilation(%) | 29.6 | 36.5 | NS |
| Final Borg Dyspnea (1–10) | 5.4 ± 2.4 | 3.7 ± 2.3 | p < 0.000 |
| Final Borg Lower Limbs (1–10) | 3.8 ± 3.1 | 4.8 ± 2.4 | p < 0.05 |
| Treadmill | Cycle Ergometer | p-Value | |
|---|---|---|---|
| VO2 at rest | 412.7 ± 162.2 | 416.6 ± 166.1 | NS |
| VT VO2 | 1612.5 ± 382.5 | 1274.0 ± 361.8 | <0.000 |
| Peak VO2 | 1734.9 ± 549.9 | 1390.5 ± 427.0 | <0.000 |
Publisher’s Note: MDPI stays neutral with regard to jurisdictional claims in published maps and institutional affiliations. |
© 2022 by the authors. Licensee MDPI, Basel, Switzerland. This article is an open access article distributed under the terms and conditions of the Creative Commons Attribution (CC BY) license (https://creativecommons.org/licenses/by/4.0/).
Share and Cite
Herrero Huertas, J.; García Clemente, M.; Díaz Molina, B.; Lambert Rodríguez, J.L.; Íscar Urrutia, M. Heart Failure with Reduced Ejection Fraction and Prognostic Scales: The Impact of Exercise Modality in Cardiopulmonary Exercise Tests. J. Clin. Med. 2022, 11, 3122. https://doi.org/10.3390/jcm11113122
Herrero Huertas J, García Clemente M, Díaz Molina B, Lambert Rodríguez JL, Íscar Urrutia M. Heart Failure with Reduced Ejection Fraction and Prognostic Scales: The Impact of Exercise Modality in Cardiopulmonary Exercise Tests. Journal of Clinical Medicine. 2022; 11(11):3122. https://doi.org/10.3390/jcm11113122
Chicago/Turabian StyleHerrero Huertas, Julia, Marta García Clemente, Beatriz Díaz Molina, José Luis Lambert Rodríguez, and Marta Íscar Urrutia. 2022. "Heart Failure with Reduced Ejection Fraction and Prognostic Scales: The Impact of Exercise Modality in Cardiopulmonary Exercise Tests" Journal of Clinical Medicine 11, no. 11: 3122. https://doi.org/10.3390/jcm11113122
APA StyleHerrero Huertas, J., García Clemente, M., Díaz Molina, B., Lambert Rodríguez, J. L., & Íscar Urrutia, M. (2022). Heart Failure with Reduced Ejection Fraction and Prognostic Scales: The Impact of Exercise Modality in Cardiopulmonary Exercise Tests. Journal of Clinical Medicine, 11(11), 3122. https://doi.org/10.3390/jcm11113122