
Digital Assessment of Gingival Dimensions of Healthy Periodontium

 ,
,
Abstract
1. Introduction
2. Materials and Methods
2.1. Study Design
2.2. Study Population
2.3. Sampling
2.4. Examination
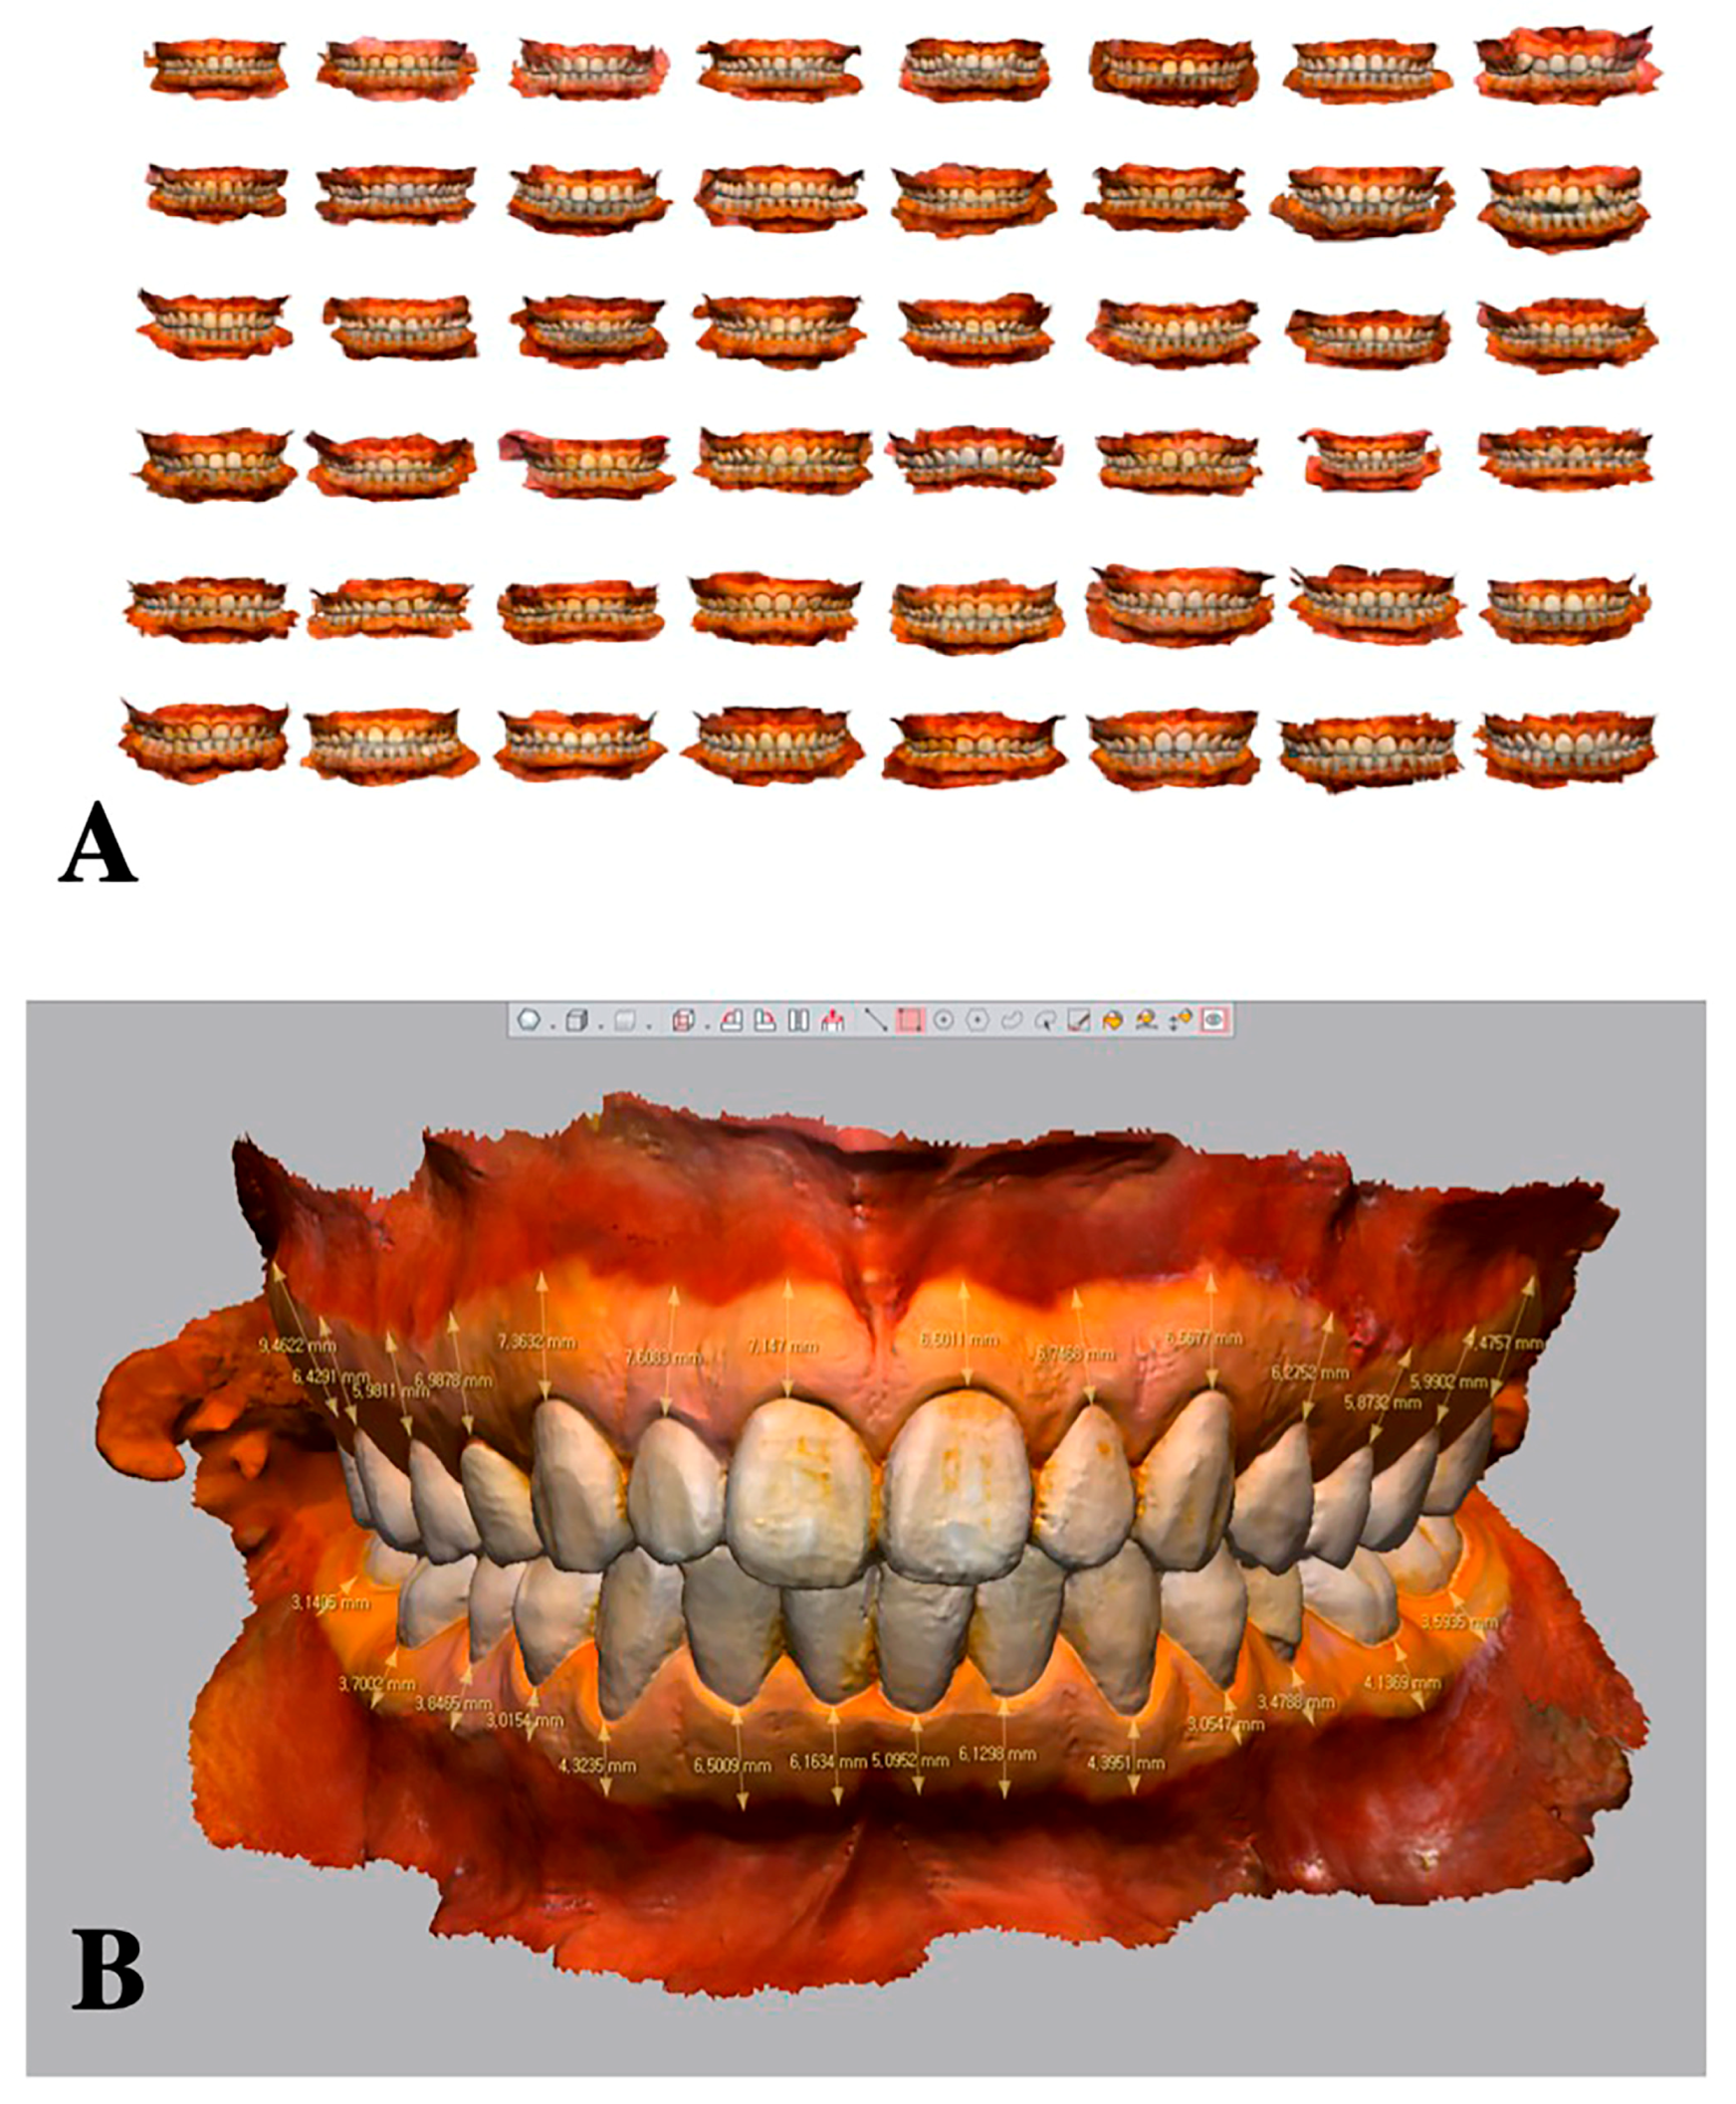
2.4.1. Intraoral Scanning
2.4.2. Clinical Measurements
2.5. Analysis
2.6. Statistics
3. Results
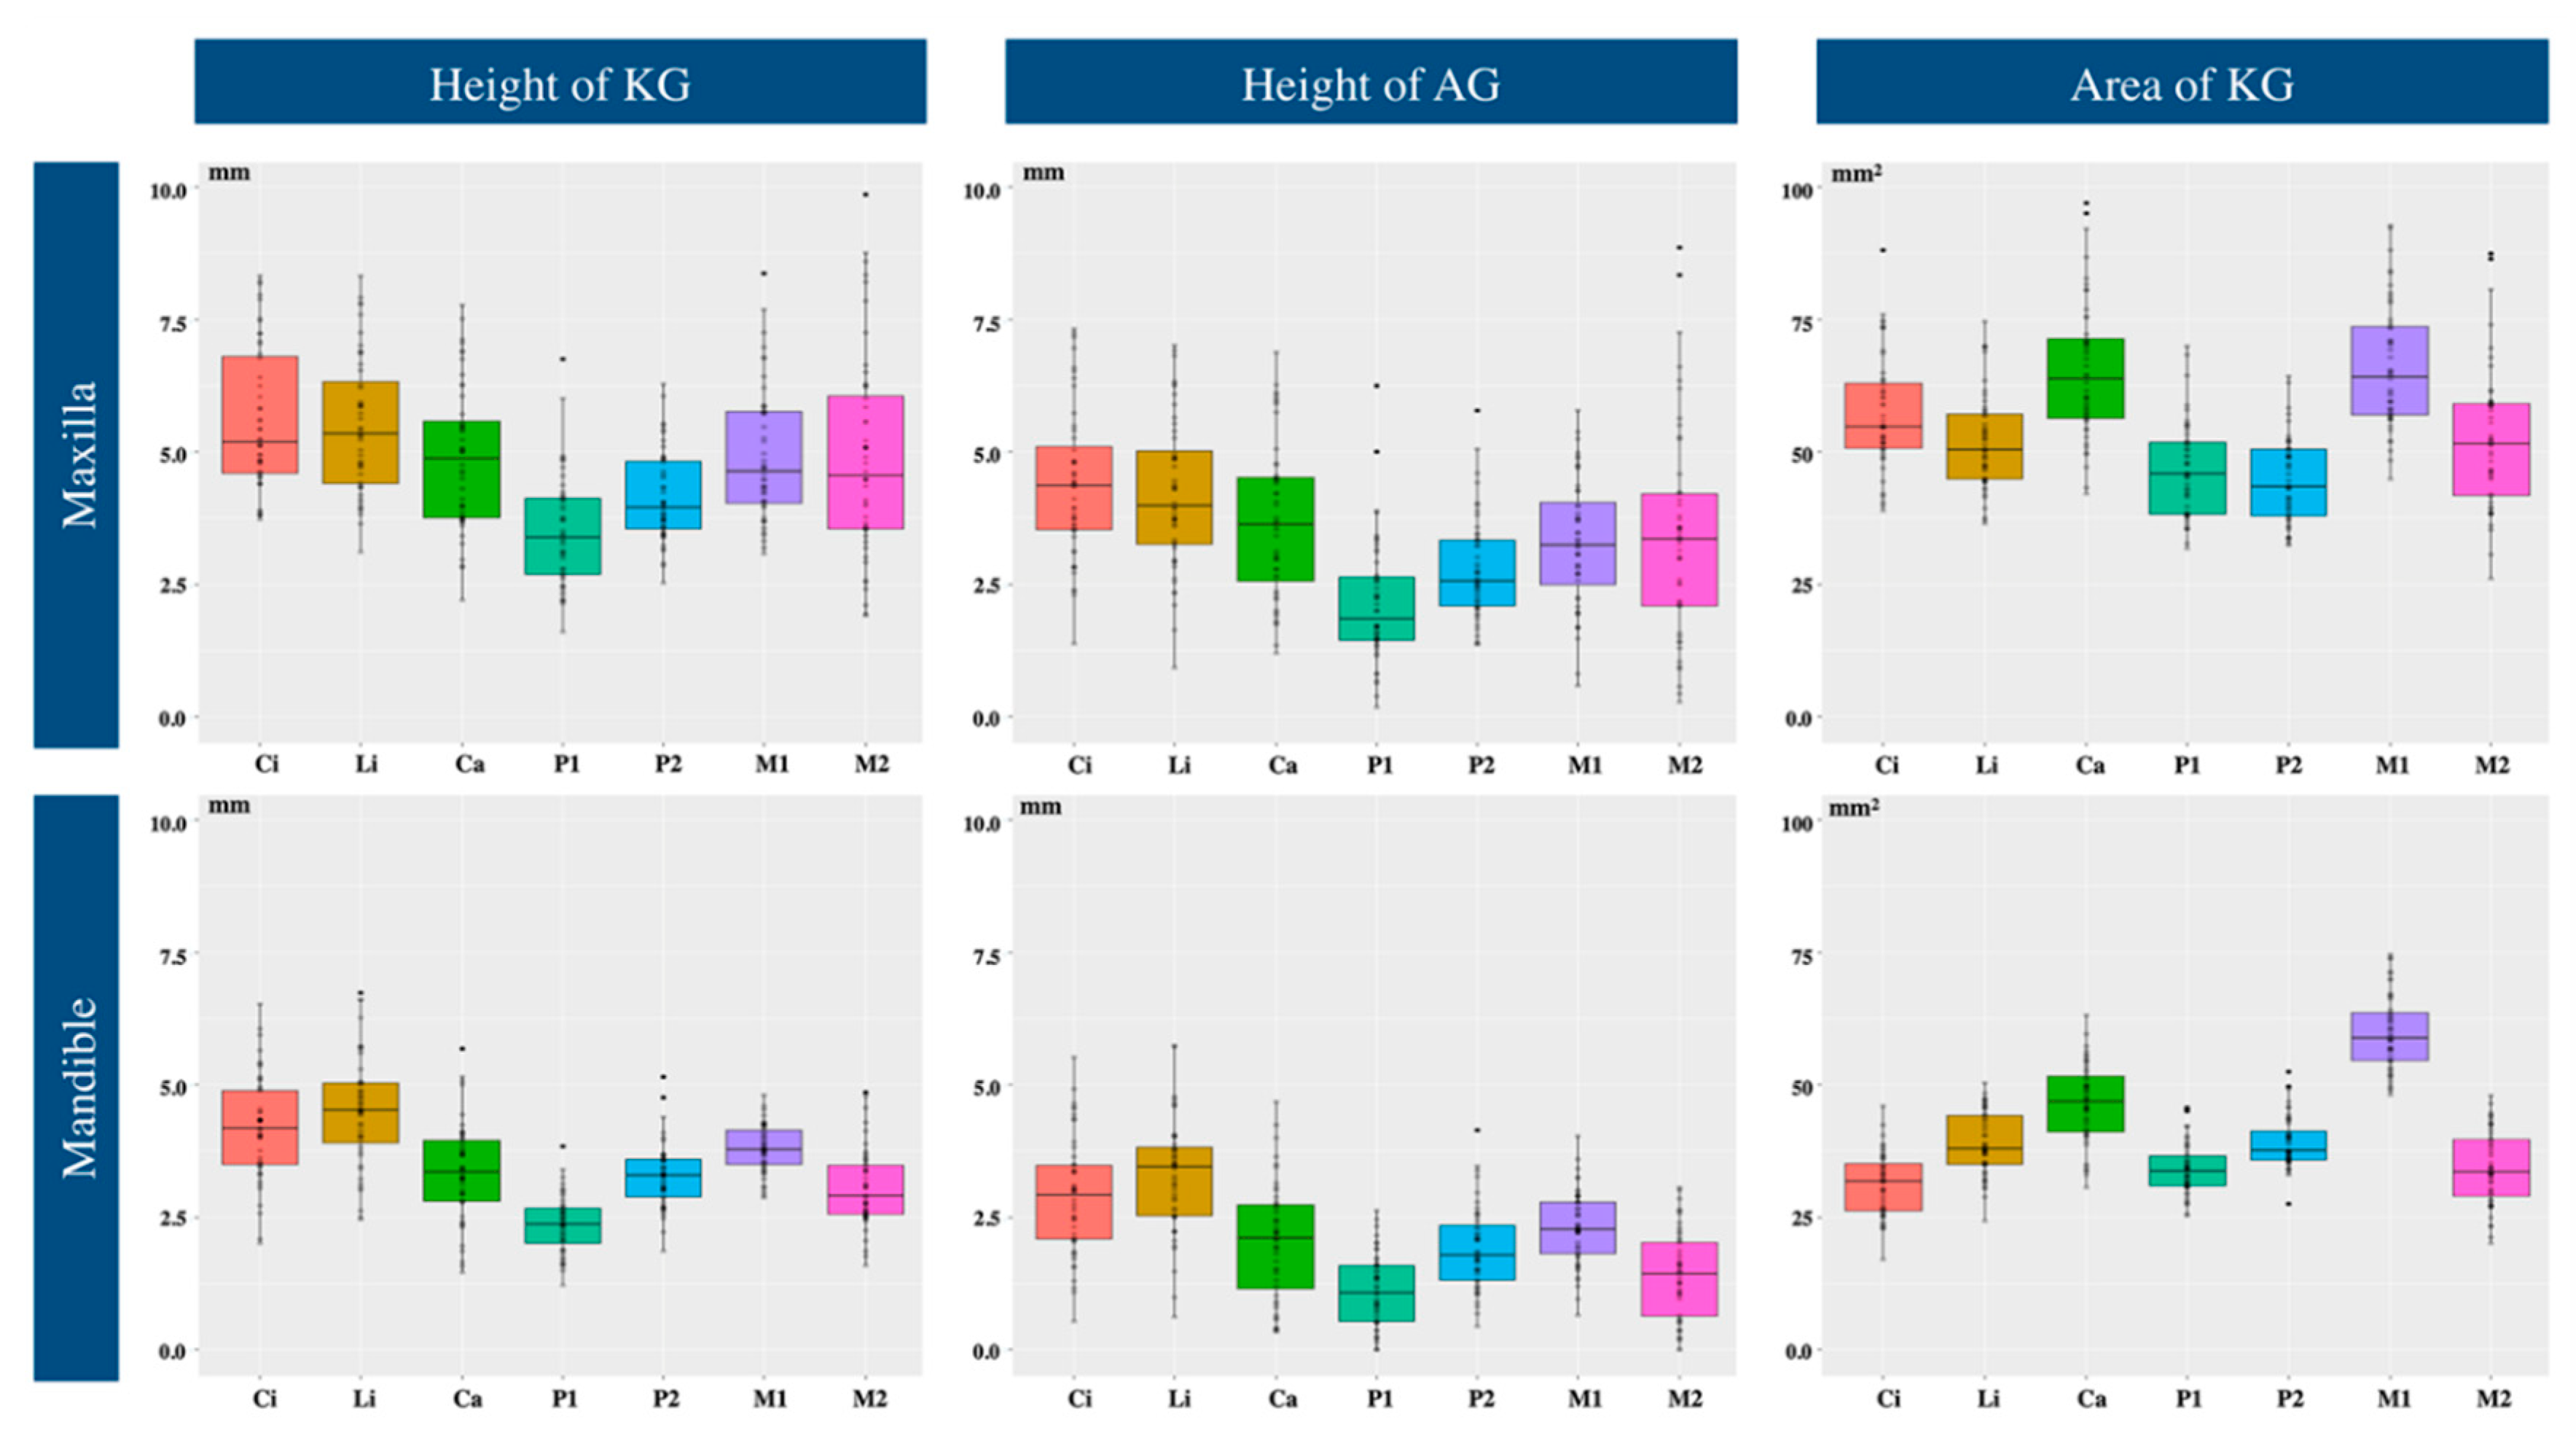
3.1. Height of Keratinized Gingiva
3.2. Height of Attached Gingiva
3.3. Area of Keratinized Gingiva
3.4. Determination of Sex on a Basis of Gingival Dimensions
4. Discussion
5. Conclusions
Author Contributions
Funding
Institutional Review Board Statement
Informed Consent Statement
Data Availability Statement
Acknowledgments
Conflicts of Interest
Appendix A

| Tooth Number | 17 | 16 | 15 | 14 | 13 | 12 | 11 | 21 | 22 | 23 | 24 | 25 | 26 | 27 | 47 | 46 | 45 | 44 | 43 | 42 | 41 | 31 | 32 | 33 | 34 | 35 | 36 | 37 | |
|---|---|---|---|---|---|---|---|---|---|---|---|---|---|---|---|---|---|---|---|---|---|---|---|---|---|---|---|---|---|
| Total (n = 48) | Average | 4.87 | 4.99 | 4.09 | 3.43 | 4.73 | 5.52 | 5.66 | 5.54 | 5.45 | 5.01 | 3.56 | 4.19 | 4.84 | 4.89 | 3.03 | 3.81 | 3.31 | 2.45 | 3.38 | 4.49 | 4.17 | 4.18 | 4.52 | 3.33 | 2.27 | 3.23 | 3.77 | 3.06 |
| SD | 2.08 | 1.37 | 1.00 | 1.19 | 1.47 | 1.41 | 1.45 | 1.37 | 1.34 | 1.55 | 1.22 | 0.92 | 1.33 | 2.21 | 0.87 | 0.61 | 0.70 | 0.61 | 1.12 | 1.16 | 1.07 | 1.07 | 1.07 | 0.85 | 0.61 | 0.68 | 0.45 | 0.74 | |
| Median | 4.33 | 4.81 | 3.85 | 3.16 | 4.44 | 5.10 | 5.22 | 5.20 | 5.36 | 5.12 | 3.24 | 4.16 | 4.58 | 4.56 | 2.94 | 3.85 | 3.27 | 2.55 | 3.26 | 4.47 | 4.14 | 4.13 | 4.60 | 3.36 | 2.24 | 3.25 | 3.78 | 3.05 | |
| Inter-quartile range | 3.01 | 1.96 | 0.94 | 1.53 | 2.22 | 2.00 | 2.80 | 1.95 | 2.19 | 2.39 | 1.68 | 1.16 | 1.57 | 2.51 | 0.99 | 0.89 | 0.80 | 0.93 | 1.21 | 1.30 | 1.76 | 1.31 | 1.25 | 1.15 | 0.70 | 0.75 | 0.52 | 1.02 | |
| 95% CI | 3.66, 5.04 | 4.29, 5.36 | 3.56, 4.10 | 2.57, 3.50 | 3.96, 4.88 | 4.25, 5.36 | 4.37, 5.68 | 4.83, 5.63 | 4.72, 5.99 | 4.49, 6.11 | 2.38, 3.59 | 3.82, 4.52 | 4.05, 4.83 | 3.98, 5.33 | 2.58, 3.11 | 3.58, 4.15 | 3.11, 3.43 | 2.33, 2.90 | 2.69, 3.47 | 4.23, 4.81 | 3.75, 4.63 | 3.84, 4.45 | 4.31, 4.95 | 3.14, 3.51 | 2.03, 2.41 | 3.14, 3.53 | 3.67, 3.90 | 2.74, 3.40 | |
| Male (n = 38) | Average | 4.93 | 4.93 | 4.07 | 3.43 | 4.86 | 5.60 | 5.73 | 5.58 | 5.58 | 5.06 | 3.59 | 4.16 | 4.78 | 5.01 | 3.05 | 3.85 | 3.29 | 2.38 | 3.54 | 4.59 | 4.31 | 4.31 | 4.69 | 3.36 | 2.21 | 3.26 | 3.84 | 3.15 |
| SD | 2.23 | 1.42 | 1.06 | 1.21 | 1.56 | 1.44 | 1.38 | 1.27 | 1.38 | 1.65 | 1.28 | 0.97 | 1.31 | 2.31 | 0.96 | 0.52 | 0.70 | 0.58 | 0.95 | 1.14 | 1.02 | 1.01 | 1.02 | 0.82 | 0.57 | 0.60 | 0.38 | 0.72 | |
| Median | 4.28 | 4.62 | 3.81 | 3.16 | 4.44 | 5.10 | 5.35 | 5.16 | 5.43 | 5.12 | 3.54 | 4.08 | 4.51 | 4.56 | 2.95 | 3.90 | 3.29 | 2.51 | 3.61 | 4.53 | 4.33 | 4.17 | 4.68 | 3.40 | 2.24 | 3.28 | 3.84 | 3.20 | |
| Inter-quartile range | 3.04 | 1.99 | 1.02 | 1.47 | 2.92 | 1.92 | 2.73 | 2.01 | 2.25 | 2.34 | 1.65 | 1.19 | 1.51 | 3.04 | 1.05 | 0.71 | 0.81 | 0.96 | 1.13 | 1.23 | 1.74 | 1.26 | 1.19 | 1.22 | 0.77 | 0.60 | 0.49 | 0.98 | |
| 95% CI | 3.06, 4.94 | 3.91, 5.22 | 3.49, 4.01 | 2.57, 3.61 | 3.37, 4.89 | 4.10, 5.42 | 4.52, 5.84 | 4.48, 5.51 | 4.64, 5.95 | 4.34, 6.12 | 2.90, 4.14 | 3.64, 4.43 | 3.92, 4.71 | 3.85, 5.35 | 2.53, 3.16 | 3.67, 4.08 | 3.07, 3.54 | 2.30, 2.91 | 3.34, 4.09 | 4.31, 4.88 | 3.82, 4.90 | 3.90, 4.52 | 4.27, 4.96 | 3.13, 3.78 | 2.05, 2.47 | 3.18, 3.56 | 3.74, 3.98 | 2.98, 3.53 | |
| Female (n = 10) | Average | 4.67 | 5.22 | 4.16 | 3.44 | 4.24 | 5.23 | 5.42 | 5.39 | 4.95 | 4.82 | 3.42 | 4.30 | 5.09 | 4.45 | 2.94 | 3.64 | 3.35 | 2.71 | 2.76 | 4.13 | 3.66 | 3.65 | 3.87 | 3.19 | 2.51 | 3.13 | 3.52 | 2.72 |
| SD | 1.49 | 1.18 | 0.77 | 1.17 | 1.02 | 1.34 | 1.75 | 1.76 | 1.09 | 1.16 | 1.00 | 0.74 | 1.42 | 1.85 | 0.39 | 0.87 | 0.74 | 0.67 | 1.51 | 1.21 | 1.16 | 1.18 | 1.04 | 1.02 | 0.74 | 0.95 | 0.61 | 0.77 | |
| Median | 4.58 | 5.29 | 4.02 | 3.21 | 4.42 | 5.20 | 4.65 | 5.30 | 4.45 | 4.66 | 2.99 | 4.22 | 5.05 | 4.50 | 2.91 | 3.33 | 3.27 | 2.75 | 2.63 | 4.23 | 3.69 | 3.24 | 3.97 | 3.24 | 2.27 | 2.92 | 3.59 | 2.52 | |
| Inter-quartile range | 1.65 | 1.37 | 0.72 | 1.41 | 0.88 | 2.04 | 3.34 | 2.63 | 2.01 | 2.05 | 1.99 | 1.04 | 1.66 | 2.43 | 0.43 | 1.06 | 0.65 | 1.06 | 1.82 | 1.73 | 1.46 | 1.96 | 1.54 | 1.07 | 1.24 | 0.81 | 1.14 | 0.53 | |
| 95% CI | 3.33, 5.77 | 4.45, 6.13 | 3.22, 4.51 | 1.86, 3.83 | 3.80, 5.60 | 4.35, 6.39 | 2.05, 5.39 | 3.96, 6.76 | 2.76, 4.77 | 3.56, 5.69 | 1.27, 3.29 | 3.59, 4.70 | 4.23, 6.16 | 3.24, 6.00 | 2.64, 3.12 | 2.45, 3.65 | 2.96, 3.72 | 2.16, 3.36 | 1.83, 3.84 | 3.45, 5.17 | 2.71, 4.86 | 1.83, 3.79 | 3.34, 4.99 | 2.58, 4.27 | 1.39, 2.62 | 1.99, 3.39 | 3.18, 4.32 | 2.04, 2.75 | |
| p-value (male vs. female) | 0.9698 | 0.4135 | 0.7524 | 0.8498 | 0.3460 | 0.5044 | 0.3460 | 0.6052 | 0.1654 | 0.6864 | 0.7910 | 0.7144 | 0.5206 | 0.6772 | 0.7428 | 0.1849 | 0.9698 | 0.2017 | 0.0597 | 0.3856 | 0.1313 | 0.1252 | 0.0614 | 0.4279 | 0.3589 | 0.3091 | 0.1082 | 0.0759 | |
| Tooth Number | 17 | 16 | 15 | 14 | 13 | 12 | 11 | 21 | 22 | 23 | 24 | 25 | 26 | 27 | 47 | 46 | 45 | 44 | 43 | 42 | 41 | 31 | 32 | 33 | 34 | 35 | 36 | 37 | |
|---|---|---|---|---|---|---|---|---|---|---|---|---|---|---|---|---|---|---|---|---|---|---|---|---|---|---|---|---|---|
| Total (n = 48) | Average | 3.41 | 3.36 | 2.69 | 2.07 | 3.63 | 4.17 | 4.41 | 4.35 | 4.22 | 3.76 | 2.21 | 2.88 | 3.18 | 3.44 | 1.41 | 2.33 | 1.89 | 1.09 | 2.09 | 3.24 | 2.84 | 2.93 | 3.31 | 1.96 | 1.08 | 1.90 | 2.25 | 1.39 |
| SD | 2.27 | 1.48 | 1.14 | 1.34 | 1.68 | 1.69 | 1.55 | 1.42 | 1.47 | 1.66 | 1.29 | 1.07 | 1.31 | 2.26 | 0.96 | 0.88 | 0.90 | 0.77 | 1.33 | 1.15 | 1.05 | 1.35 | 1.18 | 1.05 | 0.82 | 0.95 | 0.76 | 0.93 | |
| Median | 2.83 | 3.56 | 2.56 | 1.93 | 3.31 | 3.98 | 4.30 | 4.16 | 4.21 | 3.74 | 2.09 | 2.62 | 3.13 | 3.22 | 1.45 | 2.36 | 1.80 | 1.00 | 2.07 | 3.18 | 2.82 | 2.77 | 3.47 | 2.20 | 1.08 | 1.88 | 2.29 | 1.55 | |
| Inter-quartile range | 2.46 | 2.06 | 1.37 | 1.47 | 2.61 | 2.23 | 2.00 | 1.49 | 1.98 | 2.72 | 1.72 | 1.17 | 1.30 | 2.95 | 1.17 | 1.39 | 1.18 | 1.35 | 1.63 | 1.43 | 1.64 | 1.49 | 1.45 | 1.41 | 1.02 | 1.22 | 0.86 | 1.64 | |
| 95% CI | 2.05, 3.20 | 3.34, 4.19 | 2.12, 2.90 | 1.67, 2.52 | 2.72, 3.78 | 3.33, 4.55 | 3.58, 4.88 | 3.75, 4.66 | 3.57, 4.76 | 3.10, 4.36 | 1.78, 2.52 | 2.29, 2.84 | 2.85, 3.42 | 2.82, 3.99 | 1.20, 1.91 | 1.86, 2.62 | 1.42, 2.09 | 0.47, 1.30 | 1.85, 2.33 | 2.77, 3.56 | 2.33, 3.24 | 2.37, 3.10 | 3.20, 4.03 | 2.01, 2.73 | 0.91, 1.41 | 1.42, 2.38 | 2.01, 2.54 | 1.23, 2.05 | |
| Male (n = 38) | Average | 3.51 | 3.35 | 2.70 | 2.09 | 3.76 | 4.26 | 4.49 | 4.40 | 4.37 | 3.85 | 2.23 | 2.87 | 3.22 | 3.65 | 1.44 | 2.43 | 1.95 | 1.10 | 2.25 | 3.35 | 2.96 | 3.03 | 3.47 | 1.96 | 1.07 | 1.90 | 2.36 | 1.54 |
| SD | 2.37 | 1.53 | 1.20 | 1.40 | 1.79 | 1.69 | 1.37 | 1.29 | 1.36 | 1.73 | 1.35 | 1.13 | 1.33 | 2.38 | 1.00 | 0.81 | 0.88 | 0.72 | 1.23 | 1.03 | 1.01 | 1.34 | 1.15 | 1.04 | 0.83 | 0.92 | 0.72 | 0.90 | |
| Median | 2.93 | 3.43 | 2.60 | 1.84 | 3.31 | 3.98 | 4.30 | 4.16 | 4.36 | 3.89 | 2.09 | 2.62 | 3.23 | 3.45 | 1.45 | 2.49 | 1.85 | 1.00 | 2.20 | 3.27 | 2.89 | 2.91 | 3.58 | 2.21 | 1.01 | 1.95 | 2.32 | 1.75 | |
| Inter-quartile range | 3.13 | 2.40 | 1.51 | 1.61 | 3.47 | 2.08 | 1.83 | 1.26 | 1.86 | 2.76 | 1.78 | 1.39 | 1.18 | 3.34 | 1.23 | 1.38 | 1.20 | 1.34 | 1.51 | 1.36 | 1.49 | 1.31 | 1.32 | 1.04 | 1.07 | 1.20 | 0.92 | 1.38 | |
| 95% CI | 2.14, 3.34 | 3.06, 4.07 | 2.11, 3.11 | 1.44, 2.45 | 2.13, 3.65 | 3.13, 4.49 | 3.54, 4.73 | 3.75, 4.60 | 3.86, 4.91 | 2.92, 4.79 | 1.52, 2.53 | 1.96, 2.85 | 2.98, 3.69 | 3.06, 4.39 | 1.18, 1.94 | 2.04, 2.79 | 1.41, 2.16 | 0.44, 1.32 | 1.61, 2.49 | 2.94, 3.71 | 2.37, 3.38 | 2.55, 3.32 | 3.23, 4.10 | 1.99, 2.70 | 0.74, 1.39 | 1.54, 2.51 | 1.97, 2.50 | 1.53, 2.14 | |
| Female (n = 10) | Average | 3.07 | 3.42 | 2.66 | 1.98 | 3.14 | 3.83 | 4.12 | 4.19 | 3.65 | 3.42 | 2.12 | 2.90 | 2.99 | 2.65 | 1.31 | 1.94 | 1.65 | 1.03 | 1.47 | 2.83 | 2.36 | 2.55 | 2.67 | 1.99 | 1.12 | 1.93 | 1.84 | 0.83 |
| SD | 1.89 | 1.37 | 0.94 | 1.15 | 1.08 | 1.74 | 2.18 | 1.89 | 1.81 | 1.37 | 1.07 | 0.87 | 1.27 | 1.57 | 0.84 | 1.08 | 0.97 | 0.97 | 1.57 | 1.51 | 1.13 | 1.40 | 1.13 | 1.13 | 0.83 | 1.08 | 0.82 | 0.85 | |
| Median | 2.43 | 3.61 | 2.52 | 2.02 | 3.04 | 3.70 | 3.88 | 3.80 | 3.39 | 3.51 | 1.93 | 2.61 | 3.10 | 2.60 | 1.28 | 1.74 | 1.63 | 1.14 | 1.13 | 2.91 | 2.19 | 2.24 | 2.69 | 1.78 | 1.14 | 1.56 | 1.92 | 0.63 | |
| Inter-quartile range | 2.18 | 1.39 | 1.32 | 1.23 | 1.41 | 2.28 | 3.58 | 2.70 | 2.08 | 1.56 | 1.57 | 0.72 | 1.42 | 1.98 | 0.94 | 1.22 | 1.52 | 1.44 | 1.86 | 2.43 | 1.52 | 2.08 | 2.23 | 1.37 | 0.65 | 1.21 | 1.00 | 1.45 | |
| 95% CI | 0.86, 3.04 | 2.89, 4.28 | 1.83, 3.15 | 1.35, 2.81 | 2.00, 3.89 | 1.79, 4.99 | 1.52, 5.16 | 1.96, 5.02 | 1.64, 4.55 | 2.51, 4.64 | 0.84, 2.69 | 1.51, 2.92 | 2.22, 4.17 | 1.21, 3.76 | 0.73, 1.89 | 0.91, 2.36 | 0.96, 2.49 | 0.47, 1.94 | 0.12, 2.01 | 1.79, 4.22 | 1.21, 2.93 | 0.77, 2.96 | 1.79, 4.03 | 0.71, 2.51 | 0.82, 1.72 | 0.26, 2.02 | 1.26, 2.44 | 0.18, 1.26 | |
| p-value (male vs. female) | 0.6052 | 0.7620 | 0.8498 | 0.8896 | 0.3856 | 0.5537 | 0.5044 | 0.4730 | 0.2339 | 0.4885 | 0.9497 | 0.8696 | 0.7620 | 0.2643 | 0.8497 | 0.0842 | 0.4730 | 0.9095 | 0.0799 | 0.4135 | 0.1252 | 0.2151 | 0.0720 | 0.8696 | 0.9094 | 0.8896 | 0.0956 | 0.0339 * | |
| Tooth Number | 17 | 16 | 15 | 14 | 13 | 12 | 11 | 21 | 22 | 23 | 24 | 25 | 26 | 27 | 47 | 46 | 45 | 44 | 43 | 42 | 41 | 31 | 32 | 33 | 34 | 35 | 36 | 37 | |
|---|---|---|---|---|---|---|---|---|---|---|---|---|---|---|---|---|---|---|---|---|---|---|---|---|---|---|---|---|---|
| Total (n = 48) | Average | 51.89 | 65.84 | 44.89 | 45.16 | 65.94 | 52.65 | 57.31 | 57.08 | 50.89 | 64.71 | 47.72 | 44.24 | 66.06 | 55.14 | 35.33 | 59.72 | 39.07 | 34.33 | 47.79 | 39.53 | 30.10 | 32.09 | 38.14 | 45.16 | 33.91 | 39.07 | 59.76 | 32.98 |
| SD | 18.85 | 13.44 | 9.27 | 9.29 | 14.28 | 10.56 | 11.58 | 10.66 | 9.46 | 14.15 | 10.72 | 8.68 | 12.08 | 18.27 | 9.20 | 8.64 | 6.10 | 4.88 | 8.38 | 6.96 | 5.85 | 6.48 | 6.00 | 7.61 | 6.34 | 5.05 | 6.98 | 6.50 | |
| Median | 47.63 | 64.51 | 45.45 | 42.67 | 61.96 | 52.97 | 55.17 | 55.29 | 49.89 | 62.93 | 46.91 | 44.08 | 64.60 | 53.38 | 37.55 | 58.88 | 37.78 | 33.34 | 47.49 | 38.61 | 31.20 | 31.58 | 37.09 | 45.03 | 32.94 | 38.55 | 59.80 | 32.83 | |
| Inter-quartile range | 18.41 | 14.89 | 11.56 | 14.97 | 19.57 | 13.61 | 14.41 | 13.27 | 12.49 | 18.48 | 10.68 | 12.68 | 18.34 | 19.72 | 13.09 | 10.58 | 7.99 | 6.27 | 12.66 | 10.27 | 8.67 | 9.72 | 8.79 | 10.41 | 7.18 | 5.56 | 10.59 | 8.50 | |
| 95% CI | 41.43, 50.64 | 61.80, 69.06 | 43.75, 50.40 | 36.45, 44.34 | 54.77, 67.13 | 50.97, 56.95 | 50.23, 58.44 | 50.37, 57.14 | 47.08, 54.23 | 56.51, 67.10 | 44.63, 50.50 | 40.26, 47.83 | 59.23, 68.45 | 48.08, 59.33 | 35.40, 44.02 | 57.06, 61.37 | 34.19, 39.66 | 31.01, 35.05 | 44.69, 50.05 | 35.08, 41.20 | 29.62, 34.89 | 28.96, 33.70 | 33.54, 38.76 | 41.11, 47.68 | 31.77, 34.68 | 37.19, 39.41 | 57.84, 62.51 | 30.98, 34.55 | |
| Male (n = 38) | Average | 53.01 | 65.83 | 45.70 | 45.85 | 68.12 | 53.23 | 58.42 | 58.17 | 51.80 | 66.63 | 48.30 | 44.30 | 66.77 | 56.85 | 36.54 | 60.71 | 39.41 | 33.84 | 49.16 | 40.00 | 30.83 | 32.75 | 38.79 | 46.19 | 33.55 | 38.60 | 60.56 | 33.96 |
| SD | 20.49 | 14.43 | 9.30 | 9.66 | 14.67 | 11.16 | 10.81 | 9.98 | 9.58 | 14.54 | 11.29 | 8.48 | 12.64 | 19.64 | 9.48 | 8.16 | 5.71 | 4.55 | 7.94 | 6.97 | 5.60 | 6.36 | 6.01 | 7.21 | 6.48 | 4.79 | 6.52 | 6.07 | |
| Median | 48.29 | 64.51 | 45.53 | 44.87 | 67.93 | 53.05 | 55.17 | 57.02 | 50.93 | 63.88 | 48.06 | 43.41 | 64.60 | 55.40 | 39.00 | 59.57 | 38.95 | 33.34 | 49.24 | 39.78 | 31.65 | 32.13 | 37.63 | 47.80 | 32.94 | 38.43 | 60.23 | 33.54 | |
| Inter-quartile range | 18.83 | 18.78 | 12.18 | 15.11 | 24.22 | 13.88 | 13.52 | 10.50 | 11.30 | 21.17 | 12.79 | 10.39 | 20.46 | 22.54 | 12.79 | 7.59 | 7.58 | 5.33 | 13.32 | 10.21 | 7.06 | 7.63 | 7.28 | 9.69 | 8.97 | 5.66 | 9.17 | 9.13 | |
| 95% CI | 41.66, 51.86 | 62.02, 70.60 | 43.06, 50.60 | 39.58, 48.79 | 63.32, 79.01 | 49.20, 57.23 | 49.47, 58.40 | 52.27, 60.26 | 47.58, 53.32 | 55.66, 67.38 | 46.55, 52.36 | 38.61, 46.49 | 57.75, 68.60 | 49.27, 64.56 | 37.85, 44.45 | 57.59, 61.34 | 35.65, 41.34 | 31.12, 35.05 | 46.51, 52.90 | 35.68, 43.55 | 30.47, 34.97 | 29.10, 34.26 | 34.51, 39.15 | 46.10, 52.60 | 31.57, 35.12 | 36.96, 39.51 | 58.26, 63.32 | 30.68, 35.34 | |
| Female (n = 10) | Average | 47.61 | 65.87 | 41.81 | 42.55 | 57.65 | 50.46 | 53.08 | 52.93 | 47.41 | 57.43 | 45.53 | 44.02 | 63.34 | 48.62 | 30.76 | 55.95 | 37.76 | 36.18 | 42.58 | 37.72 | 27.28 | 29.60 | 35.66 | 41.25 | 35.28 | 40.86 | 56.72 | 29.26 |
| SD | 10.16 | 9.28 | 8.96 | 7.62 | 9.20 | 7.94 | 13.95 | 12.66 | 8.59 | 10.10 | 8.32 | 9.86 | 9.78 | 9.81 | 6.60 | 9.78 | 7.61 | 5.85 | 8.34 | 6.95 | 6.21 | 6.66 | 5.55 | 8.20 | 5.92 | 5.86 | 8.16 | 7.05 | |
| Median | 46.97 | 65.47 | 41.15 | 41.22 | 58.58 | 50.94 | 53.25 | 51.70 | 43.75 | 57.19 | 44.43 | 45.02 | 64.30 | 48.51 | 29.74 | 52.04 | 35.51 | 34.87 | 40.47 | 37.22 | 23.41 | 26.96 | 33.15 | 39.73 | 33.02 | 39.00 | 53.27 | 29.40 | |
| Inter-quartile range | 16.87 | 13.11 | 13.47 | 7.40 | 9.09 | 9.32 | 21.95 | 17.51 | 10.83 | 15.86 | 11.20 | 17.49 | 13.40 | 8.89 | 10.22 | 6.83 | 4.43 | 7.67 | 10.39 | 10.31 | 11.01 | 9.63 | 10.98 | 12.59 | 6.53 | 4.16 | 10.79 | 9.48 | |
| 95% CI | 35.17, 53.57 | 60.28, 73.39 | 34.39, 48.29 | 34.51, 45.54 | 52.03, 63.73 | 44.68, 57.31 | 45.52, 67.47 | 40.71, 61.65 | 32.15, 46.12 | 50.17, 66.95 | 39.89, 51.17 | 36.93, 55.63 | 58.31, 72.80 | 42.10, 54.81 | 23.38, 34.39 | 40.45, 55.46 | 26.66, 37.84 | 30.81, 38.53 | 33.55, 44.46 | 31.36, 41.88 | 12.58, 24.04 | 19.22, 29.17 | 23.95, 34.99 | 30.06, 45.58 | 27.32, 35.52 | 34.37, 40.68 | 43.35, 55.54 | 26.65, 36.22 | |
| p-value (male vs. female) | 0.6229 | 0.5878 | 0.3091 | 0.3721 | 0.0932 | 0.6229 | 0.2975 | 0.1252 | 0.1252 | 0.0886 | 0.3994 | 0.9899 | 0.5878 | 0.2643 | 0.0466 * | 0.0331 * | 0.2339 | 0.3091 | 0.0294 * | 0.2975 | 0.1313 | 0.1137 | 0.1193 | 0.0842 | 0.5370 | 0.4279 | 0.1137 | 0.0351 * | |
| Maxilla | Mandible | |||||||||||||||
|---|---|---|---|---|---|---|---|---|---|---|---|---|---|---|---|---|
| Study | Country | Value | Ci | Li | Ca | P1 | P2 | M1 | M2 | Ci | Li | Ca | P1 | P2 | M1 | M2 |
| Bowers (1963) [4] (AG) | Denmark | Mean (right/left quadrant) | 4.7 4.6 | 5.2 5.1 | 4.0 3.8 | 3.6 3.5 | 4.1 4.2 | 4.1 4.2 | 3.9 4.1 | 2.9 2.7 | 3.5 3.3 | 2.0 2.1 | 2.0 2.0 | 2.5 2.5 | 2.8 2.7 | 2.3 2.2 |
| Ainamo and Loë (1966) [1] (AG) | U.S. | In case of GM on enamel Mean (range) | 3.5 (0–6) | 4.5 (2–7) | 2.7 (0–6) | 1.9 (0–6) | 2.7 (1–5) | 3.0 (1–6) | 2.9 (0–5) | 3.3 (1–6) | 3.9 (1–6) | 2.6 (1–5) | 1.8 (0–4) | 2.1 (1–4) | 2.4 (0–4) | 1.9 (0–3) |
| In case of GM on cementum Mean (range) | 4.3 (0–6) | 4.3 (0–6) | 2.9 (0–6) | 2.2 (1–4) | 2.4 (1–5) | 2.1 (0–3) | 2.3 (1–4) | 2.9 (1–5) | 3.6 (2–6) | 2.4 (0–4) | 1.8 (0–6) | 1.7 (1–4) | 2.0 (1–4) | 2.0 (1–3) | ||
| Shirmohammadi, Faramarzi, Lafzi (2008) [21] (KG/AG) | Iran | KG Mean ± SD (right/left quadrant) | 6.24 ± 1.60 6.21 ± 1.75 | 6.93 ± 1.80 6.50 ± 1.64 | 5.99 ± 1.97 6.03 ± 1.90 | 4.77 ± 1.48 5.01 ± 1.71 | 5.04 ± 1.34 4.88 ± 1.42 | 5.70 ± 1.49 5.33 ± 1.38 | 5.67 ± 1.54 5.45 ± 1.49 | 4.33 ± 1.74 4.36 ± 1.66 | 4.46 ± 1.81 4.67 ± 1.73 | 4.16 ± 1.83 3.91 ± 1.78 | 3.43 ± 1.56 3.31 ± 1.45 | 3.64 ± 1.45 3.67 ± 1.46 | 4.02 ± 1.21 3.87 ± 1.22 | 3.94 ± 1.31 3.98 ± 1.35 |
| AG Mean ± SD (right/left quadrant) | 5.20 ± 1.96 5.11 ± 1.90 | 5.86 ± 1.22 5.45 ± 1.92 | 4.98 ± 1.97 5.01 ± 2.01 | 3.76 ± 1.47 3.83 ± 1.68 | 4.08 ± 1.53 3.85 ± 1.35 | 4.50 ± 1.43 4.83 ± 1.60 | 4.52 ± 1.64 4.42 ± 1.73 | 3.53 ± 1.69 3.64 ± 1.75 | 3.52 ± 1.86 3.90 ± 1.72 | 3.17 ± 1.83 3.11 ± 1.56 | 2.37 ± 1.45 2.42 ± 1.62 | 2.50 ± 1.19 2.72 ± 1.51 | 2.91 ± 1.32 3.01 ± 1.47 | 2.80 ± 1.29 3.01 ± 1.59 | ||
| Bhatia et al. (2015) [22] (AG) | India | 15-30 years old Mean ± SD (with/without histochemical staining) | 4.07 ± 1.08 3.85 ± 0.71 (incisors) | 3.8 ± 1.25 3.75 ± 0.95 (canine) | 1.92 ± 0.65 2.07 ± 0.73 (premolars) | 2.67 ± 0.74 2.8 ± 0.88 (molars) | 3.22 ± 0.98 3.12 ± 072 (incisors) | 2.45 ± 1.06 2.65 ± 0.94 (canine) | 1.5 ± 0.47 1.67 ± 0.31 (premolars) | 1.65 ± 0.31 1.92 ± 0.48 (molars) | ||||||
| 31-45 years old Mean ± SD (with/without histochemical staining) | 3.3 ± 0.58 3.62 ± 0.84 | 2.8 ± 0.71 2.95 ± 0.98 | 2.07 ± 0.65 2.32 ± 0.75 | 2.22 ± 0.47 2.42 ± 0.57 | 3.22 ± 0.73 3.05 ± 0.76 | 1.8 ± 0.48 1.7 ± 0.42 | 1.52 ± 0.59 1.47 ± 0.38 | 1.97 ± 0.65 2.1 ± 0.71 | ||||||||
| 46-60 years old Mean ± SD (with/without histochemical staining) | 3.75 ± 0.48 3.62 ± 0.47 | 2.8 ± 0.82 2.75 ± 1.03 | 2.57 ± 0.61 2.55 ± 0.62 | 2.47 ± 0.62 2.52 ± 0.67 | 3.2 ± 0.81 3.12 ± 0.77 | 2.05 ± 0.89 2.03 ± 0.94 | 1.77 ± 0.29 1.75 ± 0.31 | 1.95 ± 0.55 2.07 ± 0.57 | ||||||||
| Adesola et al. (2018) [20] (AG) | Nigeria | Mean ± SD (right/left quadrant) | 4.86 ± 1.81 4.70 ± 1.64 | 4.39 ± 1.80 4.39 ± 1.90 | 3.92 ± 1.55 3.53 ± 1.46 | 3.28 ± 1.49 3.21 ± 1.43 | 3.40 ± 1.60 3.23 ± 1.54 | 3.36 ± 1.71 3.52 ± 1.67 | - | 3.19 ± 1.15 3.18 ± 1.07 | 3.35 ± 1.23 3.35 ± 1.23 | 2.51 ± 1.17 2.51 ± 1.17 | 2.27 ± 1.17 2.18 ± 1.01 | 2.78 ± 1.09 2.49 ± 0.93 | 3.15 ± 1.11 3.16 ± 0.94 | - |
References
- Ainamo, J.; Loe, H. Anatomical characteristics of gingiva. A clinical and microscopic study of the free and attached gingiva. J. Periodontol. 1966, 37, 5–13. [Google Scholar] [CrossRef] [PubMed]
- Lang, N.P.; Loe, H. The relationship between the width of keratinized gingiva and gingival health. J. Periodontol. 1972, 43, 623–627. [Google Scholar] [CrossRef] [PubMed]
- Miyasato, M.; Crigger, M.; Egelberg, J. Gingival condition in areas of minimal and appreciable width of keratinized gingiva. J. Clin. Periodontol. 1977, 4, 200–209. [Google Scholar] [CrossRef] [PubMed]
- Bowers, G.M. A study of the width of attached gingiva. J. Periodontol. 1963, 34, 201–209. [Google Scholar] [CrossRef]
- Ochsenbein, C. Newer concepts of mucogingival surgery. J. Periodontol. 1960, 31, 175–185. [Google Scholar] [CrossRef]
- Friedman, N.; Levine, H.L. Mucogingival surgery: Current status. J. Periodontol. 1964, 35, 5–21. [Google Scholar] [CrossRef]
- Dorfman, H.S.; Kennedy, J.E.; Bird, W.C. Longitudinal evaluation of free autogenous gingival grafts. J. Clin. Periodontol. 1980, 7, 316–324. [Google Scholar] [CrossRef]
- Agudio, G.; Cortellini, P.; Buti, J.; Pini Prato, G. Periodontal conditions of sites treated with gingival augmentation surgery compared with untreated contralateral homologous sites: An 18- to 35-year long-term study. J. Periodontol. 2016, 87, 1371–1378. [Google Scholar] [CrossRef]
- Kim, D.M.; Bassir, S.H.; Nguyen, T.T. Effect of gingival phenotype on the maintenance of periodontal health: An american academy of periodontology best evidence review. J. Periodontol. 2020, 91, 311–338. [Google Scholar] [CrossRef]
- Hefti, A.F. Periodontal probing. Crit. Rev. Oral Biol. Med. 1997, 8, 336–356. [Google Scholar] [CrossRef]
- Guglielmoni, P.; Promsudthi, A.; Tatakis, D.N.; Trombelli, L. Intra- and inter-examiner reproducibility in keratinized tissue width assessment with 3 methods for mucogingival junction determination. J. Periodontol. 2001, 72, 134–139. [Google Scholar] [CrossRef] [PubMed]
- Padmini, H.; Raja, K.K.; Hoe, Z.Y.; Teh, Y.J.; Ting, C.J. Correlation of width of attached gingiva, depth of the vestibule on gingival health and oral hygiene maintenance in malaysian young adults. J. Clin. Diagn. Res. 2018, 12, 39–44. [Google Scholar] [CrossRef]
- Tenenbaum, H. A clinical study comparing the width of attached gingiva and the prevalence of gingival recessions. J. Clin. Periodontol. 1982, 9, 86–92. [Google Scholar] [CrossRef] [PubMed]
- Fageeh, H.N.; Meshni, A.A.; Jamal, H.A.; Preethanath, R.S.; Halboub, E. The accuracy and reliability of digital measurements of gingival recession versus conventional methods. BMC Oral Health 2019, 19, 154. [Google Scholar]
- Lee, J.S.; Jeon, Y.S.; Strauss, F.J.; Jung, H.I.; Gruber, R. Digital scanning is more accurate than using a periodontal probe to measure the keratinized tissue width. Sci. Rep. 2020, 10, 3665. [Google Scholar] [CrossRef]
- Van Kirk, L.E., Jr. Assessment of malocclusion in population groups. Am. J. Public Health Nations Health 1959, 49, 1157–1163. [Google Scholar] [CrossRef]
- Silness, J.; Löe, H. Periodontal disease in pregnancy ii. Correlation between oral hygiene and periodontal condition. Acta Odontol. Scand. 1964, 22, 121–135. [Google Scholar] [CrossRef]
- Loe, H.; Silness, J. Periodontal disease in pregnancy. I. Prevalence and severity. Acta Odontol. Scand. 1963, 21, 533–551. [Google Scholar] [CrossRef] [PubMed]
- Muller, M.P.; Tomlinson, G.; Marrie, T.J.; Tang, P.; McGeer, A.; Low, D.E.; Detsky, A.S.; Gold, W.L. Can routine laboratory tests discriminate between severe acute respiratory syndrome and other causes of community-acquired pneumonia? Clin. Infect. Dis. 2005, 40, 1079–1086. [Google Scholar] [CrossRef] [PubMed]
- Adesola, U.K.; Okhiabigie, A.P.; Adeola, A.; Omowunmi, A.P.; Ayodeji, T.O. Evaluation of the attached gingival width and sulcus depth in an adult nigerian population—A pilot study. J. Int. Acad. Periodontol. 2018, 20, 78–85. [Google Scholar]
- Shirmohammadi, A.; Faramarzie, M.; Lafzi, A. A clinical evaluation of anatomic features of gingiva in dental students in tabriz, iran. J. Dent. Res. Dent. Clin. Dent. Prospect. 2008, 2, 90–94. [Google Scholar]
- Bhatia, G.; Kumar, A.; Khatri, M.; Bansal, M.; Saxena, S. Assessment of the width of attached gingiva using different methods in various age groups: A clinical study. J. Indian Soc. Periodontol. 2015, 19, 199–202. [Google Scholar] [CrossRef]
- Chrysanthakopoulos, N.A. Aetiology and severity of gingival recession in an adult population sample in greece. Dent. Res. J. (Isfahan) 2011, 8, 64–70. [Google Scholar]
- Marini, M.G.; Greghi, S.L.; Passanezi, E.; Sant’ana, A.C. Gingival recession: Prevalence, extension and severity in adults. J. Appl. Oral Sci. 2004, 12, 250–255. [Google Scholar] [CrossRef] [PubMed]
- Romandini, M.; Soldini, M.C.; Montero, E.; Sanz, M. Epidemiology of mid-buccal gingival recessions in nhanes according to the 2018 world workshop classification system. J. Clin. Periodontol. 2020, 47, 1180–1190. [Google Scholar] [CrossRef]
- Ainamo, A.; Ainamo, J.; Poikkeus, R. Continuous widening of the band of attached gingiva from 23 to 65 years of age. J. Periodontal. Res. 1981, 16, 595–599. [Google Scholar] [CrossRef]
- Zweers, J.; Thomas, R.Z.; Slot, D.E.; Weisgold, A.S.; Van der Weijden, F.G. Characteristics of periodontal biotype, its dimensions, associations and prevalence: A systematic review. J. Clin. Periodontol. 2014, 41, 958–971. [Google Scholar] [CrossRef]
- Sharma, S.; Thakur, S.L.; Joshi, S.K.; Kulkarni, S.S. Measurement of gingival thickness using digital vernier caliper and ultrasonographic method: A comparative study. J. Investig. Clin. Dent. 2014, 5, 138–143. [Google Scholar] [CrossRef]


| Jaw | Maxilla | Mandible | |||||||||||||
|---|---|---|---|---|---|---|---|---|---|---|---|---|---|---|---|
| Tooth type | Ci | Li | Ca | P1 | P2 | M1 | M2 | Ci | Li | Ca | P1 | P2 | M1 | M2 | |
| Total (n = 48) | Mean | 5.60 | 5.49 | 4.87 | 3.50 | 4.14 | 4.91 | 4.88 | 4.17 | 4.50 | 3.35 | 2.36 | 3.27 | 3.79 | 3.04 |
| SD | 1.36 | 1.29 | 1.36 | 1.05 | 0.86 | 1.25 | 1.93 | 0.99 | 1.04 | 0.93 | 0.54 | 0.61 | 0.45 | 0.73 | |
| Median | 5.17 | 5.33 | 4.88 | 3.39 | 3.95 | 4.63 | 4.56 | 4.18 | 4.52 | 3.34 | 2.37 | 3.28 | 3.78 | 2.90 | |
| Inter-quartile range | 2.22 | 2.01 | 1.87 | 1.45 | 1.31 | 1.74 | 2.57 | 1.41 | 1.16 | 1.16 | 0.70 | 0.72 | 0.68 | 0.94 | |
| 95% CI | 4.64, 5.51 | 4.80, 5.87 | 4.44, 5.75 | 2.95, 3.75 | 3.62, 4.18 | 4.04, 4.99 | 3.98, 5.23 | 4.01, 4.37 | 4.25, 4.80 | 3.00, 3.57 | 2.18, 2.55 | 3.15, 3.52 | 3.60, 3.86 | 2.51, 3.10 | |
| Male (n = 38) | Mean | 5.65 | 5.59 | 4.96 | 3.51 | 4.12 | 4.85 | 4.97 | 4.31 | 4.64 | 3.45 | 2.29 | 3.28 | 3.84 | 3.10 |
| SD | 1.27 | 1.33 | 1.44 | 1.07 | 0.91 | 1.27 | 2.02 | 0.91 | 1.01 | 0.83 | 0.50 | 0.56 | 0.38 | 0.77 | |
| Median | 5.23 | 5.40 | 5.00 | 3.43 | 3.83 | 4.47 | 4.56 | 4.24 | 4.52 | 3.42 | 2.35 | 3.28 | 3.80 | 3.08 | |
| Inter-quartile range | 2.22 | 1.95 | 2.50 | 1.45 | 1.41 | 1.79 | 2.68 | 1.30 | 1.03 | 1.08 | 0.80 | 0.61 | 0.54 | 0.97 | |
| 95% CI | 4.65, 5.63 | 4.90, 6.02 | 4.55, 5.87 | 2.96, 3.80 | 3.33, 4.00 | 4.01, 4.73 | 3.91, 5.10 | 4.00, 4.46 | 4.17, 4.77 | 3.00, 3.61 | 2.13, 2.54 | 3.05, 3.50 | 3.60, 3.87 | 2.77, 3.42 | |
| Female (n = 10) | Mean | 5.40 | 5.09 | 4.53 | 3.43 | 4.23 | 5.16 | 4.56 | 3.66 | 4.00 | 2.98 | 2.61 | 3.24 | 3.58 | 2.83 |
| SD | 1.71 | 1.13 | 0.96 | 1.03 | 0.63 | 1.22 | 1.58 | 1.13 | 1.08 | 1.22 | 0.65 | 0.79 | 0.65 | 0.53 | |
| Median | 4.98 | 5.07 | 4.14 | 3.06 | 3.99 | 5.23 | 4.37 | 3.36 | 4.21 | 2.76 | 2.41 | 3.17 | 3.40 | 2.66 | |
| Inter-quartile range | 2.53 | 1.93 | 1.76 | 1.85 | 1.08 | 1.68 | 2.18 | 1.63 | 1.62 | 1.35 | 1.17 | 0.64 | 1.01 | 0.26 | |
| 95% CI | 2.85, 6.07 | 4.15, 6.17 | 2.84, 4.60 | 1.57, 3.54 | 3.18, 4.26 | 4.67, 6.39 | 2.95, 5.58 | 2.07, 4.01 | 3.66, 5.41 | 1.86, 3.52 | 1.57, 2.75 | 3.01, 3.65 | 2.72, 3.73 | 2.35, 2.81 | |
| p-value (male vs. female) | 0.5044 | 0.3091 | 0.4279 | 0.9597 | 0.4885 | 0.4730 | 0.6957 | 0.0932 | 0.1581 | 0.1030 | 0.3334 | 0.5205 | 0.0932 | 0.1692 | |
| Jaw | Maxilla | Mandible | |||||||||||||
|---|---|---|---|---|---|---|---|---|---|---|---|---|---|---|---|
| Tooth type | Ci | Li | Ca | P1 | P2 | M1 | M2 | Ci | Li | Ca | P1 | P2 | M1 | M2 | |
| Total (n = 48) | Mean | 4.38 | 4.19 | 3.69 | 2.14 | 2.79 | 3.27 | 3.43 | 2.88 | 3.27 | 2.03 | 1.08 | 1.90 | 2.29 | 1.40 |
| SD | 1.42 | 1.44 | 1.48 | 1.16 | 0.98 | 1.22 | 2.00 | 1.11 | 1.07 | 1.10 | 0.72 | 0.78 | 0.70 | 0.84 | |
| Median | 4.35 | 3.98 | 3.62 | 1.85 | 2.56 | 3.25 | 3.35 | 2.91 | 3.45 | 2.11 | 1.07 | 1.78 | 2.27 | 1.42 | |
| Inter-quartile range | 1.63 | 1.87 | 2.04 | 1.21 | 1.26 | 1.70 | 2.13 | 1.41 | 1.32 | 1.62 | 1.06 | 1.07 | 1.00 | 1.42 | |
| 95% CI | 4.08, 4.95 | 3.31, 4.29 | 3.01, 4.26 | 1.38, 2.12 | 2.25, 2.75 | 2.79, 3.67 | 3.04, 4.14 | 2.62, 3.35 | 3.23, 3.92 | 1.80, 2.55 | 0.79, 1.38 | 1.45, 1.97 | 1.99, 2.43 | 1.22, 1.71 | |
| Male (n = 38) | Mean | 4.44 | 4.31 | 3.80 | 2.16 | 2.79 | 3.28 | 3.58 | 2.99 | 3.41 | 2.10 | 1.08 | 1.92 | 2.40 | 1.49 |
| SD | 1.26 | 1.37 | 1.56 | 1.20 | 1.04 | 1.27 | 2.10 | 1.07 | 0.98 | 1.04 | 0.71 | 0.75 | 0.64 | 0.84 | |
| Median | 4.38 | 3.98 | 3.71 | 1.85 | 2.56 | 3.21 | 3.37 | 2.99 | 3.47 | 2.20 | 1.01 | 1.85 | 2.28 | 1.58 | |
| Inter-quartile range | 1.21 | 1.61 | 2.40 | 1.24 | 1.26 | 1.69 | 2.01 | 1.31 | 1.22 | 1.35 | 1.08 | 0.93 | 0.95 | 1.15 | |
| 95% CI | 4.06, 5.00 | 3.11, 4.25 | 2.92, 4.52 | 1.19, 2.13 | 2.14, 2.85 | 2.73, 3.63 | 2.99, 3.77 | 2.65, 3.47 | 3.18, 3.92 | 1.96, 2.55 | 0.60, 1.37 | 1.56, 2.09 | 1.84, 2.35 | 1.36, 2.03 | |
| Female (n = 10) | Mean | 4.15 | 3.74 | 3.28 | 2.05 | 2.78 | 3.21 | 2.86 | 2.46 | 2.75 | 1.73 | 1.08 | 1.79 | 1.89 | 1.07 |
| SD | 1.99 | 1.64 | 1.06 | 1.08 | 0.73 | 1.03 | 1.53 | 1.20 | 1.27 | 1.30 | 0.81 | 0.91 | 0.81 | 0.75 | |
| Median | 3.73 | 3.63 | 3.02 | 1.99 | 2.61 | 3.52 | 2.37 | 2.11 | 2.71 | 1.49 | 1.22 | 1.48 | 1.87 | 1.16 | |
| Inter-quartile range | 2.69 | 2.79 | 1.54 | 1.09 | 1.37 | 1.76 | 2.83 | 1.77 | 1.76 | 1.64 | 0.70 | 1.15 | 0.99 | 0.96 | |
| 95% CI | 2.04, 4.85 | 1.88, 4.66 | 1.83, 3.60 | 1.10, 2.72 | 1.76, 3.13 | 3.07, 4.84 | 0.50, 3.33 | 0.88, 2.65 | 1.59, 3.66 | 0.68, 2.32 | 0.81, 1.90 | 0.48, 1.86 | 1.39, 2.47 | 0.83, 1.85 | |
| p-value (male vs. female) | 0.4730 | 0.3589 | 0.3721 | 0.9698 | 0.8105 | 0.9698 | 0.4426 | 0.1442 | 0.1581 | 0.2751 | 0.9095 | 0.3994 | 0.0886 | 0.1476 | |
| Jaw | Maxilla | Mandible | |||||||||||||
|---|---|---|---|---|---|---|---|---|---|---|---|---|---|---|---|
| Tooth type | Ci | Li | Ca | P1 | P2 | M1 | M2 | Ci | Li | Ca | P1 | P2 | M1 | M2 | |
| Total (n = 48) | Mean | 57.19 | 51.77 | 65.33 | 46.44 | 44.57 | 65.95 | 53.51 | 31.09 | 38.83 | 46.48 | 34.12 | 39.07 | 59.74 | 34.16 |
| SD | 10.78 | 9.20 | 13.06 | 9.01 | 8.14 | 11.77 | 15.82 | 5.92 | 6.03 | 7.47 | 4.94 | 4.85 | 7.12 | 6.97 | |
| Median | 54.76 | 50.40 | 63.74 | 45.78 | 43.42 | 64.14 | 51.70 | 31.71 | 37.85 | 46.85 | 33.61 | 37.50 | 58.82 | 33.49 | |
| Inter-quartile range | 12.39 | 12.54 | 15.40 | 13.69 | 12.75 | 16.86 | 17.62 | 9.15 | 9.47 | 10.88 | 5.89 | 5.95 | 9.35 | 11.00 | |
| 95% CI | 49.43, 56.93 | 47.00, 53.43 | 57.33, 68.89 | 41.83, 49.58 | 37.93, 46.50 | 57.87, 69.47 | 45.85, 57.06 | 30.23, 35.03 | 35.21, 38.72 | 44.01, 48.91 | 32.44, 35.34 | 34.96, 38.25 | 56.54, 60.98 | 30.40, 35.37 | |
| Male (n = 38) | Mean | 58.30 | 52.52 | 67.37 | 47.07 | 45.00 | 66.30 | 54.93 | 31.79 | 39.40 | 47.68 | 33.69 | 39.00 | 60.63 | 35.25 |
| SD | 9.99 | 9.56 | 13.28 | 9.36 | 8.20 | 12.57 | 17.03 | 5.77 | 5.96 | 7.11 | 4.76 | 4.45 | 6.45 | 6.85 | |
| Median | 55.24 | 50.89 | 66.91 | 47.68 | 43.42 | 63.08 | 52.35 | 32.01 | 38.12 | 48.49 | 33.02 | 38.17 | 60.11 | 34.49 | |
| Inter-quartile range | 11.89 | 12.61 | 18.69 | 13.91 | 11.70 | 18.48 | 19.25 | 8.90 | 10.51 | 9.53 | 5.64 | 6.62 | 7.69 | 10.25 | |
| 95% CI | 49.28, 57.86 | 47.03, 54.18 | 62.85, 74.17 | 44.52, 52.28 | 38.66, 46.19 | 55.61, 67.47 | 45.96, 58.47 | 30.24, 34.93 | 34.64, 38.88 | 46.48, 51.70 | 31.13, 34.69 | 36.03, 39.59 | 57.62, 62.10 | 30.48, 36.05 | |
| Female (n = 10) | Mean | 53.00 | 48.94 | 57.54 | 44.04 | 42.91 | 64.61 | 48.11 | 28.44 | 36.69 | 41.91 | 35.73 | 39.31 | 56.34 | 30.01 |
| SD | 13.10 | 7.46 | 8.97 | 7.48 | 8.12 | 8.47 | 8.64 | 6.01 | 6.12 | 7.41 | 5.52 | 6.43 | 8.83 | 6.04 | |
| Median | 53.37 | 48.34 | 57.88 | 41.98 | 43.49 | 64.50 | 47.84 | 25.16 | 35.33 | 39.91 | 34.17 | 36.74 | 52.65 | 27.61 | |
| Inter-quartile range | 19.69 | 10.88 | 13.42 | 6.12 | 13.63 | 13.77 | 17.19 | 10.55 | 11.17 | 11.63 | 6.14 | 4.62 | 8.75 | 6.46 | |
| 95% CI | 42.61, 66.24 | 41.10, 54.03 | 51.46, 65.10 | 34.53, 44.87 | 36.61, 51.53 | 57.20, 71.89 | 39.20, 56.39 | 16.06, 26.81 | 27.43, 38.59 | 33.15, 44.78 | 28.63, 36.71 | 30.07, 38.17 | 41.05, 55.42 | 21.73, 29.31 | |
| p-value (male vs. female) | 0.2151 | 0.3211 | 0.0371 * | 0.3460 | 0.5370 | 0.8696 | 0.2438 | 0.0886 | 0.1510 | 0.0331 * | 0.4279 | 0.4885 | 0.0466 * | 0.0246 * | |
| Parameter | AUC | Cut-off Value | Sensitivity | Specificity | Accuracy |
|---|---|---|---|---|---|
| The area of KG on the mandibular second molar | 0.74 | 31.56 mm2 | 0.7 | 0.74 | 0.73 |
| The area of KG on the mandibular canine | 0.73 | 40.47 mm2 | 0.6 | 0.89 | 0.83 |
| The area of KG on the maxillary canine | 0.72 | 64.44 mm2 | 0.8 | 0.55 | 0.6 |
| The area of KG on the mandibular first molar | 0.71 | 53.10 mm2 | 0.6 | 0.89 | 0.83 |
Publisher’s Note: MDPI stays neutral with regard to jurisdictional claims in published maps and institutional affiliations. |
© 2021 by the authors. Licensee MDPI, Basel, Switzerland. This article is an open access article distributed under the terms and conditions of the Creative Commons Attribution (CC BY) license (https://creativecommons.org/licenses/by/4.0/).
Share and Cite
Lim, H.-C.; Lee, J.; Kang, D.-Y.; Cho, I.-W.; Shin, H.-S.; Park, J.-C. Digital Assessment of Gingival Dimensions of Healthy Periodontium. J. Clin. Med. 2021, 10, 1550. https://doi.org/10.3390/jcm10081550
Lim H-C, Lee J, Kang D-Y, Cho I-W, Shin H-S, Park J-C. Digital Assessment of Gingival Dimensions of Healthy Periodontium. Journal of Clinical Medicine. 2021; 10(8):1550. https://doi.org/10.3390/jcm10081550
Chicago/Turabian StyleLim, Hyun-Chang, Jaemin Lee, Dae-Young Kang, In-Woo Cho, Hyun-Seung Shin, and Jung-Chul Park. 2021. "Digital Assessment of Gingival Dimensions of Healthy Periodontium" Journal of Clinical Medicine 10, no. 8: 1550. https://doi.org/10.3390/jcm10081550
APA StyleLim, H.-C., Lee, J., Kang, D.-Y., Cho, I.-W., Shin, H.-S., & Park, J.-C. (2021). Digital Assessment of Gingival Dimensions of Healthy Periodontium. Journal of Clinical Medicine, 10(8), 1550. https://doi.org/10.3390/jcm10081550