
AF Inducibility Is Related to Conduction Abnormalities at Bachmann’s Bundle


Abstract
:1. Introduction
2. Materials and Methods
2.1. Study Population
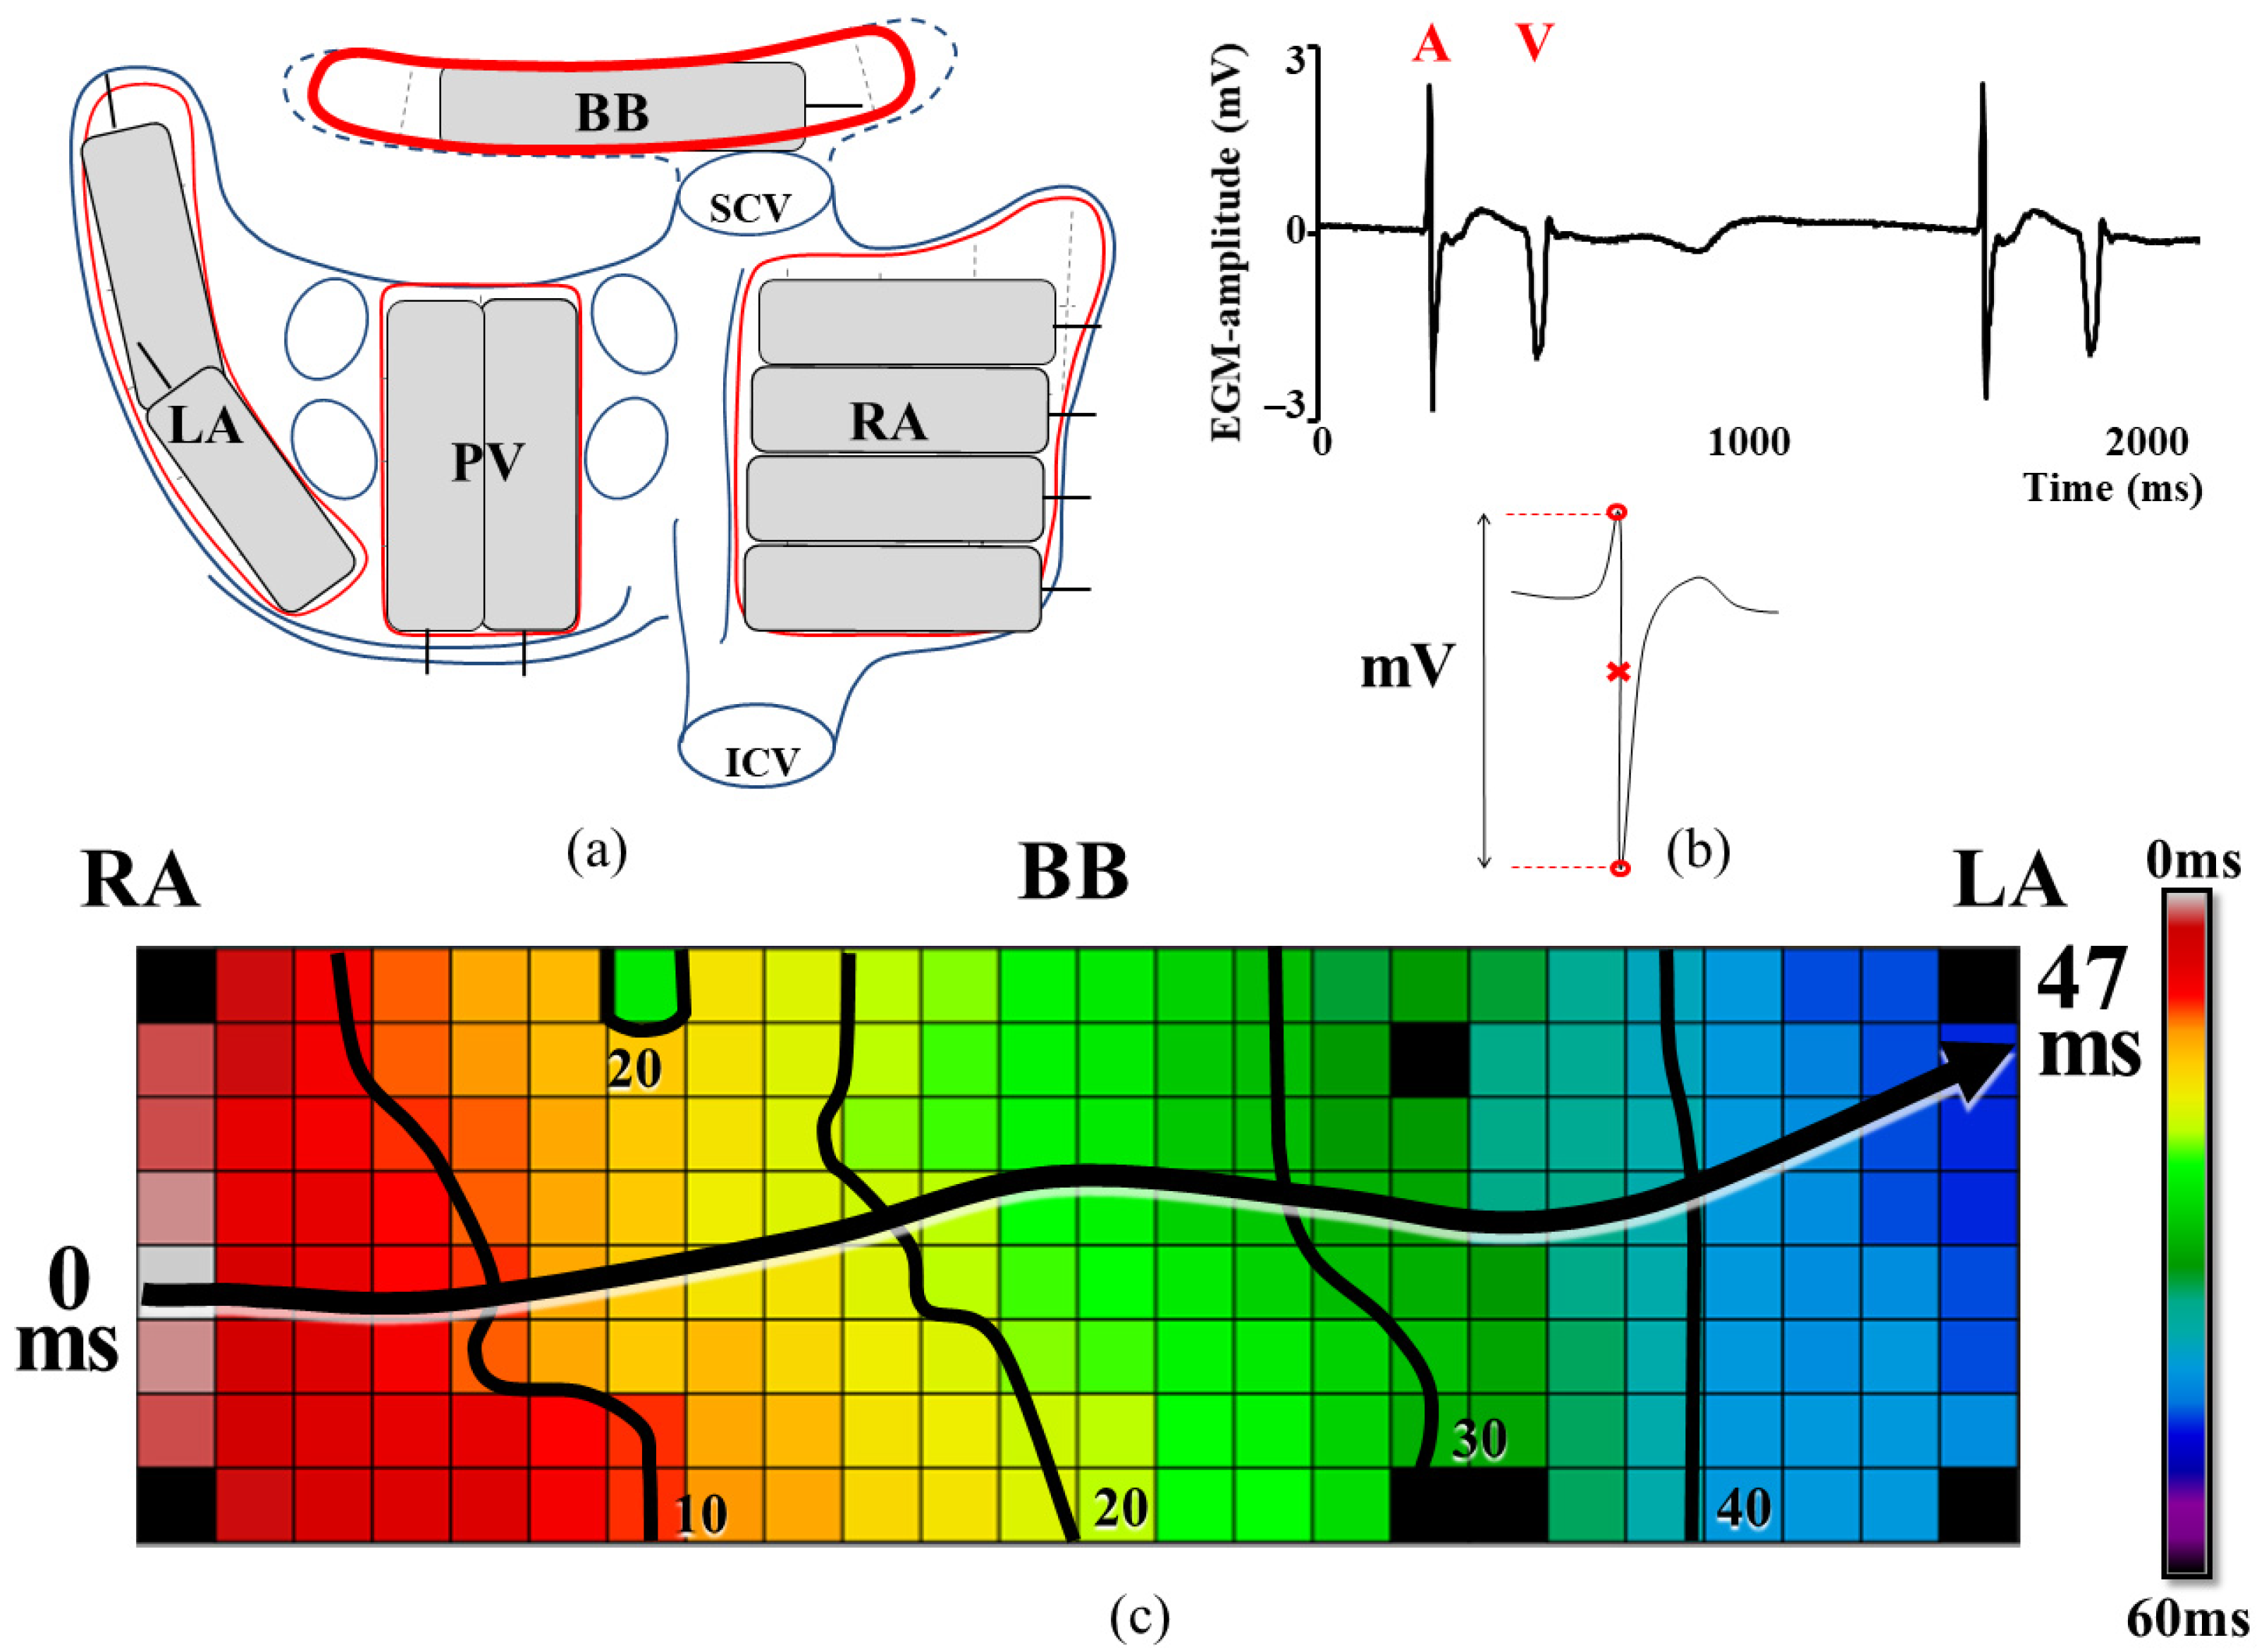
2.2. Mapping Procedure
2.3. Induction of Atrial Fibrillation
2.4. Data Processing
2.5. Conduction Abnormalities
2.6. Patterns of Activation
2.7. Unipolar Electrogram Amplitudes
2.8. Statistical Analysis
3. Results
3.1. Study Population
3.2. Relation between AF Inducibility and Delayed Activation Time of BB
3.3. Patterns of Activation
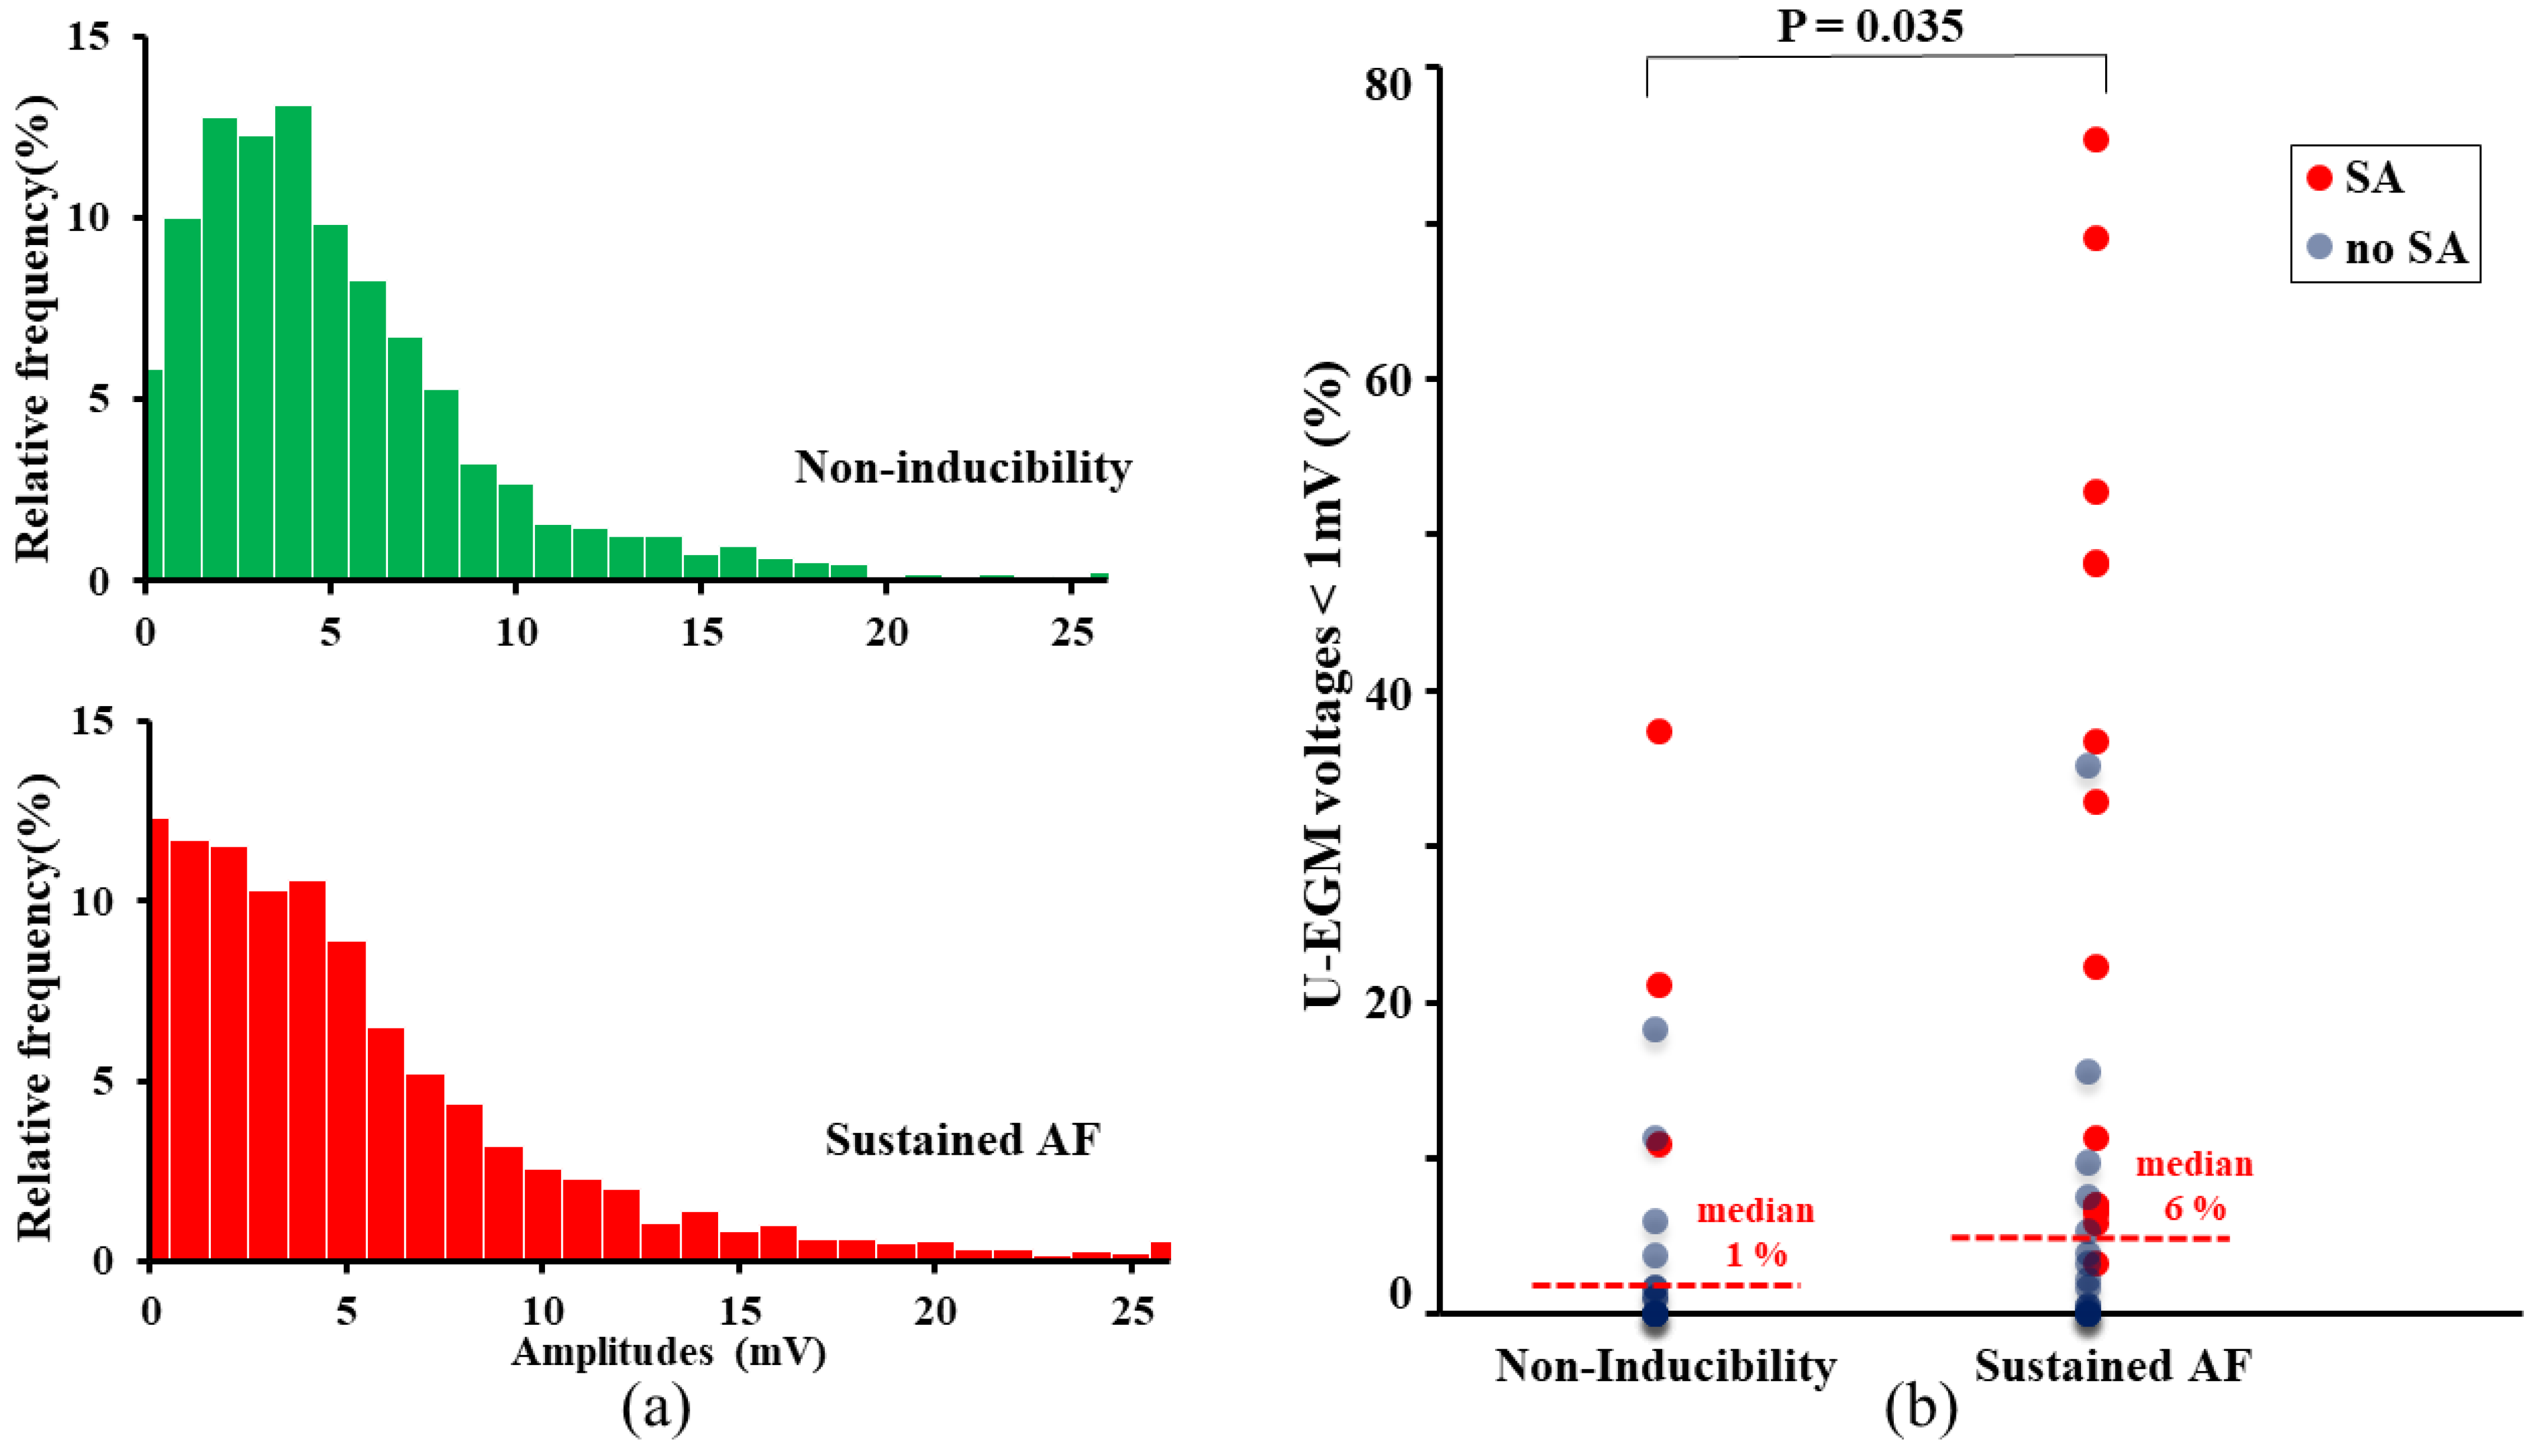
3.4. Unipolar Potential Morphology
3.5. Independent Predictors of AF Inducibility
4. Discussion
4.1. Key Findings
4.2. Conduction Abnormalities Related to AF Inducibility
4.3. New Kid on the (Conduction) Block
4.4. Delayed Excitation of BB
4.5. Clinical Relevance of AF Inducibility
4.6. Limitations
5. Conclusions
Supplementary Materials
Author Contributions
Funding
Institutional Review Board Statement
Informed Consent Statement
Data Availability Statement
Acknowledgments
Conflicts of Interest
References
- Asad, N.; Spodick, D.H. Prevalence of interatrial block in a general hospital population. Am. J. Cardiol. 2003, 91, 609–610. [Google Scholar] [CrossRef]
- Agarwal, Y.K.; Aronow, W.S.; Levy, J.A.; Spodick, D.H. Association of interatrial block with development of atrial fibrillation. Am. J. Cardiol. 2003, 91, 882. [Google Scholar] [CrossRef]
- Duytschaever, M.; Danse, P.; Eysbouts, S.; Allessie, M. Is there an optimal pacing site to prevent atrial fibrillation? An experimental study in the chronically instrumented goat. J. Cardiovasc. Electrophysiol. 2002, 13, 1264–1271. [Google Scholar] [CrossRef]
- Van Campenhout, M.J.; Yaksh, A.; Kik, C.; de Jaegere, P.P.; Ho, S.Y.; Allessie, M.A.; de Groot, N.M. Bachmann’s bundle: A key player in the development of atrial fibrillation? Circ. Arrhythm. Electrophysiol. 2013, 6, 1041–1046. [Google Scholar] [CrossRef] [Green Version]
- Ariyarajah, V.; Fernandes, J.; Kranis, M.; Apiyasawat, S.; Mercado, K.; Spodick, D.H. Prospective evaluation of atrial tachyarrhythmias in patients with interatrial block. Int. J. Cardiol. 2007, 118, 332–337. [Google Scholar] [CrossRef]
- Abe, Y.; Fukunami, M.; Yamada, T.; Ohmori, M.; Shimonagata, T.; Kumagai, K.; Kim, J.; Sanada, S.; Hori, M.; Hoki, N. Prediction of transition to chronic atrial fibrillation in patients with paroxysmal atrial fibrillation by signal-averaged electrocardiography: A prospective study. Circulation 1997, 96, 2612–2616. [Google Scholar] [CrossRef]
- Teuwen, C.P.; Yaksh, A.; Lanters, E.A.; Kik, C.; van der Does, L.J.; Knops, P.; Taverne, Y.J.; van de Woestijne, P.C.; Oei, F.B.; Bekkers, J.A.; et al. Relevance of Conduction Disorders in Bachmann’s Bundle During Sinus Rhythm in Humans. Circ. Arrhythm. Electrophysiol. 2016, 9, e003972. [Google Scholar] [CrossRef] [PubMed] [Green Version]
- Van der Does, L.; Yaksh, A.; Kik, C.; Knops, P.; Lanters, E.A.H.; Teuwen, C.P.; Oei, F.B.S.; van de Woestijne, P.C.; Bekkers, J.A.; Bogers, A.; et al. QUest for the Arrhythmogenic Substrate of Atrial fibRillation in Patients Undergoing Cardiac Surgery (QUASAR Study): Rationale and Design. J. Cardiovasc. Transl. Res. 2016, 9, 194–201. [Google Scholar] [CrossRef] [PubMed] [Green Version]
- Allessie, M.A.; de Groot, N.M.; Houben, R.P.; Schotten, U.; Boersma, E.; Smeets, J.L.; Crijns, H.J. Electropathological substrate of long-standing persistent atrial fibrillation in patients with structural heart disease: Longitudinal dissociation. Circ. Arrhythm. Electrophysiol. 2010, 3, 606–615. [Google Scholar] [CrossRef] [Green Version]
- Wagner, M.L.; Lazzara, R.; Weiss, R.M.; Hoffman, B.F. Specialized conducting fibers in the interatrial band. Circ. Res. 1966, 18, 502–518. [Google Scholar] [CrossRef] [PubMed] [Green Version]
- Roberts, D.E.; Hersh, L.T.; Scher, A.M. Influence of cardiac fiber orientation on wavefront voltage, conduction velocity, and tissue resistivity in the dog. Circ. Res. 1979, 44, 701–712. [Google Scholar] [CrossRef] [PubMed] [Green Version]
- Ogawa, S.; Dreifus, L.S.; Osmick, M.J. Longitudinal dissociation of Bachmann’s bundle as a mechanism of paroxysmal supraventricular tachycardia. Am. J. Cardiol. 1977, 40, 915–922. [Google Scholar] [CrossRef]
- Kumagai, K.; Khrestian, C.; Waldo, A.L. Simultaneous multisite mapping studies during induced atrial fibrillation in the sterile pericarditis model. Insights into the mechanism of its maintenance. Circulation 1997, 95, 511–521. [Google Scholar] [CrossRef] [PubMed]
- Lanters, E.A.H.; Yaksh, A.; Teuwen, C.P.; van der Does, L.; Kik, C.; Knops, P.; van Marion, D.M.S.; Brundel, B.; Bogers, A.; Allessie, M.A.; et al. Spatial distribution of conduction disorders during sinus rhythm. Int. J. Cardiol. 2017, 249, 220–225. [Google Scholar] [CrossRef]
- Heida, A.; van der Does, W.F.B.; van Staveren, L.N.; Taverne, Y.; Roos-Serote, M.C.; Bogers, A.; de Groot, N.M.S. Conduction Heterogeneity: Impact of Underlying Heart Disease and Atrial Fibrillation. JACC Clin. Electrophysiol. 2020, 6, 1844–1854. [Google Scholar] [CrossRef] [PubMed]
- Gorter, P.M.; van Lindert, A.S.; de Vos, A.M.; Meijs, M.F.; van der Graaf, Y.; Doevendans, P.A.; Prokop, M.; Visseren, F.L. Quantification of epicardial and peri-coronary fat using cardiac computed tomography; reproducibility and relation with obesity and metabolic syndrome in patients suspected of coronary artery disease. Atherosclerosis 2008, 197, 896–903. [Google Scholar] [CrossRef]
- Becker, A.E. How structurally normal are human atria in patients with atrial fibrillation? Heart Rhythm 2004, 1, 627–631. [Google Scholar] [CrossRef]
- Al Chekakie, M.O.; Welles, C.C.; Metoyer, R.; Ibrahim, A.; Shapira, A.R.; Cytron, J.; Santucci, P.; Wilber, D.J.; Akar, J.G. Pericardial fat is independently associated with human atrial fibrillation. J. Am. Coll. Cardiol. 2010, 56, 784–788. [Google Scholar] [CrossRef] [Green Version]
- Tedrow, U.B.; Stevenson, W.G. Recording and interpreting unipolar electrograms to guide catheter ablation. Heart Rhythm 2011, 8, 791–796. [Google Scholar] [CrossRef] [PubMed]
- Spach, M.S.; Josephson, M.E. Initiating reentry: The role of nonuniform anisotropy in small circuits. J. Cardiovasc. Electrophysiol. 1994, 5, 182–209. [Google Scholar] [CrossRef] [PubMed]
- Bayes de Luna, A.; Baranchuk, A.; Alberto Escobar Robledo, L.; Masso van Roessel, A.; Martinez-Selles, M. Diagnosis of interatrial block. J. Geriatr. Cardiol. 2017, 14, 161–165. [Google Scholar] [PubMed]
- Bayes de Luna, A.; Cladellas, M.; Oter, R.; Torner, P.; Guindo, J.; Marti, V.; Rivera, I.; Iturralde, P. Interatrial conduction block and retrograde activation of the left atrium and paroxysmal supraventricular tachyarrhythmia. Eur. Heart J. 1988, 9, 1112–1118. [Google Scholar] [CrossRef] [PubMed]
- Marquardt, J.; Marquardt, K.; Scheckenbach, C.; Zhang, W.; Stimpfle, F.; Duckheim, M.; Maleck, C.; Seizer, P.; Gawaz, M.; Schreieck, J.; et al. Prognostic Value of Atrial Fibrillation Inducibility in Patients Without History of Clinical Atrial Fibrillation. J. Atr. Fibrillation 2018, 11, 1837. [Google Scholar]
- Santangeli, P.; Zado, E.S.; Garcia, F.C.; Riley, M.P.; Lin, D.; Frankel, D.S.; Supple, G.E.; Schaller, R.D.; Dixit, S.; Callans, D.J.; et al. Lack of prognostic value of atrial arrhythmia inducibility and change in inducibility status after catheter ablation of atrial fibrillation. Heart Rhythm 2018, 15, 660–665. [Google Scholar] [CrossRef] [PubMed]
- Tachibana, S.; Mizukami, A.; Kuroda, S.; Hayashi, T.; Matsumura, A.; Goya, M.; Sasano, T. Predictive value of noninducibility after catheter ablation for paroxysmal and persistent atrial fibrillation. J. Arrhythm. 2020, 36, 439–447. [Google Scholar] [CrossRef] [PubMed]
- Kumar, S.; Kalman, J.M.; Sutherland, F.; Spence, S.J.; Finch, S.; Sparks, P.B. Atrial fibrillation inducibility in the absence of structural heart disease or clinical atrial fibrillation: Critical dependence on induction protocol, inducibility definition, and number of inductions. Circ. Arrhythm. Electrophysiol. 2012, 5, 531–536. [Google Scholar] [CrossRef] [PubMed] [Green Version]

| Non-Inducibility (N = 20) | Sustained AF (N = 34) | p-Value | |
| Patient characteristics | |||
| Age (years) | 62 ± 43 | 61 ± 15 | 0.77 |
| Gender (female N, (%)) | 6 (30) | 15 (42) | 0.37 |
Risk factors
| |||
| 27 ± 4.0 | 29 ± 5.0 | 0.06 | |
| 5 (25) | 9 (26) | 0.73 | |
| 9 (45) | 18 (53) | 0.62 | |
| LA enlargement, N(%) | 3/20 (15) | 15/33 (45) | 0.023 |
LV function
| 0.70 | ||
| 18 | 30 | ||
| 2 | 4 | ||
| 0 | 0 | ||
Underlying heart disease, N(%)
| 0.63 | ||
| (35) | (35) | ||
| (40) | (38) | ||
| (35) | (26) | ||
Antiarrhythmic drugs
| |||
| 0 | 0 | 0.26 | |
| 10 (50) | 17 (50) | 0.53 | |
| 0 | 1 (3) | 0.38 | |
| 2 (10) | 2 (6) | 0.32 | |
| 0 | 0 | 0.26 | |
| Procedural characteristics | |||
| Number of induction attempts | 4.6 (±2) | 2.0 (±1.3) | <0.001 |
| Non-Inducibility (N = 19) | Sustained AF (N = 33) | p-Value | |
|---|---|---|---|
| Conduction times | |||
| 0 (0–2) | 0 (0–2) | 0.039 |
| 14 (12–23) | 17 (12–34) | 0.025 | |
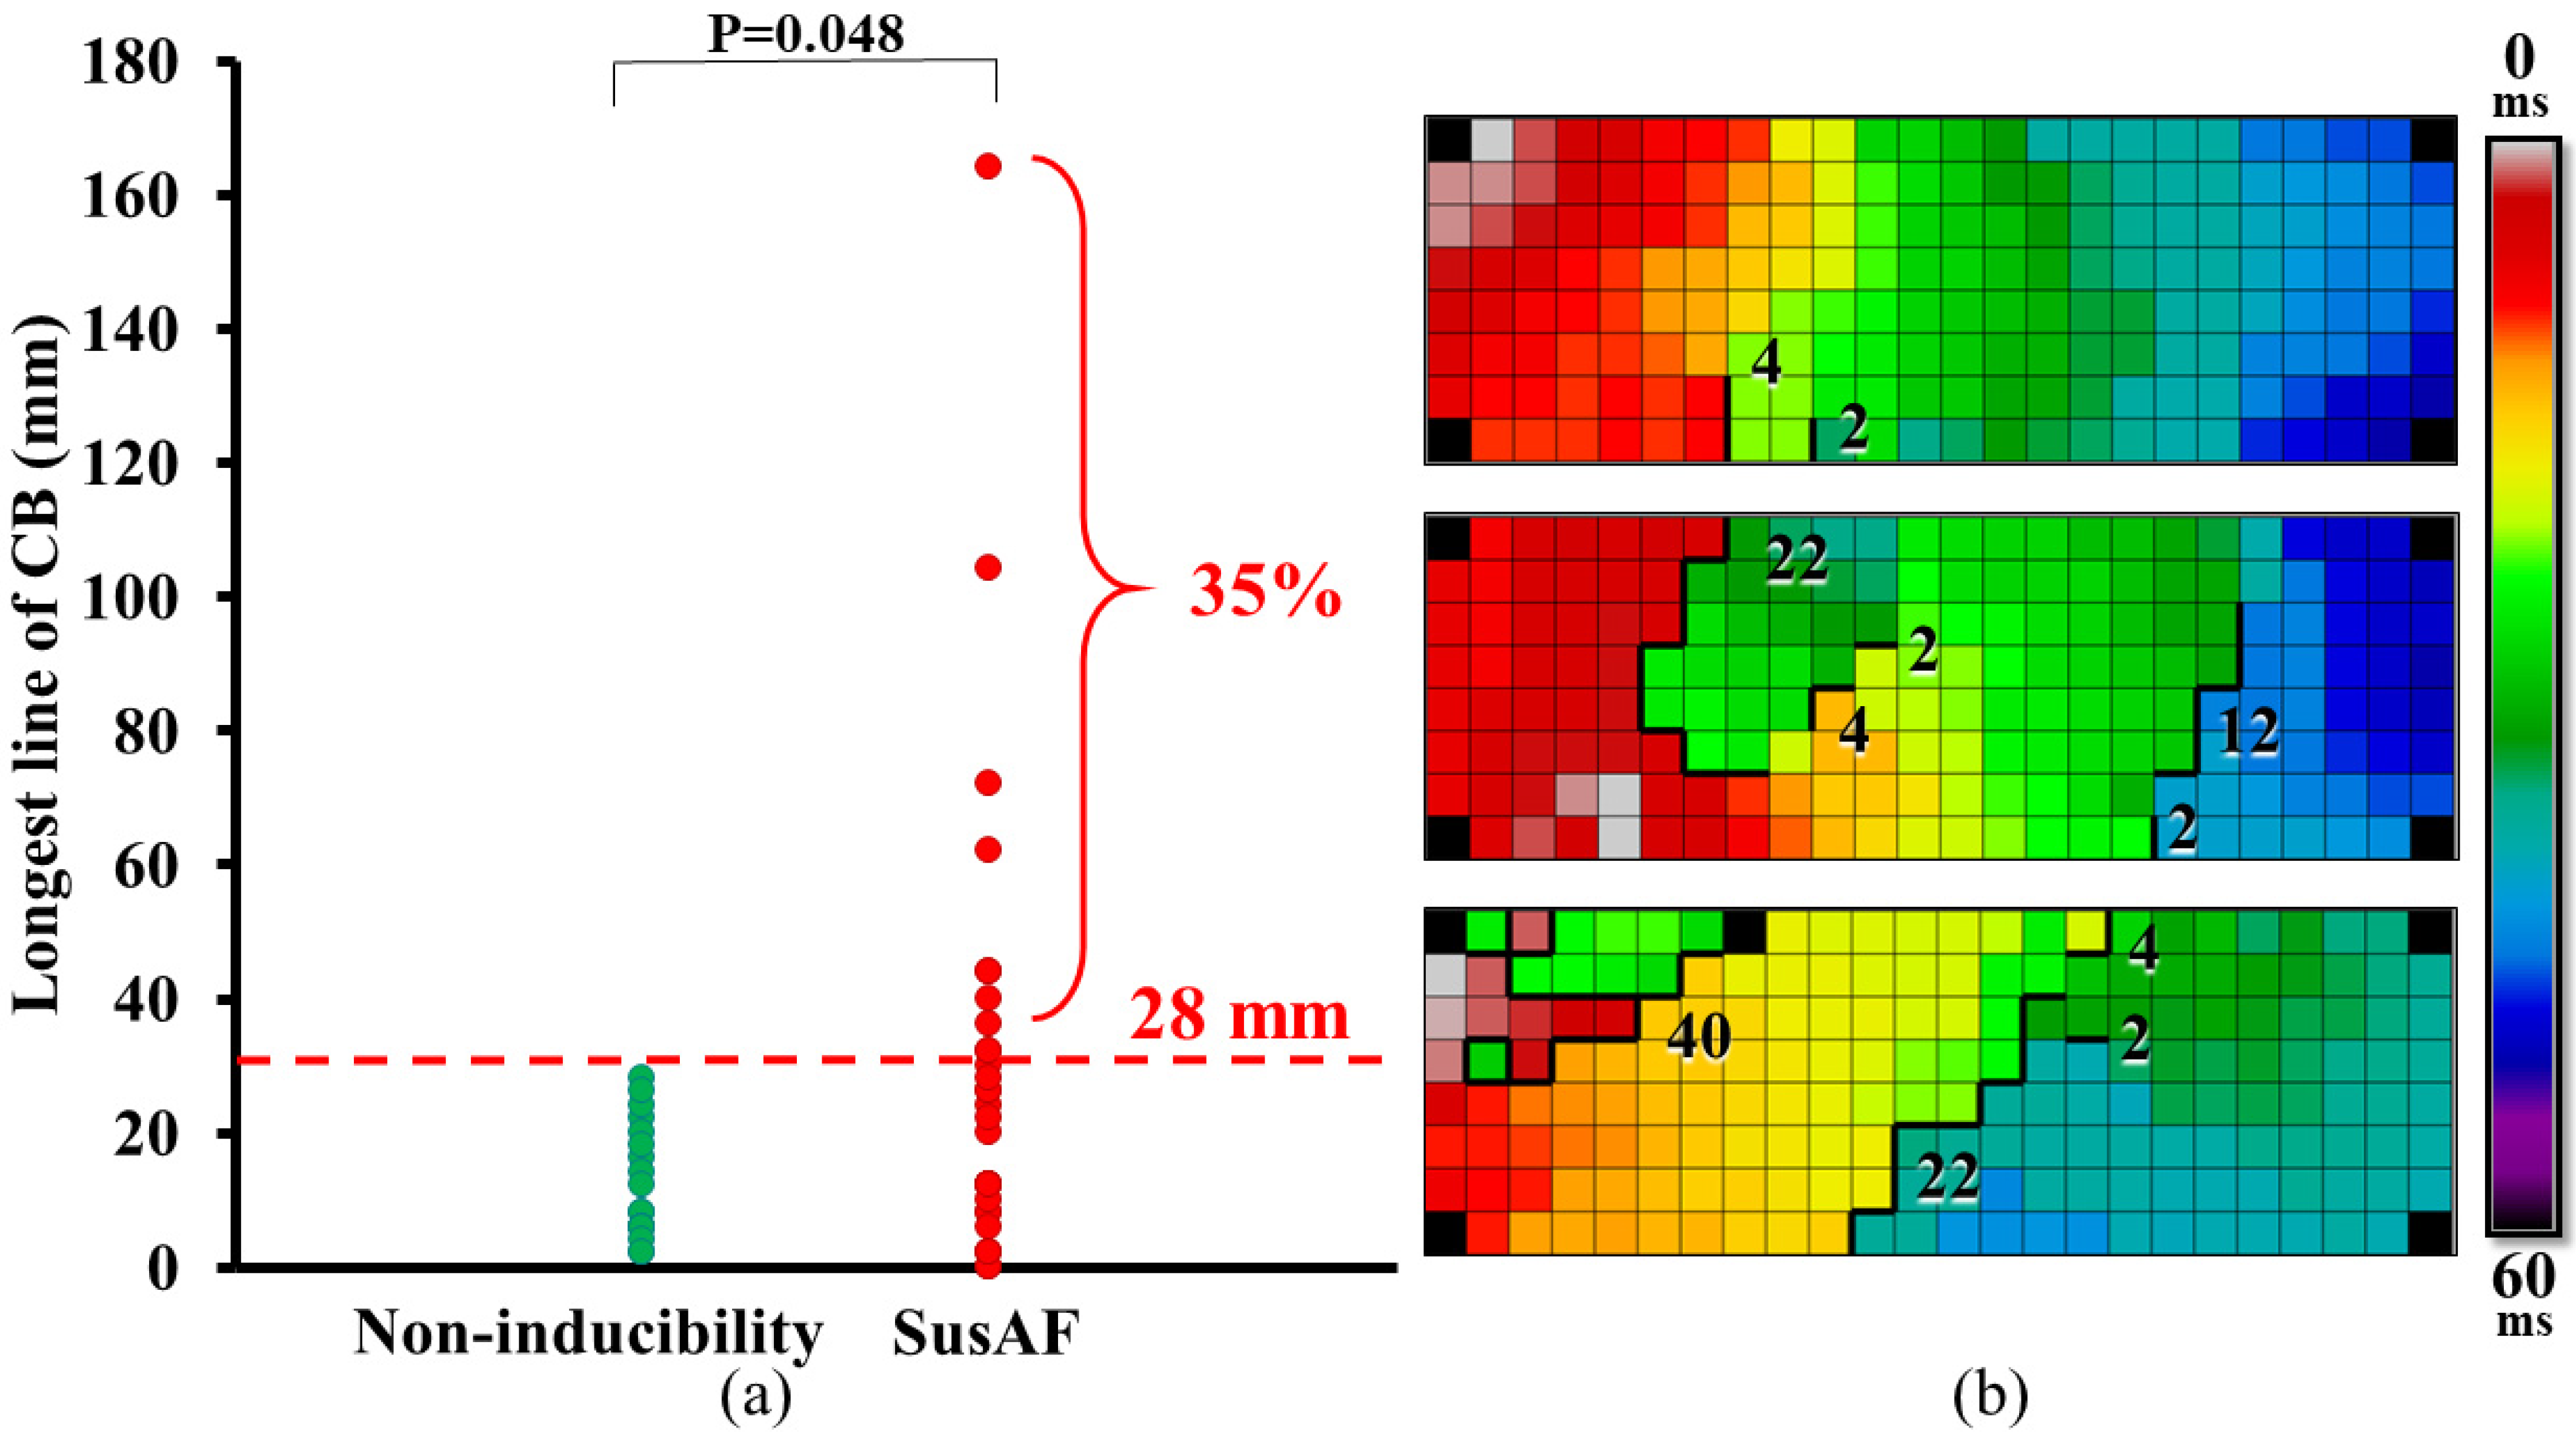
Lines of CB
| |||
| 4 (2–16) | 6 (2–22) | 0.080 | |
| 2 (2–28) | 18 (2–164) | 0.031 | |
| 3 (0–7) | 3 (0–12) | 0.450 | |
| 1.8 (0.05–7.5) | 3.6 (0.0–28.0) | 0.056 | |
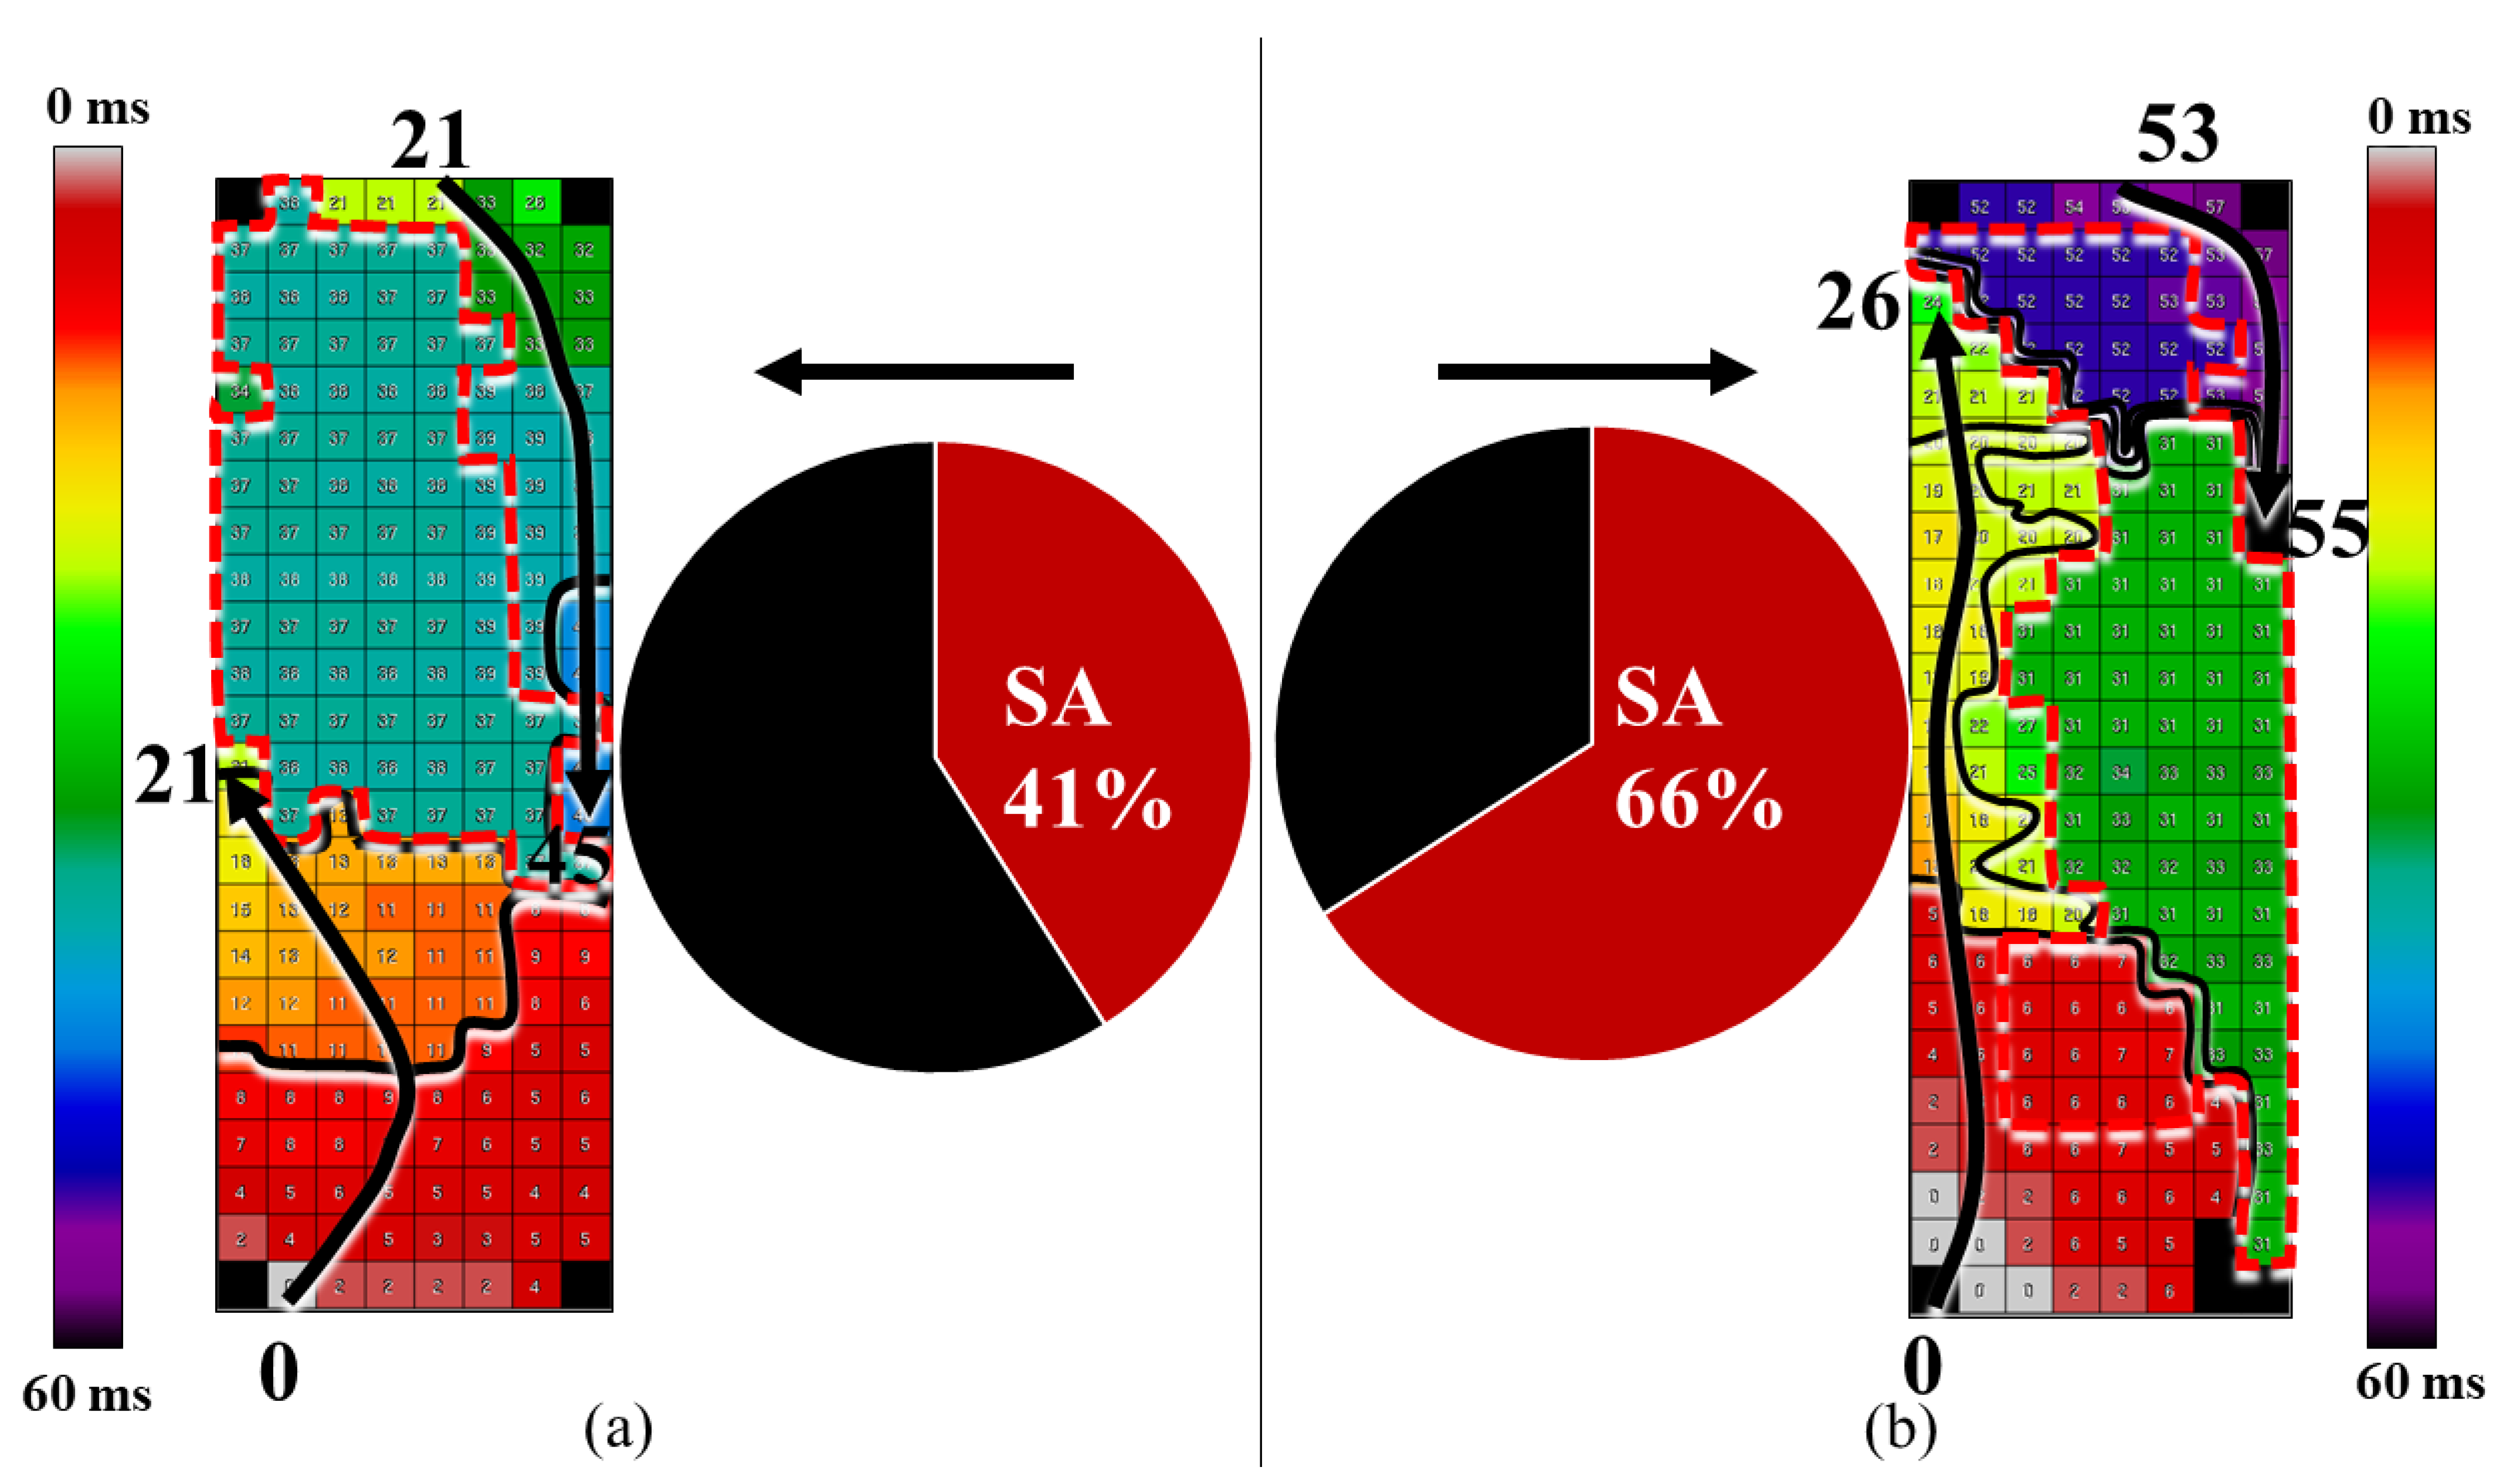
Patterns of activation:
| |||
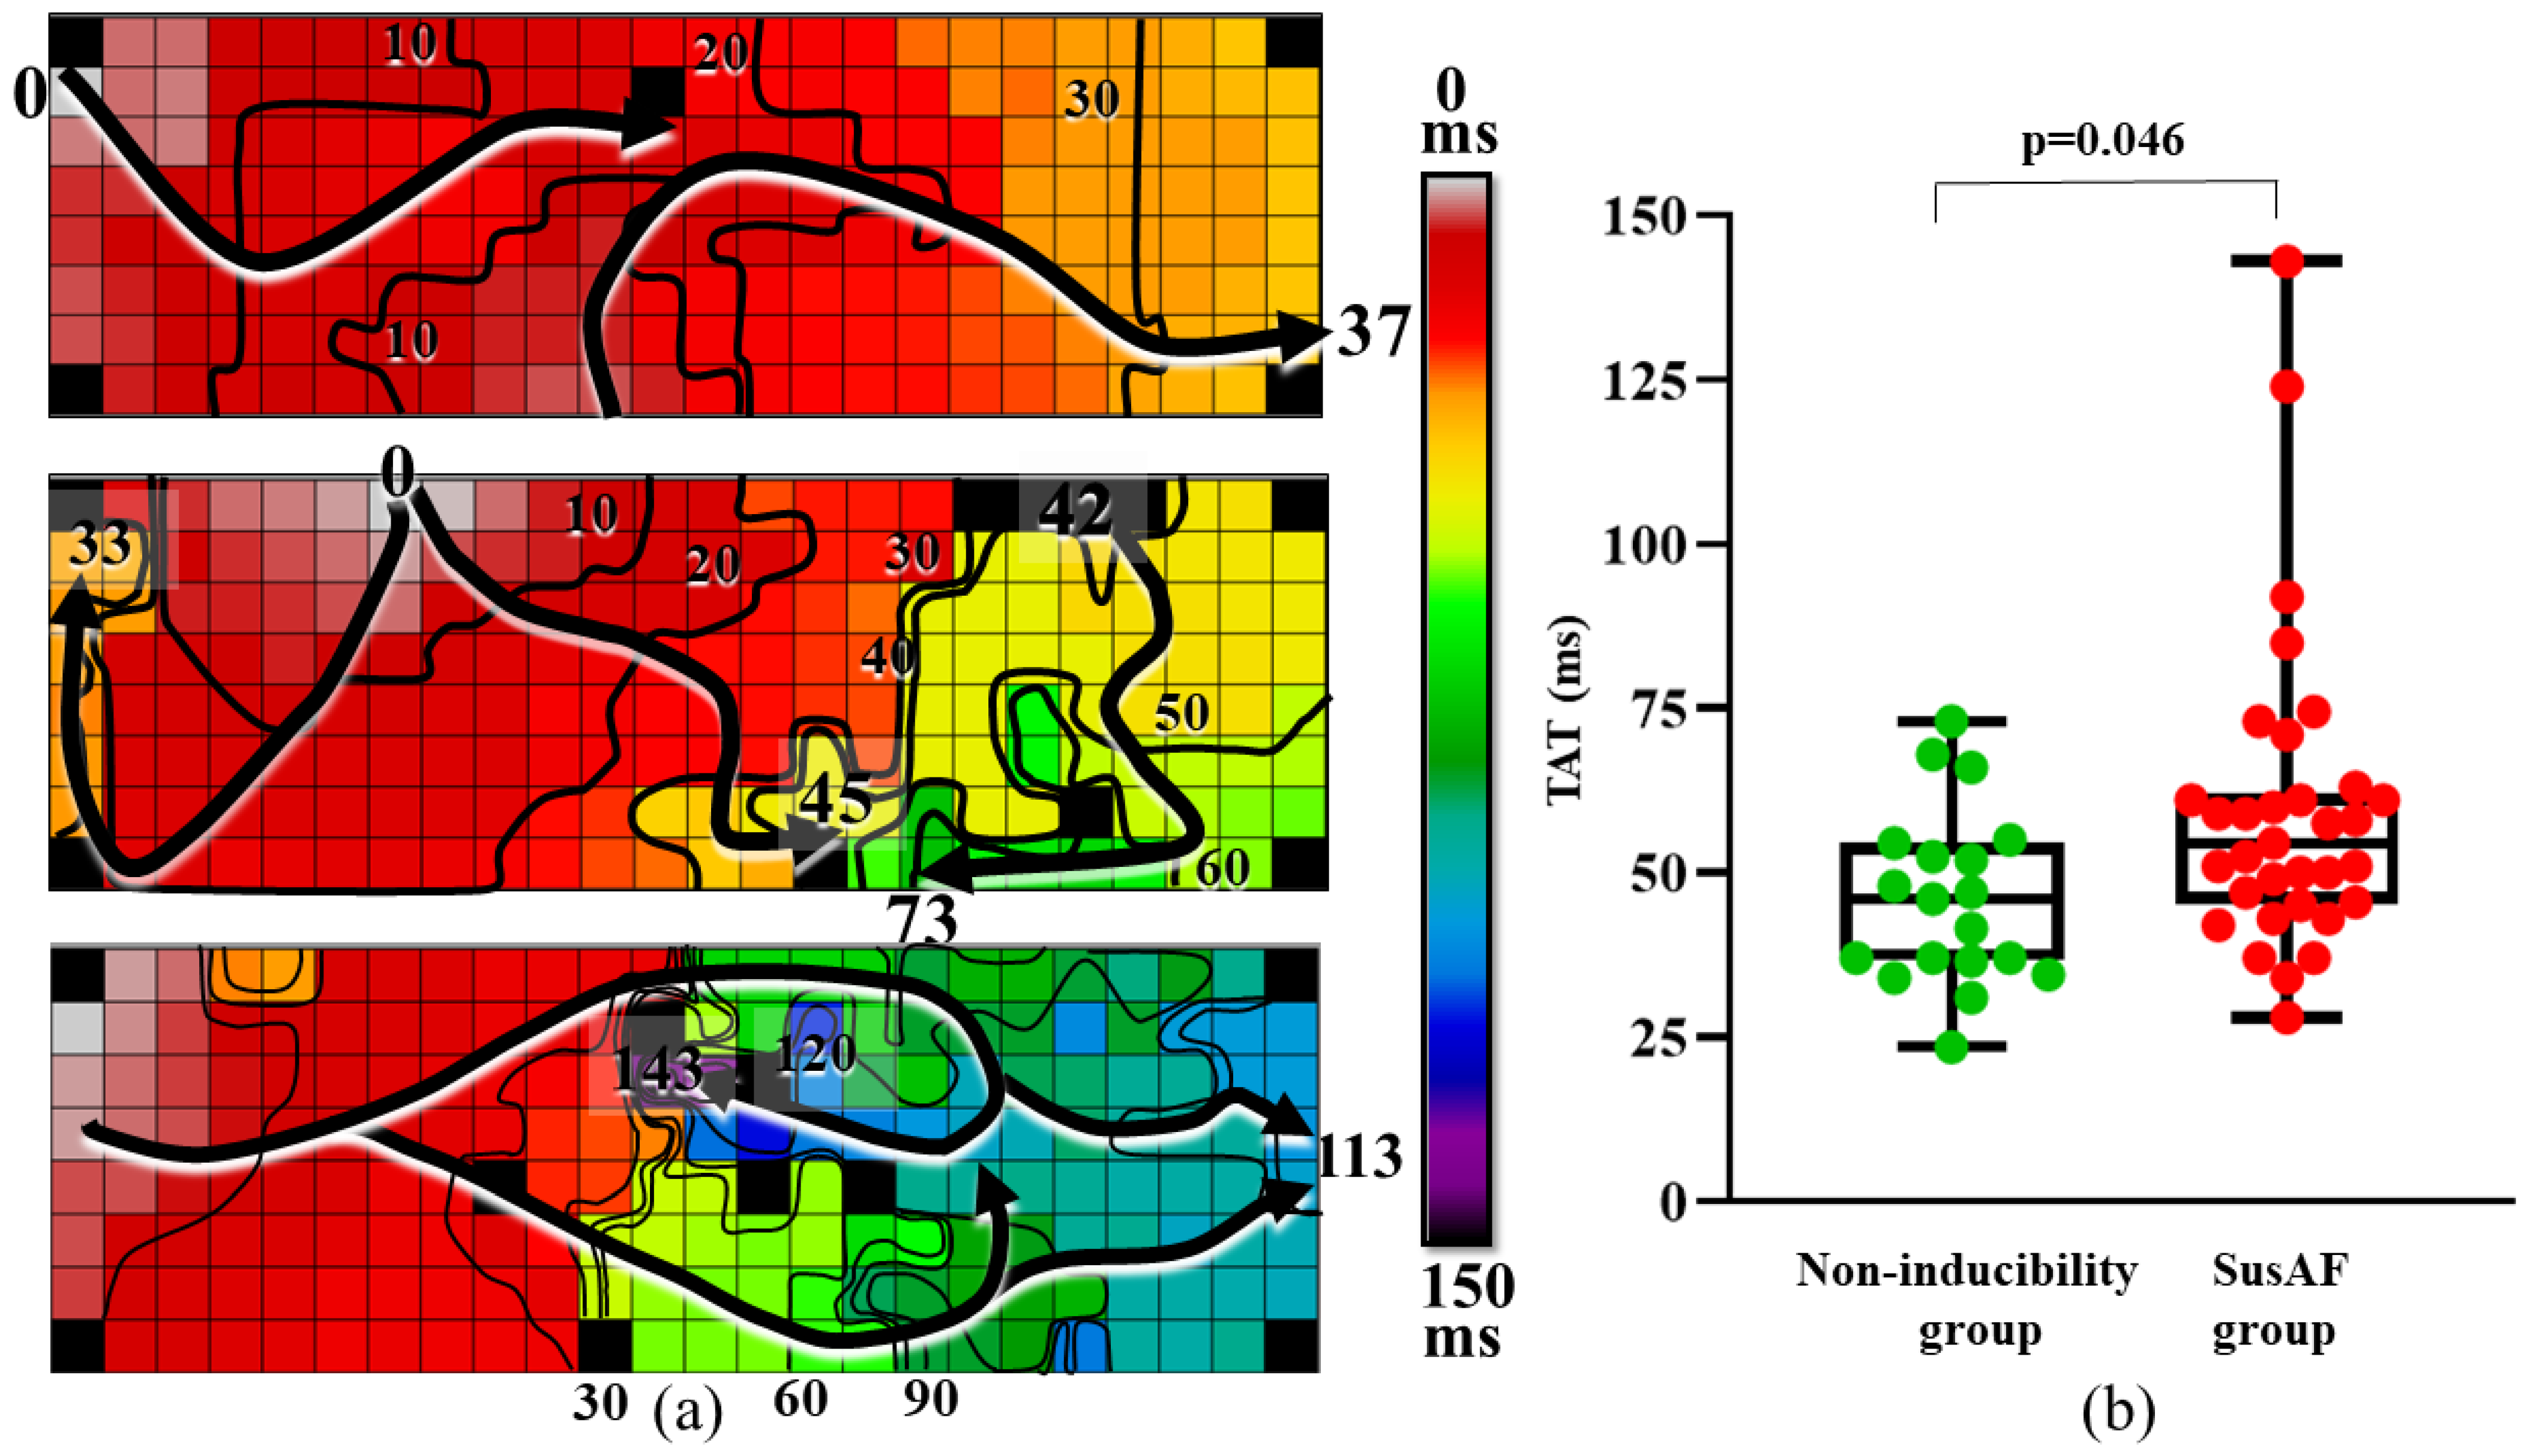
| 46 (24–73) | 55 (28–143) | 0.012 | |
| 3/20 (15%) | 14/34 (41%) | 0.038 | |
| 7/19 (37%) | 21/34 (41%) | ||
Voltages:
| |||
| 1 (0–38)% | 6 (0–77)% | 0.035 |
Publisher’s Note: MDPI stays neutral with regard to jurisdictional claims in published maps and institutional affiliations. |
© 2021 by the authors. Licensee MDPI, Basel, Switzerland. This article is an open access article distributed under the terms and conditions of the Creative Commons Attribution (CC BY) license (https://creativecommons.org/licenses/by/4.0/).
Share and Cite
van Staveren, L.N.; van der Does, W.F.B.; Heida, A.; Taverne, Y.J.H.J.; Bogers, A.J.J.C.; de Groot, N.M.S. AF Inducibility Is Related to Conduction Abnormalities at Bachmann’s Bundle. J. Clin. Med. 2021, 10, 5536. https://doi.org/10.3390/jcm10235536
van Staveren LN, van der Does WFB, Heida A, Taverne YJHJ, Bogers AJJC, de Groot NMS. AF Inducibility Is Related to Conduction Abnormalities at Bachmann’s Bundle. Journal of Clinical Medicine. 2021; 10(23):5536. https://doi.org/10.3390/jcm10235536
Chicago/Turabian Stylevan Staveren, Lianne N., Willemijn F. B. van der Does, Annejet Heida, Yannick J. H. J. Taverne, Ad J. J. C. Bogers, and Natasja M. S. de Groot. 2021. "AF Inducibility Is Related to Conduction Abnormalities at Bachmann’s Bundle" Journal of Clinical Medicine 10, no. 23: 5536. https://doi.org/10.3390/jcm10235536
APA Stylevan Staveren, L. N., van der Does, W. F. B., Heida, A., Taverne, Y. J. H. J., Bogers, A. J. J. C., & de Groot, N. M. S. (2021). AF Inducibility Is Related to Conduction Abnormalities at Bachmann’s Bundle. Journal of Clinical Medicine, 10(23), 5536. https://doi.org/10.3390/jcm10235536