Article

Association between Serum Lipid Parameters and Cognitive Performance in Older Adults

1
Department of Preventive Medicine, College of Medicine, Seoul National University, Seoul 03080, Korea
2
Integrated Major in Innovative Medical Science, Seoul National University Graduate School, Seoul 03080, Korea
3
Veterans Medical Research Institute, Veterans Health Service Medical Center, Seoul 05368, Korea
4
Institute of Health Policy and Management, Seoul National University Medical Research Center, Seoul 03080, Korea
*
Authors to whom correspondence should be addressed.
J. Clin. Med. 2021, 10(22), 5405; https://doi.org/10.3390/jcm10225405
Submission received: 12 September 2021 / Revised: 16 November 2021 / Accepted: 17 November 2021 / Published: 19 November 2021
(This article belongs to the Section Clinical Neurology)

Abstract

:
(1) Background: Previous studies have suggested the association between lipid profiles and cognitive function in older adults. However, they generated inconsistent results. We aim to determine the relationship between lipid profiles and cognitive performance in older adults. (2) Methods: We used the 2011–2014 National Health and Nutrition Examination Survey. This study included 2215 participants who were aged more than 60 years old and free of coronary heart disease or stroke. Lipid profiles included total cholesterol (TC), low density lipid cholesterol (LDL), high density lipid cholesterol (HDL), and triglyceride (TG). Cognitive function was assessed using the digit symbol substitution test (DSST). (3) Results: Positive correlations of DSST were observed with TC (r = 0.111; p < 0.0001), HDL (r = 0.127; p < 0.0001), and LDL (r = 0.107; p = 0.0005). However, there was no significant relationship between TG and DSST. A one-unit increase in HDL was associated with an increase in DSST score (beta coefficient: 0.036; p = 0.018); but the association was not significant for LDL, TG, and TC. In the categorical analysis, the high HDL group had a higher DSST score than the low HDL group (beta = 3.113; p < 0.0001) and the low TG group was more likely to show a lower DSST score than the high TC group (beta = −1.837; p = 0.0461). However, LDL and TC showed no statistically significant associations. Moreover, HDL was only associated with a 0.701 times increased risk of cognitive impairment (95% CI = 0.523–0.938) in the logistic regression analysis. (4) Conclusions: Higher blood concentrations of HDL levels were positively associated with DSST scores in older adults. We suggest that the high levels of HDL may be a protective factor against cognitive impairment.

1. Introduction

Cognitive decline is an important public health issue among older adults. Approximately 20%−30% of Americans and 8% of Chinese in the elderly population have health issues related to cognitive impairment [1]. Abnormal cognitive functioning impedes the quality of life and affects the disease burden for caregivers as well as patients [2]. It is more likely to further develop into worse impairments, such as Alzheimer’s disease or dementia, and increase the risk of morbidity and mortality [3,4,5]. Although there is no certain treatment to prevent cognitive impairment, the risk of cognitive decline is often ignored until patients are diagnosed with final progression to dementia [5].
Several risk factors are involved in the development of cognitive decline. These include health behaviors (i.e., cigarette smoking and dietary intake) and comorbidities (i.e., hypertension and diabetes mellitus) [6]. For example, a Chinese cohort study indicated that cognitive impairment has a significant association with past smokers (relative risk (RR) = 0.73, 95% confidence interval (CI) = 2.22–2.81) and current smokers (RR = 2.33, 95% CI = 1.37–5.82) compared to non-smokers who have never smoked in their entire life [7]. A community-based cohort study found that the presence of diabetes was negatively associated with the mean change scores for the digit symbol subtest (DSST) and first-letter word fluency (WF). Hypertension was also significantly associated with higher negative mean change scores in WF [8]. A study of elderly individuals in Madrid reported that the ingestion of a satisfactory global diet and balanced nutrients was associated with better cognitive function [9].
Lipid profiles are another important risk factor for cognitive impairment [10,11]. Plasma lipid levels were higher in individuals with mild cognitive impairment than in those with normal cognition; herein, the occurrence was associated with elevated plasma high-density lipoprotein cholesterol (HDL) and triglycerides (TG) [10]. Lower levels of total serum cholesterol were associated with poor performance in terms of verbal fluency, abstract reasoning, attention/concentration, and a composite score of multiple variables [12]. A cross-sectional study in China showed that subjects with high levels of TC and low-density lipoprotein cholesterol (LDL), but not HDL and TG, were at risk for cognitive impairment [13]. Another prospective cohort study in the United States indicated that LDL levels were associated with good performance in cognitive memory [14]. Although the above-mentioned studies have suggested that multiple serum lipid parameters are a risk factor for cognitive impairment, the results are inconsistent. Thus, further studies are needed to define the association between serum lipid parameters and cognitive impairment.
In this study, we conducted a cross-sectional study using the National Health and Nutrition Examination Survey (NHANES), a representative sample of the United States. Our study aimed to determine whether lipid profiles (i.e., TC, LDL, HDL, and TG) were associated with cognitive performance in older adults. Moreover, this study aimed to consider whether lipid profiles could be the predictors for cognitive function. The DSST, which is known to be one of the most sensitive tests of cognitive dysfunction, was used to assess cognitive performance [15].

2. Materials and Methods

2.1. Study Population

We used data from the NHANES 2011–2014. The NHANES conducted by the Centers for Disease Control and Prevention is a nationally representative survey of the non-institutionalized civilian population in the United States.
From the 2011–2014 NHANES data, 3632 participants aged >60 years were initially included. We then selected 2606 patients who had data on blood lipid examination and who completed the DSST test. We further excluded 391 subjects who had experienced coronary heart disease or stroke and who had no variables of interest. Finally, we included a total of 2215 people as study participants. The study protocols of the NHANES were approved by the National Center for Health Statistics Institutional Review Board. Oral, and written consent was obtained from all the participants before the survey.

2.2. Measurement of Serum Lipids Profiles

Serum samples were collected and analyzed using different methods depending on the characteristics of the serum lipids. TC and TG levels were measured enzymatically [16]. HDL cholesterol was measured in serum after rendering apolipoprotein-B-containing lipoproteins non-reactive with a blocking agent [17]. Cholesterol was calculated from the measured values of TC, TG, and HDL cholesterol using the Friedewald formula [17]. The cut-off values for distinguishing normal versus abnormal HDL, LDL, TG, and TC levels were 40 mg/dL, 130 mg/dL, 150 mg/dL, and 200 mg/dL, respectively, based on criteria of the UK consensus group and recent Europeans guidelines [18,19].

2.3. Measurement of DSST

Although relying on cognitive assessment cannot fully replace a diagnosis based on a clinical examination, cognitive assessment is helpful to understand the association of cognitive functioning with regards to risk factors of measuring cognitive impairment or further severe cognitive symptoms such as dementia.
The DSST, which is a performance module from the Wechsler Adult Intelligence Scale, assesses sustained attention, processing speed, and working memory [14]. The test form had a key at the top, containing nine numbers paired with symbols. Participants were given 2 min to copy the corresponding symbols in the 130 boxes that adjoined the numbers. The interviewer showed the participants how to complete the task before the initial assessment and then requested them to fill in the practice boxes. Participants who were unable to finish the practice were excluded from the study. The score calculates the total number of correct matches. The values for the score ranged from 0 to 100 [20]. Participants with DSST scores less than 33 were classified as cognitively impaired, given that this range of values belongs to the lowest quartile of the distribution.

2.4. Variables of Interest

Variables of interest included age (>60 years), sex (male or female), race/ethnicity (non-Hispanic white, non-Hispanic black, Hispanic, or other), annual household income (<$20,000 or ≥$20,000), and education (non-high school graduate, high school graduate, or college graduate or over). Furthermore, smoking status was classified as current smoker, former smoker, or never smoker. Exercise habits were classified as regular or non-exercise-based. Body mass index (BMI) was calculated by dividing the individual’s weight by his or her height squared and categorized into the following four groups: underweight (<18.5 kg/m2), normal weight (18.5–22.9 kg/m2), overweight (23–24.9 kg/m2), and obese (≥25 kg/m2).
Medical condition variables were divided into binary variables (Yes/No). The presence of depressive feelings was evaluated based on the questionnaire responses: participants who experienced feeling low, depressed, or hopeless over the last 2 weeks. Diabetes was classified according to the two-hour glucose (OGTT) levels: Yes (≥200 mg/dL) and No (<200 mg/dL). The presence of chest pain was determined based on the questionnaire responses: participants who experienced any pain or discomfort in chest. Hypertension was determined by high diastolic blood pressure (≥90 mm Hg) or systolic blood pressure (≥140 mm Hg). The use of statin was determined by whether any of the medications including simvastatin, lovastatin, atorvastatin, rosuvastatin, pravastatin, and pitavastatin, was taken in the 30 days prior to taking the questionnaire.

2.5. Statistical Analysis

The mean values and standard deviations of lipid profiles and cognitive test scores were computed. The correlation coefficients of the lipid profiles with cognitive test scores and among the lipid profiles were also calculated. To evaluate the association between lipid profiles and the DSST, linear regression, logistic regression, and spline regression analyses were conducted. The regression model provided the estimated beta values of the DSST in terms of TC, TG, HDL, and LDL. The logistic model provided the odds ratio estimates and 95% Wald Confidence Limits. The model was adjusted for age, sex, ethnicity, monthly income, education, smoking status, BMI, exercise, depression levels, diabetes, chest pain, hypertension, and statin.
We used weighted estimates of the population parameters based on the NHANES analytic and reporting guidelines. Statistical analyses were performed using the PROC SURVEY, PROC LOGISTIC, and PROC GAM procedure in SAS 9.2 (SAS Institute, Cary, NC, USA) to account for the complex sampling scheme. All the tests were two-sided, and the level of statistical significance was set to α = 0.05.

3. Results

3.1. Characteristics of the Study Population

Table 1 summarizes the characteristics of the study participants. Of the 2606 participants, 391 who had experienced coronary disease and stroke were excluded from the study. The mean age was approximately 69 years, and 52.73% of all subjects were female individuals. There were relatively few Asians (8.26%); 47.22% of the subjects were white individuals. The proportion of subjects who had a total annual family income ≥$20,000 was 75.76%, and the rest of the population belonged to the <$20,000 annual family income category. More than half (53.18%) of the subjects had higher levels of education with a college degree. As far as health behavior was concerned, more than half (51.38%) were current smokers, and 12.33% of the subjects had no experience of smoking at all. With regard to the health condition, 59.73% of the subjects reported exercising regularly, although 73.05% of the subjects showed an abnormal weight, including obesity, and overweight. Concerning medical conditions, most participants showed no depressive feelings (77.16%), diabetes (95.44%), chest pain (79.10%), hypertension (64.75%), or experience of taking statin (62.21%).

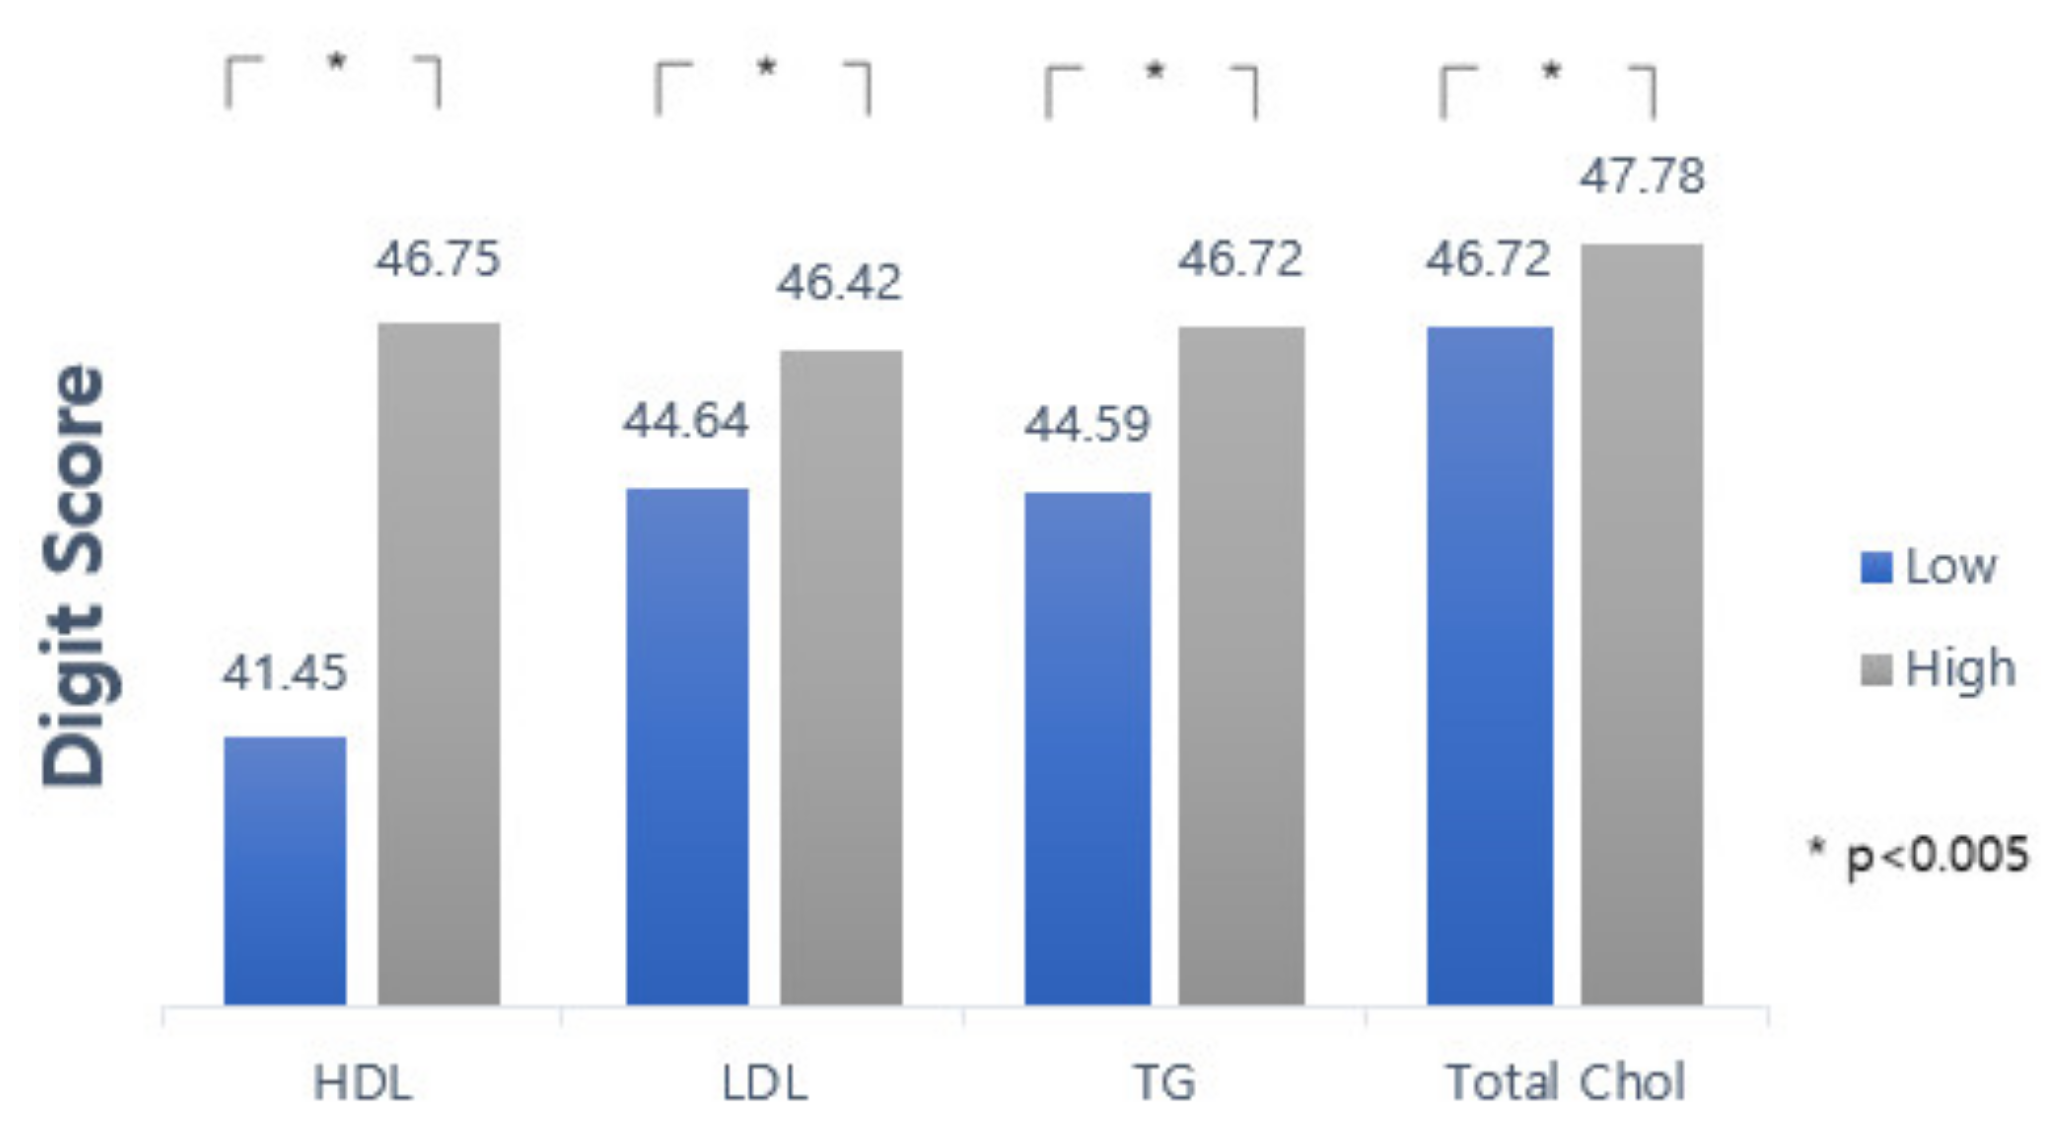
3.2. Comparison of the Means (SD) of Lipid Profiles and Cognitive Test Score

Table 2 presents the mean (±standard deviation (SD)) of lipid profiles (HDL, LDL, TG, and TC) and cognitive test scores for the DSST. The mean values of HDL, LDL, TG, and TC were 55.11 mg/dL, 113.05 mg/dL, 120.89 mg/dL, and 194.61 mg/dL, respectively. The mean score of the cognitive test for the DSST was 47.27 (range: 0–105).
Figure 1 categorical levels of all lipid profiles. Overall, the participants who had a high lipid profile presented high scores on the cognitive test.
Figure 2 shows a scatter plot and the estimated smoothing spline function of the digit score with a 95% confidence band for the generalized additive model (GAM) when the independent variable was lipid profiles. As visualized in Figure 2a,b, the estimated smoothing spline function of the digit score for the GAM only showed a significant relationship with HDL among lipid profiles (p-value: 0.0413). Our analysis revealed that those who have higher levels of HDL tended to show better performance on cognitive tests according to the scatter plot and the GAM figure.

3.3. Pearson Correlation Structure of Lipid Profiles-DSST and among Lipid Profiles

Table 3 shows the correlation coefficient of lipid profiles with cognitive test scores and among lipid profiles. All lipid profiles, except TG, showed a significant correlation. Specifically, the correlation between DSST scores and HDL showed a strong positive relationship (0.127) with a significant p-value (p < 0.05) compared to other lipid profiles. LDL (0.107) and TC (0.111) also showed a positive correlation coefficient with the DSST. TG levels showed no significant correlation. Overall, HDL showed a strong positive correlation coefficient relationship with cognitive test scores among the lipid profiles.
The correlation coefficient of all the pairs of lipid profiles showed a significant p-value. Particularly, LDL-TC presented a positive correlation coefficient (0.925) and HDL-TG showed a negative correlation coefficient (−0.419). Other correlation coefficients among lipid profiles presented a weak correlation.

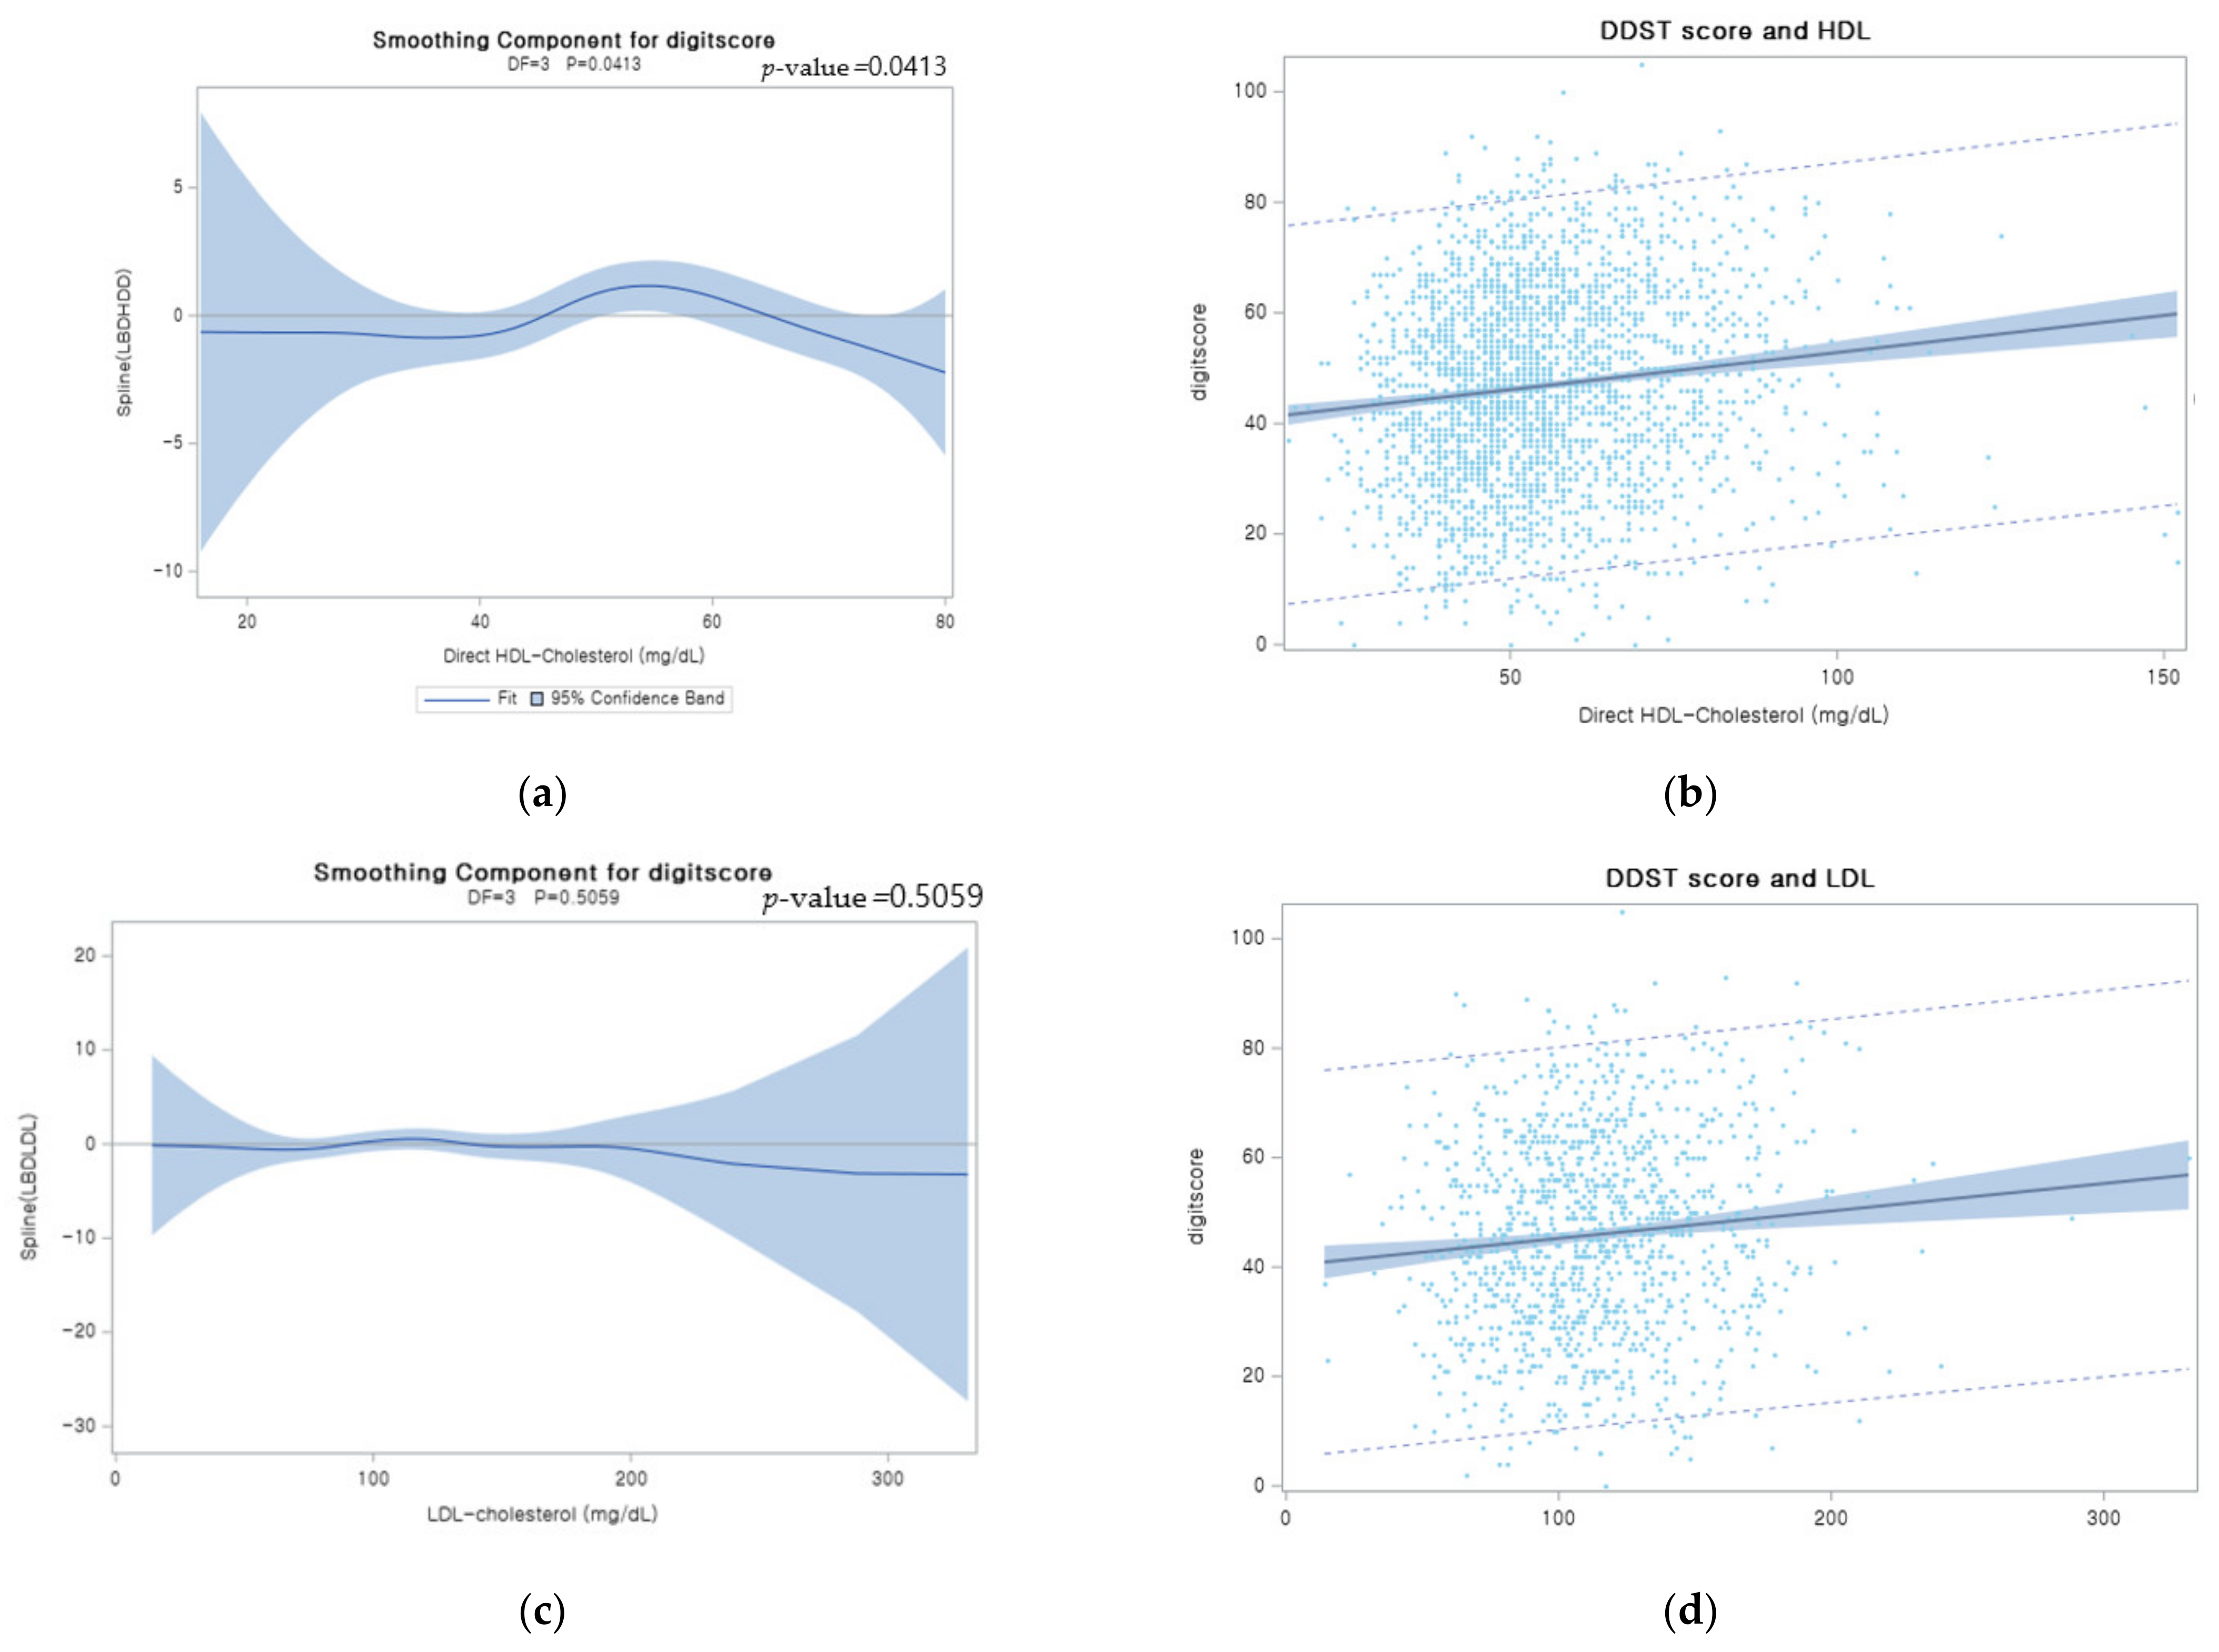
3.4. Multiple Linear Regression and Logistic Regression Analysis of the Association between Lipid Profiles and DSST

Table 4 is divided into two parts according to the lipid profiles based on the continuous and categorical values. We analyzed multiple linear regression and logistic regression to examine the association between lipid profiles and DSST. The DSST score showed a positive association with an increase in one unit of HDL (beta coefficient: 0.036). However, other lipid profiles showed no significant relationship with the cognitive test scores. For categorical values, we adopted the same scale as the baseline for each lipid profile (i.e., 40 mg/dL, 130 mg/dL, 150 mg/dL, and 200 mg/dL for HDL, LDL, TG, and TC, respectively). The reference group for each lipid profile was classified differently depending on the abnormal state of the figure. The analysis between HDL and DSST (beta coefficient: 3.113) showed a positive relationship and the analysis between HDL and TG (beta coefficient: −1.837) presented a negative relationship; however, LDL and TC did not show statistical significance. A group classified as having high HDL was more likely to show a higher score for the cognitive test than a group with low HDL. Moreover, a group classified as having low TG was more likely to show a lower score for the cognitive test than a group with high TG.
A low DSST score represented a high likelihood of cognitive impairment from our methodology in logistic regression analysis. The DSST score showed no relationship with continuous values of the lipid profiles. For categorical values, HDL was only associated with a 0.701 times increased risk of cognitive impairment (95% CI = 0.523–0.938). A group classified as having high HDL indicated a decreased risk of cognitive impairment.

4. Discussion

We investigated the association between serum lipid parameters and cognitive performance (assessed using the DSST) of the civilian elderly population in the United States. We found that older adults with higher blood concentrations of HDL had good DSST performance. This association was robust regardless of age, sex, ethnicity, income, education, smoking, exercise, BMI, depressive feelings, diabetes, chest pain, hypertension, and statin, in both the multiple linear regression model and logistic regression analysis. Moreover, our findings suggest that the low TG group was more likely to show a lower score for the cognitive test compared to the high TG group. LDL and TC levels were not associated with the DSST. Our findings indicate that HDL may be protective against cognitive performance decline.
Consistent with our findings, some previous studies have suggested the beneficial role of HDL-C in cognitive function [11,21,22]. A cross-sectional study of 540 elderly individuals in central New York showed that those with higher levels of HDL (≥60 mg/dL) scored much better on the Mini-Mental State Examination (MMSE), working memory, and global composite than their counterparts. Specifically, the mean z-scores (±standard error [SE]) observed in subjects with HDL ≥ 60 mg/dL vs. those with HDL < 40 mg/dL were 0.195 (0.076) vs. 0.000 (0.000) p < 0.05, MMSE and 0.192 (0.081) vs. 0.000 (0.000); p < 0.05 for working memory [11]. A study in Western Australia reported that HDL delayed the onset of Alzheimer’s disease and dementia. The beneficial influence of HDL on verbal episodic memory has presented great relevance. HDL cholesterol was the most significant predictor of California Verbal Learning Test (CVLT)—short delay free recall (β = 0.251, SE = 0.776, p < 0.01) and Discriminability score (β = 0.261, SE = 1.559, p < 0.05), among other verbal learning and memory tests [21]. A similar result regarding the positive aspect of HDL was found in a cohort of nonagenarians in the Mugello study. Multiple linear regression analysis showed a significant relationship between HDL and MMSE scores (β = 0.174, p = 0.037) in male individuals [22]. In contrast, a Chinese longitudinal study based on 2291 participants aged >60 years found no significant association between HDL and cognitive decline during the follow-up period [23]. This discrepancy may be due to the differences in the normal expected range of HDL assessment and sample participants’ characteristics. Further studies are needed to identify the HDL-cognition link.
Unfortunately, we were unable to find a significant relationship between TC and LDL and DSST scores. Although our study found an association between TG and the DSST scores (as shown in Table 4), only the multivariate linear regression analysis for the categorical groups showed the findings considering the different results from Table 3. Recent general literature reports have summarized the inconsistent results of lipid cognition [24,25]. Specifically, a study of Chinese cohort of 709 nonagenarians and centenarians (mean age 93.8 years) found no association between the levels of serum lipid/lipoprotein and mean MMSE score [26]. A longitudinal cohort study from northern Manhattan showed that plasma lipid levels do not affect the changes in cognitive performance of memory, language, and visuospatial abilities in the elderly followed up for 7 years [27]. Furthermore, few animal studies related to lipid-lowering treatment regarding cognitive enhancement have revealed conflicting results [28,29]. A possible explanation for the different results of lipid cognition may be the characteristics of the study population, study design, different guidelines, and the disturbance of cognitive performance measurements. In addition, the lipid levels at the age of the starting point of the study did not fully cover the earlier life of lipid levels. Although the different effects of lipid profile on cognitive impairment may vary depending on several conditions, an important interpretation of our study result implies that lipid cognition research still needs more attention. Evaluating the levels of lipid profile could be an early vital sign of cognitive impairment.
Herein, we are concerned with the reason for the association of HDL concentrations with poor cognitive performance. The underlying mechanism is still unclear, although the connection of HDL to cerebral and cerebrovascular diseases may help in understanding their link [22]. HDL cholesterol enables the removal of excess cholesterol from cells and carries it to the liver [22]. This process protects the arteries and prevents atherosclerosis [22]. High levels of HDL cholesterol have been related to the volume of hippocampal and damaged Aβ fibrillization [30]. In addition, it may serve as a cardiovascular protectant against reversing cholesterol transport and improving the delivery of apolipoprotein E (ApoE) [31,32]. The protective role of HDL helps preserve the regions around the brain concerned with verbal memory [21]. The levels of HDL have been examined in relation to verbal memory deficits in middle-aged adults from the Whitehall II study [33]. Given that memory deficit in the brain region is highly associated with cognitive function, a lower baseline of HDL is relevant to the temporal regions of lower gray matter volumes [34]. The positive link between HDL cholesterol and the cardiovascular system is likely to achieve high scores on cognitive performance tests.
Our study had some limitations. We used the public NHANES dataset, which offered a fraction of cognitive variables. Therefore, it was difficult to obtain multiple screening tools for cognitive impairment measurements and identification of individual participant’s ApoE genotype, which is known to be a genetic risk factor for cognitive and cardiovascular diseases. In addition, the inclusion of several factors, such as levels of serum insulin, serum cortisol, plasma Aβ, and thyroid hormones, would have strengthened our results. Since this study was cross-sectional, it was relatively difficult to explain the causal relationship between cognitive decline and lipid profiles. Therefore, our study may be further enhanced by expanding future longitudinal studies examining time relations among multiple cognitive domains. A longitudinal analysis would be able to track an individual’s cognitive decline and easily determine the long-term clinical significance [21].

5. Conclusions

In conclusion, our study reported that higher HDL levels were positively associated with the DSST. Our study suggests that reduced HDL levels may be a factor associated with poor cognitive function. Modifiable lifestyle behavior changes and ingestion of a balanced healthy diet to maintain high HDL levels may be essential for better cognitive function in older adults.

Author Contributions

Conceptualization, K.-b.M. and J.-y.M.; methodology, K.-b.M. and J.-y.M.; validation, J.-y.M. and S.L.; formal analysis, K.-b.M. and J.L.; data curation, J.L. and S.L.; writing—original draft preparation, J.L. and J.-y.M.; writing—review and editing, K.-b.M.; visualization, J.L.; funding acquisition, K.-b.M. and J.-y.M. All authors have read and agreed to the published version of the manuscript.

Funding

This research was supported by the Basic Science Research Program through the National Research Foundation of Korea (NRF) funded by the Ministry of Education, Science and Technology (grant number, 2019R1A2C1004966 and 2020R1A2C1102097).

Institutional Review Board Statement

Not applicable.

Informed Consent Statement

Not applicable.

Data Availability Statement

Data can be downloaded from the “NHANES” database (https://www.cdc.gov/nchs/nhanes/index.htm, accessed on 12 September 2021).

Acknowledgments

This work was supported by the Education and Research Encouragement Fund of Seoul National University Hospital.

Conflicts of Interest

The authors declare no conflict of interest.

References

  1. Rodriguez, J.J.L.; Ferri, C.P.; Acosta, D.; Guerra, M.; Huang, Y.; Jacob, K.S.; Krishnamoorthy, E.S.; Salas, A.; Sosa, A.L.; Acosta, I.; et al. Prevalence of dementia in Latin America, India, and China: A population-based cross-sectional survey. Lancet 2008, 372, 464–474. [Google Scholar] [CrossRef] [Green Version]
  2. Majer, R.; Adeyi, O.; Bagoly, Z.; Simon, V.; Csiba, L.; Kardos, L.; Hortobágyi, T.; Frecska, E. Neuropsychiatric symptoms, quality of life and caregivers’ burden in dementia. Open Med. (Wars) 2020, 15, 905–914. [Google Scholar] [CrossRef] [PubMed]
  3. Alzheimer’s Association. 2020 Alzheimer’s disease facts and figures. Alzheimers Dement. 2020, 16, 391–460. [Google Scholar] [CrossRef] [PubMed]
  4. Heun, R.; Schoepf, D.; Potluri, R.; Natalwala, A. Alzheimer’s disease and co-morbidity: Increased prevalence and possible risk factors of excess mortality in a naturalistic 7-year follow-up. Eur. Psychiatry 2013, 28, 40–48. [Google Scholar] [CrossRef]
  5. Yao, S.; Liu, Y.; Zheng, X.; Zhang, Y.; Cui, S.; Tang, C.; Lu, L.; Xu, N. Do nonpharmacological interventions prevent cognitive decline? a systematic review and meta-analysis. Transl. Psychiatry 2020, 10, 19. [Google Scholar] [CrossRef] [Green Version]
  6. Cicconetti, P.; Riolo, N.; Priami, C.; Tafaro, L.; Ettore, E. Risk factors for cognitive impairment. Recenti Prog. Med. 2004, 95, 535–545. [Google Scholar]
  7. Zhou, H.; Deng, J.; Li, J.; Wang, Y.; Zhang, M.; He, H. Study of the relationship between cigarette smoking, alcohol drinking and cognitive impairment among elderly people in China. Age Ageing 2003, 32, 205–210. [Google Scholar] [CrossRef] [Green Version]
  8. Knopman, D.; Boland, L.L.; Mosley, T.; Howard, G.; Liao, D.; Szklo, M.; McGovern, P.; Folsom, A.R. Cardiovascular risk factors and cognitive decline in middle-aged adults. Neurology 2001, 56, 42–48. [Google Scholar] [CrossRef]
  9. Ortega, R.M.; Requejo, A.M.; Andrés, P.; López-Sobaler, A.M.; Quintas, M.E.; Redondo, M.R.; Navia, B.; Rivas, T. Dietary intake and cognitive function in a group of elderly people. Am. J. Clin. Nutr. 1997, 66, 803–809. [Google Scholar] [CrossRef] [Green Version]
  10. He, Q.; Li, Q.; Zhao, J.; Wu, T.; Ji, L.; Huang, G.; Ma, F. Relationship between plasma lipids and mild cognitive impairment in the elderly Chinese: A case-control study. Lipids Health Dis. 2016, 15, 146. [Google Scholar] [CrossRef] [Green Version]
  11. Crichton, G.E.; Elias, M.F.; Davey, A.; Sullivan, K.J.; Robbins, M.A. Higher HDL cholesterol is associated with better cognitive function: The Maine-Syracuse study. J. Int. Neuropsychol. Soc. 2014, 20, 961–970. [Google Scholar] [CrossRef] [Green Version]
  12. Elias, P.K.; Elias, M.F.; D’Agostino, R.B.; Sullivan, L.M.; Wolf, P.A. Serum cholesterol and cognitive performance in the Framingham Heart Study. Psychosom. Med. 2005, 67, 24–30. [Google Scholar] [CrossRef] [Green Version]
  13. Zhao, B.; Shang, S.; Li, P.; Chen, C.; Dang, L.; Jiang, Y.; Wang, J.; Huo, K.; Deng, M.; Wang, J.; et al. The gender- and age- dependent relationships between serum lipids and cognitive impairment: A cross-sectional study in a rural area of Xi’an, China. Lipids Health Dis. 2019, 18, 4. [Google Scholar] [CrossRef] [Green Version]
  14. Mefford, M.T.; Chen, L.; Lewis, C.E.; Muntner, P.; Sidney, S.; Launer, L.J.; Monda, K.L.; Ruzza, A.; Kassahun, H.; Rosenson, R.S.; et al. Long-Term Levels of LDL-C and Cognitive Function: The CARDIA Study. J. Int. Neuropsychol. Soc. 2021, 27, 1–10. [Google Scholar] [CrossRef]
  15. Baune, B.T.; Brignone, M.; Larsen, K.G. A Network Meta-Analysis Comparing Effects of Various Antidepressant Classes on the Digit Symbol Substitution Test (DSST) as a Measure of Cognitive Dysfunction in Patients with Major Depressive Disorder. Int. J. Neuropsychopharmacol. 2018, 21, 97–107. [Google Scholar] [CrossRef] [Green Version]
  16. National Health and Nutrition Examination Survey Home Page. Available online: https://wwwn.cdc.gov/Nchs/Nhanes/2011-2012/TCHOL_G.htm (accessed on 24 August 2021).
  17. National Health and Nutrition Examination Survey Home Page. Available online: https://wwwn.cdc.gov/Nchs/Nhanes/2011-2012/HDL_G.htm (accessed on 24 August 2021).
  18. Piepoli, M.F.; Hoes, A.W.; Agewall, S.; Albus, C.; Brotons, C.; Catapano, A.L.; Cooney, M.; Corra, U.; Cosyns, B.; Deaton, C.; et al. 2016 European Guidelines on cardiovascular disease prevention in clinical practice. Kardiol. Pol. 2016, 74, 821–936. [Google Scholar] [CrossRef] [Green Version]
  19. Group, U.H.-C.C. Role of fibrates in reducing coronary risk: A UK Consensus. Curr. Med. Res. Opin. 2004, 20, 241–247. [Google Scholar] [CrossRef]
  20. National Health and Nutrition Examination Survey. Available online: https://wwwn.cdc.gov/Nchs/Nhanes/2011-2012/CFQ_G.htm) (accessed on 24 August 2021).
  21. Bates, K.A.; Sohrabi, H.R.; Rainey-Smith, S.R.; Weinborn, M.; Bucks, R.S.; Rodrigues, M.; Beilby, J.; Howard, M.; Taddei, K.; Martins, G.; et al. Serum high-density lipoprotein is associated with better cognitive function in a cross-sectional study of aging women. Int. J. Neurosci. 2017, 127, 243–252. [Google Scholar] [CrossRef]
  22. Pancani, S.; Sofi, F.; Cecchi, F.; Macchi, C. HDL Cholesterol Is Independently Associated with Cognitive Function in Males But Not in Females within a Cohort of Nonagenarians: The MUGELLO Study. J. Nutr. Health Aging 2019, 23, 552–557. [Google Scholar] [CrossRef]
  23. Ma, C.; Yin, Z.; Zhu, P.; Luo, J.; Shi, X.; Gao, X. Blood cholesterol in late-life and cognitive decline: A longitudinal study of the Chinese elderly. Mol. Neurodegener. 2017, 12, 24. [Google Scholar] [CrossRef] [Green Version]
  24. Muldoon, M.F.; Ryan, C.M.; Sheu, L.; Yao, J.K.; Conklin, S.M.; Manuck, S.B. Serum phospholipid docosahexaenonic acid is associated with cognitive functioning during middle adulthood. J. Nutr. 2010, 140, 848–853. [Google Scholar] [CrossRef]
  25. Muldoon, M.F.; Ryan, C.M.; Yao, J.K.; Conklin, S.M.; Manuck, S.B. Long-chain omega-3 fatty acids and optimization of cognitive performance. Mil. Med. 2014, 179, 95–105. [Google Scholar] [CrossRef] [Green Version]
  26. Huang, C.Q.; Dong, B.R.; Wu, H.M.; Zhang, Y.L.; Wu, J.H.; Lu, Z.C.; Flaherty, J.H. Association of cognitive impairment with serum lipid/lipoprotein among Chinese nonagenarians and centenarians. Dement. Geriatr. Cogn. Disord. 2009, 27, 111–116. [Google Scholar] [CrossRef]
  27. Reitz, C.; Luchsinger, J.; Tang, M.X.; Manly, J.; Mayeux, R. Impact of plasma lipids and time on memory performance in healthy elderly without dementia. Neurology 2005, 64, 1378–1383. [Google Scholar] [CrossRef] [PubMed] [Green Version]
  28. Sparks, D.L.; Schreurs, B.G. Trace amounts of copper in water induce beta-amyloid plaques and learning deficits in a rabbit model of Alzheimer’s disease. Proc. Natl. Acad. Sci. USA 2003, 100, 11065–11069. [Google Scholar] [CrossRef] [PubMed] [Green Version]
  29. Schreurs, B.G.; Smith-Bell, C.A.; Darwish, D.S.; Stankovic, G.; Sparks, D.L. Classical conditioning of the rabbit’s nictitating membrane response is a function of the duration of dietary cholesterol. Nutr. Neurosci. 2007, 10, 159–168. [Google Scholar] [CrossRef] [PubMed]
  30. Wolf, H.; Hensel, A.; Arendt, T.; Kivipelto, M.; Winblad, B.; Gertz, H.J. Serum lipids and hippocampal volume: The link to Alzheimer’s disease? Ann. Neurol. 2004, 56, 745–748. [Google Scholar] [CrossRef] [PubMed]
  31. Khera, A.V.; Cuchel, M.; de la Llera-Moya, M.; Rodrigues, A.; Burke, M.F.; Jafri, K.; French, B.C.; Phillips, J.A.; Mucksavage, M.L.; Wilensky, R.L.; et al. Cholesterol efflux capacity, high-density lipoprotein function, and atherosclerosis. N. Engl. J. Med. 2011, 364, 127–135. [Google Scholar] [CrossRef] [Green Version]
  32. Mauch, D.H.; Nägler, K.; Schumacher, S.; Göritz, C.; Müller, E.C.; Otto, A.; Pfrieger, F.W. CNS synaptogenesis promoted by glia-derived cholesterol. Science 2001, 294, 1354–1357. [Google Scholar] [CrossRef]
  33. Singh-Manoux, A.; Gimeno, D.; Kivimaki, M.; Brunner, E.; Marmot, M.G. Low HDL cholesterol is a risk factor for deficit and decline in memory in midlife: The Whitehall II study. Arterioscler. Thromb. Vasc. Biol. 2008, 28, 1556–1562. [Google Scholar] [CrossRef] [Green Version]
  34. Ward, M.A.; Bendlin, B.B.; McLaren, D.G.; Hess, T.M.; Gallagher, C.L.; Kastman, E.K.; Rowley, H.A.; Asthana, S.; Carlsson, C.M.; Sager, M.A.; et al. Low HDL Cholesterol is Associated with Lower Gray Matter Volume in Cognitively Healthy Adults. Front. Aging Neurosci. 2010, 2. [Google Scholar] [CrossRef] [PubMed] [Green Version]
Figure 1. Comparison of the mean (±SD) cognitive test score (Digit Score) according to the abnormal baseline of different lipid profiles. Upper bar connecting to each side of the graph represents a significant difference using p-value.
Jcm 10 05405 g001
Figure 2. Plots of smoothing spline function of digit score (a) Plots of estimated smoothing spline function of digit score with 95% confidence band for Generalized Additive Model (GAM) when the independent variable was HDL. (b) Scatter plots of HDL when the independent variable was HDL. Smoothing spline estimated on the basis of the distribution of digit score and HDL. Light blue color band indicated 95% confidence interval range of the distribution. (c) Plots of estimated smoothing spline function of digit score with 95% confidence band for Generalized Additive Model (GAM) when the independent variable was LDL; (d) scatter plots of HDL when the independent variable was LDL. (e) Plots of estimated smoothing spline function of digit score with 95% confidence band for Generalized Additive Model (GAM) when the independent variable was TG. (f) Scatter plots of HDL when the independent variable was TG. (g) Plots of estimated smoothing spline function of digit score with 95% confidence band for Generalized Additive Model (GAM) when the independent variable was TC. (h) Scatter plots of HDL when the independent variable was TC.
Jcm 10 05405 g002aJcm 10 05405 g002b
Table 1. Characteristics of the study population (n = 2215).
VariablesMean (SD) or n (%)
Age (y)68.96 ± 6.65
Sex
Male47.27 (%)
Female52.73 (%)
Race/Ethnicity
Mexican American9.16 (%)
White47.22 (%)
Black23.34 (%)
Asian8.26 (%)
Other Race12.01 (%)
Income
Low24.24 (%)
High75.76 (%)
Education
Non High School Grad23.79 (%)
High School Grad23.02 (%)
College Grad or above53.18 (%)
Smoking
Non experience at all12.33 (%)
Experienced at the past36.30 (%)
Current Smoking51.38 (%)
Exercise
Non40.27 (%)
Regularly 59.73 (%)
BMI (kg/m2)
Underweight1.58 (%)
Normal26.95 (%)
Overweight36.03 (%)
Obesity37.02 (%)
Depressive feeling
Yes22.84 (%)
No77.16 (%)
Diabetes
Yes4.56 (%)
No95.44 (%)
Chestpain
Yes20.90 (%)
No79.10 (%)
Hypertension
Yes35.25 (%)
No64.75 (%)
Statin
Yes37.79 (%)
No62.21 (%)
Income: low (total annual family income <$20,000) and high (total annual family income ≥$20,000).
Table 2. Comparison of the means (SD) of lipid profiles and cognitive test score.
MeanSD
Lipid profiles
HDL55.1116.27
LDL113.0535.35
TG120.8970.9
Total Chol194.6142.63
Cognitive Test
DSST47.2717.33
HDL: high density lipoprotein; LDL: low density lipoprotein; TG: triglyceride. Total Chol: total cholesterol. DSST: digit symbol substitution test.
Table 3. Pearson correlation structure of lipid profiles-DSST and among lipid profiles.
DSST
No.Rp-Value
HDL22150.127<0.0001
LDL10780.1070.0005
TG10880.0190.5372
Total Chol22150.111<0.0001
Lipid Profiles
No.Rp-value
HDL-LDL10780.0790.0039
HDL-TG1088−0.419<0.0001
HDL-Total Chol22150.288<0.0001
LDL-TG10780.0890.0012
LDL-Total Chol10780.925<0.0001
TG-Total Chol10880.111<0.0001
Table 4. Multiple linear regression and logistic regression analysis of the association between lipid profiles and DSST.
DSSTBeta Cofficient (SE)p-ValueDSST
(Low/High)
Odds Ratio (95% Confidence Limits)p-Value
HDL0.036 (0.018)0.0447 0.994 (0.986–1.002)0.1506
LDL0.018 (0.011)0.1166 0.998 (0.993–1.004)0.5631
TG0.003 (0.005)0.5689 1.000 (0.998–1.002)0.9897
Total Chol0.013 (0.007)0.0514 0.997 (0.994–1.000)0.0852
Categorization of Lipid Profiles
HDL   a
High3.113 (0.647)<0.0001 0.701 (0.523–0.938)0.0167
Low
LDL   b
High
Low−0.837 (0.925) 0.3658 1.420 (0.946–2.131)0.0911
TG   c
High
Low−1.837 (0.920) 0.0461 1.194 (0.798–1.788)0.3888
Total   Chol   d
High
Low−0.468 (0.574) 0.4151 1.131 (0.875–1.462)0.3457
HDL   a High: >40, Low: ≤40; LDL   b High: >130, Low: ≤130; TG   c   High: 150, Low: <150; Total   Chol   d High: ≥200, Low: <200, Model was adjusted for age, gender, ethnicity, income, education, smoking, exercise, BMI, depression, diabetes, chest pain, hypertension and statin.
Publisher’s Note: MDPI stays neutral with regard to jurisdictional claims in published maps and institutional affiliations.

