
Increased Monocytic Myeloid-Derived Suppressor Cells in Whole Blood Predict Poor Prognosis in Patients with Plasma Cell Myeloma


Abstract
:1. Introduction
2. Materials and Methods
2.1. Patients
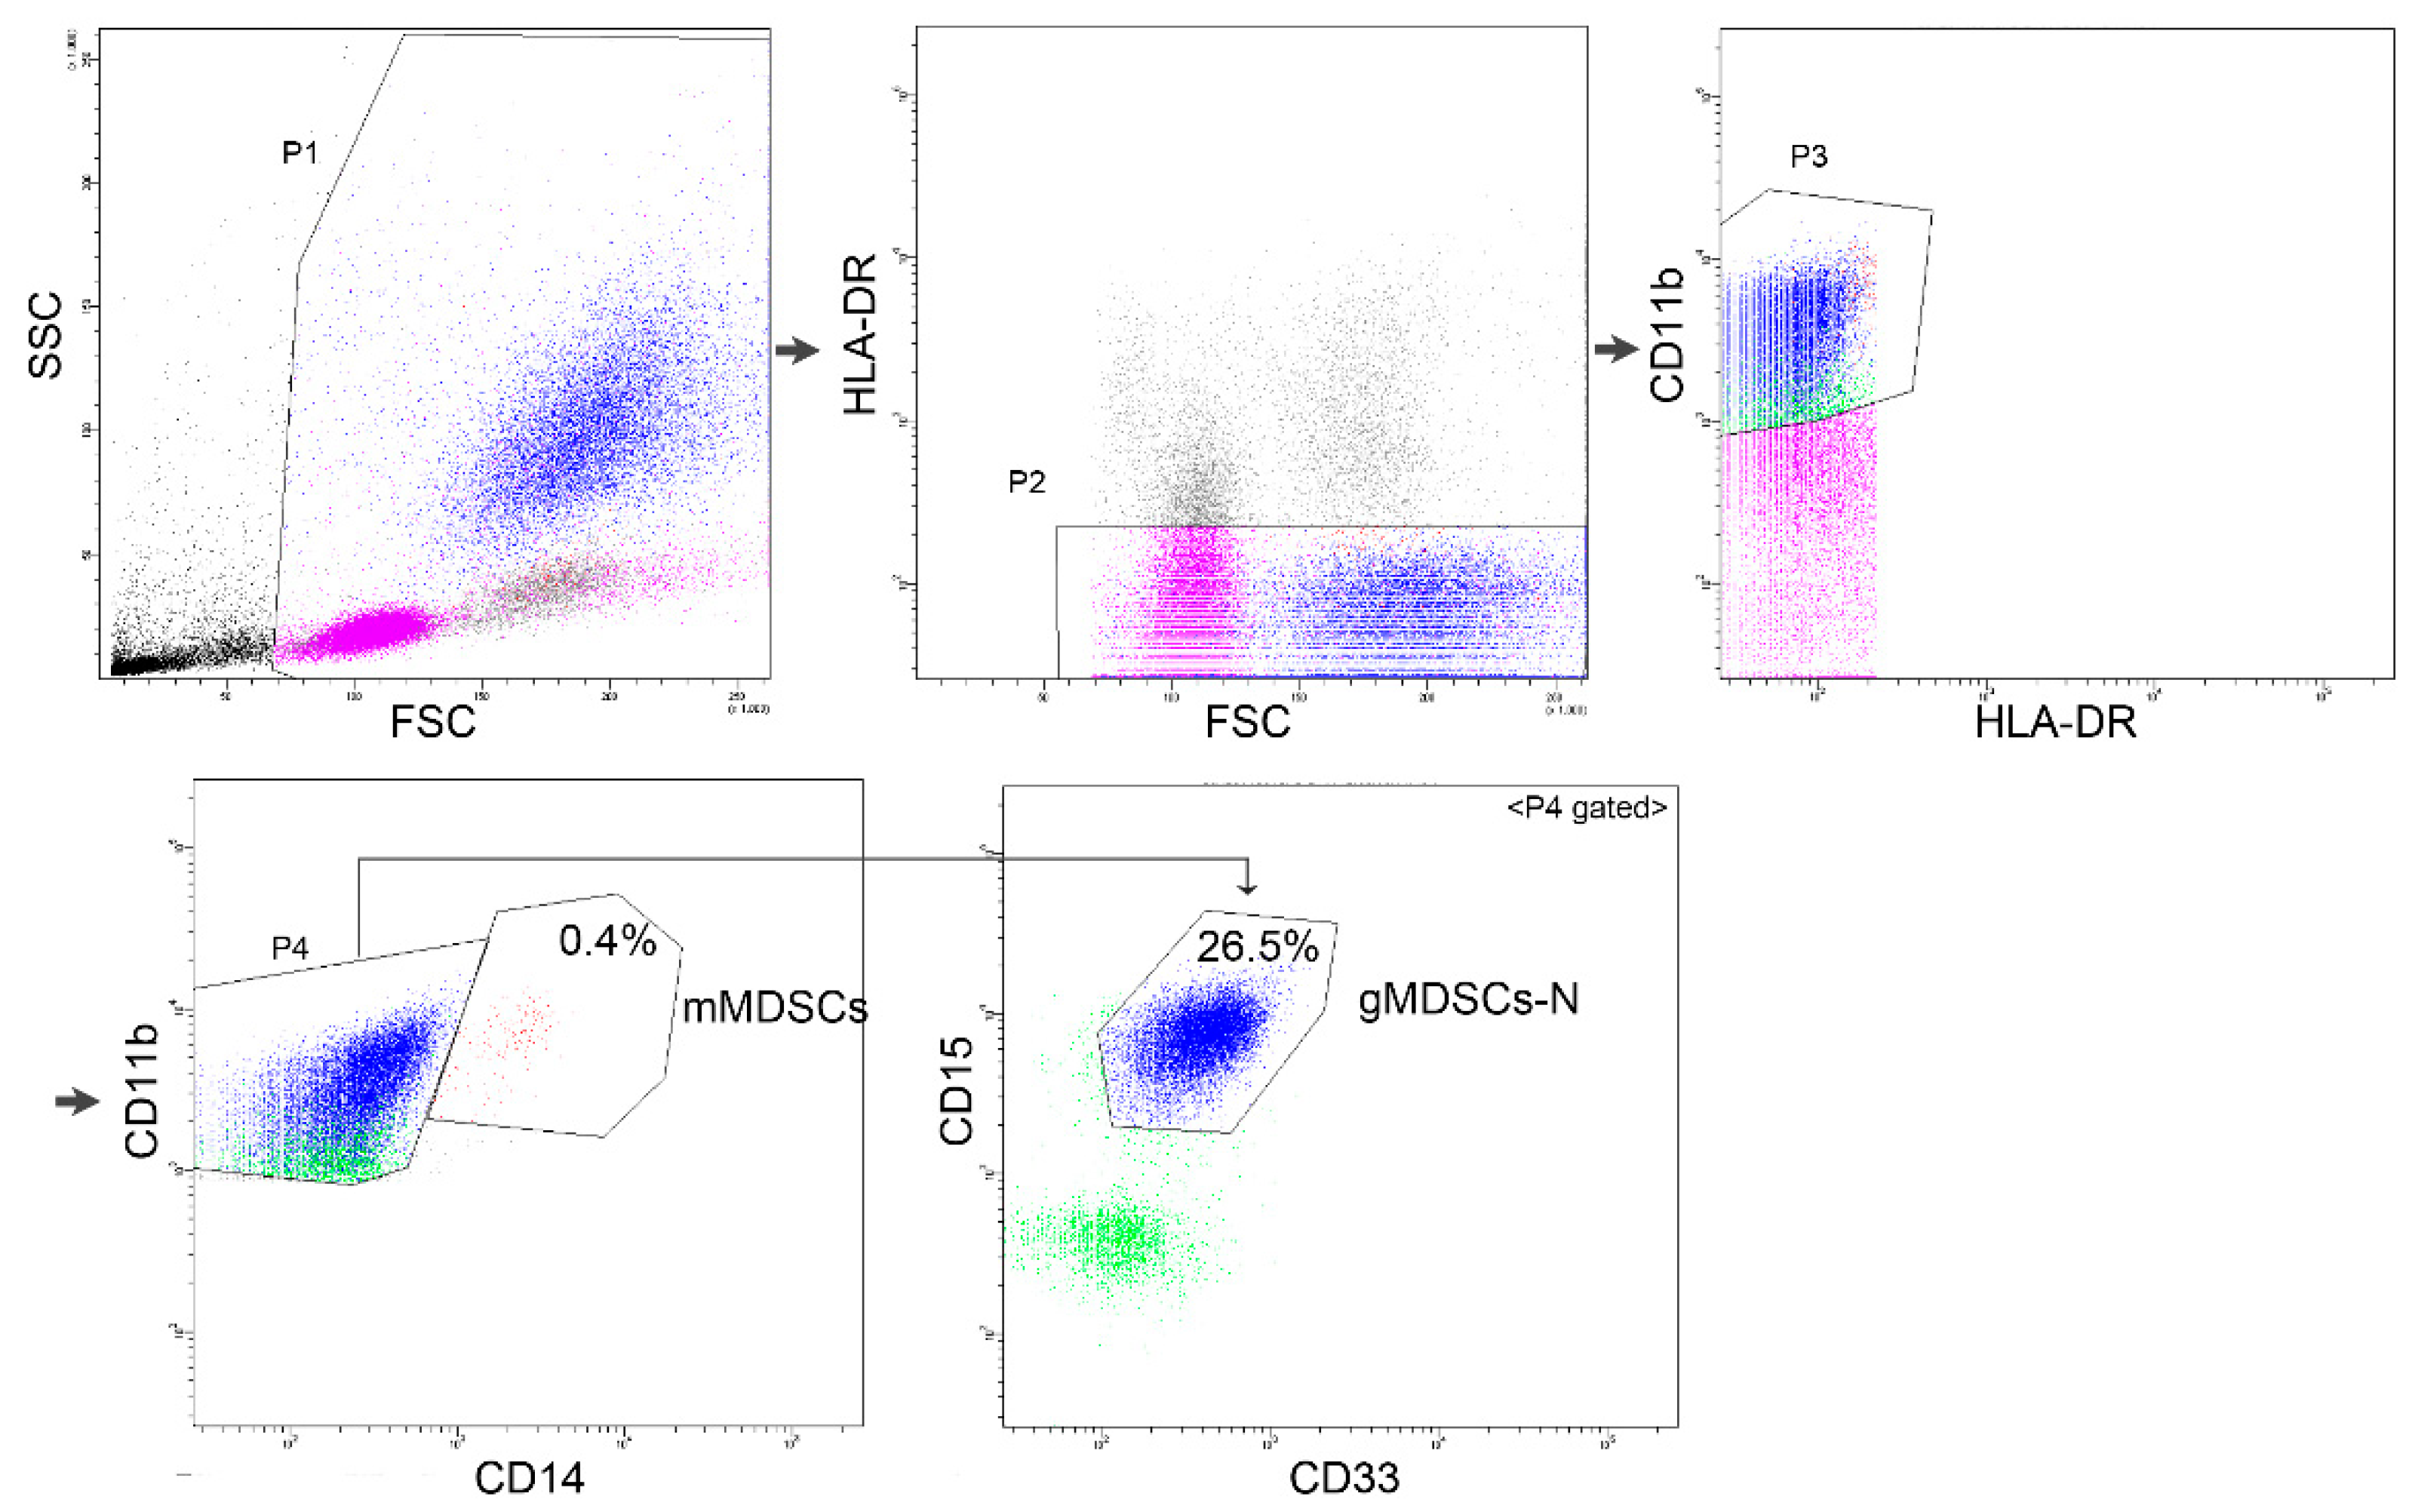
2.2. Flow Cytometry
2.3. Statistical Analysis
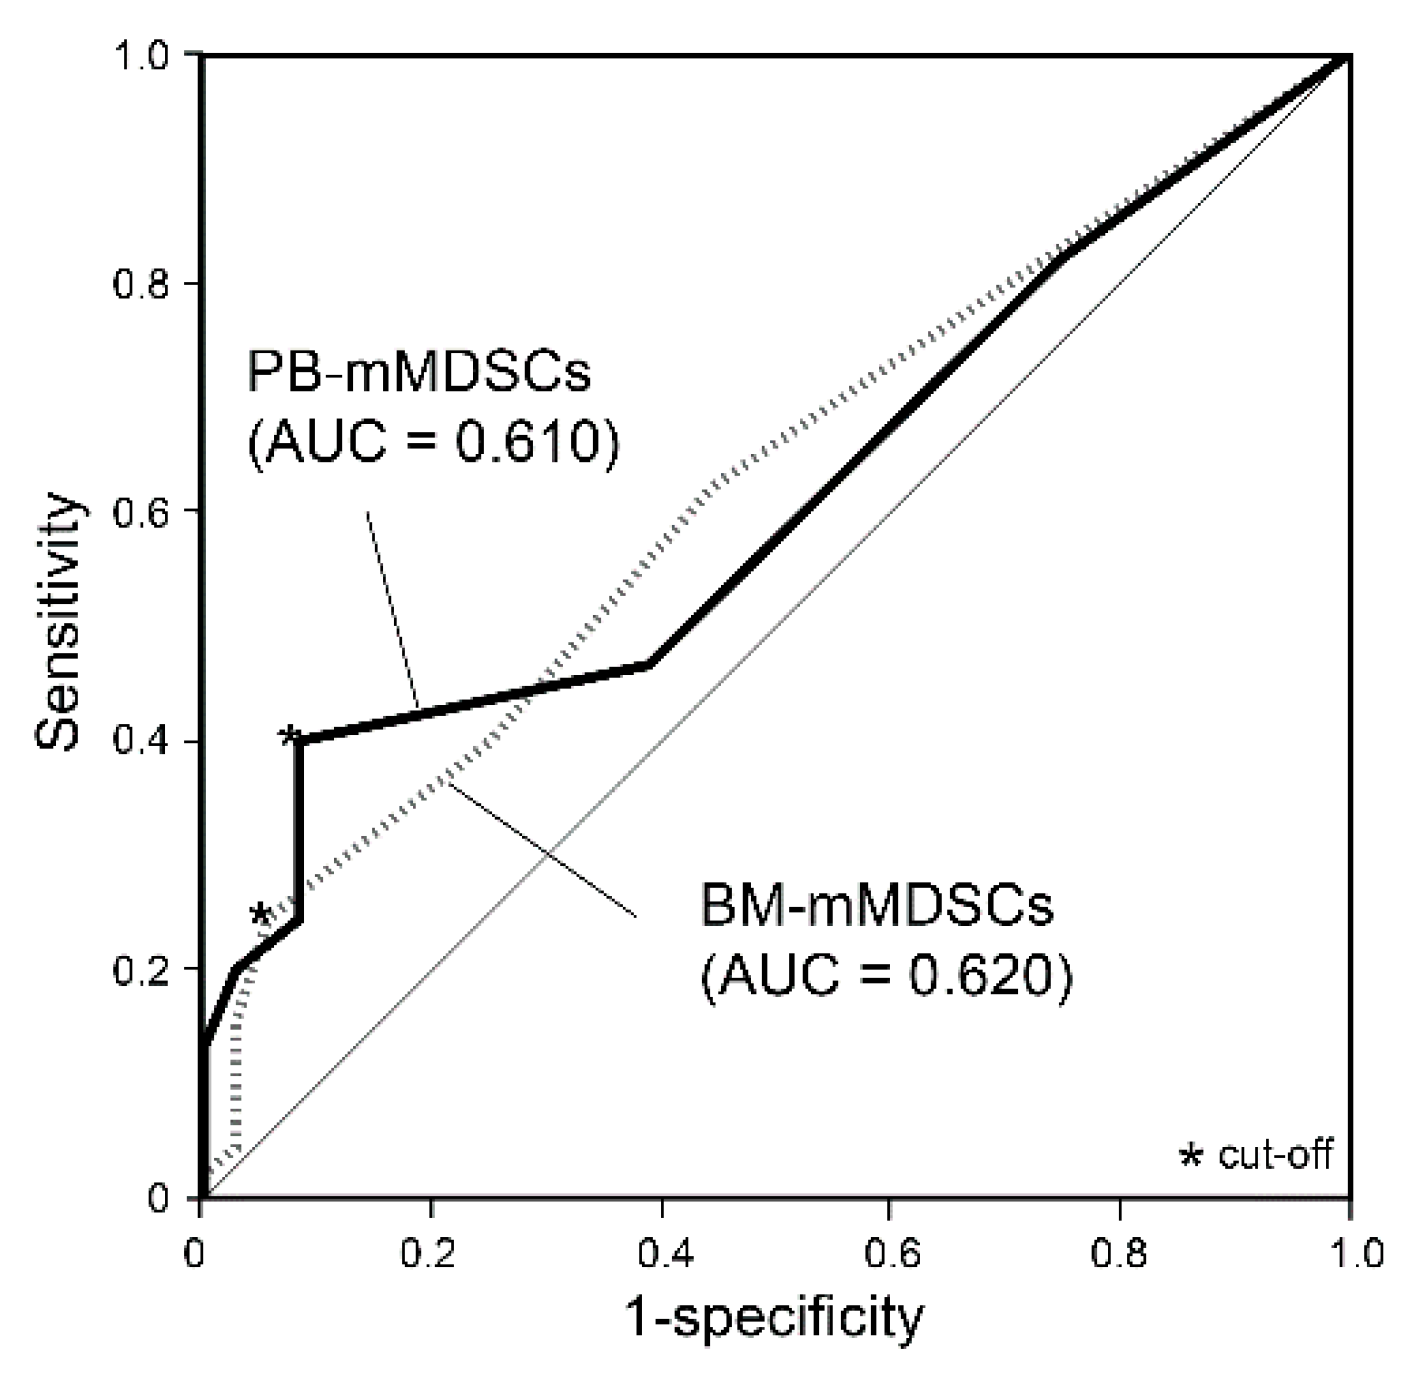
3. Results
3.1. Patient Characteristics
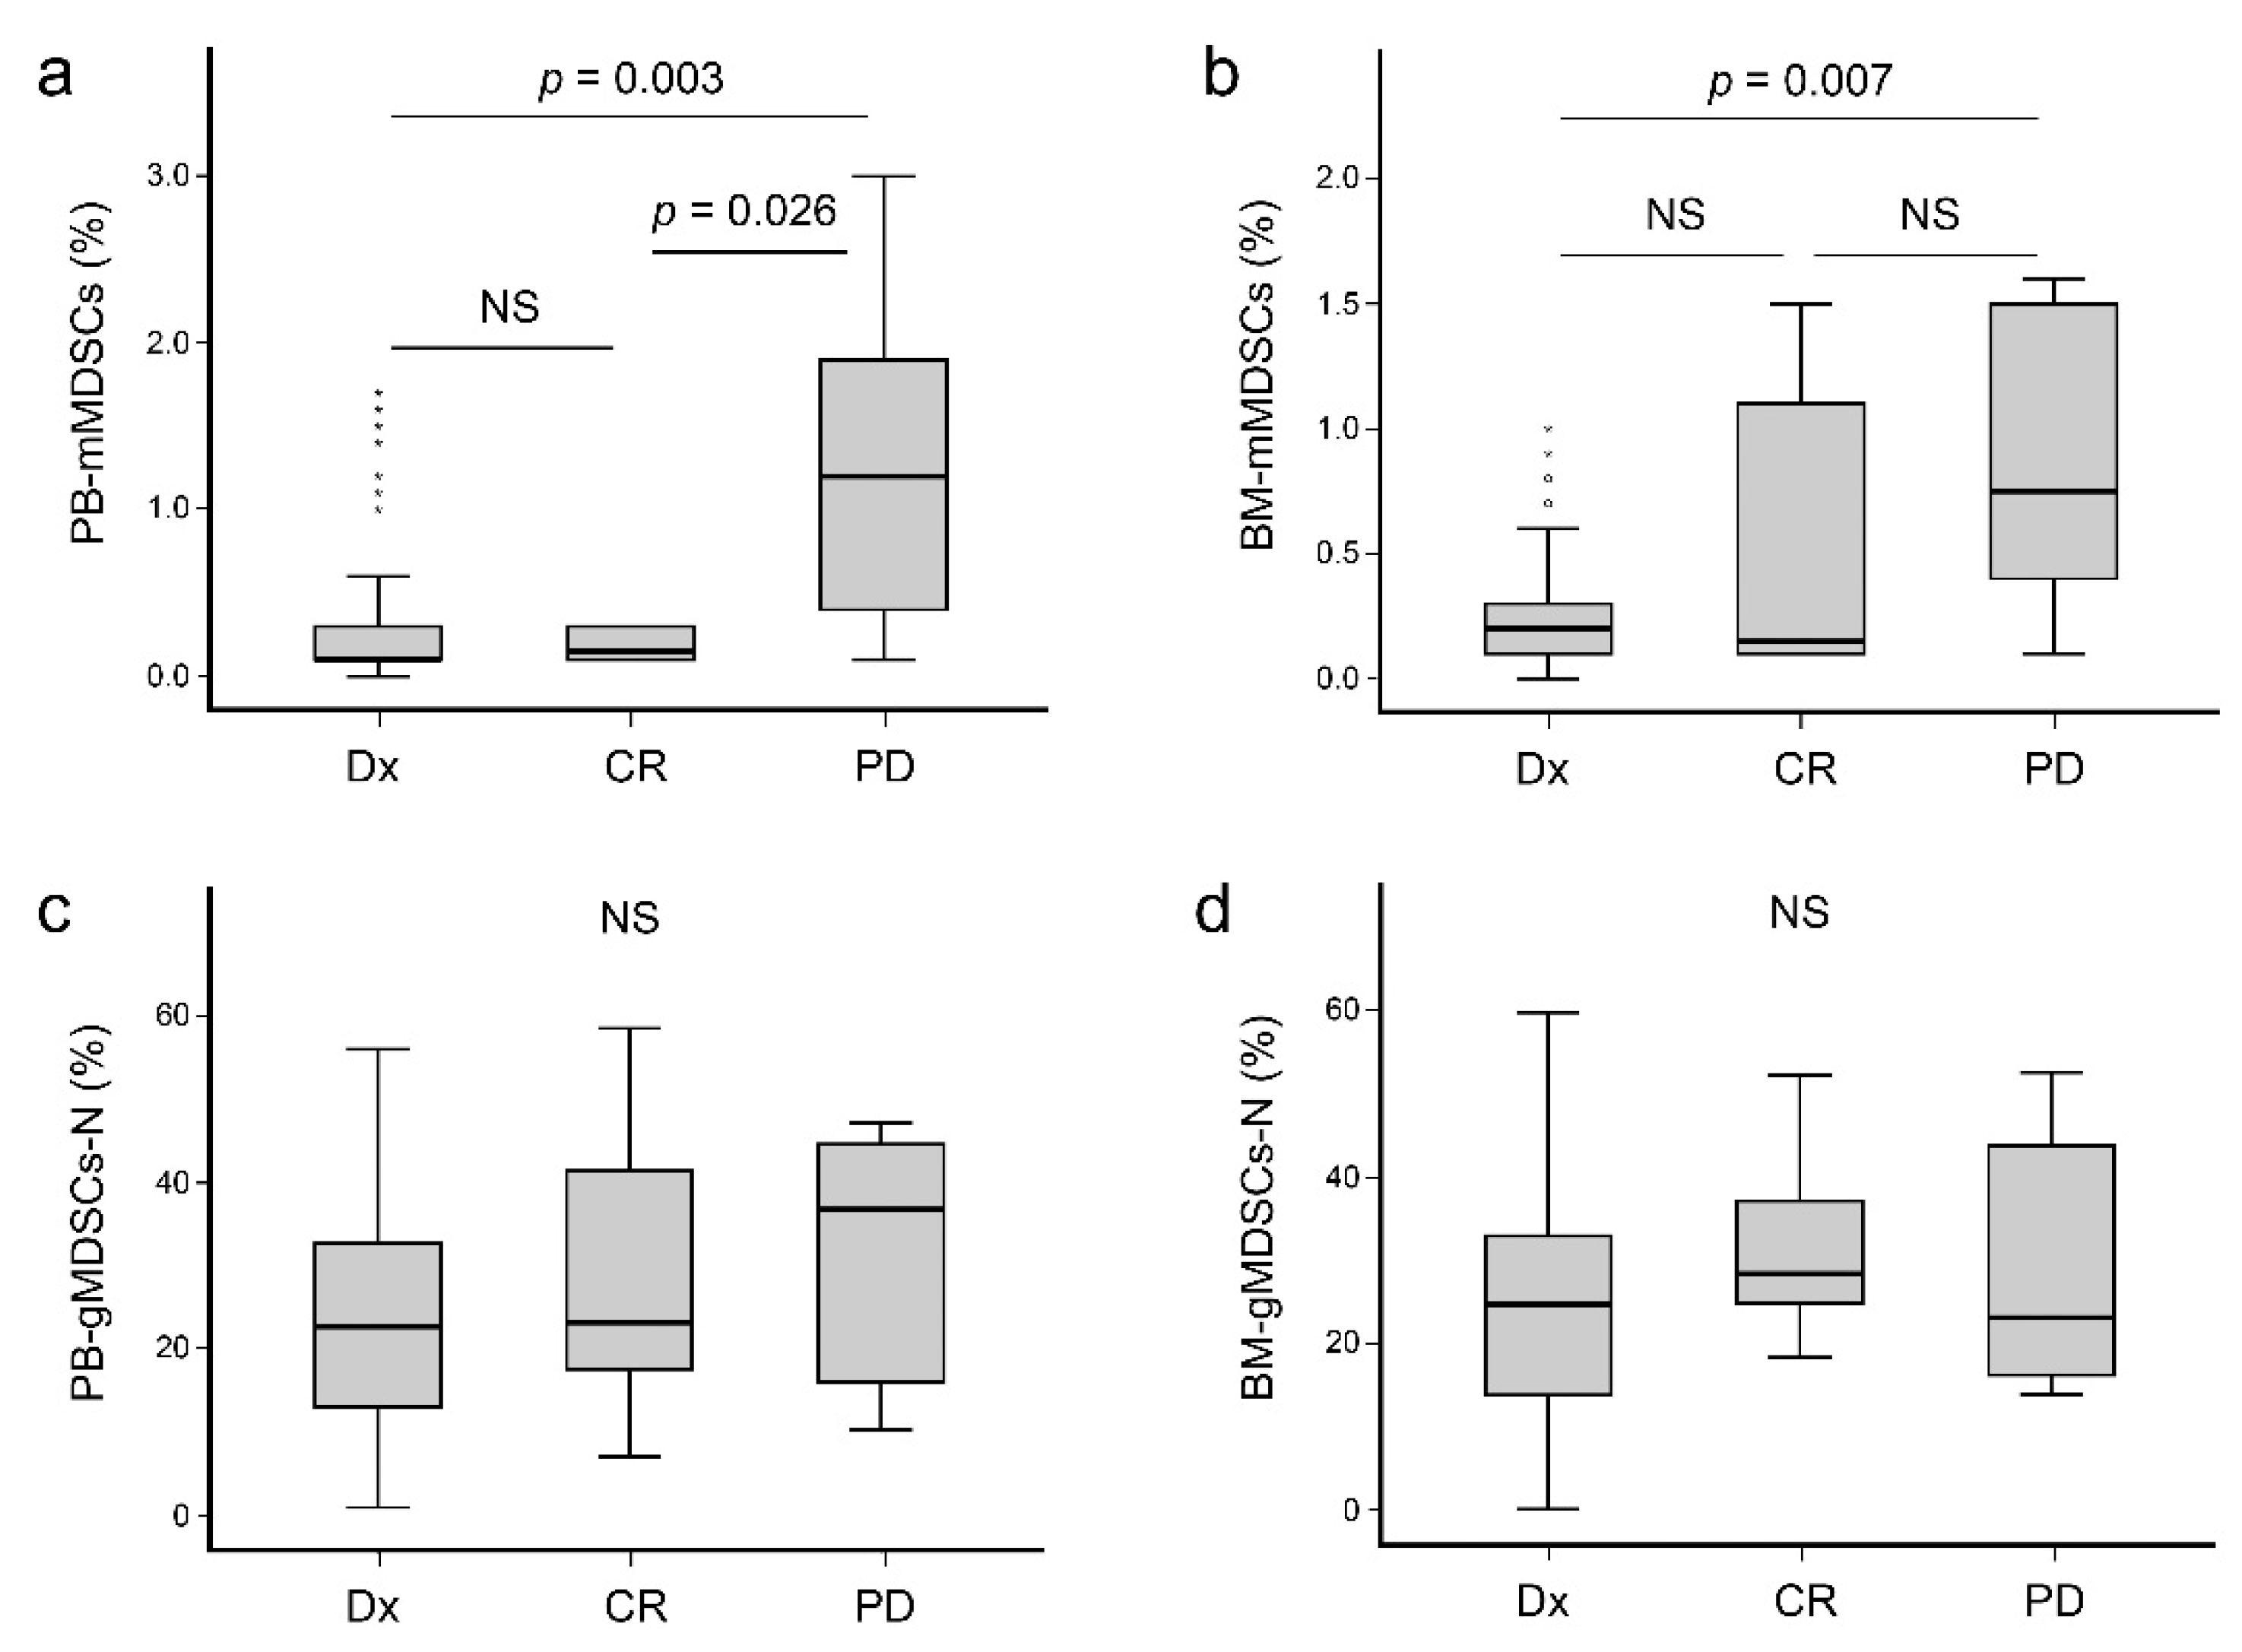
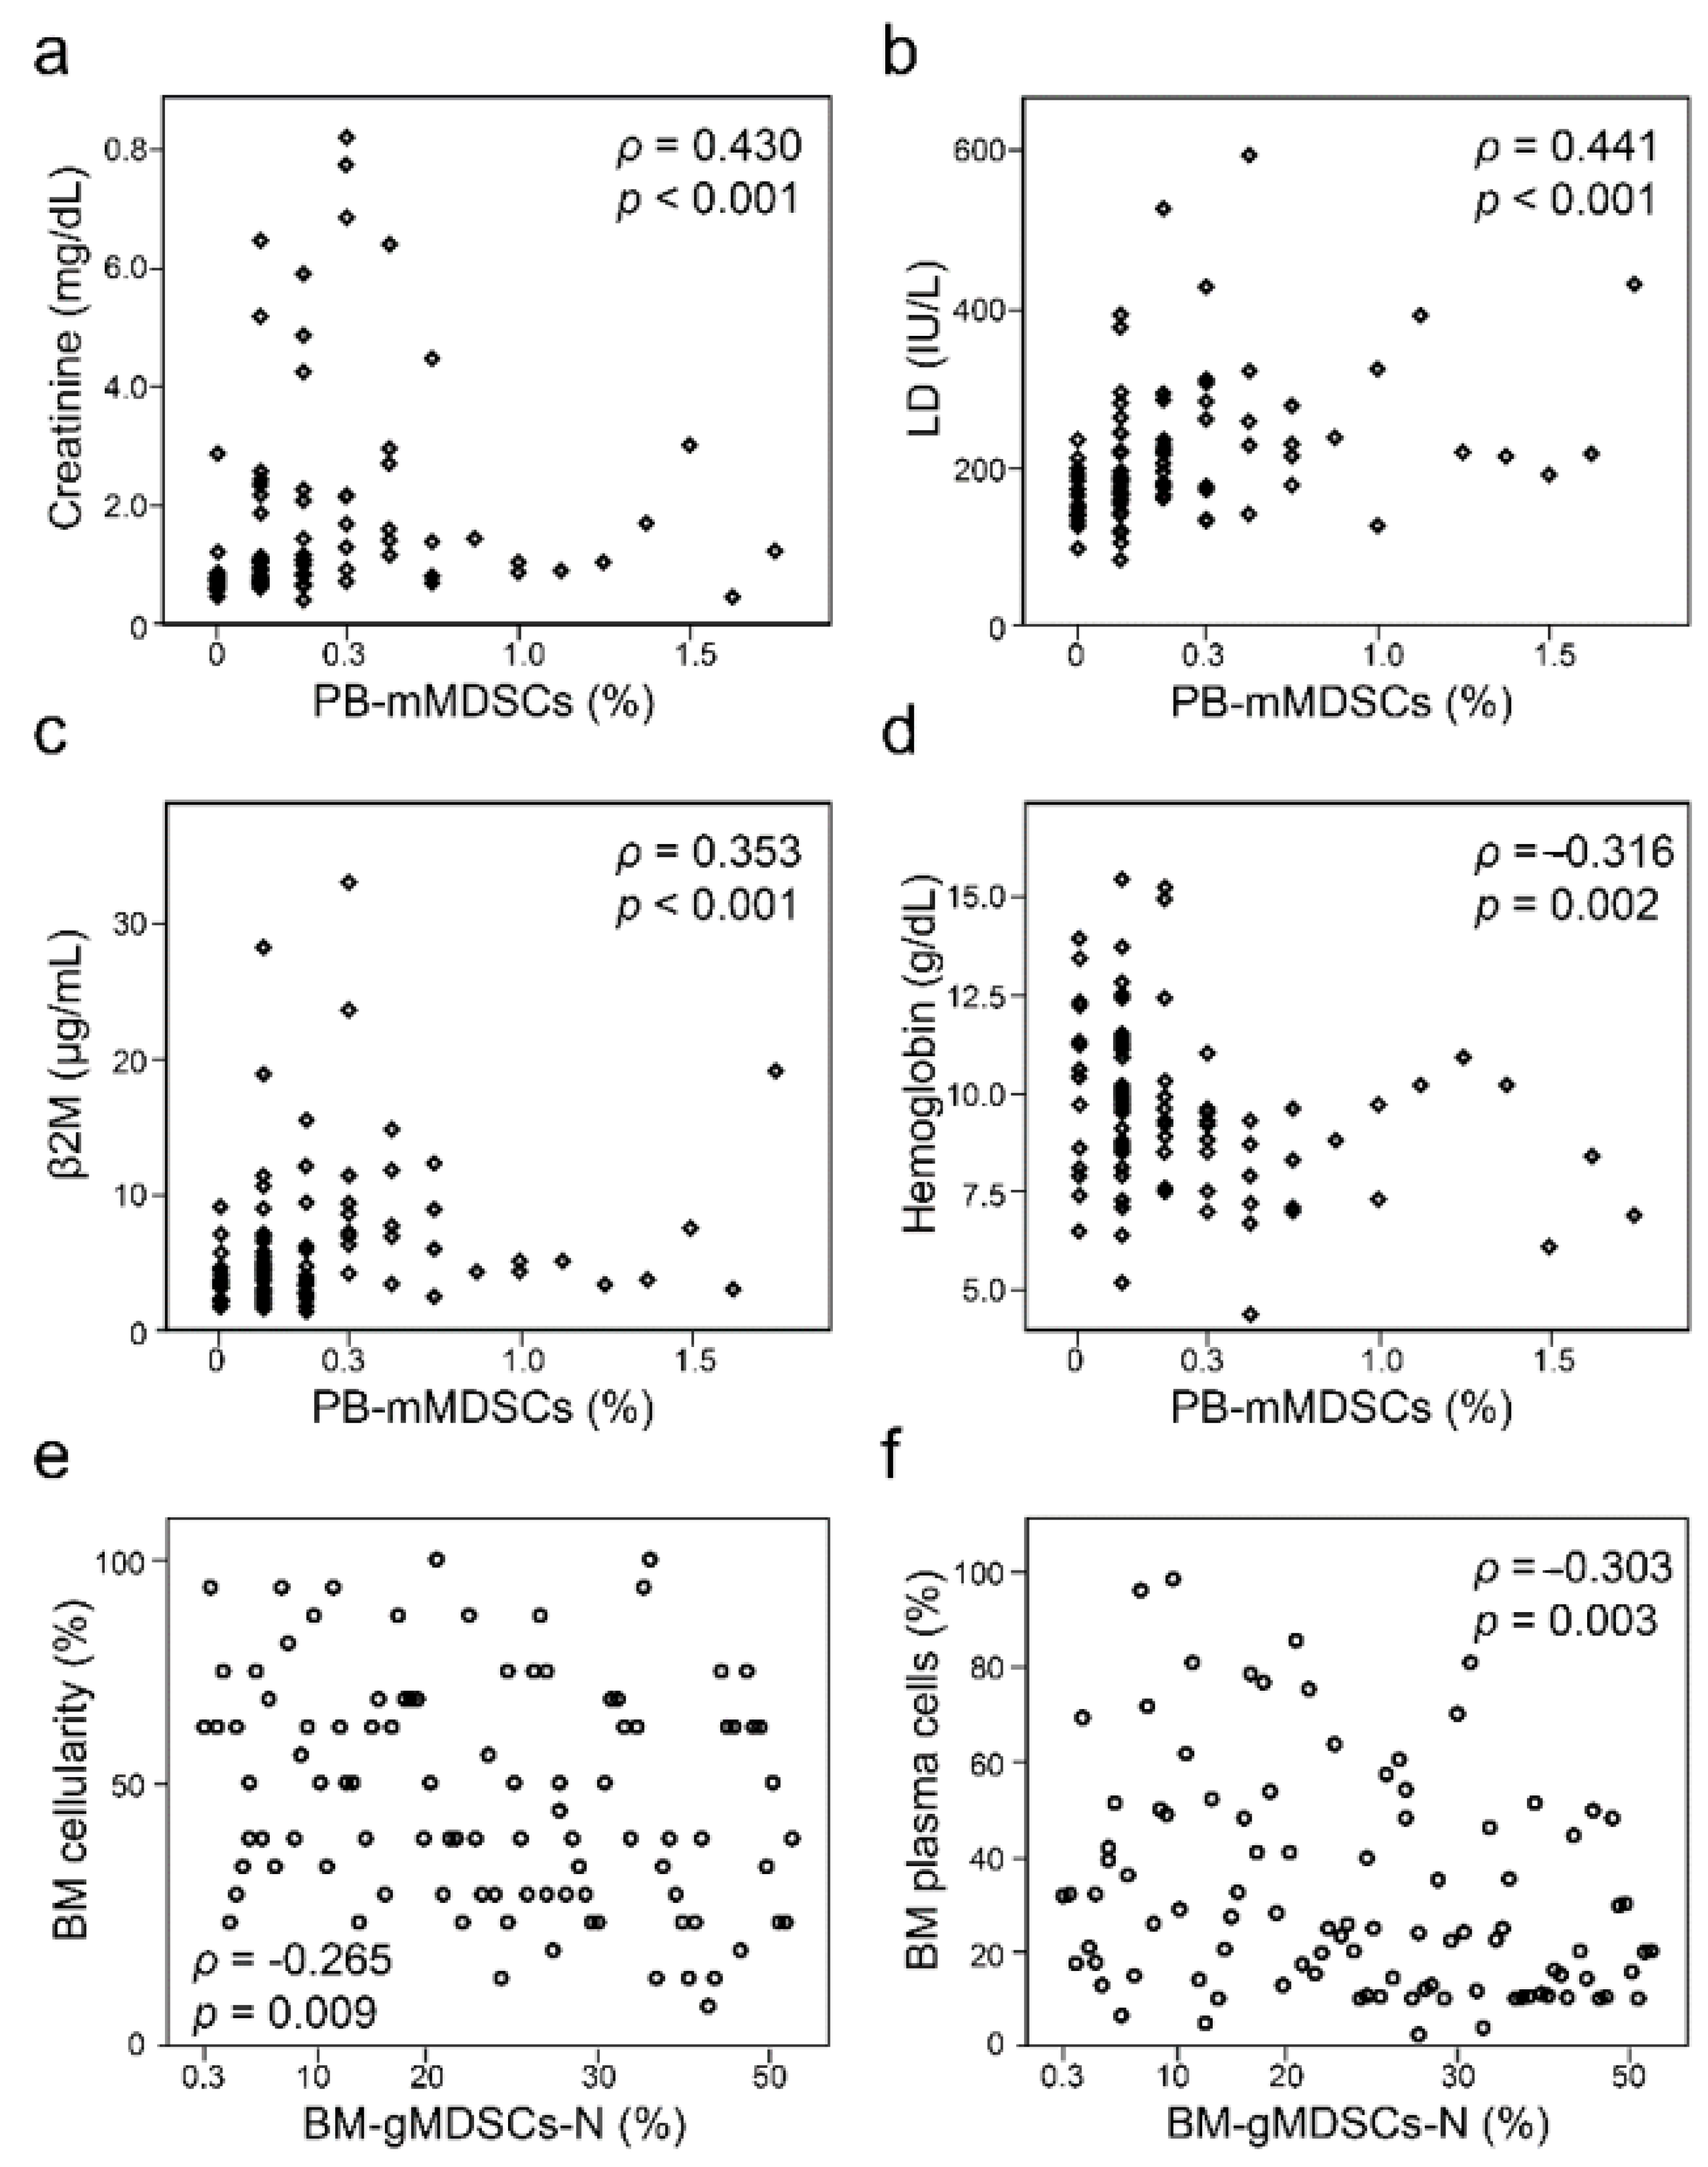
3.2. Laboratory and Clinical Association with Levels of MDSCs
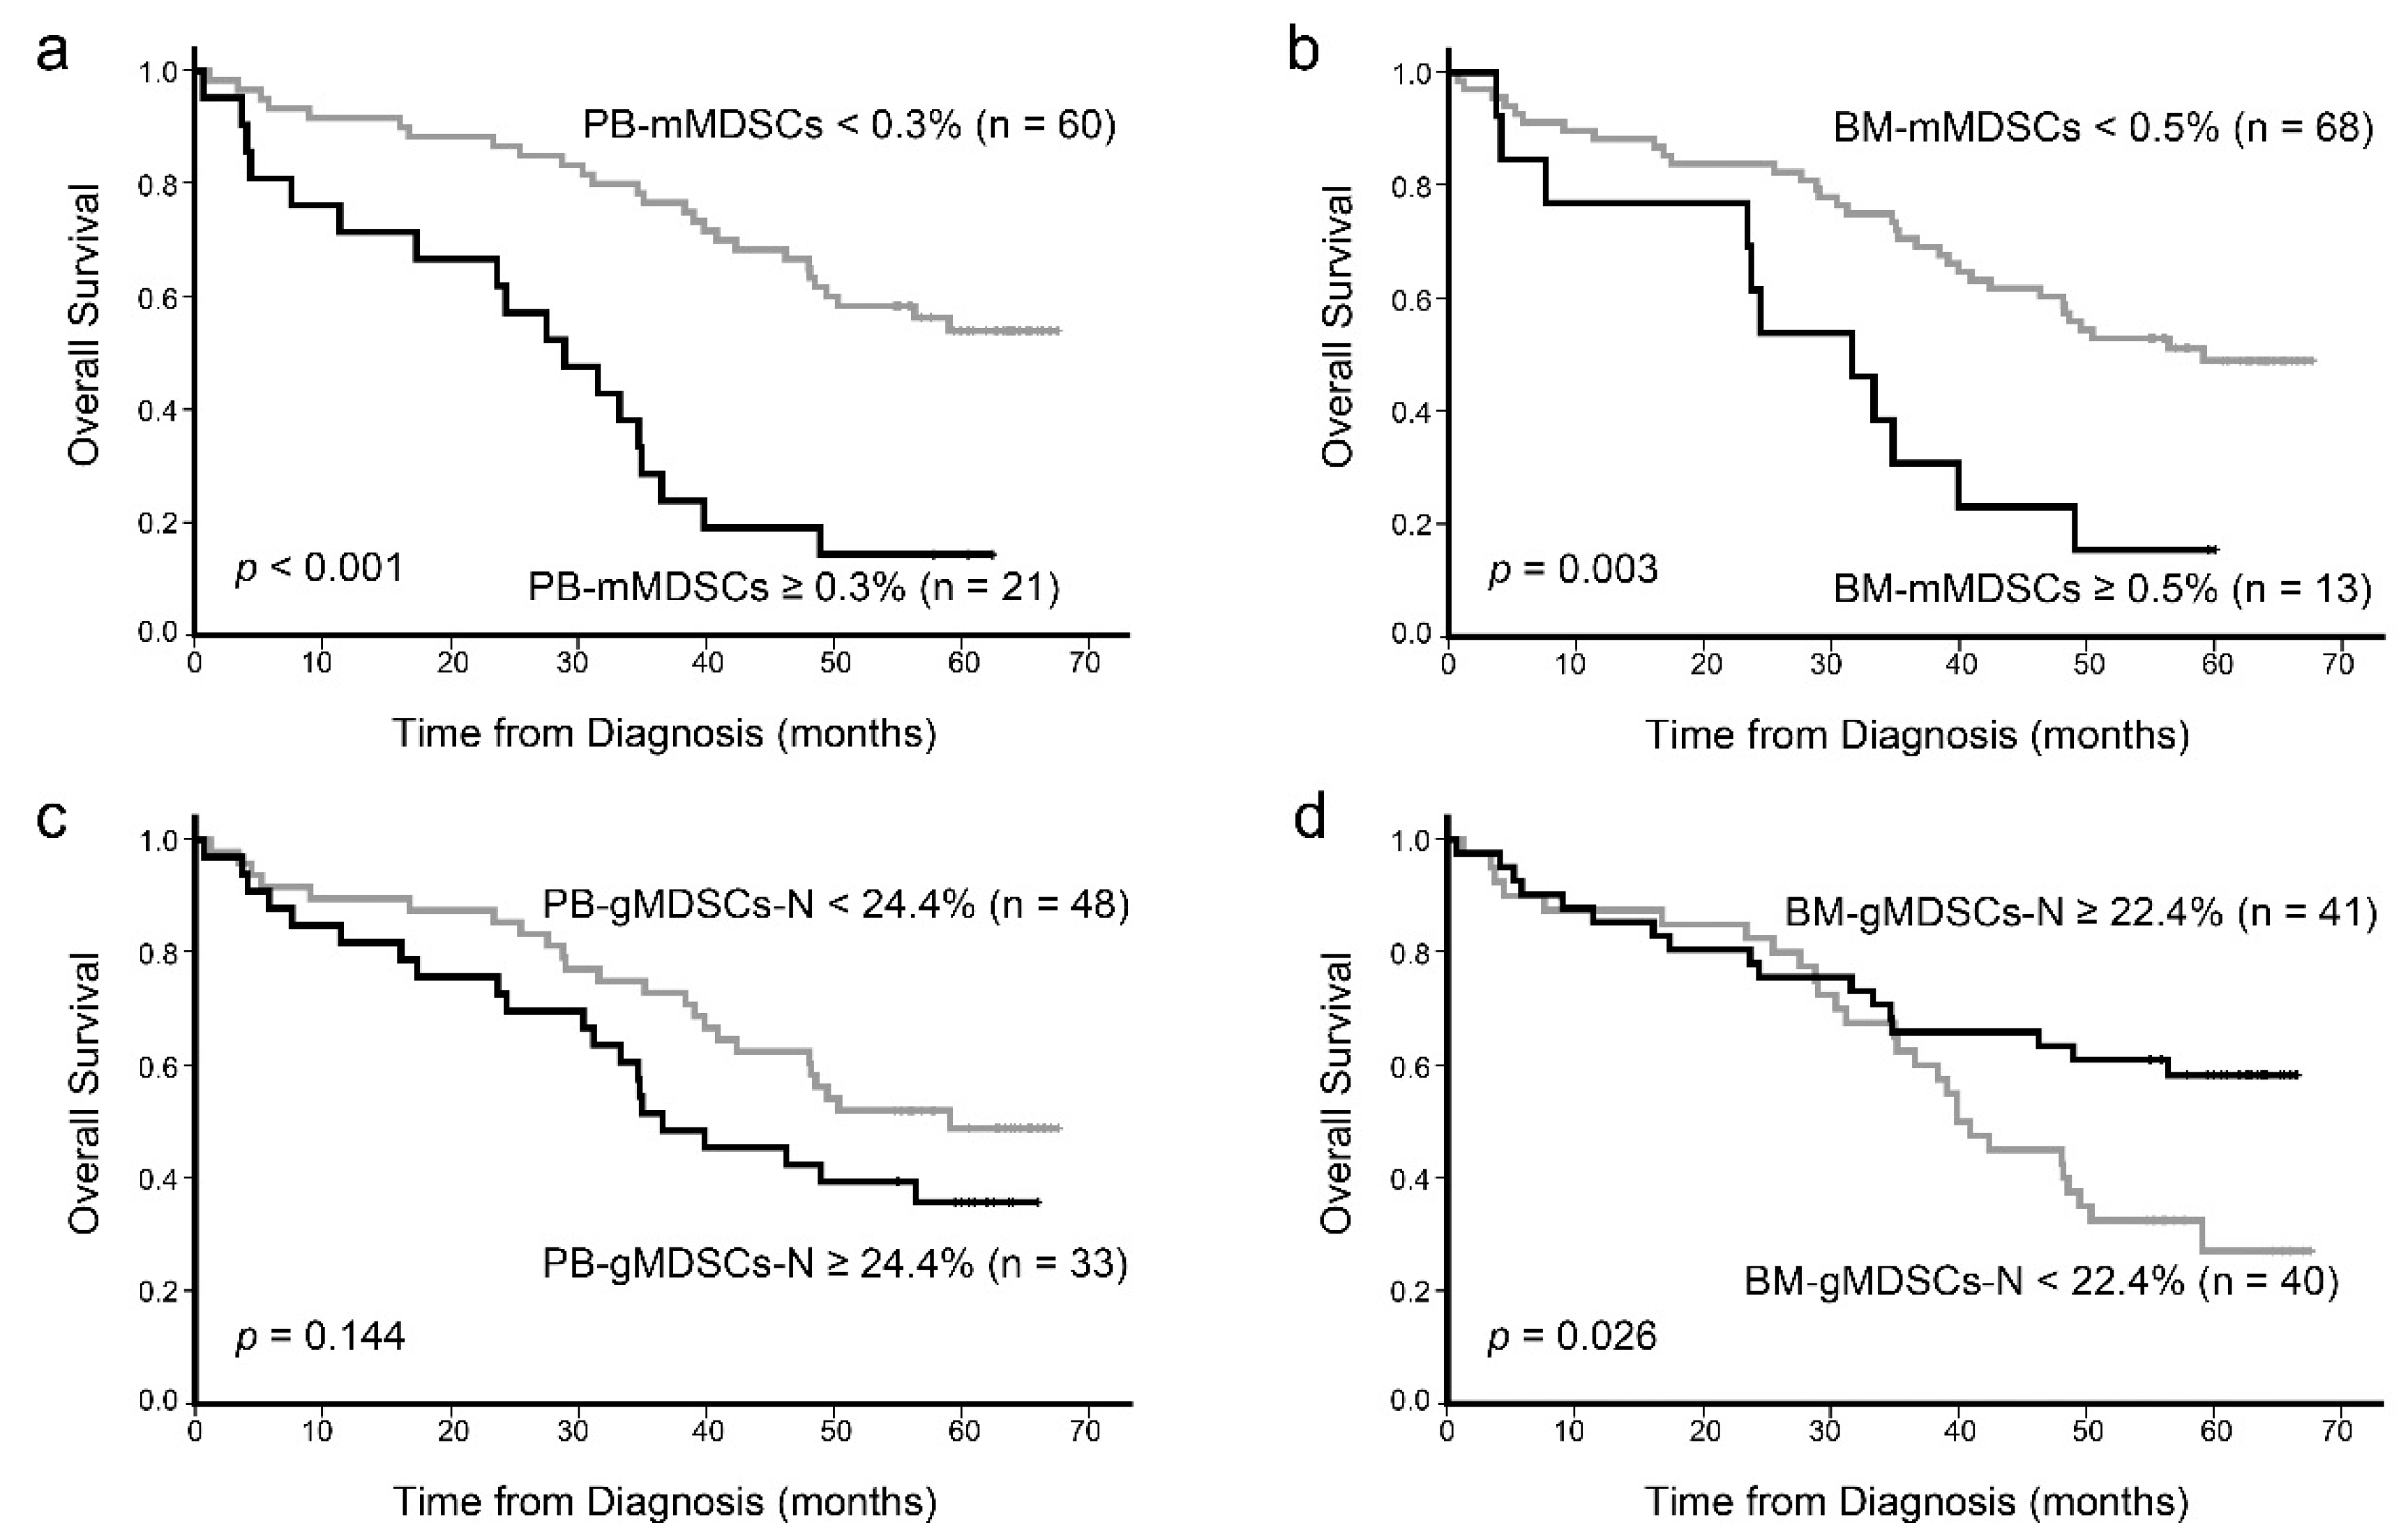
3.3. Prognostic Impact of MDSCs
4. Discussion
Author Contributions
Funding
Institutional Review Board Statement
Informed Consent Statement
Data Availability Statement
Conflicts of Interest
References
- Bronte, V.; Brandau, S.; Chen, S.H.; Colombo, M.P.; Frey, A.B.; Greten, T.F.; Mandruzzato, S.; Murray, P.J.; Ochoa, A.; Ostrand-Rosenberg, S.; et al. Recommendations for myeloid-derived suppressor cell nomenclature and characterization standards. Nat. Commun. 2016, 7, 12150. [Google Scholar] [CrossRef] [Green Version]
- Almand, B.; Clark, J.I.; Nikitina, E.; van Beynen, J.; English, N.R.; Knight, S.C.; Carbone, D.P.; Gabrilovich, D.I. Increased production of immature myeloid cells in cancer patients: A mechanism of immunosuppression in cancer. J. Immunol. 2001, 166, 678–689. [Google Scholar] [CrossRef] [Green Version]
- Nagaraj, S.; Youn, J.I.; Gabrilovich, D.I. Reciprocal relationship between myeloid-derived suppressor cells and T cells. J. Immunol. 2013, 191, 17–23. [Google Scholar] [CrossRef] [PubMed] [Green Version]
- Yang, Y.; Li, C.; Liu, T.; Dai, X.; Bazhin, A.V. Myeloid-Derived Suppressor Cells in Tumors: From Mechanisms to Antigen Specificity and Microenvironmental Regulation. Front. Immunol. 2020, 11, 1371. [Google Scholar] [CrossRef] [PubMed]
- Montero, A.J.; Diaz-Montero, C.M.; Kyriakopoulos, C.E.; Bronte, V.; Mandruzzato, S. Myeloid-derived suppressor cells in cancer patients: A clinical perspective. J. Immunother. 2012, 35, 107–115. [Google Scholar] [CrossRef] [PubMed]
- Ai, L.; Mu, S.; Wang, Y.; Wang, H.; Cai, L.; Li, W.; Hu, Y. Prognostic role of myeloid-derived suppressor cells in cancers: A systematic review and meta-analysis. BMC Cancer 2018, 18, 1220. [Google Scholar] [CrossRef] [PubMed] [Green Version]
- Waldron, T.J.; Quatromoni, J.G.; Karakasheva, T.A.; Singhal, S.; Rustgi, A.K. Myeloid derived suppressor cells: Targets for therapy. Oncoimmunology 2013, 2, e24117. [Google Scholar] [CrossRef] [Green Version]
- Tadmor, T.; Attias, D.; Polliack, A. Myeloid-derived suppressor cells--their role in haemato-oncological malignancies and other cancers and possible implications for therapy. Br. J. Haematol. 2011, 153, 557–567. [Google Scholar] [CrossRef] [PubMed]
- Andersen, M.H. The targeting of immunosuppressive mechanisms in hematological malignancies. Leukemia 2014, 28, 1784–1792. [Google Scholar] [CrossRef]
- Gorgun, G.T.; Whitehill, G.; Anderson, J.L.; Hideshima, T.; Maguire, C.; Laubach, J.; Raje, N.; Munshi, N.C.; Richardson, P.G.; Anderson, K.C. Tumor-promoting immune-suppressive myeloid-derived suppressor cells in the multiple myeloma microenvironment in humans. Blood 2013, 121, 2975–2987. [Google Scholar] [CrossRef] [Green Version]
- Wang, Z.; Zhang, L.; Wang, H.; Xiong, S.; Li, Y.; Tao, Q.; Xiao, W.; Qin, H.; Wang, Y.; Zhai, Z. Tumor-induced CD14+HLA-DR (-/low) myeloid-derived suppressor cells correlate with tumor progression and outcome of therapy in multiple myeloma patients. Cancer Immunol. Immunother. 2015, 64, 389–399. [Google Scholar] [CrossRef]
- Lee, S.E.; Lim, J.Y.; Kim, T.W.; Ryu, D.B.; Park, S.S.; Jeon, Y.W.; Yoon, J.H.; Cho, B.S.; Eom, K.S.; Kim, Y.J.; et al. Different role of circulating myeloid-derived suppressor cells in patients with multiple myeloma undergoing autologous stem cell transplantation. J. Immunother. Cancer 2019, 7, 35. [Google Scholar] [CrossRef] [Green Version]
- Malek, E.; de Lima, M.; Letterio, J.J.; Kim, B.G.; Finke, J.H.; Driscoll, J.J.; Giralt, S.A. Myeloid-derived suppressor cells: The green light for myeloma immune escape. Blood Rev. 2016, 30, 341–348. [Google Scholar] [CrossRef]
- Brodin, P.; Duffy, D.; Quintana-Murci, L. A Call for Blood-In Human Immunology. Immunity 2019, 50, 1335–1336. [Google Scholar] [CrossRef]
- ERA PerMed 2nd Joint Transnational Call for Proposals. 2019. Available online: https://www.era-learn.eu/network-information/networks/era-permed/personalised-medicine-multidisciplinary-research-towards-implementation/quantifying-systemic-immunosuppression-to-personalize-cancer-therapy (accessed on 8 August 2021).
- Kyle, R.A.; Rajkumar, S.V. Criteria for diagnosis, staging, risk stratification and response assessment of multiple myeloma. Leukemia 2009, 23, 3–9. [Google Scholar] [CrossRef]
- Bae, M.H.; Park, C.J.; Kim, B.H.; Cho, Y.U.; Jang, S.; Lee, D.H.; Seo, E.J.; Yoon, D.H.; Lee, J.H.; Suh, C. Increased circulating plasma cells detected by flow cytometry predicts poor prognosis in patients with plasma cell myeloma. Cytometry B Clin. Cytom. 2018, 94, 493–499. [Google Scholar] [CrossRef] [PubMed] [Green Version]
- Favaloro, J.; Liyadipitiya, T.; Brown, R.; Yang, S.; Suen, H.; Woodland, N.; Nassif, N.; Hart, D.; Fromm, P.; Weatherburn, C.; et al. Myeloid derived suppressor cells are numerically, functionally and phenotypically different in patients with multiple myeloma. Leuk. Lymphoma 2014, 55, 2893–2900. [Google Scholar] [CrossRef] [PubMed]
- Ramachandran, I.R.; Condamine, T.; Lin, C.; Herlihy, S.E.; Garfall, A.; Vogl, D.T.; Gabrilovich, D.I.; Nefedova, Y. Bone marrow PMN-MDSCs and neutrophils are functionally similar in protection of multiple myeloma from chemotherapy. Cancer Lett. 2016, 371, 117–124. [Google Scholar] [CrossRef] [PubMed]


| Characteristics | Disease Status | ||
|---|---|---|---|
| Diagnosis | CR | PD | |
| Total patients, n | 97 | 6 | 6 |
| Sex, n (%) | |||
| Male | 46 (47.4) | 2 (33.3) | 4 (66.7) |
| Female | 51 (52.6) | 4 (66.7) | 2 (33.3) |
| Median age (range), years | 66.5 (37–87) | 60 (44–71) ** | 59.5 (39–63) ** |
| Median follow-up duration (range), months | 62.2 (54.5–67.6) | – | – |
| Total death, n (%) | 56 (57.7) | – | – |
| Conventional cytogenetics abnormalities, n (%) | |||
| Available patients | 97 (100) | 5 (83.3) | 6 (100) |
| Monosomy 13 | 34 (35.1) | 1 (20.0) | 2 (33.3) |
| Hypodiploidy with structural aberrations | 3 (3.1) | 0 (0.0) | 0 (0.0) |
| t(11;14) * | 1 (1.0) | 0 (0.0) | 1 (16.7) |
| FISH abnormalities, n (%) | |||
| Available patients | 61 (62.9) | 2 (33.3) | 2 (33.3) |
| t(11;14) | 12 (19.7) | 0 (0.0) | 0 (0.0) |
| t(4;14) | 8 (13.1) | 0 (0.0) | 0 (0.0) |
| t(14;16) | 0 (0.0) | 0 (0.0) | 0 (0.0) |
| Deletion 17p | 1 (1.6) | 0 (0.0) | 0 (0.0) |
| International Staging System, n (%) | |||
| Available patients | 97 (100) | 4 (66.7) | 6 (100) |
| Stage I | 15 (15.5) | 1 (25.0) | 1 (16.7) |
| Stage II | 45 (46.4) | 1 (25.0) | 3 (50.0) |
| Stage III | 37 (38.1) | 2 (50.0) | 2 (33.3) |
| MDSCs | Median (Range) | Age | BM Cellularity | BM Plasma Cells | Ca | Cr | LD | β2M | Alb | Hb |
|---|---|---|---|---|---|---|---|---|---|---|
| Spearman’s ρ | ||||||||||
| PB-mMDSCs, % | 0.1 (0–1.7) | −0.070 | 0.142 | 0.074 | 0.122 | 0.430 ** | 0.441 ** | 0.353 ** | −0.117 | −0.316 ** |
| PB-gMDSCs-N, % | 22.8 (1.1–56.1) | 0.089 | −0.094 | −0.181 | 0.121 | 0.234 * | 0.265 * | 0.168 | 0.034 | −0.145 |
| Number of PB-mMDSCs, 106/L | 7.7 (0–394.4) | −0.081 | 0.134 | 0.039 | 0.161 | 0.430 ** | 0.438 ** | 0.355 ** | −0.084 | −0.239 * |
| Number of PB-gMDSCs-N, 106/L | 1128 (62–8491) | 0.018 | −0.062 | −0.172 | 0.163 | 0.279 ** | 0.293 ** | 0.195 | 0.062 | −0.059 |
| BM-mMDSCs, % | 0.2 (0–1.0) | 0.037 | 0.040 | −0.120 | 0.064 | 0.265 ** | 0.250* | 0.217 * | −0.028 | −0.159 |
| BM-gMDSCs-N, % | 24.9 (0.3–59.9) | 0.168 | −0.265 ** | −0.303 ** | 0.035 | 0.165 | 0.177 | 0.040 | 0.064 | −0.075 |
| Parameters | PB-mMDSCs < 0.3% | PB-mMDSCs ≥ 0.3% | p Value |
|---|---|---|---|
| Patients, n | 69 | 28 | |
| PB-mMDSCs, % | 0.1 (0–0.2) * | 0.4 (0.3–1.7) | <0.001 |
| PB-gMDSCs-N, % | 19.7 (3.4–48.4) | 32.3 (1.1–56.1) | <0.001 |
| Number of PB-mMDSCs, 106/L | 4.8 (0–21.4) | 26.2 (6.6–394.4) | <0.001 |
| Number of PB-gMDSCs-N, 106/L | 990 (66–4490) | 2136 (62–8491) | <0.001 |
| BM-mMDSCs, % | 0.1 (0–0.8) | 0.4 (0.1–1.0) | <0.001 |
| BM-gMDSCs-N, % | 22.3 (0.3–58.6) | 26.0 (0.7–59.9) | 0.442 |
| Age, y | 68 (46–87) | 68.5 (37–83) | 0.793 |
| Age ≥ 65 y, n (%) | 43 (62.3) | 16 (57.1) | 0.636 |
| Calcium, mg/dL | 8.9 (7.2–17.2) | 9.0 (7.7–12.5) | 0.786 |
| Creatinine, mg/dL | 0.85 (0.41–6.46) | 1.43 (0.46–8.2) | <0.001 |
| LD, IU/L | 180 (82–526) | 227.5 (125–594) | 0.001 |
| β2M, μg/mL | 3.7 (1.4–28.2) | 7.1 (2.5–75.2) | <0.001 |
| Albumin, g/dL | 3.3 (1.6–4.4) | 2.5 (1.4–4.6) | 0.018 |
| M-protein, g/dL | 2.1 (0–10) | 2.0 (0–5.4) | 0.981 |
| WBC count, 109/L | 4.9 (1.6–12.2) | 6.1 (2.2–23.2) | 0.007 |
| Hemoglobin, g/dL | 9.9 (5.2–15.4) | 8.6 (4.4–11.0) | <0.001 |
| Platelet count, 109/L | 176 (54–433) | 175 (40–510) | 0.484 |
| Lytic bone lesion present, n (%) | 53 (75.7) | 20 (74.1) | 0.970 |
| BM plasma cells, % | 23.2 (2.4–98.4) | 32.0 (10–85.4) | 0.176 |
| BM cellularity, % | 40 (15–100) | 58 (10–100) | 0.093 |
| ISS stage I, n (%) | 15 (21.7) | 0 (0.0) | - |
| ISS stage III, n (%) | 19 (27.5) | 18 (64.3) | 0.001 |
| High risk cytogenetics, n/n (%) ** | 27/56 (48.2) | 13/18 (72.2) | 0.075 |
| Mortality, n (%) | 33 (47.8) | 23 (82.1) | 0.002 |
| Prognostic Marker | Univariate | Multivariate | ||||
|---|---|---|---|---|---|---|
| HR | 95% CI | p Value | HR | 95% CI | p Value | |
| Age ≥ 65 y | 1.218 | 0.661–2.246 | 0.527 | 0.864 | 0.382–1.953 | 0.725 |
| ISS stage | 0.014 | 0.299 | ||||
| III vs. I | 4.182 | 1.436–12.183 | 0.009 | 2.938 | 0.746–11.568 | 0.123 |
| III vs. II | 1.853 | 1.001–3.431 | 0.050 | 1.480 | 0.593–3.692 | 0.400 |
| High risk cytogenetics * | 2.132 | 1.029–4.417 | 0.042 | 1.151 | 0.471–2.814 | 0.757 |
| PB-mMDSCs ≥ 0.3% | 3.610 | 1.957–6.659 | <0.001 | 2.840 | 1.049–7.691 | 0.040 |
| PB-mMDSCs, % | 5.896 | 2.606–13.338 | <0.001 | |||
| PB-gMDSCs-N, % | 1.012 | 0.987–1.038 | 0.336 | |||
| Number of PB-mMDSCs, 106/L | 1.009 | 1.005–1.014 | <0.001 | |||
| Number of PB-gMDSCs-N, 106/L | 1.000 | 1.000–1.000 | 0.114 | |||
| BM-mMDSCs, % | 5.291 | 1.597–17.534 | 0.006 | |||
| BM-gMDSCs-N, % | 0.982 | 0.960–1.005 | 0.131 | |||
| Calcium ≥ 10.0 mg/dL | 0.967 | 0.382–2.451 | 0.944 | |||
| Creatinine ≥ 2.0 mg/dL | 1.711 | 0.897–3.266 | 0.103 | |||
| LD ≥ 250 IU/L | 2.655 | 1.404–5.021 | 0.003 | 1.439 | 0.556–3.729 | 0.453 |
| β2M ≥ 5.5 μg/mL | 2.213 | 1.221–4.009 | 0.009 | |||
| Albumin < 3.5 g/dL | 2.071 | 1.044–4.105 | 0.037 | |||
| Hemoglobin < 8.5 g/L | 1.761 | 0.933–3.322 | 0.081 | 1.140 | 0.397–3.272 | 0.808 |
| BM plasma cells, % | 1.014 | 1.002–1.026 | 0.017 | |||
| BM cellularity, % | 1.015 | 1.004–1.027 | 0.006 | |||
Publisher’s Note: MDPI stays neutral with regard to jurisdictional claims in published maps and institutional affiliations. |
© 2021 by the authors. Licensee MDPI, Basel, Switzerland. This article is an open access article distributed under the terms and conditions of the Creative Commons Attribution (CC BY) license (https://creativecommons.org/licenses/by/4.0/).
Share and Cite
Bae, M.-H.; Park, C.-J.; Suh, C. Increased Monocytic Myeloid-Derived Suppressor Cells in Whole Blood Predict Poor Prognosis in Patients with Plasma Cell Myeloma. J. Clin. Med. 2021, 10, 4717. https://doi.org/10.3390/jcm10204717
Bae M-H, Park C-J, Suh C. Increased Monocytic Myeloid-Derived Suppressor Cells in Whole Blood Predict Poor Prognosis in Patients with Plasma Cell Myeloma. Journal of Clinical Medicine. 2021; 10(20):4717. https://doi.org/10.3390/jcm10204717
Chicago/Turabian StyleBae, Mi-Hyun, Chan-Jeoung Park, and Cheolwon Suh. 2021. "Increased Monocytic Myeloid-Derived Suppressor Cells in Whole Blood Predict Poor Prognosis in Patients with Plasma Cell Myeloma" Journal of Clinical Medicine 10, no. 20: 4717. https://doi.org/10.3390/jcm10204717
APA StyleBae, M.-H., Park, C.-J., & Suh, C. (2021). Increased Monocytic Myeloid-Derived Suppressor Cells in Whole Blood Predict Poor Prognosis in Patients with Plasma Cell Myeloma. Journal of Clinical Medicine, 10(20), 4717. https://doi.org/10.3390/jcm10204717