
The Accuracy of a Screening System for Carpal Tunnel Syndrome Using Hand Drawing

 , , , and
Abstract
:1. Introduction
2. Materials and Methods
2.1. Participants
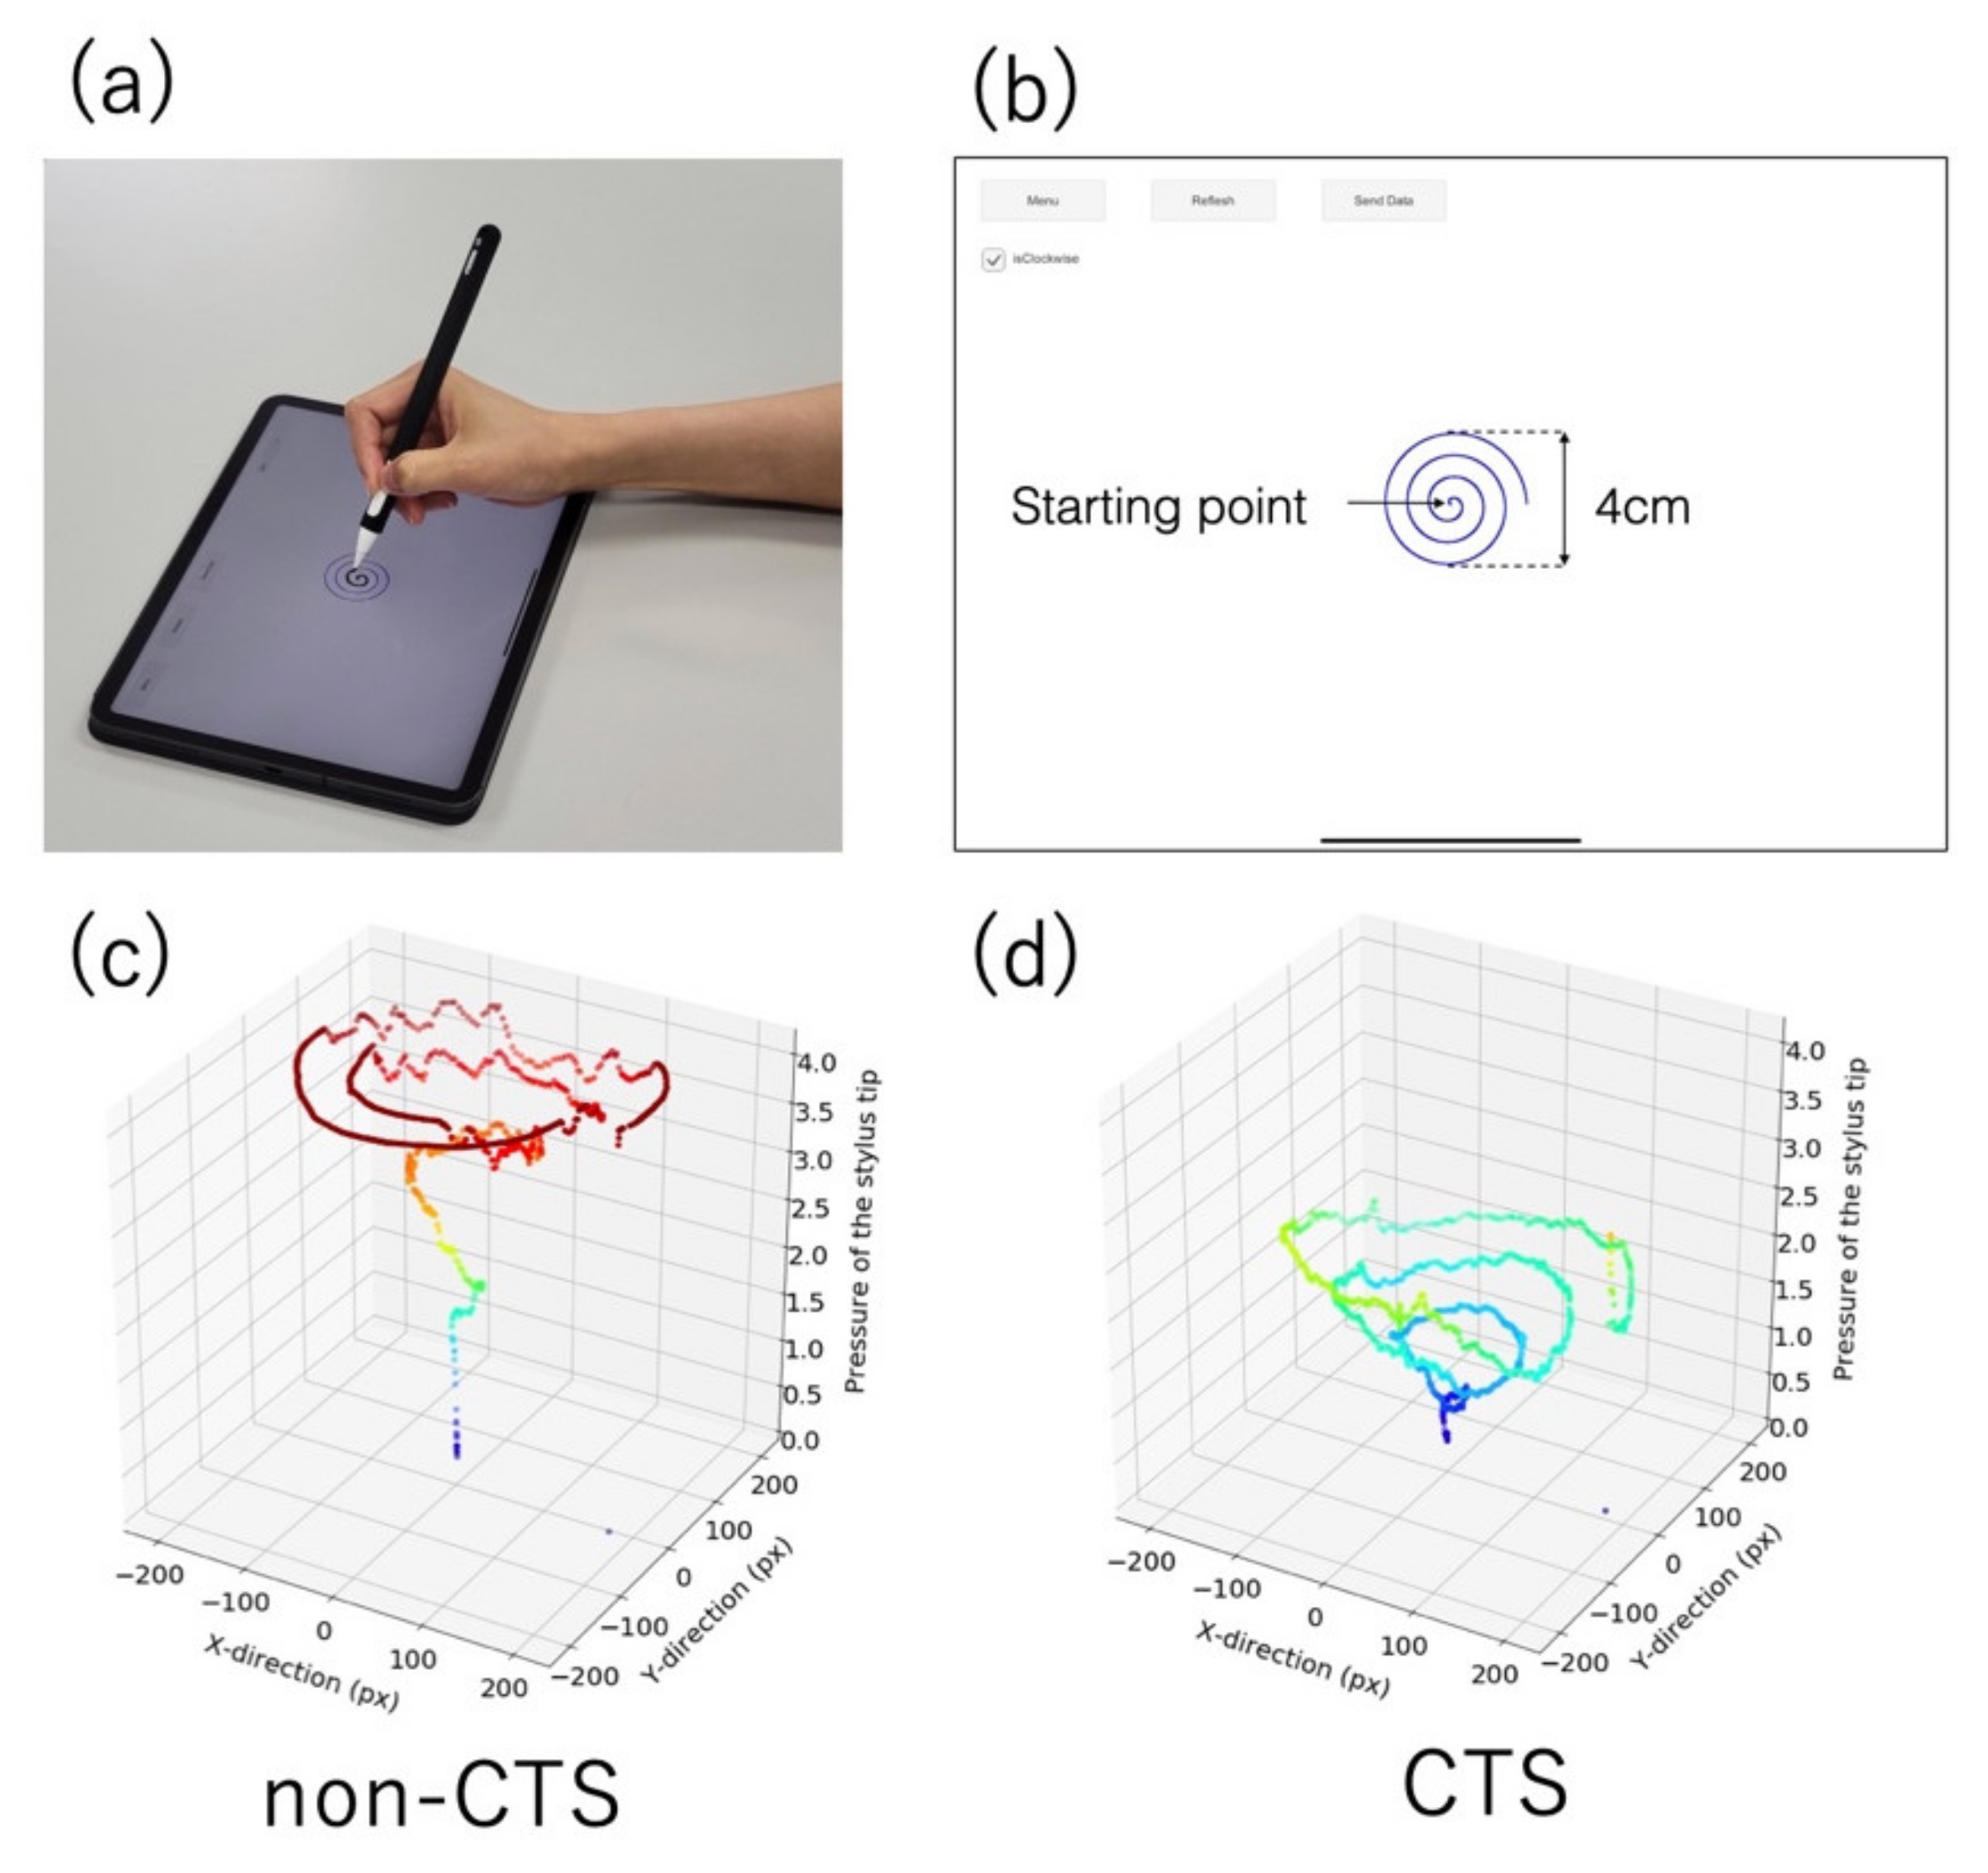
2.2. App Design
2.3. CTS Classification Using a Support Vector Machine
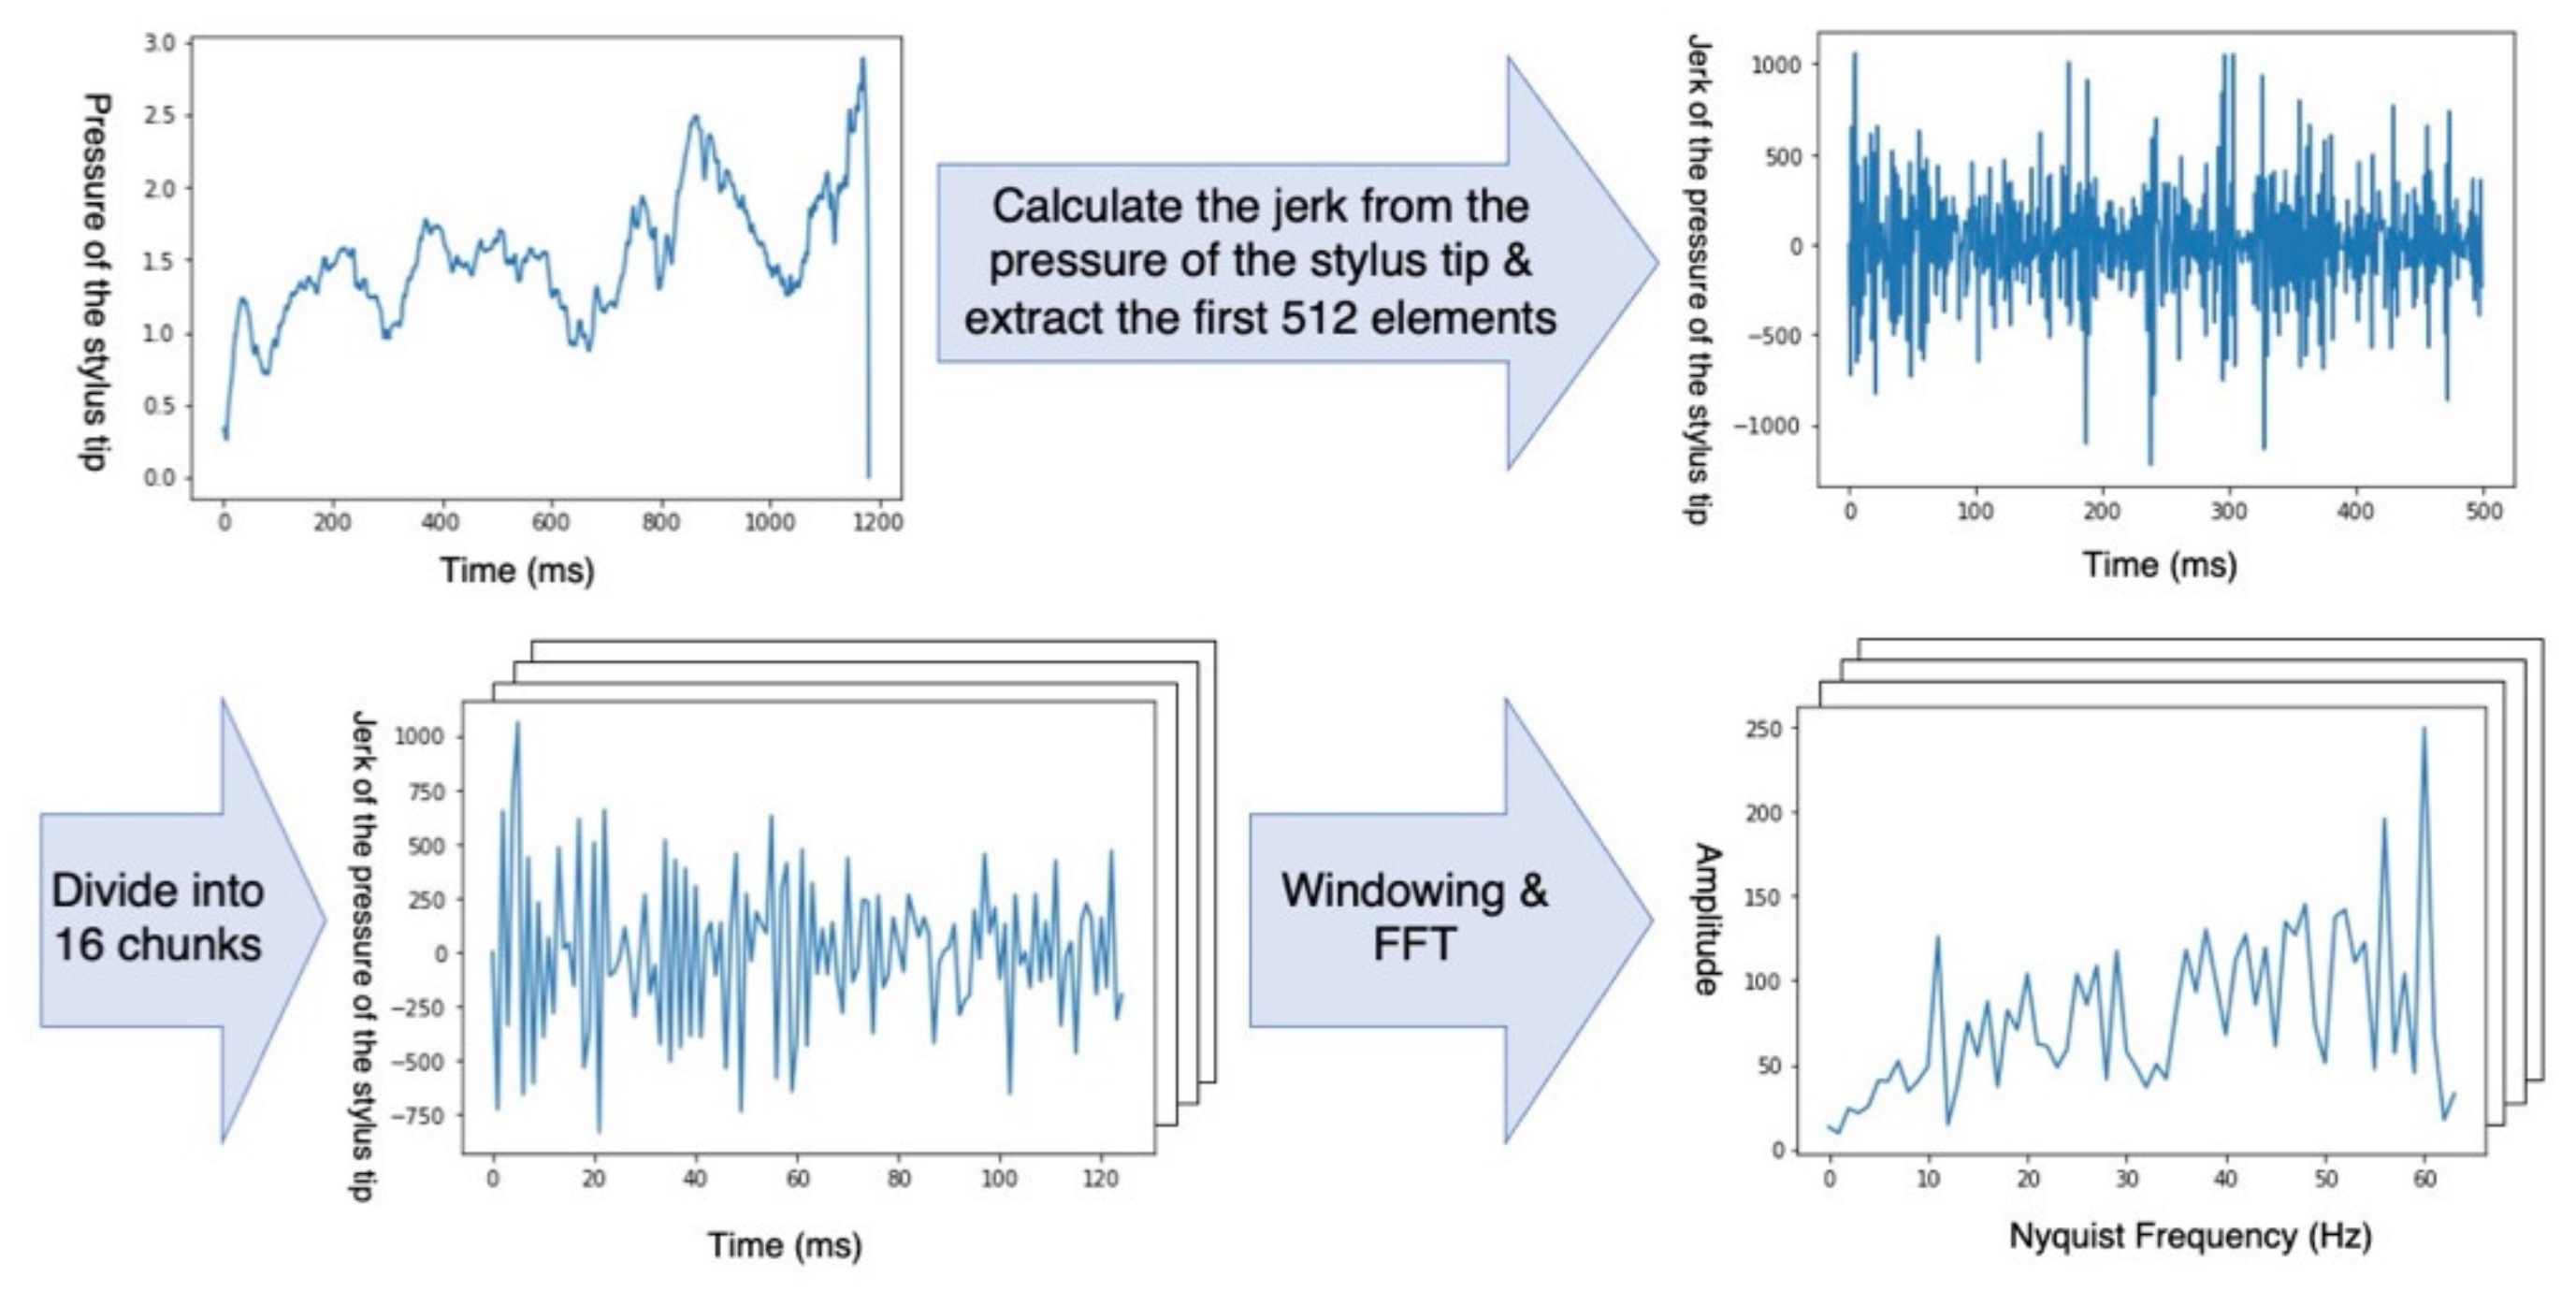
2.4. The Jerk of the Trajectory and Pressure of the Stylus Tip
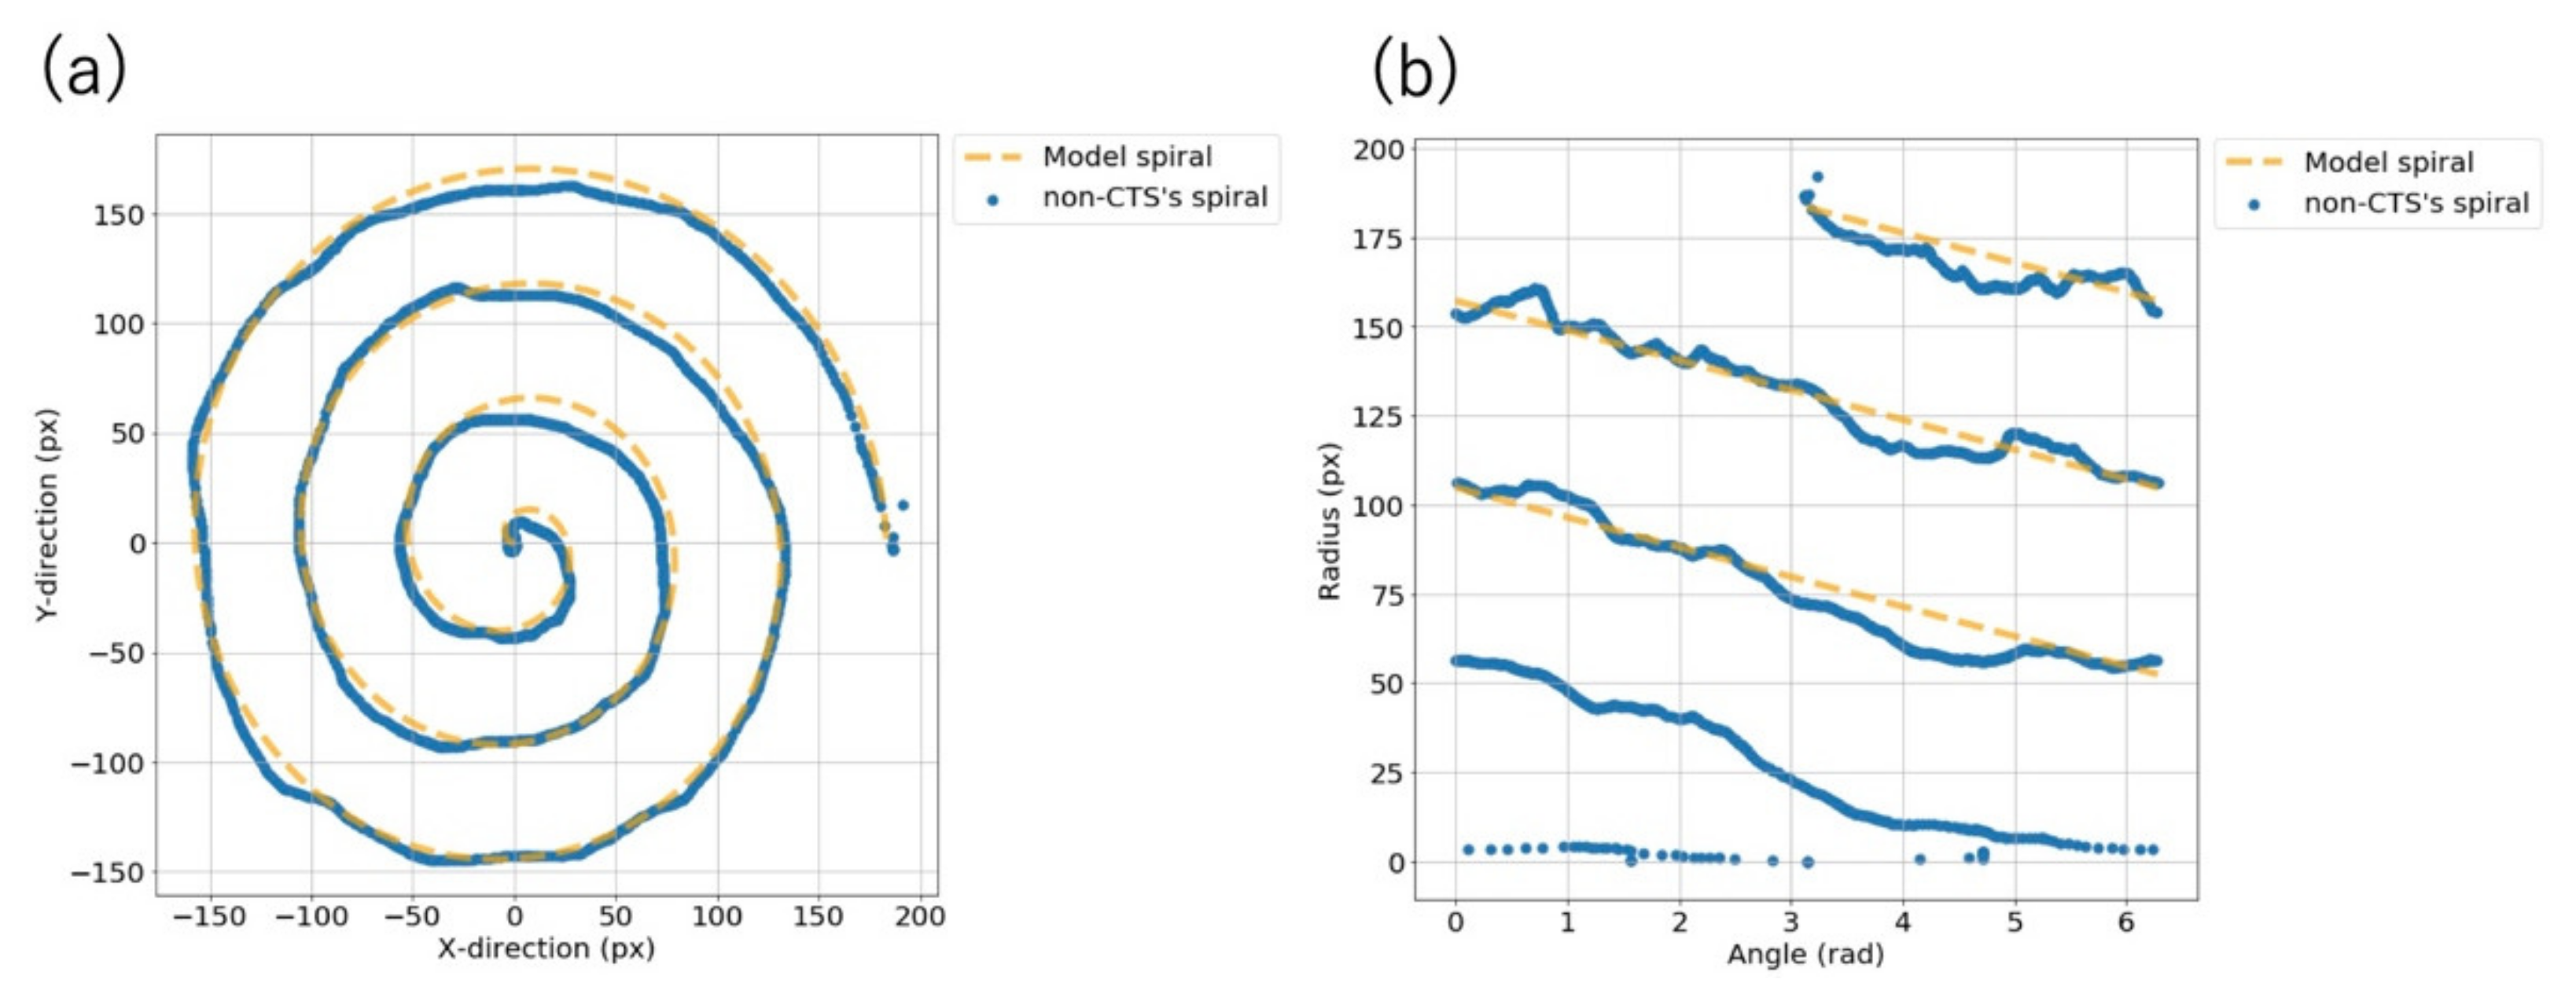
2.5. Root Mean Square Error between the Participants’ Spirasl and the Model Spiral
2.6. Statistical Analysis
3. Results
3.1. Participant Characteristics
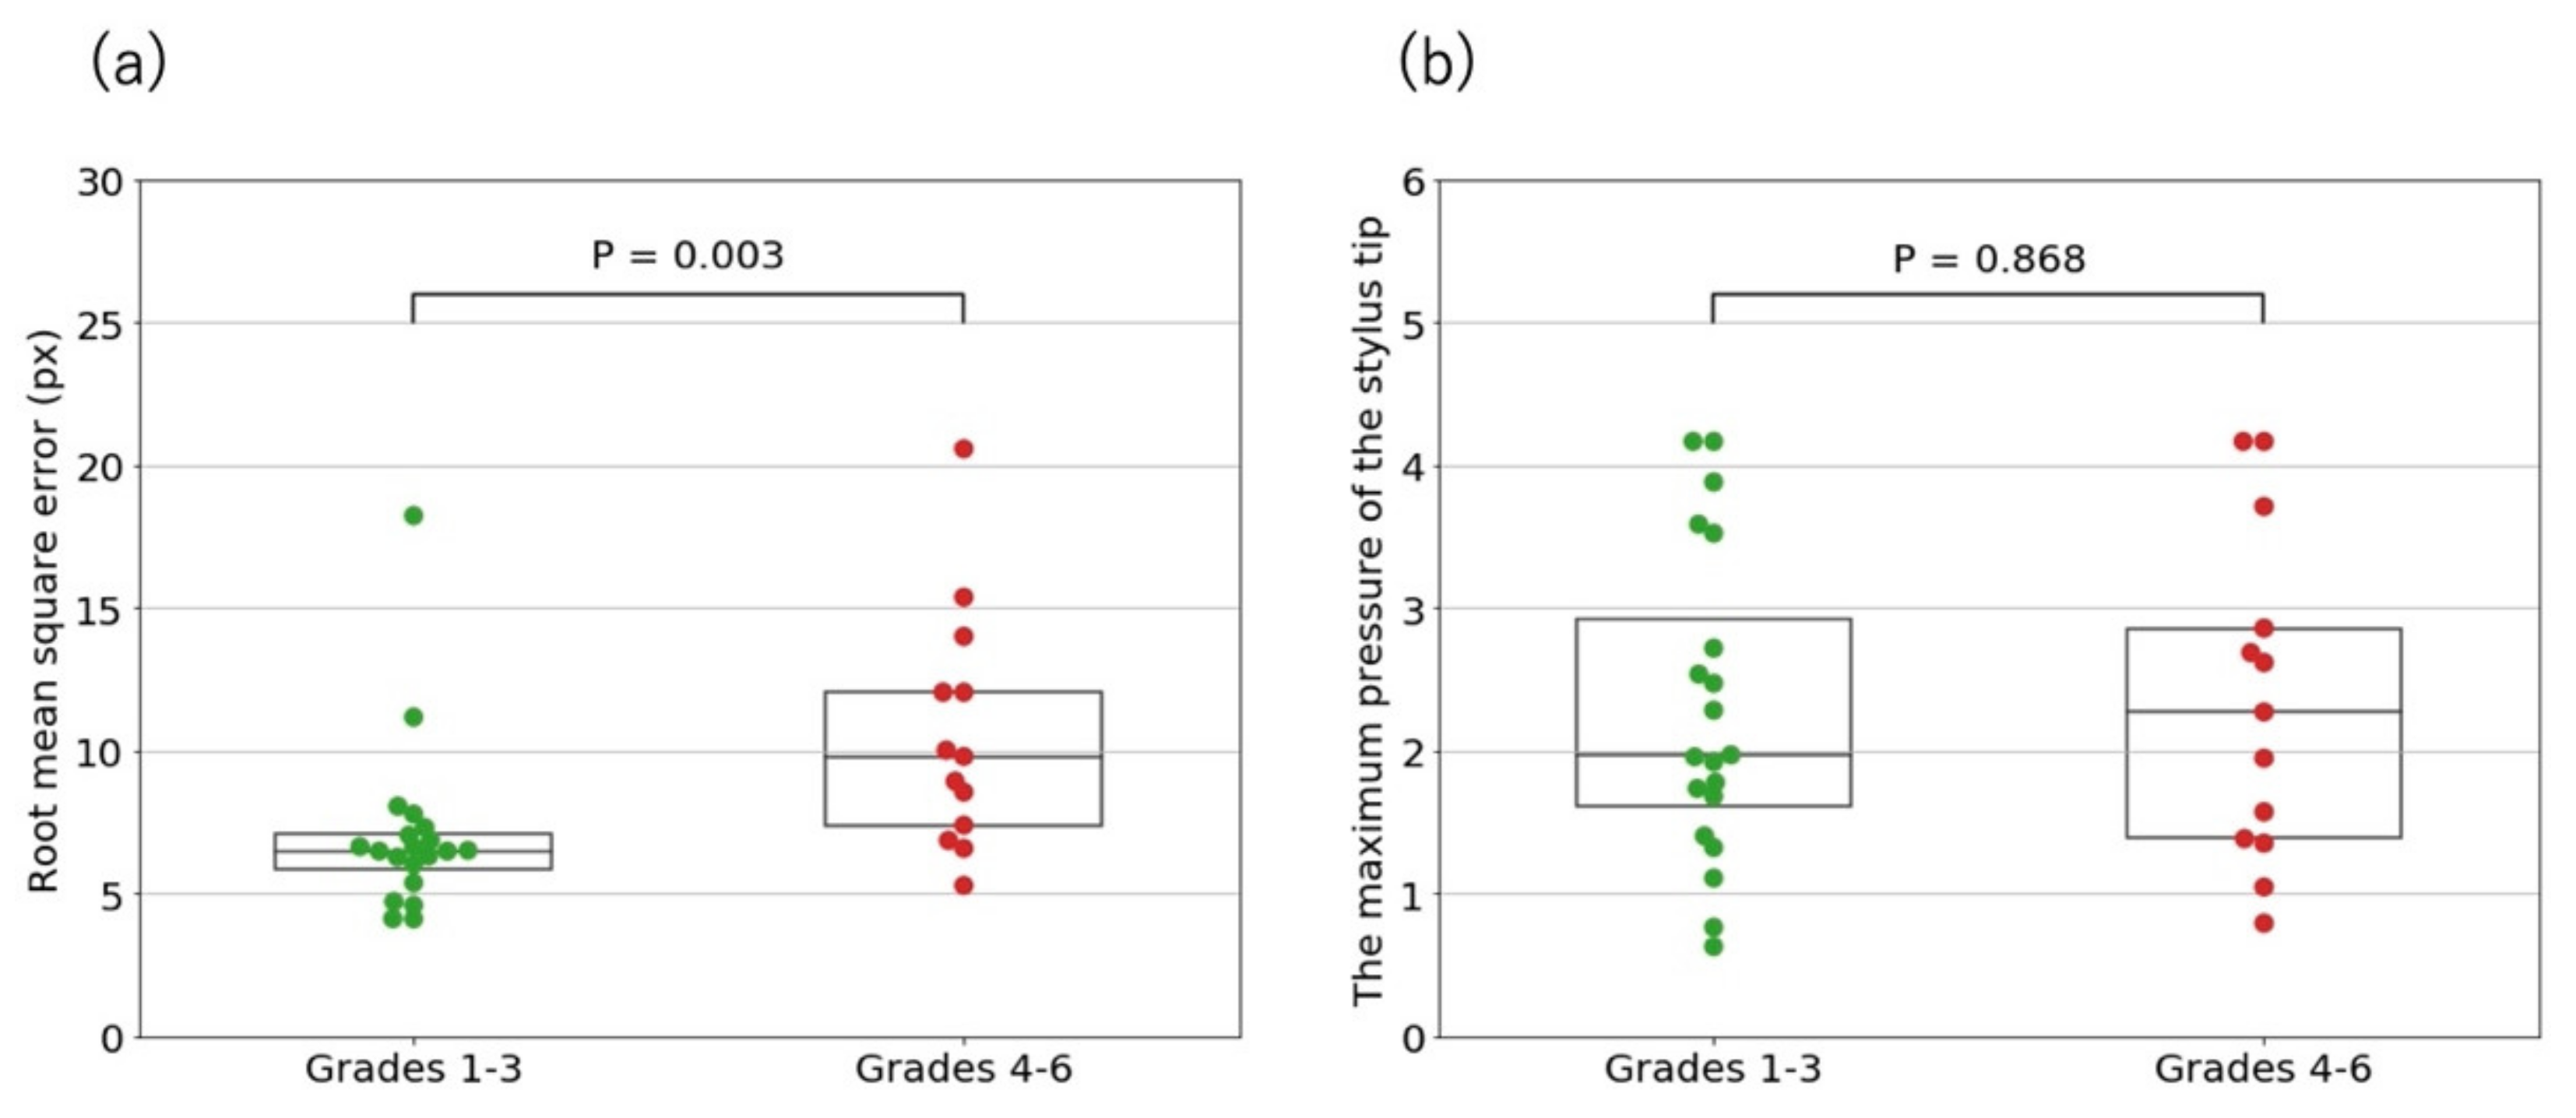
3.2. Root Mean Square Error between the Participants’ Spirals and the Model Spiral
3.3. Maximum Pressure of the Stylus Tip
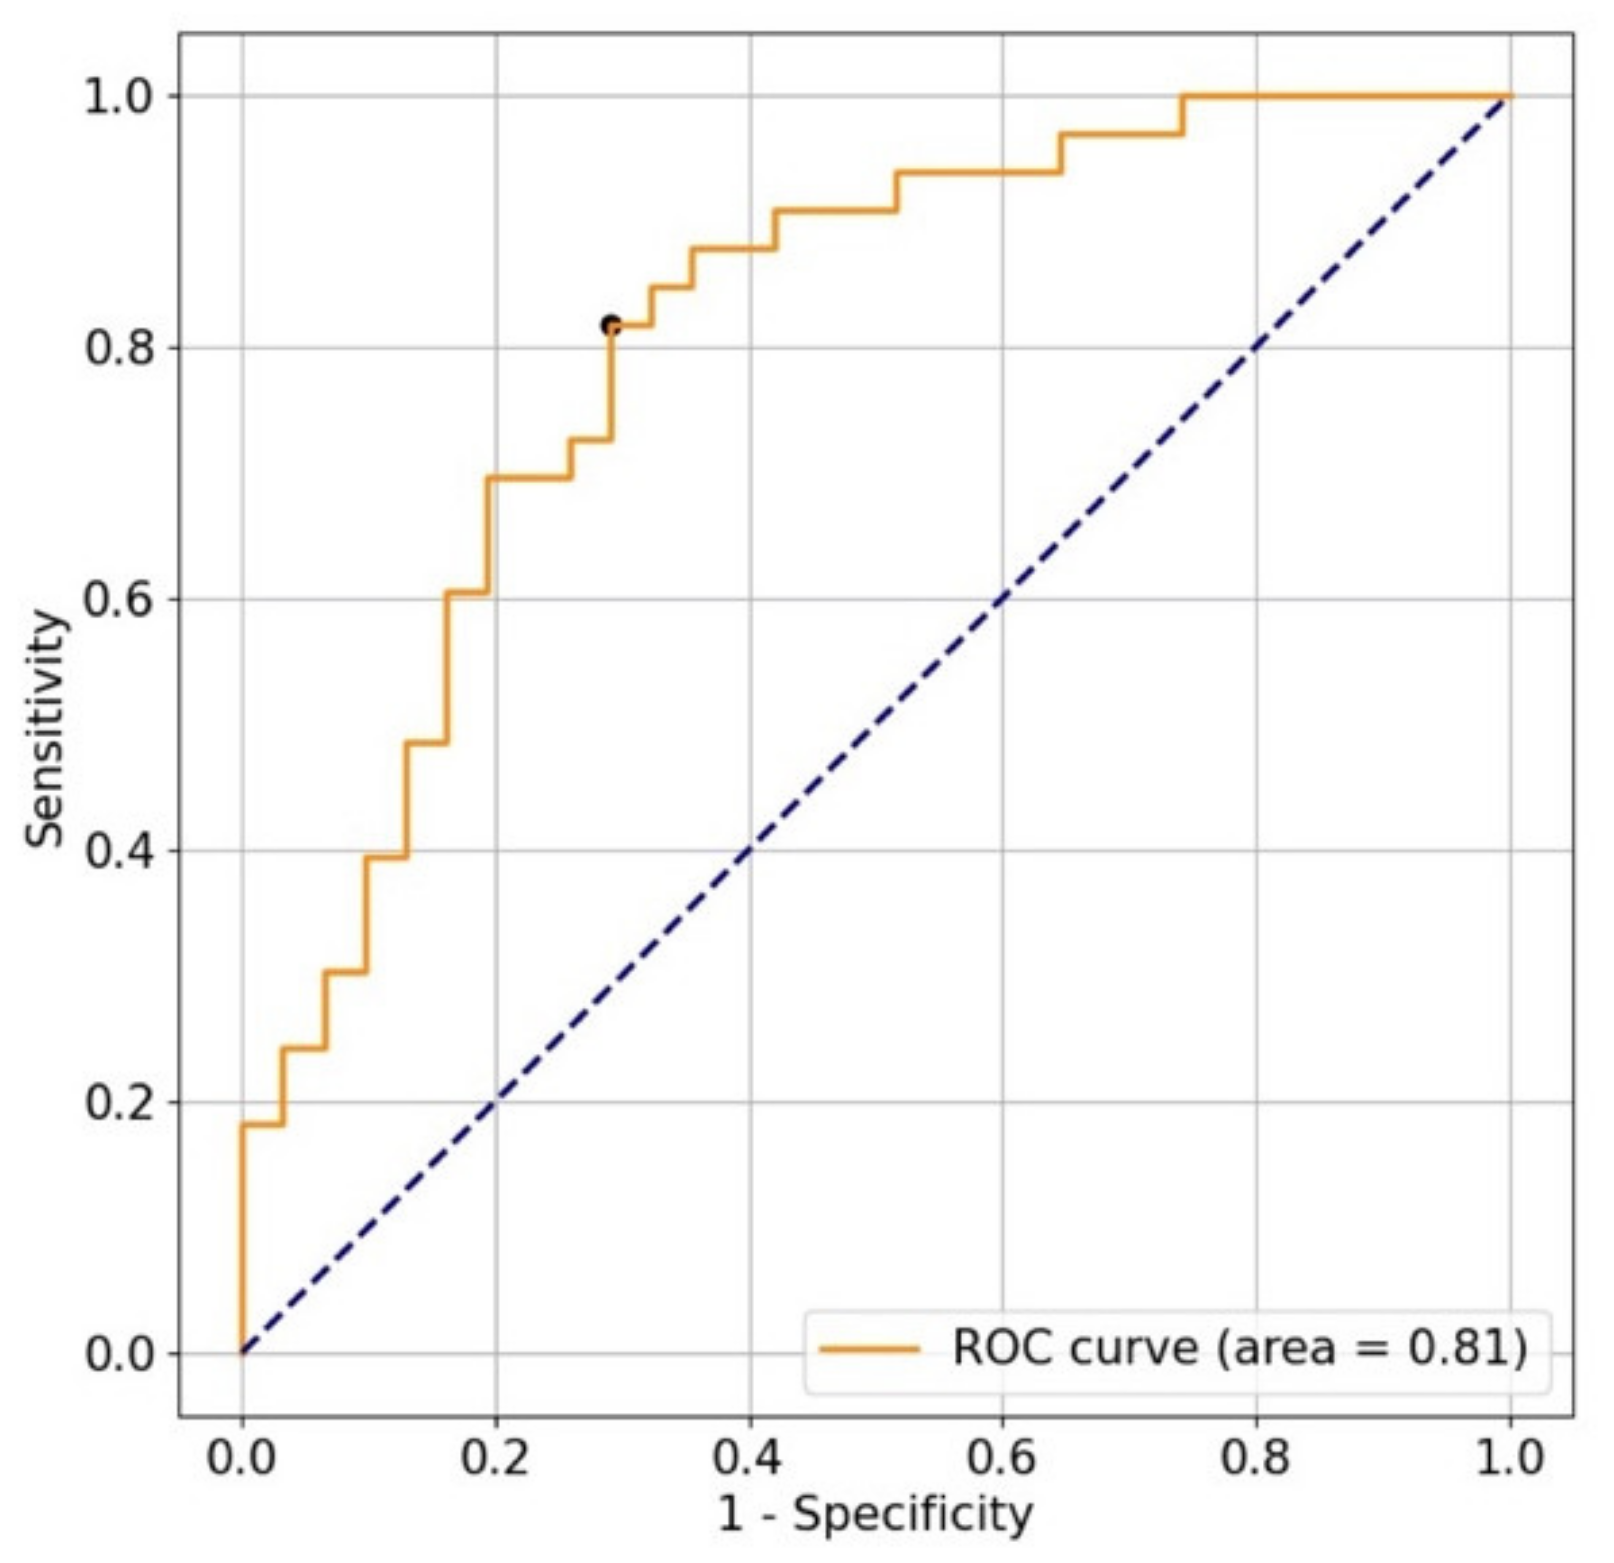
3.4. CTS Classification Using a Support Vector Machine
4. Discussion
5. Conclusions
Author Contributions
Funding
Institutional Review Board Statement
Informed Consent Statement
Data Availability Statement
Acknowledgments
Conflicts of Interest
References
- Padua, L.; Coraci, D.; Erra, C.; Pazzaglia, C.; Paolasso, I.; Loreti, C.; Caliandro, P.; Hobson-Webb, L.D. Carpal tunnel syndrome: Clinical features, diagnosis, and management. Lancet Neurol. 2016, 15, 1273–1284. [Google Scholar] [CrossRef]
- Fernandes, C.H.; Meirelles, L.M.; Raduan Neto, J.; Nakachima, L.R.; Dos Santos, J.B.; Faloppa, F. Carpal tunnel syndrome with thenar atrophy: Evaluation of the pinch and grip strength in patients undergoing surgical treatment. Hand 2013, 8, 60–63. [Google Scholar] [CrossRef] [PubMed] [Green Version]
- De Kleermaeker, F.; Meulstee, J.; Bartels, R.; Verhagen, W. Long-term outcome after carpal tunnel release and identification of prognostic factors. Acta Neurochir. 2019, 161, 663–671. [Google Scholar] [CrossRef] [PubMed]
- Rivlin, M.; Kachooei, A.R.; Wang, M.L.; Ilyas, A.M. Electrodiagnostic grade and carpal tunnel release outcomes: A prospective analysis. J. Hand Surg. Am. 2018, 43, 425–431. [Google Scholar] [CrossRef] [PubMed]
- Fujita, K.; Watanabe, T.; Kuroiwa, T.; Sasaki, T.; Nimura, A.; Sugiura, Y. A tablet-based App for carpal tunnel syndrome screening: Diagnostic case-control study. JMIR Mhealth Uhealth 2019, 7, e14172. [Google Scholar] [CrossRef] [PubMed]
- Koyama, T.; Sato, S.; Toriumi, M.; Watanabe, T.; Nimura, A.; Okawa, A.; Sugiura, Y.; Fujita, K. A screening method using anomaly detection on a smartphone for patients with carpal tunnel syndrome: Diagnostic case-control study. JMIR Mhealth Uhealth 2021, 9, e26320. [Google Scholar] [CrossRef] [PubMed]
- Atroshi, I.; Gummesson, C.; Johnsson, R.; Sprinchorn, A. Symptoms, disability, and quality of life in patients with carpal tunnel syndrome. J. Hand Surg. Am. 1999, 24, 398–404. [Google Scholar] [CrossRef]
- Fujisawa, Y.; Okajima, Y. Characteristics of handwriting of people with cerebellar ataxia: Three-dimensional movement analysis of the pen tip, finger, and wrist. Phys. Ther. 2015, 95, 1547–1558. [Google Scholar] [CrossRef] [PubMed] [Green Version]
- Kuo, L.C.; Hsu, H.M.; Wu, P.T.; Lin, S.C.; Hsu, H.Y.; Jou, I.M. Impact of distal median neuropathy on handwriting performance for patients with carpal tunnel syndrome in office and administrative support occupations. J. Occup. Rehabil. 2014, 24, 332–343. [Google Scholar] [CrossRef] [PubMed]
- Sisti, J.A.; Christophe, B.; Seville, A.R.; Garton, A.L.; Gupta, V.P.; Bandin, A.J.; Yu, Q.; Pullman, S.L. Computerized spiral analysis using the iPad. J. Neurosci. Methods 2017, 275, 50–54. [Google Scholar] [CrossRef] [PubMed] [Green Version]
- Asselborn, T.; Chapatte, M.; Dillenbourg, P. Extending the spectrum of dysgraphia: A data driven strategy to estimate handwriting quality. Sci. Rep. 2020, 10, 1–11. [Google Scholar] [CrossRef] [PubMed] [Green Version]
- Impedovo, D.; Pirlo, G. Dynamic handwriting analysis for the assessment of neurodegenerative diseases: A pattern recognition perspective. IEEE Rev. Biomed. Eng. 2018, 12, 209–220. [Google Scholar] [CrossRef] [PubMed]
- Elgendi, M.; Fletcher, R.; Liang, Y.; Howard, N.; Lovell, N.H.; Abbott, D.; Lim, K.; Ward, R. The use of photoplethysmography for assessing hypertension. NPJ Digit. Med. 2019, 2, 1–11. [Google Scholar] [CrossRef] [PubMed] [Green Version]
- Pamplona, V.; Ankit, M.; Oliveira, M.; Raskar, R. NETRA: Interactive display for estimating refractive errors and focal range. ACM Trans. Graph. 2010, 29, 1–8. [Google Scholar] [CrossRef]
- Quinn, C.C.; Clough, S.S.; Minor, J.M.; Lender, D.; Okafor, M.C.; Gruber-Baldini, A. WellDoc mobile diabetes management randomized controlled trial: Change in clinical and behavioral outcomes and patient and physician satisfaction. Diabetes Technol. Ther. 2008, 10, 160–168. [Google Scholar] [CrossRef] [PubMed] [Green Version]
- Liang, Y.; Fan, H.; Fang, Z.; Miao, L.; Li, W.; Zhang, Z.; Sun, W.; Wang, K.; He, L.; Chen, A. OralCam: Enabling self-examination and awareness of oral health using a smartphone camera. In Proceedings of the 2020 CHI Conference on Human Factors in Computing Systems, Honolulu, HI, USA, 25–30 April 2020. [Google Scholar]
- Bland, J.D. A neurophysiological grading scale for carpal tunnel syndrome. Muscle Nerve 2000, 23, 1280–1283. [Google Scholar] [CrossRef]
- Hudak, P.L.; Amadio, P.C.; Bombardier, C.; Beaton, D.; Cole, D.; Davis, A.; Hawker, G.; Katz, J.N.; Makela, M.; Marx, R.G.; et al. Development of an upper extremity outcome measure: The DASH (disabilities of the arm, shoulder, and head). Am. J. Ind. Med. 1996, 29, 602–608. [Google Scholar] [CrossRef]
- Boser, B.E.; Guyon, I.M.; Vapnik, V.N. A training algorithm for optimal margin classifiers. In Proceedings of the Fifth Annual Workshop on Computational Learning Theory, New York, NY, USA, 27–29 July 1992. [Google Scholar]
- Cooley, J.W.; Tukey, J.W. An algorithm for the machine calculation of complex Fourier series. Math. Comput. 1965, 19, 297–301. [Google Scholar] [CrossRef]
- San Luciano, M.; Wang, C.; Ortega, R.A.; Yu, Q.; Boschung, S.; Soto-Valencia, J.; Bressman, S.B.; Lipton, R.B.; Pullman, S.; Saunders-Pullman, R. Digitized spiral drawing: A possible biomarker for early parkinson’s disease. PLoS ONE 2016, 11, e0162799. [Google Scholar] [CrossRef] [PubMed] [Green Version]


| Index | Training Data | Dimension |
|---|---|---|
| ① | Jerk of the pressure of the stylus tip | 256 |
| ② | Jerk of the trajectory of the stylus tip | 256 |
| ③ | RMSE 1 between the participant’s spiral and the model spiral | 1 |
| ④ | Maximum pressure of the stylus tip | 1 |
| Participant Characteristics | Non-CTS 1 Group | CTS Group | p Value | |
|---|---|---|---|---|
| Number of participants, N | 31 | 33 | N/A 2 | |
| Sex (female), n (%) | 18 (58.1) | 26 (78.8) | 0.074 | |
| Age in years, median (IQR 3) | 64 (55–72) | 67 (60–73) | 0.280 | |
| Bland classification | ||||
| Grade 1 | N/A | 1 | ||
| Grade 2 | N/A | 4 | ||
| Grade 3 | N/A | 15 | ||
| Grade 4 | N/A | 1 | ||
| Grade 5 | N/A | 10 | ||
| Grade 6 | N/A | 2 | ||
| Participant Characteristics | CTS 1 Group | Grades 1–3 | Grades 4–6 | p Value |
|---|---|---|---|---|
| DASH score, mean (SD 2) | 26.6 (19.4) | 24.4 (22.2) | 29.7 (13.9) | 0.300 |
| DASH score (writing), mean (SD) | 1.8 (1.0) | 1.4 (0.8) | 2.3 (1.0) | 0.005 |
| Pulp pinch strength (kg), mean (SD) | 2.6 (1.5) | 3.0 (1.6) | 2.1 (1.0) | 0.082 |
| Grip strength (kg), mean (SD) | 17.3 (8.8) | 18.1 (9.7) | 16.2 (7.2) | 0.807 |
| Disease duration (year), mean (SD) | 2.6 (2.6) | 2.7 (2.6) | 2.4 (2.6) | 0.797 |
| Training Data | Sensitivity, % | Specificity, % | Accuracy, % | AUC 1 |
|---|---|---|---|---|
| ① | 76 | 77 | 77 | 0.77 |
| ② | 82 | 71 | 77 | 0.81 |
| ③ | 61 | 65 | 63 | 0.58 |
| ④ | 73 | 65 | 69 | 0.58 |
| ① + ② | 73 | 81 | 77 | 0.79 |
| ① + ③ | 76 | 77 | 77 | 0.77 |
| ① + ④ | 76 | 77 | 77 | 0.77 |
| ② + ③ | 82 | 71 | 77 | 0.81 |
| ② + ④ | 82 | 71 | 77 | 0.81 |
| ③ + ④ | 58 | 84 | 70 | 0.70 |
| ① + ② + ③ | 73 | 81 | 77 | 0.79 |
| ① + ② + ④ | 73 | 81 | 77 | 0.79 |
| ① + ③ + ④ | 76 | 77 | 77 | 0.78 |
| ② + ③ + ④ | 82 | 71 | 77 | 0.81 |
| ① + ② + ③ + ④ | 73 | 81 | 77 | 0.79 |
Publisher’s Note: MDPI stays neutral with regard to jurisdictional claims in published maps and institutional affiliations. |
© 2021 by the authors. Licensee MDPI, Basel, Switzerland. This article is an open access article distributed under the terms and conditions of the Creative Commons Attribution (CC BY) license (https://creativecommons.org/licenses/by/4.0/).
Share and Cite
Watanabe, T.; Koyama, T.; Yamada, E.; Nimura, A.; Fujita, K.; Sugiura, Y. The Accuracy of a Screening System for Carpal Tunnel Syndrome Using Hand Drawing. J. Clin. Med. 2021, 10, 4437. https://doi.org/10.3390/jcm10194437
Watanabe T, Koyama T, Yamada E, Nimura A, Fujita K, Sugiura Y. The Accuracy of a Screening System for Carpal Tunnel Syndrome Using Hand Drawing. Journal of Clinical Medicine. 2021; 10(19):4437. https://doi.org/10.3390/jcm10194437
Chicago/Turabian StyleWatanabe, Takuro, Takafumi Koyama, Eriku Yamada, Akimoto Nimura, Koji Fujita, and Yuta Sugiura. 2021. "The Accuracy of a Screening System for Carpal Tunnel Syndrome Using Hand Drawing" Journal of Clinical Medicine 10, no. 19: 4437. https://doi.org/10.3390/jcm10194437
APA StyleWatanabe, T., Koyama, T., Yamada, E., Nimura, A., Fujita, K., & Sugiura, Y. (2021). The Accuracy of a Screening System for Carpal Tunnel Syndrome Using Hand Drawing. Journal of Clinical Medicine, 10(19), 4437. https://doi.org/10.3390/jcm10194437