
Relationship between Sensory Processing and Quality of Life: A Systematic Review

 , ,
, ,  , and
, and 
Abstract
1. Introduction
- (1)
- Low registration, which means humans present high neurological thresholds and passive self-regulation strategies. It is known that they tend to have an uninterested appearance and to be underreactive. Hence, sensory profile research studies have linked this pattern to low endurance for tasks and poor registration of environmental stimuli.
- (2)
- Sensation seeking, which is represented by people with high neurological thresholds and active self-regulation strategies. This pattern is recognized for presenting motor disorganization and impulsivity.
- (3)
- Sensation avoiding, which features exposure limitations to environmental stimuli. Individuals pretend to avoid the activation of their thresholds. Data from research articles have associated it with emotional reactivity.
- (4)
- Sensory sensitivity, which is characterized by discomfort and overwhelming sensations in individuals. These people have low neurological thresholds, so they tend to be overreactive.
2. Materials and Methods
2.1. Data Sources
2.2. Search Strategy
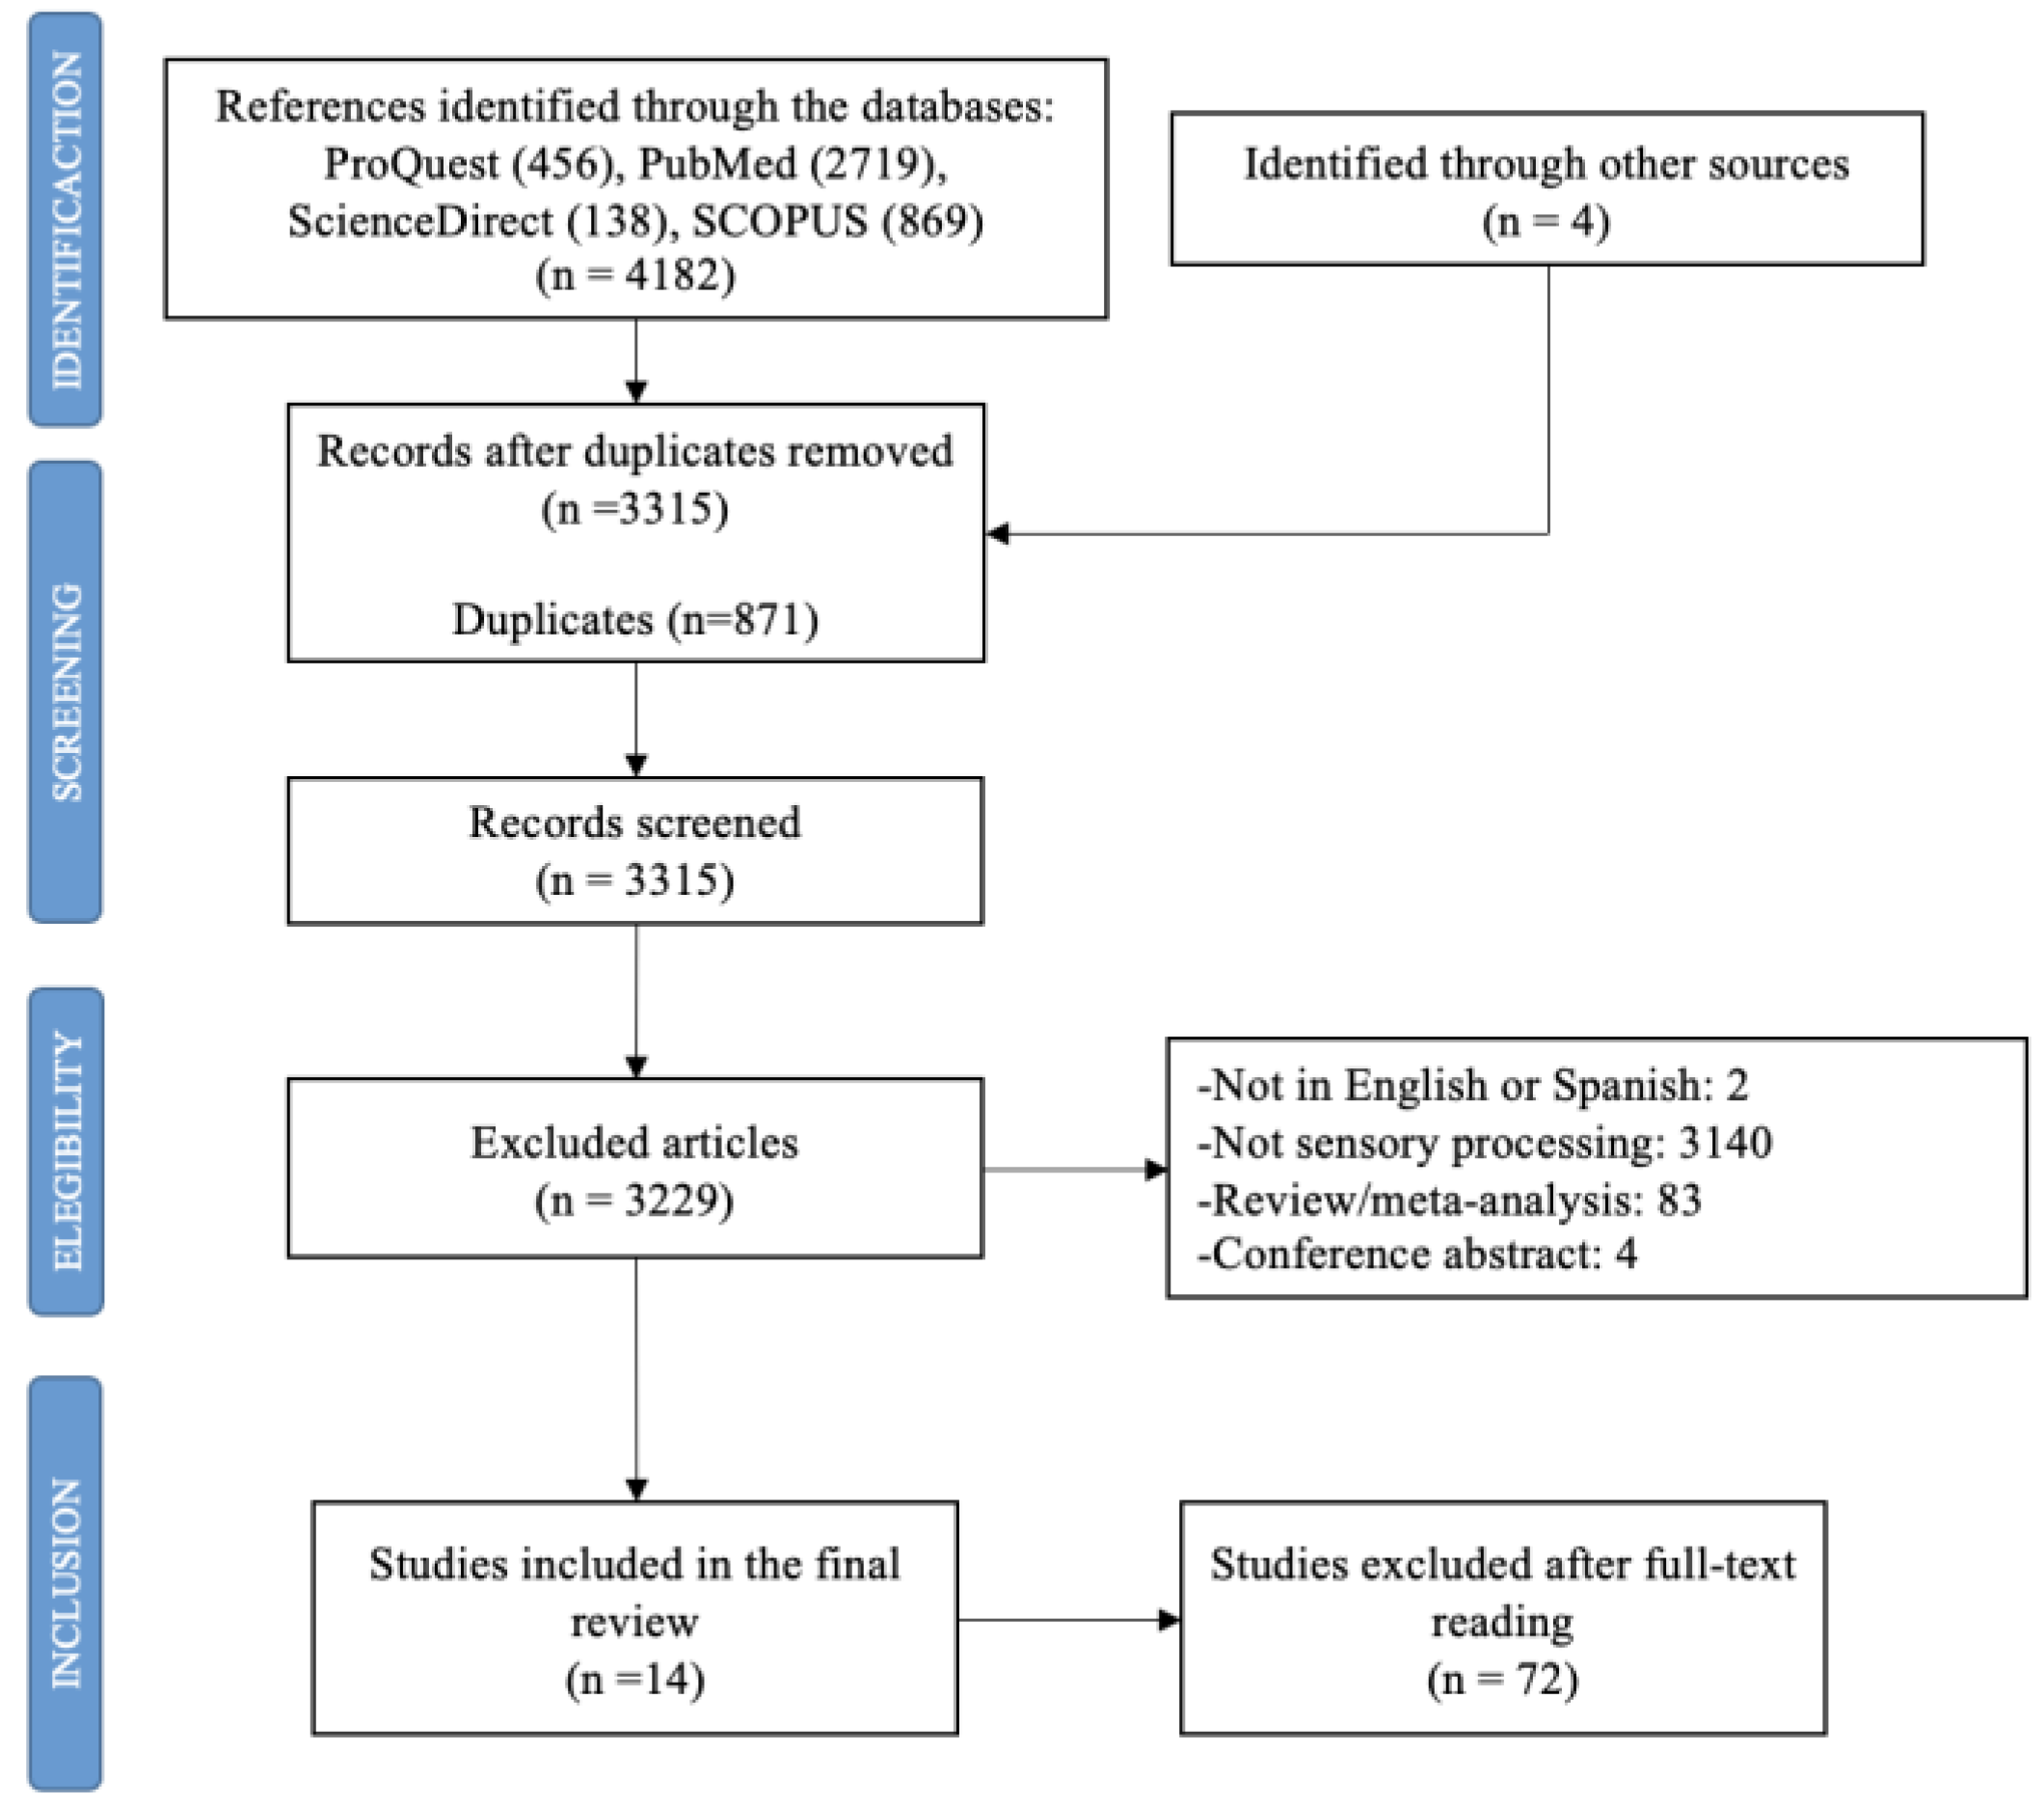
2.3. Selection of Articles and Risk of Bias
2.4. Inclusion and Exclusion Criteria
2.5. Extracted Data
2.6. Synthesis of Results
3. Results
3.1. Descriptive Data and Types of Studies

| Authors, Year [Reference] | Country | Year | Age (Years) | Sample Size | Objective(s) | Design | |
|---|---|---|---|---|---|---|---|
| Mean (SD) | Range | ||||||
| Kinnealey et al., 2011 [25] | USA | 2011 | SOR: 40.38 (±11.55) NSOR: 40.00 (±11.00) | 18–60 | Total: n = 28 Men: n = 7 Women: n = 21 SOR group: n = 14 NSOR group: n = 14 | 1. To explore the differences in social support and HRQOL between a group of adults with sensory modulation disorder (SOR) and a matched non-SOR (NSOR) group as well as the relationships between these variables. 2. To explore whether symptoms of anxiety and depression and indicators of HRQOL are significantly related to sensory response styles. | Randomized trial |
| Engel-Yeger et al., 2016 [13] | Italy | 2016 | Overall sample: 53.60 (±15.7) Unipolar group: 48.06 (±16.81) Bipolar group: 36.18 (±15.68) | 16–85 | Total: n = 267 Men: n = 93 Women: n = 174 Unipolar group: n = 157 Bipolar group: n = 110 | 1. To compare unipolar and bipolar patients with regard to their sensory processing patterns, coping strategies, and QOL. 2. To analyze the correlations between sensory processing patterns (dependent variable) and QOL (independent variable) in the total sample and among unipolar and bipolar patients while referring to coping strategies as a mediator variable. 3. To investigate the relative contribution of sociodemographic variables, groups (unipolar/bipolar), sensory processing patterns, and coping strategies in predicting QOL. | Cross-sectional |
| Pfeiffer et al., 2014 [41] | USA | 2014 | 48.90 (±9.30) | - | Total: n = 94 Men: n = 48 Women: n = 46 | 1. To examine the relationship between different sensory processing patterns and community participation. 2. To inform the development of innovative rehabilitation interventions, including those resulting in more accommodating environments. | Cross-sectional |
| Engel-Yeger et al., 2017 [43] | Israel | 2017 | 49.68 (±6.40) | 33–55 | Total: n = 115 Men: n = 50 Women: n = 65 Controlled diabetes group: n = 24 Uncontrolled diabetes group: n = 22 Healthy controlled group: n = 69 | 1. To profile sensory deficits examined in the ability to process sensory information from daily environment and discriminate between tactile stimuli among patients with controlled and un-controlled diabetes mellitus. 2. To examine the relationship between sensory deficits and patients’ HRQOL. | Cross-sectional |
| Colbeck, 2018 [49] | Canada | 2018 | - | >18 | Total: n = 30 Men: n = 8 Women: n = 22 | 1. To describe how sensory-processing preferences and cognitive fatigue are related to variances in quality of life in people with multiple sclerosis (MS). | Cross-sectional |
| Genizi et al., 2019 [44] | Israel | 2019 | Migraine group: 10.06 (±1.53) Control group: 9.33 (±1.14) | 7–12 | Total: n = 134 Men: n = 59 Women: n = 75 Migraine group: n = 54 Control group: n = 80 | 1. To compare sensory processing abilities between children with migraine and healthy controls. 2. To compare the quality of life between children with migraine and healthy controls. 3. To examine the correlations between sensory processing, migraine characteristics, and quality of life among children with migraines. 4. To examine the contribution of headache-related disability and sensory processing to the prediction of quality of life among children with migraines. | Cross-sectional |
| Bar-Shalita et al., 2015 [24] | Israel | 2015 | 27.30 (±3.77) | - | Total: n = 258 Men: n = 128 Women: n = 130 | 1. To explore in an ecological fashion the association between sensory responsiveness, pain perception, and QoL in subjects from the general population, with and without SMD. 2. To culturally adapt and initially test the Hebrew version of the PSQ. | Cross-sectional |
| Sinclair et al., 2019 [22] | Australia | 2019 | 15.63 (±1.15) | 13–18 | Total: n = 70 Men: n = 7 Women: n = 63 | 1. To ascertain whether adolescents with persistent pain had atypical sensory modulation patterns. 2. To assess whether adolescents with persistent pain had atypical sensory modulation associated with reduced functioning and higher pain. 3. To evaluate whether pain catastrophizing adolescents mediate the relationship between sensory modulation and functional disability. | Cross-sectional |
| Crofton et al., 2020 [46] | Australia | 2020 | 37.24 (±15.88) | 18–76 | Total: n = 117 Men: n = 86 Women: n = 31 | 1. To investigate associations between sensory variables and compression garment wear. | Cross-sectional |
| Stern et al., 2020 [42] | USA | 2020 | 50.00 (±9.20) | 23–65 | Total: n = 94 Men: n = 15 Women: n = 79 | 1. To compare trait anxiety among persons with MS with different levels of sensory processing patterns. 2.To identify associations between sensory processing patterns, trait anxiety, and physical and mental HRQOL. 3. To explore the direct and indirect effects of sensory processing patterns on physical and mental HRQOL, considering trait anxiety as a potential mediator. | Cohort study |
| Serafini et al., 2015 [45] | Italy | 2015 | Overall sample: 48.31 (±11.47) Unipolar patient group: 43.19 (±13.03) Bipolar patient group: 35.12 (±14.66) | 18–65 | Total: n = 336 Men: n = 126 Women: n = 210 Unipolar patient group: n = 197 Bipolar patient group: n = 139 | 1. To compare unipolar/bipolar patients with regard to their sensory processing patterns, alexithymia, traumatic childhood experiences, and QOL. 2. To examine the correlations between sensory processing patterns and traumatic childhood experiences. 3. To investigate the relative contribution of diagnostic groups (unipolar/bipolar), sensory processing patterns, alexithymia, and traumatic childhood experiences in predicting QOL. | Cross-sectional |
| Eng et al., 2001 [40] | United States | 2001 | 32.43 | - | Total: n = 207 Men: n = 120 Women: n = 87 | 1. To examine potential differences on measures of the severity of social anxiety disorder, depression and functional impairment, and life satisfaction. 2. To corroborate the classification of attachment styles. 3. To explore the link between attachment styles and depressive symptoms within the sample of patients with social anxiety. 4. To examine the mediation of social anxiety in the relationship between adult attachment style and depressive symptoms in a clinical population. | Cross-sectional |
| Lee, 2012 [47] | Korea | 2012 | 72.2 (±6.09) | >65 | Total: n = 121 Men: n = 48 Women: n = 73 | 1. To assess the sensory processing ability of the normal elderly. 2. To express the importance of sensory integration in the elderly. 3. To understand the level of sensory defense. 4. To compare the correlation with quality of life. | Cross-sectional |
| Lee et al., 2016 [48] | Korea | 2016 | - | 20–24 | Total: n = 32 Men: n = 6 Women: n = 26 Sensory intervention group: n = 16 Control group: n = 16 | 1. To investigate the sensory processing abilities of university students. 2. To explore the influence of sensory processing on quality of life. | Randomized trial |
3.2. Sensory Processing Assessment Tools
3.3. Quality of Life Assessment Tools
3.4. Relationship between Sensory Processing and Quality of Life
| Authors, Year [Reference] | Sensory Processing Assessment Tool | QOL Assessment Tool | Sensory Processing Means (SD) | QOL Means (SD) | Correlations between Sensory Processing Patterns and QOL | |
|---|---|---|---|---|---|---|
| Kinnealey et al., 2011 [25] | Adult Sensory Questionnaire (ASQ) [51] | Short-Form-36 Health Survey (SF-36) [57] | - | SOR = 18.81 (±3.88) NSOR = 21.80 (±2.03) | SOR sample: Physical functioning: r = −0.26 Bodily pain: r = −0.44* Vitality: r = −0.46 * Social functioning: r = −0.42 * Physical role: r = 0.19 Emotional role: r = −0.39 * Mental health: r = −0.35 General health: r = −0.40 * | |
| Engel-Yeger et al., 2016a [13] | Adolescent/Adult Sensory Profile (AASP) [12] | 12-item Short-Form Health Survey (SF-12) [58] | Unipolar patient group = 37.75 (±11.71) Bipolar patient group = 36.67 (±11.41) | Unipolar patient group = 56.69 (±35.58) Bipolar patient group = 55 (±35.41) | Physical functioning: r =− Bodily pain: r = −0.25 ** Vitality: r = −0.35 *** Social functioning: r = − Emotional role: r = −0.23 * Mental health: r = −0.24 ** Mental health composite: r = −0.30 *** | |
| Engel-Yeger et al., 2017 [43] | Adolescent/Adult Sensory Profile (AASP) [12] | World Health Organization Quality of Life Questionnaire, brief version [54] | Controlled diabetes group = 39.45 (±8.82) | Physical QOL = 70.83 (±14.07) Psychological QOL = 78.33 (±12.48) Social QOL = 78.33 (±12.48) Environmental QOL = 77.08 (±20.31) | Overall sample: r = −0.477 ** | |
| Uncontrolled diabetes group = 41.95 (±10.89) | Physical QOL = 57.49 (±19.07) Psychological QOL = 70.45 (±22.67) Social QOL = 61.74 (±26.18) Environmental QOL = 61.74 (±26.18) | |||||
| Healthy controlled group = 34.57 (±6.51) | Physical QOL = 77.12 (±13.87) Psychological QOL = 74.78 (±12.02) Social QOL = 76.75 (±14.47) Environmental QOL = 70.83 (±13.28) | |||||
| Colbeck, 2018a [49] | Adolescent/Adult Sensory Profile (AASP) [12] | RAND-36 [59] | 42.5 (±8.4) | - | General health: r = −0.65 *** Social functioning: r = −0.32 Pain: r = −0.14 Physical functioning: r = 0.06 Physical role: r = −0.19 Emotional role: r = −0.44 ** Fatigue: r = 0.08 Emotional well-being: r = −0.35 | |
| Genizi et al., 2019 [44] | Short Sensory Profile (SSP) [50] | Pediatric Quality of Life Inventory (PedsQL) [56] | Migraine group = 164.58 (±19.94) Control group = 174.11 (±9.35) | Total HRQOL: Migraine group = 8.26 (±12.13) Control group = 82.93 (±9.47) | Overall sample: Physical HRQOL: r = 0.45 *** Emotional HRQOL: r = 0.55 *** Social HRQOL: r = 0.31 School HRQOL: r = 0.44 *** Psychosocial HRQOL: r = 0.61 *** Total HRQOL: r = 0.63 *** | |
| Sinclair et al., 2019 a [22] | Adolescent/Adult Sensory Profile (AASP) [12] | Pediatric Quality of Life Inventory (PedsQL) [56] | 37.29 (±8.92) | Physical QOL = 44.38 (±21.43) Emotional QOL = 50.93 (±22.5) Social QOL = 68.93 (±23.74) School QOL = 45.07 (±21.62) | Physical QOL: r = −0.35 ** Emotional QOL: r = −0.41 *** Social QOL: r = −0.29 * School QOL: r = −0.32 ** | |
| Crofton et al., 2020a [46] | Adolescent/Adult Sensory Profile (AASP) [12] | Assessment of Quality of Life-4D [60] | - | - | QOL Help required: r = 0.148 QOL isolation: r = 0.361 ** QOL anxiety: r = 0.389 ** | |
| Pfeiffer et al., 2014 [41] | Adolescent/Adult Sensory Profile (AASP) [12] | Lehman’s Quality of Life Interview [62] | QOL scores: High sensitivity: 4.0 (±1.8) Low sensitivity: 4.7 (±1.4) | - | ||
| Bar-Shalita et al., 2015 [24] | Sensory Responsiveness Questionnaire-Intensity Scale (SRQ-IS) [52] | Short-Form-36 Health Survey, version 2 (SF-36) [57] | Bodily pain: Non-SMD = 80.2 (±21.20) SOR-SMD = 71.8 (±18.40) General health: Non-SMD = 79.5 (±17.97) SOR-SMD = 74.5 (±16.75) Vitality: Non-SMD = 54.7 (±17.65) SOR-SMD = 50.8 (±20.04) Social functioning: Non-SMD = 84.5 (±20.74) SOR-SMD = 80.5 (±19.81) Physical health–total: Non-SMD = 79.6 (±12.64) SOR-SMD = 74.4 (±13.51) Mental health–total: Non-SMD = 73.0 (±17.13) SOR-SMD = 67.3 (±16.30) | - | ||
| Stern et al., 2020a [42] | Adolescent/Adult Sensory Profile (AASP) [12] | Multiple Sclerosis Quality of Life-54 (MEQOL-54) [61] | - | - | MSQOL-54 physical: r = −0.43 *** MSQOL-54 mental: r = −0.52 *** | |
| Serafini et al., 2015 [45] | Adolescent/Adult Sensory Profile (AASP) [12] | 12-item Short-Form Health Survey (SF-12) [58] | Unipolar patient group = 37.55 (±11.58) Bipolar patient group: 36.09 (±11.38) | Body pain: Unipolar = 58.65 (±30.54) Bipolar = 56.75 (±29.27) General health: Unipolar = 64.14 (±24.01) Bipolar = 63.77 (±23.57) Vitality: Unipolar = 27.57 (±26.98) Bipolar = 33.13 (±30.31) Social functioning: Unipolar = 59.01 (±31.23) Bipolar = 53.19 (±36.15) Physical health–total: Unipolar = 48.72 (±11.95) Bipolar = 46.55 (±12.65) Mental health–total: Unipolar = 97.75 (±18.44) Bipolar = 96.16 (±25.04) | - | |
| Eng et al., 2001 [40] | Interpersonal Sensitivity Measure (IPSM) [53] | Quality-of-Life Inventory (QOLI) [63] | Anxious attachment group = 108.69 (±11.86) Secure attachment group: 93.87 (±14.55) | Anxious attachment group = −0.56 (±1.38) Secure attachment group: 1.51 (±1.18) | - | |
| Lee, 2012 [47] | Adolescent/Adult Sensory Profile (AASP) [12] | Elderly-people Quality of Life assessment tool [64] | - | - | r −0.30 ** | |
| Lee et al., 2016 [48] | Adolescent/Adult Sensory Profile (AASP) [12] | World Health Organization Quality of Life Questionnaire, Korean version [55] | Before sensory intervention SIG = 83.31 (±12.13) CG = 85.81 (±10.26) | After sensory intervention SIG = 98.69 (±11.67) CG = 84.81 (±14.56) | - | |
4. Discussion
4.1. Limitations
4.2. Future Research
5. Conclusions
Author Contributions
Funding
Data Availability Statement
Conflicts of Interest
References
- Humphry, R. Young children’s occupations: Explicating the dynamics of developmental processes. Am. J. Occup. Ther. 2002, 56, 171–179. [Google Scholar] [CrossRef] [PubMed]
- Ottoni, G.L.; Lorenzi, T.M.; Lara, D.R. Association of temperament with subjective sleep patterns. J. Affect. Disord. 2011, 128, 120–127. [Google Scholar] [CrossRef]
- Park, C.I.; An, S.K.; Kim, H.W.; Koh, M.J.; Namkoong, K.; Kang, J.I.; Kim, S.J. Relationships between chronotypes and affective temperaments in healthy young adults. J. Affect. Disord. 2015, 175, 256–259. [Google Scholar] [CrossRef] [PubMed]
- Shani-Adir, A.; Rozenman, D.; Kessel, A.; Engel-Yeger, B. The relationship between sensory hypersensitivity and sleep quality of children with atopic dermatitis. Pediatr. Dermatol. 2009, 26, 143–149. [Google Scholar] [CrossRef]
- Zald, D.H. The human amygdala and the emotional evaluation of sensory stimuli. Brain Res. Rev. 2003, 41, 88–123. [Google Scholar] [CrossRef]
- Rihmer, Z.; Akiskal, K.K.; Rihmer, A.; Akiskal, H.S. Current research on affective temperaments. Curr. Opin. Psychiatry 2010, 23, 12–18. [Google Scholar] [CrossRef] [PubMed]
- Dunn, W. The sensations of everyday life: Empirical, theoretical, and pragmatic considerations. Am. J. Occup. Ther. 2002, 55, 608–620. [Google Scholar] [CrossRef]
- Pohl, P.S.; Dunn, W.; Brown, C. The role of sensory processing in the everyday lives of older adults. Occup. Ther. J. Res. 2003, 23, 99–106. [Google Scholar] [CrossRef]
- Engel-Yeger, B.; Gonda, X.; Walker, M.; Rihmer, Z.; Pompili, M.; Amore, M.; Serafini, G. Sensory Hypersensitivity Predicts Reduced Sleeping Quality in Patients with Major Affective Disorders. J. Psychiatr. Pract. 2017, 23, 11–24. [Google Scholar] [CrossRef]
- Dunn, W. The impact of Sensory Processing Abilities on the Daily Lives of Young Children and Their Families: A Conceptual Model. Infants Young Child. 1997, 9, 23–35. [Google Scholar] [CrossRef]
- Dunn, W. Supporting Children to Participate Successfully in Everyday Life by Using Sensory Processing Knowledge. Infants Young Child. 2007, 20, 84–101. [Google Scholar] [CrossRef]
- Brown, C.; Dunn, W. The Adolescent/Adult Sensory Profile: User’s Manual; Psychological Corporation: San Antonio, TX, USA, 2002. [Google Scholar]
- Engel-Yeger, B.; Gonda, X.; Muzio, C.; Rinosi, G.; Pompili, M.; Amore, M.; Serafini, G. Sensory processing patterns, coping strategies, and quality of life among patients with unipolar and bipolar disorders. Rev. Bras. Psiquiatr. 2016, 38, 207–215. [Google Scholar] [CrossRef]
- Pfeiffer, B.; Kinnealey, M.; Reed, C.; Herzberg, G. Sensory modulation and affective disorders in children with Asperger syndrome. Am. J. Occup. Ther. 2005, 59, 335–345. [Google Scholar] [CrossRef]
- Pertovaara, A.; Wei, H. Dual influence of the striatum on neuropathic hypersensitivity. Pain 2008, 137, 50–59. [Google Scholar] [CrossRef]
- Fox, M.A.; Sanes, J.R.; Borza, D.B.; Eswarakumar, V.P.; Fässler, R.; Hudson, B.G.; John, S.W.; Ninomiya, Y.; Pedchenko, V.; Pfaff, S.L.; et al. Distinct target-derived signals organize formation, maturation, and maintenance of motor nerve terminals. Cell 2007, 129, 179–193. [Google Scholar] [CrossRef] [PubMed]
- Brown, N.B.; Dunn, W. Relationship between context and sensory processing in children with autism. Am. J. Occup. Ther. 2010, 64, 474–483. [Google Scholar] [CrossRef] [PubMed]
- Dunn, W. Sensory Profile Supplement: User’s Manual Blooming-Ton; Pearson: San Antonio, MN, USA, 2006. [Google Scholar]
- Shochat, T.; Tzischinsky, O.; Engel-Yeger, B. Sensory hypersensitivity as a contributing factor in the relation between sleep and behavioral disorders in normal school children. Behav. Sleep Med. 2009, 7, 53–62. [Google Scholar] [CrossRef]
- Min, C. Making Sense of Life Balance: A Coaching Intervention for Adults with Sensory Processing Challenges. Ph.D. Thesis, Boston University, Boston, MA, USA, 2017. [Google Scholar]
- Rajaei, S.; Kalantari, M.; Azari, Z.P.; Tabatabaee, S.M.; Dunn, W. Sensory Processing Patterns and Sleep Quality in Primary School Children. Iran. J. Child Neurol. 2020, 14, 57–68. [Google Scholar]
- Sinclair, C.; Meredith, P.; Strong, J.; Chalkiadis, G.A. Sensory Modulation: An important piece of the disability puzzle for adolescents with persistent pain. Clin. J. Pain 2019, 35, 121–132. [Google Scholar] [CrossRef] [PubMed]
- Engel-Yeger, B. Validating the Adolescent/Adult Sensory Profile and examining its ability to screen sensory processing difficulties among Israeli people. Br. J. Occup. Ther. 2012, 75, 321–329. [Google Scholar] [CrossRef]
- Bar-Shalita, T.; Deutsch, L.; Honigman, L.; Weissman-Fogel, I. Ecological aspects of pain in sensory modulation disorder. Dev. Disabil. Res. Rev. 2015, 45–46, 157–167. [Google Scholar] [CrossRef]
- Kinnealey, M.; Koenig, K.P.; Smith, S. Relationships between sensory modulation and social supports and health-related quality of life. Am. J. Occup. Ther. 2011, 65, 320–332. [Google Scholar] [CrossRef] [PubMed]
- Engel-Yeger, B.; DeLuca, J.; Hake, P.; Goverover, Y. The role of sensory processing difficulties, cognitive impairment, and disease severity in predicting functional behavior among patients with multiple sclerosis. Disabil. Rehabil. 2021, 43, 1129–1136. [Google Scholar] [CrossRef] [PubMed]
- Alperin, B.R.; Tusch, E.S.; Mott, K.K.; Holcomb, P.J.; Daffner, K.R. Investigating age-related changes in anterior and posterior neural activity throughout the information processing stream. Brain Cogn. 2015, 99, 118–127. [Google Scholar] [CrossRef][Green Version]
- Engel-Yeger, B.; Dunn, W. The relationship between sensory processing difficulties and anxiety level in healthy adults. Br. J. Occup. Ther. 2011, 74, 210–216. [Google Scholar] [CrossRef]
- Engel-Yeger, B.; Hus, S.; Rosenblum, S. Age effects on sensory-processing abilities and their impact on handwriting. Can. J. Occup. Ther. 2012, 79, 264–274. [Google Scholar] [CrossRef]
- Engel-Yeger, B.; Dunn, W. Exploring the relationship between affect and sensory processing patterns in adults. Br. J. Occup. Ther. 2011, 74, 456–464. [Google Scholar] [CrossRef]
- Engel-Yeger, B.; Palgy-Levin, D.; Lev-Wiesel, R. Predicting fears of intimacy among individuals with post-traumatic stress symptoms by their sensory profile. Br. J. Occup. Ther. 2015, 78, 51–57. [Google Scholar] [CrossRef]
- Stols, D.; van Heerden, R.; van Jaarsveld, A.; Nel, R. Substance abusers’ anger behaviour and sensory pro- cessing patterns: An occupational therapy investigation. S. Afr. J. Occup. Ther. 2013, 43, 25–34. [Google Scholar]
- Brown, C. What is the best environment for me? A sensory processing perspective. Ocuup, Ther. Ment. Health. 2002, 17, 115–125. [Google Scholar] [CrossRef]
- Miller, L.J.; Anzalone, M.E.; Lane, S.J.; Cermak, S.A.; Osten, E.T. Concept evolution in sensory integration: A proposed nosology for diagnosis. Am. J. Occup. Ther. 2007, 61, 135–140. [Google Scholar] [CrossRef]
- Bar-Shalita, T.; Vatine, J.; Parush, S. Sensory modulation disorder: A risk factor for participation in daily life activities. Dev. Med. Child Neurol. 2008, 50, 932–937. [Google Scholar] [CrossRef]
- Chien, C.W.; Rodger, S.; Copley, J.; Branjerdporn, G.; Taggart, C. Sensory processing and its relationship with children’s daily life participation. Phys. Occup. Ther. Pediatr. 2016, 36, 73–87. [Google Scholar] [CrossRef]
- Moher, D.; Liberati, A.; Tetzlaff, J.; Altman, D.G. Preferred reporting items for systematic reviews and meta-analyses: The PRISMA statement. Int. J. Surg. 2010, 8, 336–341. [Google Scholar] [CrossRef] [PubMed]
- Downes, M.J.; Brennan, M.L.; Williams, H.C.; Dean, R.S. Development of a critical appraisal tool to assess the quality of cross-sectional studies (AXIS). BMJ Open 2016, 6, e011458. [Google Scholar] [CrossRef] [PubMed]
- Higgins, J.P.; Sterne, J.A.; Savović, J.; Page, M.J.; Hróbjartsson, A.; Boutron, I.; Reeves, B.; Eldridge, S. A revised tool for assessing risk of bias in randomized trials. Cochrane Database Syst. Rev. 2016, 10, 29–31. [Google Scholar]
- Eng, W.; Heimberg, R.G.; Hart, T.A.; Schneier, F.R.; Liebowitz, M.R. Attachment in individuals with social anxiety disorder: The relationship among adult attachment styles, social anxiety, and depression. Emotion 2001, 1, 365–380. [Google Scholar] [CrossRef]
- Pfeiffer, B.; Brusilovskiy, E.; Bauer, J.; Salzer, M.S. Sensory Processing, Participation, and Recovery in Adults with Serious Mental Illnesses. Psychiatr. Rehabil. J. 2014, 37, 289–296. [Google Scholar] [CrossRef]
- Stern, B.Z.; Strober, L.B.; Goverover, Y. Relationship between sensory processing patterns, trait anxiety, and health-related quality of life in multiple sclerosis. J. Health Psychol. 2020, 1359105319901316. [Google Scholar] [CrossRef]
- Engel-Yeger, B.; Darawsha, S.; Darawsha, M. The relationship between health-related quality of life and sensory deficits among patients with diabetes mellitus. Disabil. Rehabil. 2017, 40, 3005–3011. [Google Scholar] [CrossRef]
- Genizi, J.; Halevy, A.; Schertz, M.; Osman, K.; Assaf, N.; Segal, I.; Srugo, I.; Kessel, A.; Engel-Yeger, B. Sensory Processing Difficulties Correlate with Disease Severity and Quality of Life among Children with Migraine. Front. Neurol. 2019, 10, 448. [Google Scholar] [CrossRef]
- Serafini, G.; Gonda, X.; Pompili, M.; Rihmer, Z.; Amore, M.; Engel-Yeger, B. The relationship between sensory processing patterns, alexithymia, traumatic childhood experiences, and quality of life among patients with unipolar and bipolar disorders. Child Abus. Negl. 2016, 62, 39–50. [Google Scholar] [CrossRef] [PubMed]
- Crofton, E.; Meredith, P.J.; Gray, P.; Strong, J. Compression garment wear and sensory variables after burn: A single-site study. Burns 2020, 46, 1903–1913. [Google Scholar] [CrossRef]
- Lee, T.K. Correlations between Quality of Life and Sensory Processing Abilities in Older Adults. J. Korea Contents Assoc. 2012, 12, 272–279. [Google Scholar] [CrossRef]
- Lee, J.H.; Lee, T.Y.; Kim, Y.R. Quality of Life in Chungcheong area University Students according to their Sensory Processing Intervention. J. Korea Acad.-Industr. Coop. Soc. 2016, 17, 81–88. [Google Scholar]
- Colbeck, M. Sensory processing, cognitive fatigue, and quality of life in multiple sclerosis. Can. J. Occup. Ther. 2018, 85, 169–175. [Google Scholar] [CrossRef]
- Faul, F.; Erdfelder, E.; Lang, A.G.; Buchner, A.G. A flexible statistical power analysis program for the social, behavioral, and biomedical sciences. Behav. Res. Methods 2007, 39, 175–191. [Google Scholar] [CrossRef]
- Kinnealey, M.; Oliver, B.; Wilbarger, P. A phenomenological study of sensory defensiveness in adults. Am. J. Occup. Ther. 1995, 49, 444–451. [Google Scholar] [CrossRef] [PubMed]
- Bar-Shalita, T.; Seltzer, Z.; Vatine, J.J.; Yochman, A.; Parush, S. Development and psychometric properties of the Sensory Responsiveness Questionnaire (SRQ). Disabil. Rehabil. 2009, 31, 189–201. [Google Scholar] [CrossRef]
- Boyce, P.; Parker, G. Development of a scale to measure interpersonal sensitivity. Aust. N. Z. J. Psychiatry 1989, 23, 341–351. [Google Scholar] [CrossRef]
- World Health Organization. World Health Organization Quality of Life Questionnaire, Brief Version (WHOQOL-BREF). 1996. Available online: http://www.who.int/mental_health/media/en/76.pdf (accessed on 15 December 2020).
- Min, S.K.; Kim, K.I.; Jung, Y.C.; Suh, S.Y.; Kim, D.K. Development of the Korean versions of WHO Quality of Life scale and WHOQOL-BREF. Qual. Life Res. 2002, 11, 593–600. [Google Scholar] [CrossRef] [PubMed]
- Varni, J.W.; Seid, M.; Kurtin, P.S. PedsQL 4.0: Reliability and validity of the Pediatric Quality of Life Inventory version 4.0 generic core scales in healthy and patient populations. Med. Care 2001, 39, 800–812. [Google Scholar] [CrossRef] [PubMed]
- Ware, J.E.; Snow, K.K.; Kosinski, M.; Gandek, B. SF–36 Health Survey Manual and Interpretation Guide; Medical Center, The Health Institute: Boston, UK, 1993. [Google Scholar]
- Ware, J., Jr.; Kosinski, M.; Keller, S.D. A 12-Item Short-Form Health Survey: Construction of scales and preliminary tests of reliability and validity. Med. Care 1996, 34, 220–233. [Google Scholar] [CrossRef]
- Hays, R.D.; Morales, L.S. The RAND-36 measure of health-related quality of life. Ann. Med. 2001, 33, 350–357. [Google Scholar] [CrossRef]
- Hawthorne, G.; Richardson, J.; Osborne, R. The Assessment of quality of life (AQOL) instrument: A psychometric measure of health-related quality of life. Qual. Life Res. 1999, 8, 209–224. [Google Scholar] [CrossRef]
- Vickrey, B.; Hays, R.D.; Harooni, R.; Myers, L.W.; Ellison, G.W. A health-related quality of life measure for multiple sclerosis. Qual. Life Res. 1995, 4, 187–206. [Google Scholar] [CrossRef] [PubMed]
- Evensen, J.; Røssberg, J.I.; Barder, H.; Haahr, U.; ten Velden Hegelstad, W.; Joa, I.; Johannessen, J.O.; Larsen, T.K.; Melle, I.; Opjordsmoen, S.; et al. Apathy in first episode psychosis patients: A ten year longitudinal follow-up study. Schizophr. Res. 2012, 136, 19–24. [Google Scholar] [CrossRef]
- Frisch, M.B. Quality of Life Inventory: Manual and Treatment Guide; National Computer Systems: Minneapolis, MN, USA, 1994. [Google Scholar]
- Seong-jae, C. Research on the development of the life satisfaction scale for the elderly people. Korean Cult. Res. Rev. 1986, 49, 233–258. [Google Scholar]
- Meyer, B.; Carver, C.S. Negative childhood accounts, sensitivity, and pessimism: A study of avoidant personality disorder features in college students. J. Pers. Disord. 2000, 14, 233–248. [Google Scholar] [CrossRef]
- Rappaport, M.B.; Corbally, C. Evolution of religious capacity in the genus homo: Trait complexity in action through compassion. J. Relig. Sci. 2018, 53, 198–239. [Google Scholar] [CrossRef]
- Engel-Yeger, B.; Rosenblum, S. Executive dysfunctions mediate between altered sensory processing and daily activity performance in order adults. BMC Geriatr. 2021, 21, 132. [Google Scholar] [CrossRef]
- Adams, J.N.; Feldman, H.M.; Huffman, L.C.; Loe, I.M. Sensory processing in preterm preschoolers and its association with executive function. Early Hum. Dev. 2015, 91, 227–233. [Google Scholar] [CrossRef]
- Boeke, E.A.; Moscarello, J.M.; LeDoux, J.E.; Phelps, E.A.; Hartley, C.A. Active avoidance: Neural mechanisms and attenuation of pavlovian conditioned responding. J. Neurosci. 2017, 37, 4808–4818. [Google Scholar] [CrossRef]
- Bailliard, A.L.; Whigham, S.C. Linking neuroscience, function, and intervention: A scoping review of sensory processing and mental illness. Am. J. Occup. Ther. 2017, 71, 7105100040. [Google Scholar] [CrossRef] [PubMed]
- Aron, E.N. The Highly Sensitive Child: Helping Our Children Thrive When the World Overwhelms Them; Broadway Books: Portland, OR, USA, 2002. [Google Scholar]
- John, T.S.; Estes, A.; Begay, K.K.; Munson, J.; Reiter, M.A.; Dager, S.R.; Kleinhans, N. Characterizing Social Functioning in School-Age Children with Sensory Processing Abnormalities. J. Autism Dev. Disord. 2021, 1–13. [Google Scholar] [CrossRef]
- Koenig, K.P.; Rudney, S.G. Performance challenges for children and adolescents with difficulty processing and integrating sensory information: A systematic review. Am. J. Occup. Ther. 2010, 64, 430–442. [Google Scholar] [CrossRef] [PubMed]
- De Vera, M.I.; Gabari, M.I. Associated factors with resilience and burnout: A cross-sectional study in a teaching group in Spain. Aula Abierta 2020, 49, 177–184. [Google Scholar]
- Hebert, K.R. The association between sensory processing styles and mindfulness. Br. J. Occup. Ther. 2016, 79, 557–564. [Google Scholar] [CrossRef]

| Search Strategy | |
|---|---|
| 1. | (“sensory processing sensitivity” [All fields] OR “sensory-processing-sensitivity” [All fields] OR “highly sensitive person” [All fields] OR “high sensitivity” [Title/Abstract]) |
| 2. | (“quality of life” [All fields] OR “quality of life” [Title/Abstract] OR “health-related quality of life” [Title/Abstract] OR “health-related quality of life” [All fields]) |
| 3. | 1. AND 2. |
Publisher’s Note: MDPI stays neutral with regard to jurisdictional claims in published maps and institutional affiliations. |
© 2021 by the authors. Licensee MDPI, Basel, Switzerland. This article is an open access article distributed under the terms and conditions of the Creative Commons Attribution (CC BY) license (https://creativecommons.org/licenses/by/4.0/).
Share and Cite
Costa-López, B.; Ferrer-Cascales, R.; Ruiz-Robledillo, N.; Albaladejo-Blázquez, N.; Baryła-Matejczuk, M. Relationship between Sensory Processing and Quality of Life: A Systematic Review. J. Clin. Med. 2021, 10, 3961. https://doi.org/10.3390/jcm10173961
Costa-López B, Ferrer-Cascales R, Ruiz-Robledillo N, Albaladejo-Blázquez N, Baryła-Matejczuk M. Relationship between Sensory Processing and Quality of Life: A Systematic Review. Journal of Clinical Medicine. 2021; 10(17):3961. https://doi.org/10.3390/jcm10173961
Chicago/Turabian StyleCosta-López, Borja, Rosario Ferrer-Cascales, Nicolás Ruiz-Robledillo, Natalia Albaladejo-Blázquez, and Monika Baryła-Matejczuk. 2021. "Relationship between Sensory Processing and Quality of Life: A Systematic Review" Journal of Clinical Medicine 10, no. 17: 3961. https://doi.org/10.3390/jcm10173961
APA StyleCosta-López, B., Ferrer-Cascales, R., Ruiz-Robledillo, N., Albaladejo-Blázquez, N., & Baryła-Matejczuk, M. (2021). Relationship between Sensory Processing and Quality of Life: A Systematic Review. Journal of Clinical Medicine, 10(17), 3961. https://doi.org/10.3390/jcm10173961