
ADC-Based Stratification of Molecular Glioma Subtypes Using High b-Value Diffusion-Weighted Imaging

 , , , and
Abstract
:1. Introduction
2. Materials and Methods
2.1. Study Types and Ethics
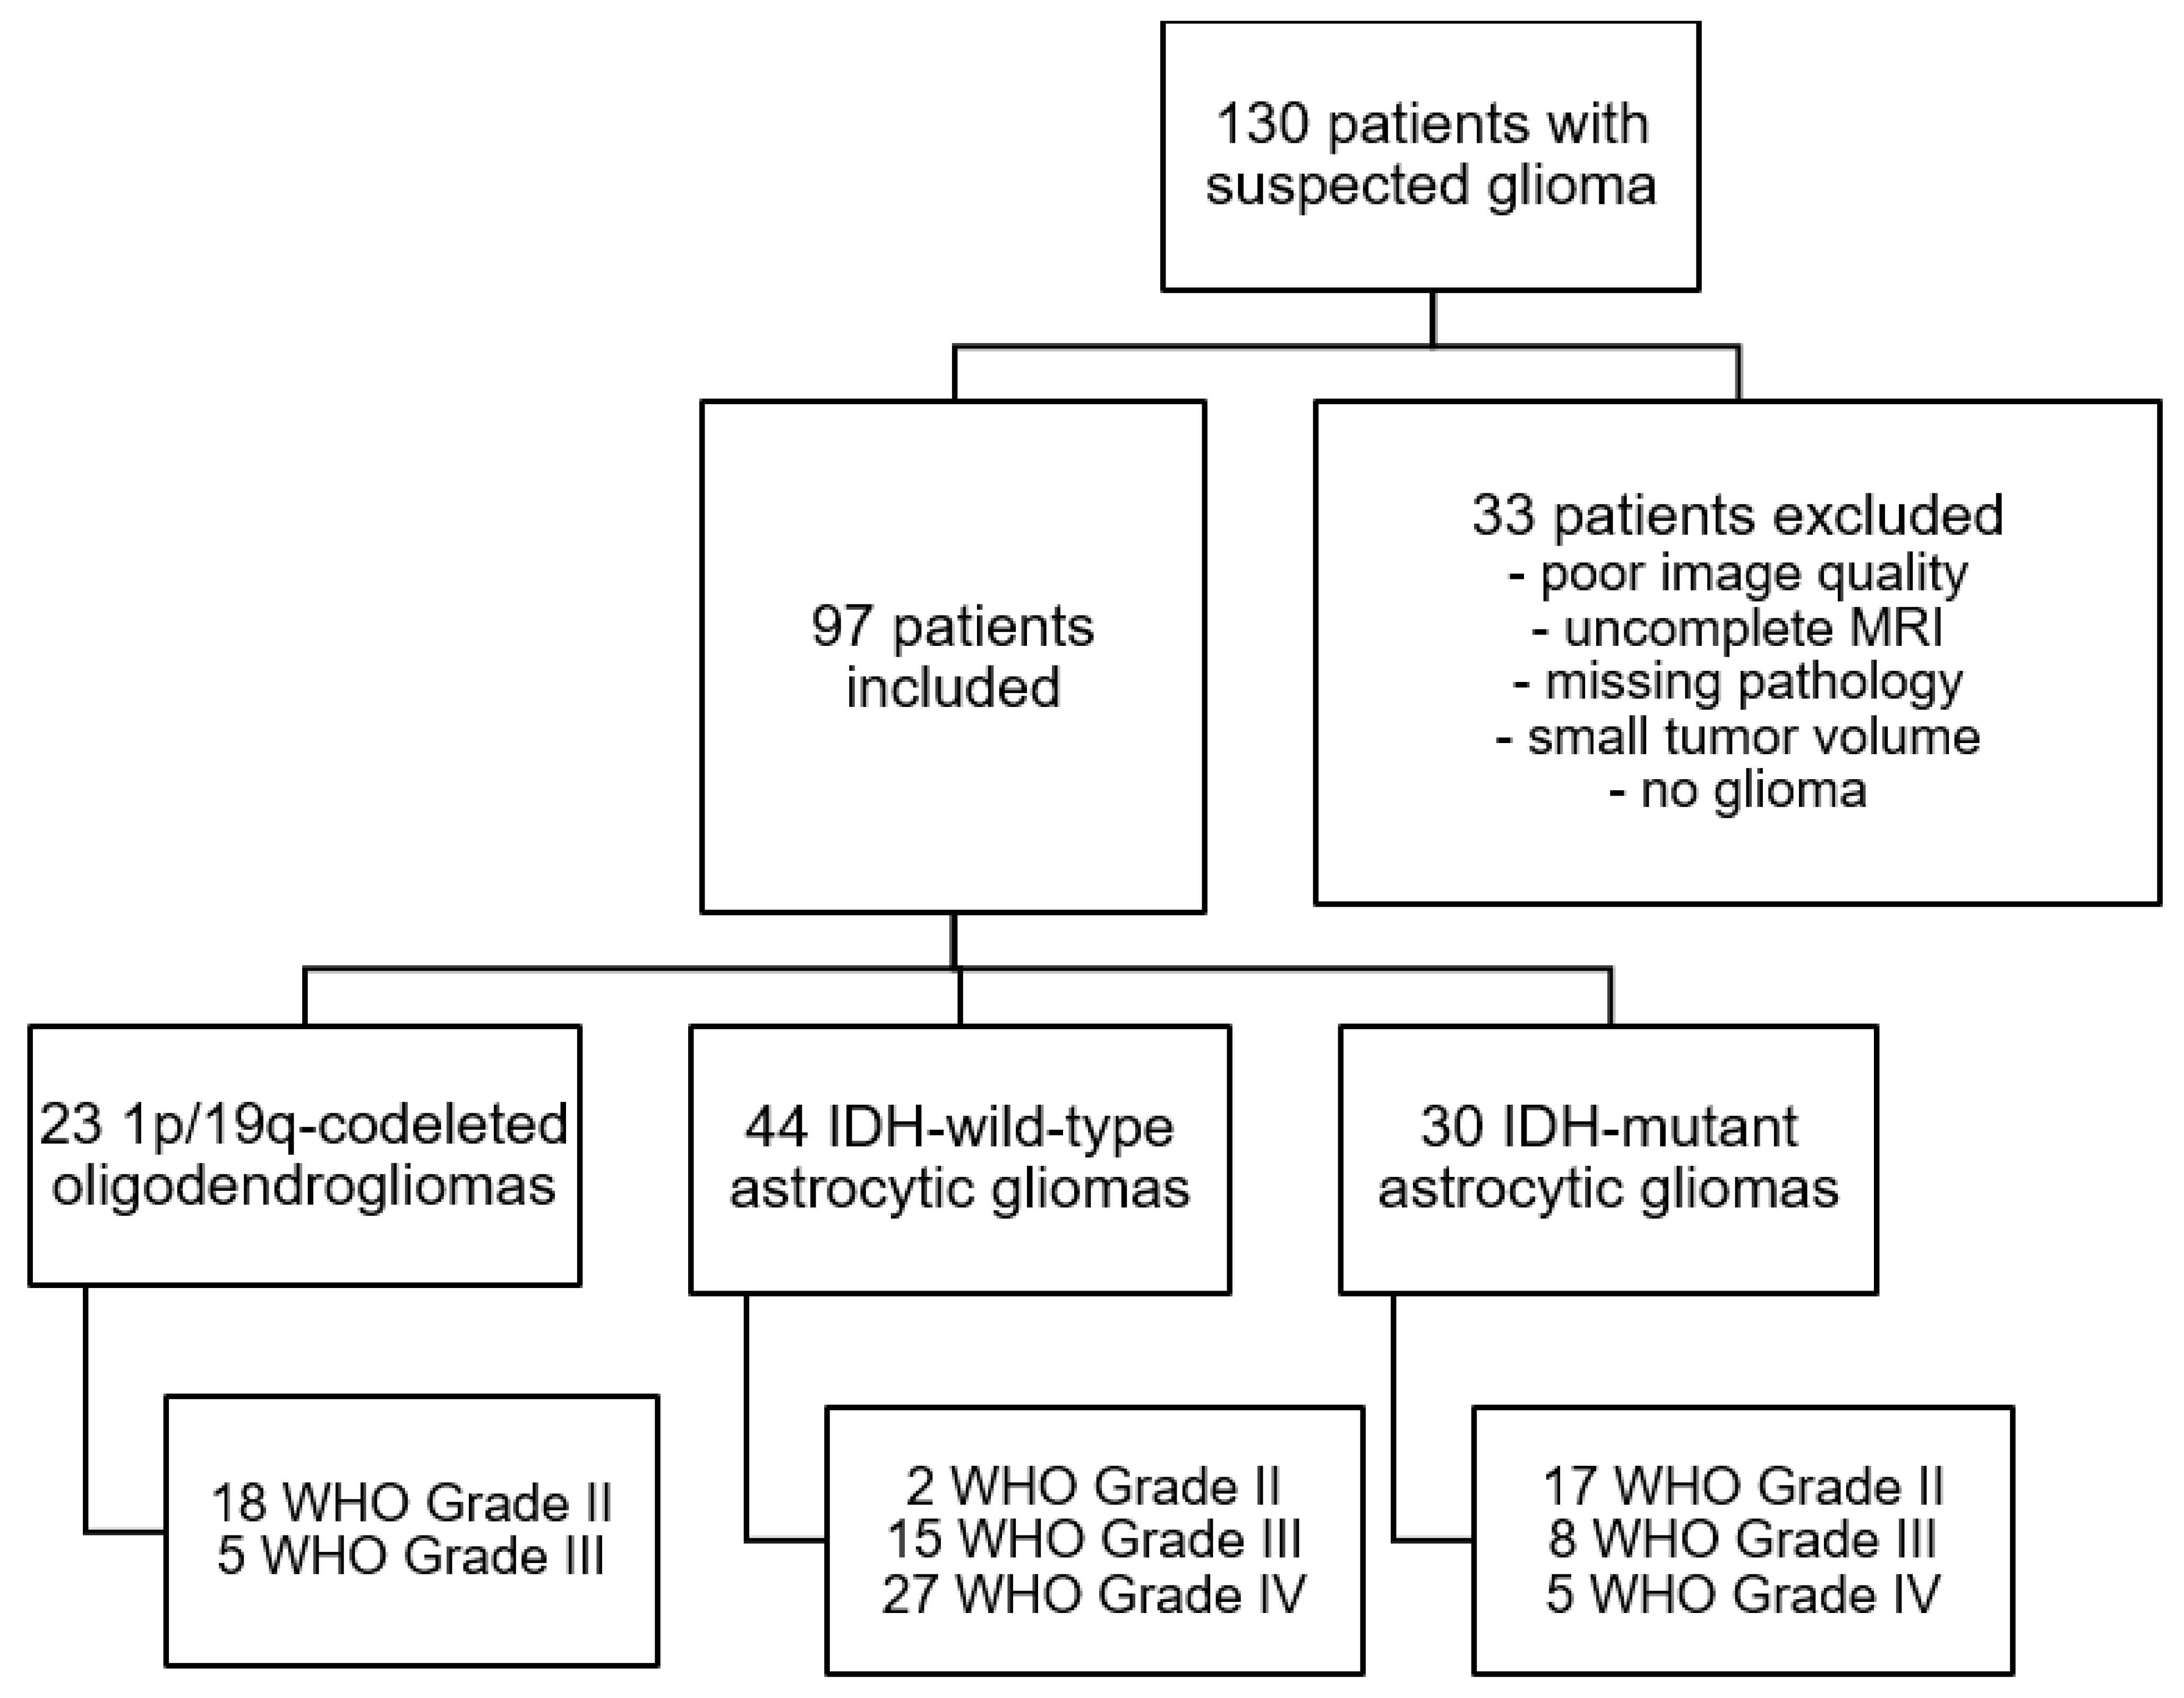
2.2. Patient Selection and Stratification
2.3. Glioma Classification
2.4. MR Imaging
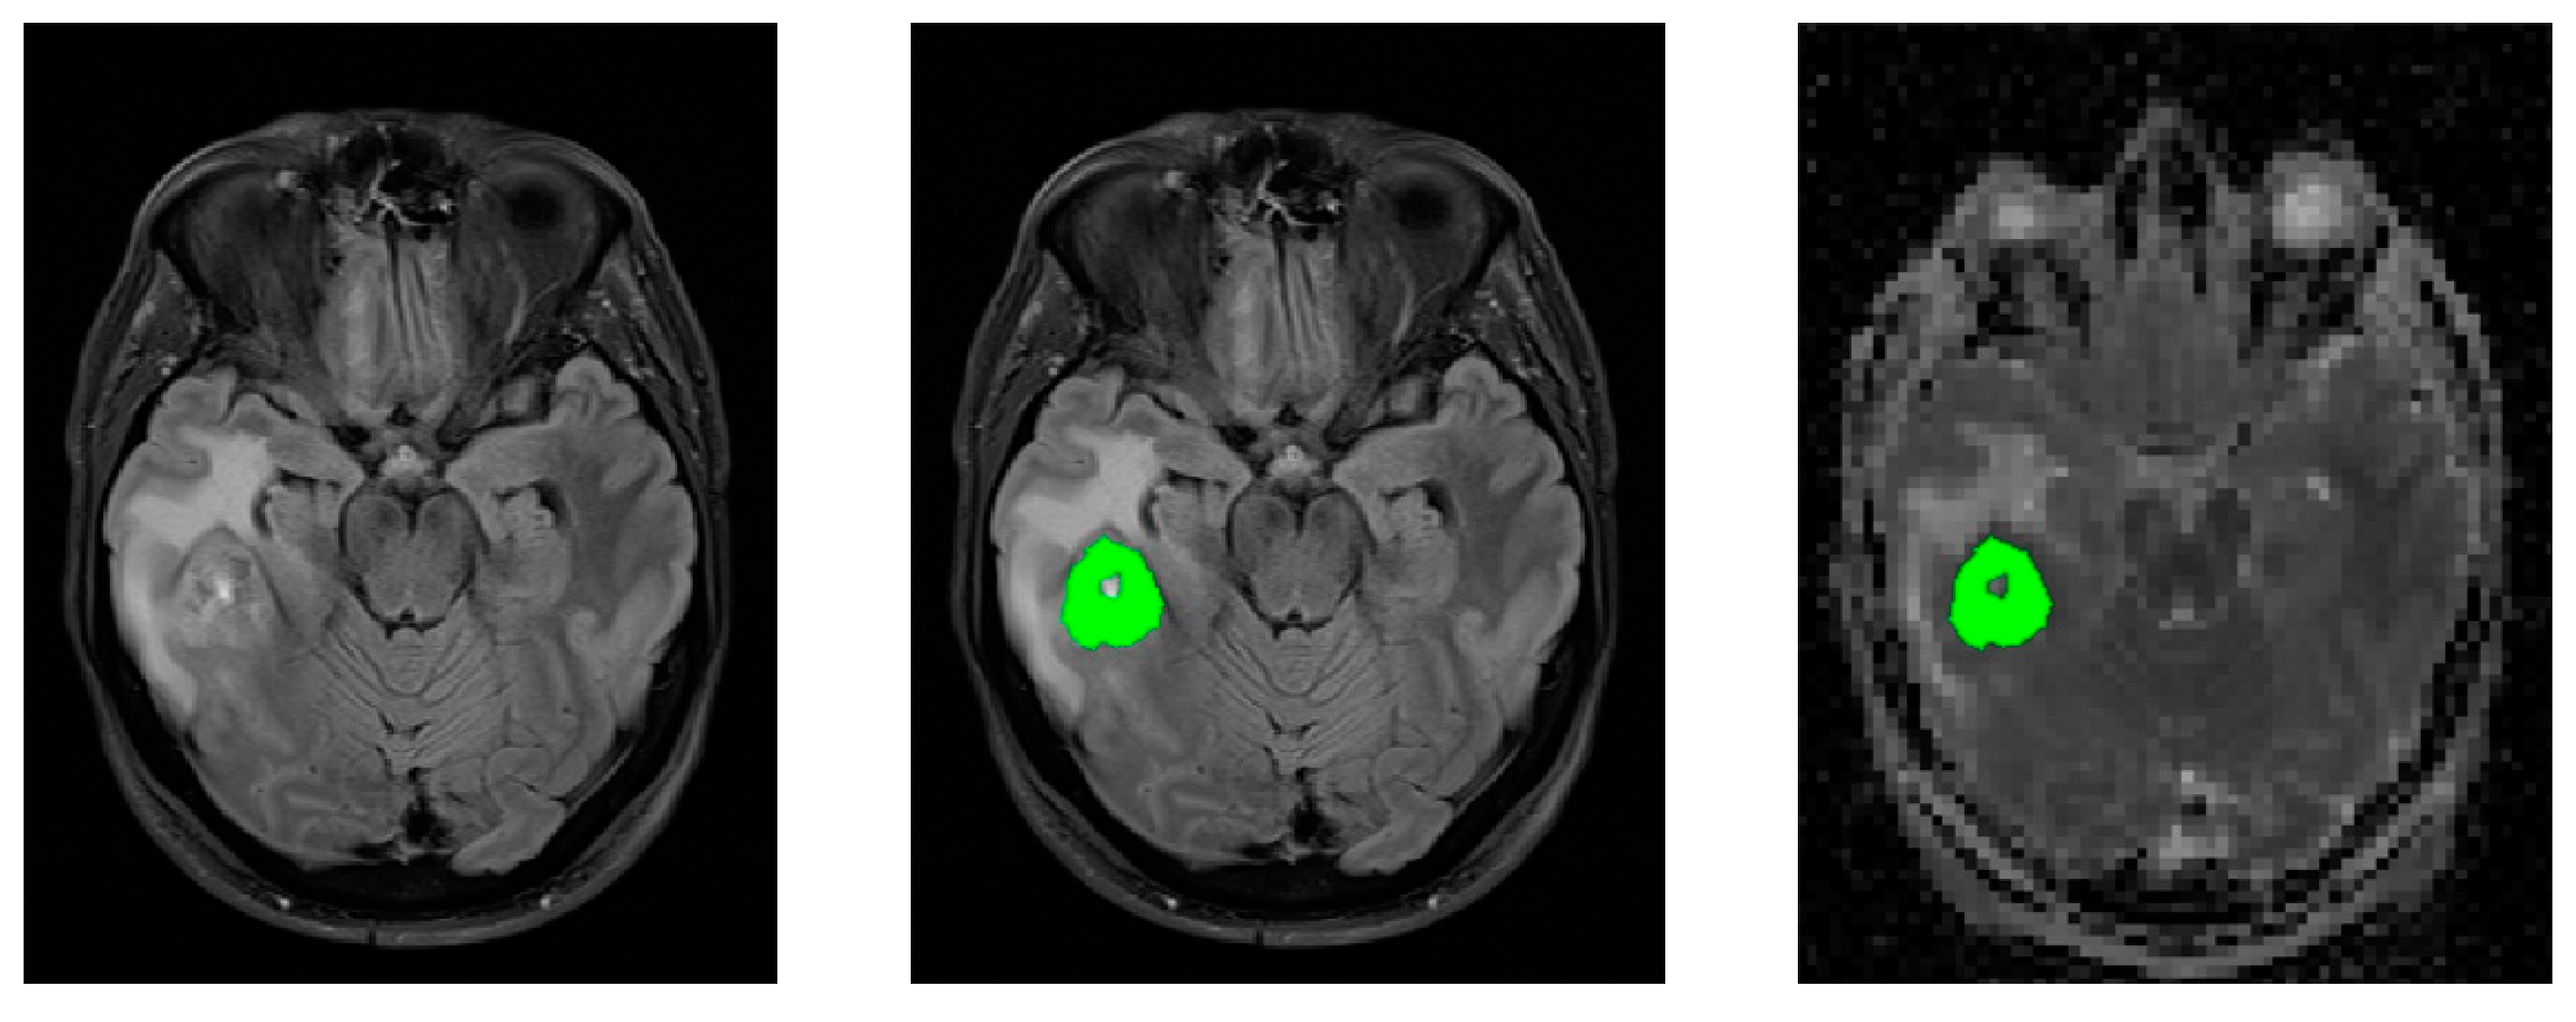
2.5. Image Post-Processing
3. Results
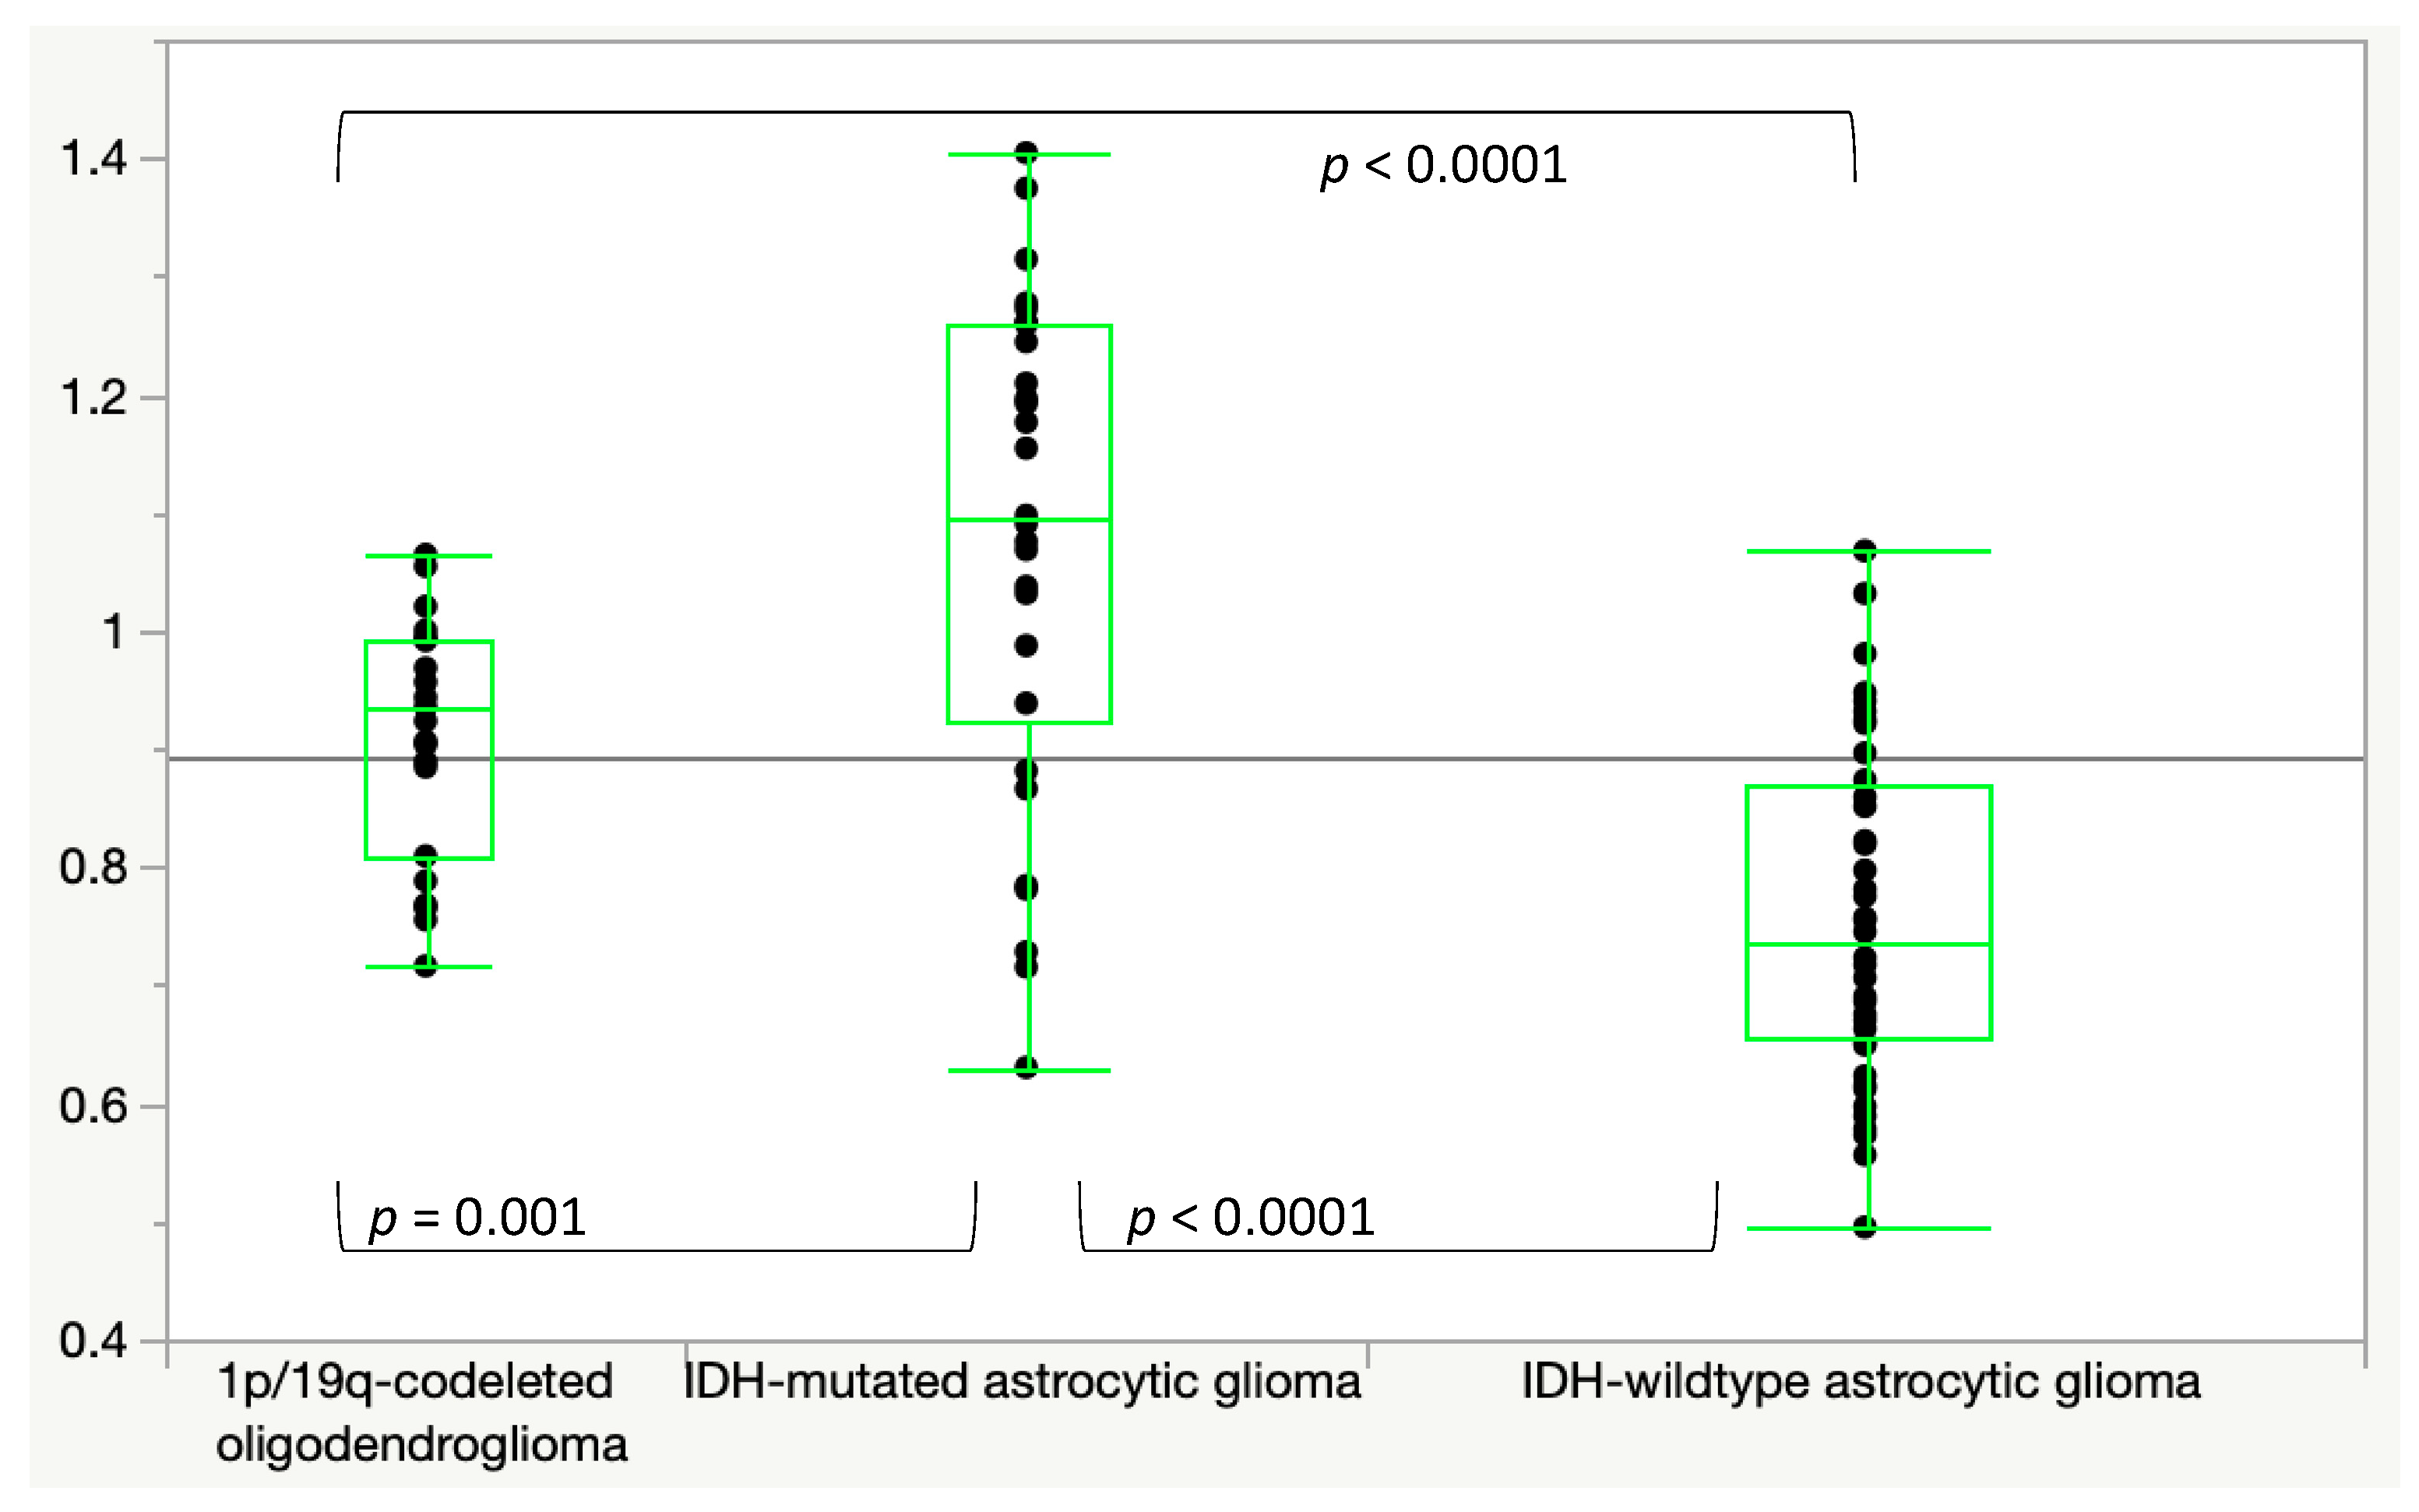
3.1. ADC
3.2. MK
3.3. MD
4. Discussion
Limitations
5. Conclusions
Author Contributions
Funding
Institutional Review Board Statement
Informed Consent Statement
Data Availability Statement
Acknowledgments
Conflicts of Interest
Appendix A

References
- Schwartzbaum, J.A.; Fisher, J.L.; Aldape, K.D.; Wrensch, M. Epidemiology and molecular pathology of glioma. Nat. Clin. Pract. Neurol. 2006, 2, 494–503. [Google Scholar] [CrossRef]
- Weller, M.; van den Bent, M.; Tonn, J.C.; Stupp, R.; Preusser, M.; Cohen-Jonathan-Moyal, E.; Henriksson, R.; Le Rhun, E.; Balana, C.; Chinot, O.; et al. European Association for Neuro-Oncology (EANO) guideline on the diagnosis and treatment of adult astrocytic and oligodendroglial gliomas. Lancet Oncol. 2017, 18, e315–e329. [Google Scholar] [CrossRef] [Green Version]
- Van Cauter, S.; De Keyzer, F.; Sima, D.M.; Sava, A.C.; D’Arco, F.; Veraart, J.; Peeters, R.R.; Leemans, A.; Van Gool, S.; Wilms, G.; et al. Integrating diffusion kurtosis imaging, dynamic susceptibility-weighted contrast-enhanced MRI, and short echo time chemical shift imaging for grading gliomas. Neuro Oncol. 2014, 16, 1010–1021. [Google Scholar] [CrossRef]
- Louis, D.N.; Perry, A.; Reifenberger, G.; von Deimling, A.; Figarella-Branger, D.; Cavenee, W.K.; Ohgaki, H.; Wiestler, O.D.; Kleihues, P.; Ellison, D.W. The 2016 World Health Organization Classification of Tumors of the Central Nervous System: A summary. Acta Neuropathol. 2016, 131, 803–820. [Google Scholar] [CrossRef] [PubMed] [Green Version]
- Hempel, J.M.; Brendle, C.; Bender, B.; Bier, G.; Skardelly, M.; Gepfner-Tuma, I.; Eckert, F.; Ernemann, U.; Schittenhelm, J. Contrast enhancement predicting survival in integrated molecular subtypes of diffuse glioma: An observational cohort study. J. Neurooncol. 2018, 139, 373–381. [Google Scholar] [CrossRef] [PubMed]
- Zhang, L.; Min, Z.; Tang, M.; Chen, S.; Lei, X.; Zhang, X. The utility of diffusion MRI with quantitative ADC measurements for differentiating high-grade from low-grade cerebral gliomas: Evidence from a meta-analysis. J. Neurol. Sci. 2017, 375, 103–106. [Google Scholar] [CrossRef] [PubMed] [Green Version]
- Kang, Y.; Choi, S.H.; Kim, Y.J.; Kim, K.G.; Sohn, C.H.; Kim, J.H.; Yun, T.J.; Chang, K.H. Gliomas: Histogram analysis of apparent diffusion coefficient maps with standard- or high-b-value diffusion-weighted MR imaging—Correlation with tumor grade. Radiology 2011, 261, 882–890. [Google Scholar] [CrossRef] [PubMed] [Green Version]
- Ellingson, B.M.; Bendszus, M.; Boxerman, J.; Barboriak, D.; Erickson, B.J.; Smits, M.; Nelson, S.J.; Gerstner, E.; Alexander, B.; Goldmacher, G.; et al. Consensus recommendations for a standardized Brain Tumor Imaging Protocol in clinical trials. Neuro Oncol. 2015, 17, 1188–1198. [Google Scholar]
- Thust, S.C.; Heiland, S.; Falini, A.; Jager, H.R.; Waldman, A.D.; Sundgren, P.C.; Godi, C.; Katsaros, V.K.; Ramos, A.; Bargallo, N.; et al. Glioma imaging in Europe: A survey of 220 centres and recommendations for best clinical practice. Eur. Radiol. 2018, 28, 3306–3317. [Google Scholar] [CrossRef] [Green Version]
- Hempel, J.M.; Schittenhelm, J.; Brendle, C.; Bender, B.; Bier, G.; Skardelly, M.; Tabatabai, G.; Castaneda Vega, S.; Ernemann, U.; Klose, U. Effect of Perfusion on Diffusion Kurtosis Imaging Estimates for In Vivo Assessment of Integrated 2016 WHO Glioma Grades: A Cross-Sectional Observational Study. Clin. Neuroradiol. 2017, 28, 481–491. [Google Scholar] [CrossRef]
- Hempel, J.M.; Bisdas, S.; Schittenhelm, J.; Brendle, C.; Bender, B.; Wassmann, H.; Skardelly, M.; Tabatabai, G.; Vega, S.C.; Ernemann, U.; et al. Erratum to: In vivo molecular profiling of human glioma using diffusion kurtosis imaging. J. Neurooncol. 2017, 131, 103. [Google Scholar] [CrossRef] [PubMed] [Green Version]
- Hempel, J.M.; Brendle, C.; Bender, B.; Bier, G.; Kraus, M.S.; Skardelly, M.; Richter, H.; Eckert, F.; Schittenhelm, J.; Ernemann, U.; et al. Diffusion kurtosis imaging histogram parameter metrics predicting survival in integrated molecular subtypes of diffuse glioma: An observational cohort study. Eur. J. Radiol. 2019, 112, 144–152. [Google Scholar] [CrossRef] [PubMed]
- Capper, D.; Weissert, S.; Balss, J.; Habel, A.; Meyer, J.; Jager, D.; Ackermann, U.; Tessmer, C.; Korshunov, A.; Zentgraf, H.; et al. Characterization of R132H mutation-specific IDH1 antibody binding in brain tumors. Brain Pathol. 2010, 20, 245–254. [Google Scholar] [CrossRef] [PubMed]
- Hartmann, C.; Meyer, J.; Balss, J.; Capper, D.; Mueller, W.; Christians, A.; Felsberg, J.; Wolter, M.; Mawrin, C.; Wick, W.; et al. Type and frequency of IDH1 and IDH2 mutations are related to astrocytic and oligodendroglial differentiation and age: A study of 1010 diffuse gliomas. Acta Neuropathol. 2009, 118, 469–474. [Google Scholar] [CrossRef] [Green Version]
- Ebrahimi, A.; Skardelly, M.; Bonzheim, I.; Ott, I.; Muhleisen, H.; Eckert, F.; Tabatabai, G.; Schittenhelm, J. ATRX immunostaining predicts IDH and H3F3A status in gliomas. Acta Neuropathol. Commun. 2016, 4, 60. [Google Scholar] [CrossRef] [Green Version]
- Thon, N.; Eigenbrod, S.; Grasbon-Frodl, E.M.; Ruiter, M.; Mehrkens, J.H.; Kreth, S.; Tonn, J.C.; Kretzschmar, H.A.; Kreth, F.W. Novel molecular stereotactic biopsy procedures reveal intratumoral homogeneity of loss of heterozygosity of 1p/19q and TP53 mutations in World Health Organization grade II gliomas. J. Neuropathol. Exp. Neurol. 2009, 68, 1219–1228. [Google Scholar] [CrossRef] [Green Version]
- Reuss, D.E.; Sahm, F.; Schrimpf, D.; Wiestler, B.; Capper, D.; Koelsche, C.; Schweizer, L.; Korshunov, A.; Jones, D.T.; Hovestadt, V.; et al. ATRX and IDH1-R132H immunohistochemistry with subsequent copy number analysis and IDH sequencing as a basis for an “integrated” diagnostic approach for adult astrocytoma, oligodendroglioma and glioblastoma. Acta Neuropathol. 2015, 129, 133–146. [Google Scholar] [CrossRef] [PubMed]
- Reuss, D.E.; Mamatjan, Y.; Schrimpf, D.; Capper, D.; Hovestadt, V.; Kratz, A.; Sahm, F.; Koelsche, C.; Korshunov, A.; Olar, A.; et al. IDH mutant diffuse and anaplastic astrocytomas have similar age at presentation and little difference in survival: A grading problem for WHO. Acta Neuropathol. 2015, 129, 867–873. [Google Scholar] [CrossRef] [Green Version]
- Reuss, D.E.; Kratz, A.; Sahm, F.; Capper, D.; Schrimpf, D.; Koelsche, C.; Hovestadt, V.; Bewerunge-Hudler, M.; Jones, D.T.; Schittenhelm, J.; et al. Adult IDH wild type astrocytomas biologically and clinically resolve into other tumor entities. Acta Neuropathol. 2015, 130, 407–417. [Google Scholar] [CrossRef] [Green Version]
- Suzuki, H.; Aoki, K.; Chiba, K.; Sato, Y.; Shiozawa, Y.; Shiraishi, Y.; Shimamura, T.; Niida, A.; Motomura, K.; Ohka, F.; et al. Mutational landscape and clonal architecture in grade II and III gliomas. Nat. Genet. 2015, 47, 458–468. [Google Scholar] [CrossRef]
- Brendle, C.; Hempel, J.M.; Schittenhelm, J.; Skardelly, M.; Tabatabai, G.; Bender, B.; Ernemann, U.; Klose, U. Glioma Grading and Determination of IDH Mutation Status and ATRX loss by DCE and ASL Perfusion. Clin. Neuroradiol. 2017, 28, 421–428. [Google Scholar] [CrossRef] [PubMed]
- Hempel, J.M.; Schittenhelm, J.; Brendle, C.; Bender, B.; Bier, G.; Skardelly, M.; Tabatabai, G.; Castaneda Vega, S.; Ernemann, U.; Klose, U. Histogram analysis of diffusion kurtosis imaging estimates for in vivo assessment of 2016 WHO glioma grades: A cross-sectional observational study. Eur. J. Radiol. 2017, 95, 202–211. [Google Scholar] [CrossRef] [PubMed]
- Hempel, J.M.; Schittenhelm, J.; Bisdas, S.; Brendle, C.; Bender, B.; Bier, G.; Skardelly, M.; Tabatabai, G.; Castaneda Vega, S.; Ernemann, U.; et al. In vivo assessment of tumor heterogeneity in WHO 2016 glioma grades using diffusion kurtosis imaging: Diagnostic performance and improvement of feasibility in routine clinical practice. J. Neuroradiol. 2018, 45, 32–40. [Google Scholar] [CrossRef]
- Pekmezci, M.; Rice, T.; Molinaro, A.M.; Walsh, K.M.; Decker, P.A.; Hansen, H.; Sicotte, H.; Kollmeyer, T.M.; McCoy, L.S.; Sarkar, G.; et al. Adult infiltrating gliomas with WHO 2016 integrated diagnosis: Additional prognostic roles of ATRX and TERT. Acta Neuropathol. 2017, 133, 1001–1016. [Google Scholar] [CrossRef] [PubMed]
- Le Bihan, D.; Breton, E.; Lallemand, D.; Aubin, M.L.; Vignaud, J.; Laval-Jeantet, M. Separation of diffusion and perfusion in intravoxel incoherent motion MR imaging. Radiology 1988, 168, 497–505. [Google Scholar] [CrossRef]
- Popov, S.; Jury, A.; Laxton, R.; Doey, L.; Kandasamy, N.; Al-Sarraj, S.; Jurgensmeier, J.M.; Jones, C. IDH1-associated primary glioblastoma in young adults displays differential patterns of tumour and vascular morphology. PLoS ONE 2013, 8, e56328. [Google Scholar] [CrossRef]
- Leu, K.; Ott, G.A.; Lai, A.; Nghiemphu, P.L.; Pope, W.B.; Yong, W.H.; Liau, L.M.; Cloughesy, T.F.; Ellingson, B.M. Perfusion and diffusion MRI signatures in histologic and genetic subtypes of WHO grade II-III diffuse gliomas. J. Neurooncol. 2017, 134, 177–188. [Google Scholar] [CrossRef] [PubMed] [Green Version]
- Han, H.; Han, C.; Wu, X.; Zhong, S.; Zhuang, X.; Tan, G.; Wu, H. Preoperative grading of supratentorial nonenhancing gliomas by high b-value diffusion-weighted 3 T magnetic resonance imaging. J. Neurooncol. 2017, 133, 147–154. [Google Scholar] [CrossRef]
- Shan, W.; Wang, X.L. Clinical application value of 3.0T MR diffusion tensor imaging in grade diagnosis of gliomas. Oncol. Lett. 2017, 14, 2009–2014. [Google Scholar] [CrossRef] [PubMed] [Green Version]
- Aggarwal, A.; Das, P.K.; Shukla, A.; Parashar, S.; Choudhary, M.; Kumar, A.; Kumar, N.; Dutta, S. Role of Multivoxel Intermediate TE 2D CSI MR Spectroscopy and 2D Echoplanar Diffusion Imaging in Grading of Primary Glial Brain Tumours. J. Clin. Diagn. Res. 2017, 11, TC05–TC08. [Google Scholar] [CrossRef] [PubMed]
- Yu, Y.; Ma, Y.; Sun, M.; Jiang, W.; Yuan, T.; Tong, D. Meta-analysis of the diagnostic performance of diffusion magnetic resonance imaging with apparent diffusion coefficient measurements for differentiating glioma recurrence from pseudoprogression. Medicine 2020, 99, e20270. [Google Scholar] [CrossRef]
- Jensen, J.H.; Helpern, J.A. MRI quantification of non-Gaussian water diffusion by kurtosis analysis. NMR Biomed. 2010, 23, 698–710. [Google Scholar] [CrossRef] [PubMed]
- De Luca, A.; Bertoldo, A.; Froeling, M. Effects of perfusion on DTI and DKI estimates in the skeletal muscle. Magn. Reson. Med. 2017, 78, 233–246. [Google Scholar] [CrossRef]
- Yamada, I.; Aung, W.; Himeno, Y.; Nakagawa, T.; Shibuya, H. Diffusion coefficients in abdominal organs and hepatic lesions: Evaluation with intravoxel incoherent motion echo-planar MR imaging. Radiology 1999, 210, 617–623. [Google Scholar] [CrossRef] [PubMed]
- Freiman, M.; Voss, S.D.; Mulkern, R.V.; Perez-Rossello, J.M.; Callahan, M.J.; Warfield, S.K. In vivo assessment of optimal b-value range for perfusion-insensitive apparent diffusion coefficient imaging. Med. Phys. 2012, 39, 4832–4839. [Google Scholar] [CrossRef] [Green Version]
- Brendle, C.; Klose, U.; Hempel, J.M.; Schittenhelm, J.; Skardelly, M.; Tabatabai, G.; Ernemann, U.; Bender, B. Association of dynamic susceptibility magnetic resonance imaging at initial tumor diagnosis with the prognosis of different molecular glioma subtypes. Neurol. Sci. 2020, 41, 3625–3632. [Google Scholar] [CrossRef]
- Price, S.J.; Jena, R.; Burnet, N.G.; Hutchinson, P.J.; Dean, A.F.; Pena, A.; Pickard, J.D.; Carpenter, T.A.; Gillard, J.H. Improved delineation of glioma margins and regions of infiltration with the use of diffusion tensor imaging: An image-guided biopsy study. AJNR Am. J. Neuroradiol. 2006, 27, 1969–1974. [Google Scholar] [PubMed]
- Grier, J.T.; Batchelor, T. Low-grade gliomas in adults. Oncologist 2006, 11, 681–693. [Google Scholar] [CrossRef]
- Emblem, K.E.; Nedregaard, B.; Nome, T.; Due-Tonnessen, P.; Hald, J.K.; Scheie, D.; Borota, O.C.; Cvancarova, M.; Bjornerud, A. Glioma grading by using histogram analysis of blood volume heterogeneity from MR-derived cerebral blood volume maps. Radiology 2008, 247, 808–817. [Google Scholar] [CrossRef] [Green Version]
- Kim, H.; Choi, S.H.; Kim, J.H.; Ryoo, I.; Kim, S.C.; Yeom, J.A.; Shin, H.; Jung, S.C.; Lee, A.L.; Yun, T.J.; et al. Gliomas: Application of cumulative histogram analysis of normalized cerebral blood volume on 3 T MRI to tumor grading. PLoS ONE 2013, 8, e63462. [Google Scholar] [CrossRef]
- Unruh, D.; Schwarze, S.R.; Khoury, L.; Thomas, C.; Wu, M.; Chen, L.; Chen, R.; Liu, Y.; Schwartz, M.A.; Amidei, C.; et al. Mutant IDH1 and thrombosis in gliomas. Acta Neuropathol. 2016, 132, 917–930. [Google Scholar] [CrossRef] [PubMed] [Green Version]

| IDH-mut Astrocytic Gliomas | 1p/19q-Codel Oligodendroglioma | IDH-wt Astrocytic Gliomas | |
|---|---|---|---|
| B0/500ADC | 1.59 ± 0.26 | 1.42 ± 0.27 | 1.19 ± 0.2 |
| B0/1000ADC | 1.5 ± 0.27 | 1.32 ± 0.23 | 1.09 ± 0.19 |
| B0/1500ADC | 1.4 ± 0.26 | 1.21 ± 0.19 | 1.00 ± 0.18 |
| B0/2000ADC | 1.29 ± 0.24 | 1.11 ± 0.15 | 0.92 ± 0.16 |
| B0/2500ADC | 1.18 ± 0.22 | 1.01 ± 0.12 | 0.84 ± 0.14 |
| IDH-mut vs. IDH-wt Astrocytic Gliomas | IDH-mut vs. IDH-wt Astrocytic Gliomas; AUC | 1p/19q-Codel Oligodendroglioma vs. IDH-wt Astrocytic Gliomas | 1p/19q-Codel Oligodendroglioma vs. IDH-wt Astrocytic Gliomas; AUC | 1p/19q-Codel Oligodendroglioma vs. IDH-mut Astrocytic Gliomas | 1p/19q-Codel Oligodendroglioma vs. IDH-mut Astrocytic Gliomas; AUC | |
|---|---|---|---|---|---|---|
| B0/500ADC | <0.0001 | 0.874 | 0.002 | 0.778 | 0.08 | 0.696 |
| B0/1000ADC | <0.0001 | 0.883 | <0.001 | 0.784 | 0.03 | 0.699 |
| B0/1500ADC | <0.0001 | 0.879 | 0.0001 | 0.789 | 0.01 | 0.736 |
| B0/2000ADC | <0.0001 | 0.883 | <0.0001 | 0.795 | 0.005 | 0.747 |
| B0/2500ADC | <0.0001 | 0.888 | <0.0001 | 0.799 | 0.003 | 0.751 |
| IDH-mut vs. IDH-wt Astrocytic Gliomas | 1p/19q-Codel Oligodendroglioma vs. IDH-wt Astrocytic Gliomas | 1p/19q-Codel Oligodendroglioma vs. IDH-mut Astrocytic Gliomas | |
|---|---|---|---|
| B500/1000ADC | 1.41 ± 0.28 | 1.21 ± 0.19 | 0.99 ± 0.18 |
| B500/1500ADC | 1.31 ± 0.27 | 1.10 ± 0.15 | 0.90 ± 0.17 |
| B500/2000ADC | 1.19 ± 0.24 | 1.00 ± 0.12 | 0.83 ± 0.15 |
| B500/2500ADC | 1.07 ± 0.21 | 0.91 ± 0.10 | 0.76 ± 0.13 |
| IDH-mut vs. IDH-wt Astrocytic Gliomas | IDH-mut vs. IDH-wt Astrocytic Gliomas; AUC | 1p/19q-Codel Oligodendroglioma vs. IDH-wt Astrocytic Gliomas | 1p/19q-Codel Oligodendroglioma vs. IDH-wt Astrocytic Gliomas; AUC | 1p/19q-Codel Oligodendroglioma vs. IDH-mut Astrocytic Gliomas | 1p/19q-Codel Oligodendroglioma vs. IDH-mut Astrocytic Gliomas; AUC | |
|---|---|---|---|---|---|---|
| B500/1000ADC | <0.0001 | 0.878 | <0.0001 | 0.798 | 0.01 | 0.723 |
| B500/1500ADC | <0.0001 | 0.880 | <0.0001 | 0.795 | 0.003 | 0.746 |
| B500/2000ADC | <0.0001 | 0.883 | <0.0001 | 0.806 | 0.002 | 0.751 |
| B500/2500ADC | <0.0001 | 0.884 | <0.0001 | 0.808 | 0.001 | 0.751 |
| IDH-mut Astrocytic Gliomas | 1p/19q-Codel Oligodendroglioma | IDH-wt Astrocytic Gliomas | |
|---|---|---|---|
| MK0 | 446.1 ± 109 | 552.8 ± 88 | 705.1 ± 145 |
| MK500 | 593.8 ± 121 | 694.4 ± 114 | 825.3 ± 145 |
| MD0 | 1681 ± 293 | 1504 ± 313 | 1224 ± 257 |
| MD500 | 1518 ± 314 | 1288 ± 227 | 1029 ± 224 |
| IDH-mut vs. IDH-wt Astrocytic Gliomas | IDH-mut vs. IDH-wt Astrocytic Gliomas; AUC | 1p/19q-Codel Oligodendroglioma vs. IDH-wt Astrocytic Gliomas | 1p/19q-Codel Oligodendroglioma vs. IDH-wt Astrocytic Gliomas; AUC | 1p/19q-Codel Oligodendroglioma vs. IDH-mut Astrocytic Gliomas | 1p/19q-Codel Oligodendroglioma vs. IDH-mut Astrocytic Gliomas; AUC | |
|---|---|---|---|---|---|---|
| MK0 | <0.0001 | 0.922 | <0.0001 | 0.818 | <0.001 | 0.799 |
| MK500 | <0.0001 | 0.869 | <0.001 | 0.755 | 0.009 | 0.744 |
| MD0 | <0.0001 | 0.887 | 0.002 | 0.781 | 0.1 | 0.696 |
| MD500 | <0.0001 | 0.887 | <0.001 | 0.790 | <0.01 | 0.714 |
Publisher’s Note: MDPI stays neutral with regard to jurisdictional claims in published maps and institutional affiliations. |
© 2021 by the authors. Licensee MDPI, Basel, Switzerland. This article is an open access article distributed under the terms and conditions of the Creative Commons Attribution (CC BY) license (https://creativecommons.org/licenses/by/4.0/).
Share and Cite
Nuessle, N.C.; Behling, F.; Tabatabai, G.; Castaneda Vega, S.; Schittenhelm, J.; Ernemann, U.; Klose, U.; Hempel, J.-M. ADC-Based Stratification of Molecular Glioma Subtypes Using High b-Value Diffusion-Weighted Imaging. J. Clin. Med. 2021, 10, 3451. https://doi.org/10.3390/jcm10163451
Nuessle NC, Behling F, Tabatabai G, Castaneda Vega S, Schittenhelm J, Ernemann U, Klose U, Hempel J-M. ADC-Based Stratification of Molecular Glioma Subtypes Using High b-Value Diffusion-Weighted Imaging. Journal of Clinical Medicine. 2021; 10(16):3451. https://doi.org/10.3390/jcm10163451
Chicago/Turabian StyleNuessle, Nils C., Felix Behling, Ghazaleh Tabatabai, Salvador Castaneda Vega, Jens Schittenhelm, Ulrike Ernemann, Uwe Klose, and Johann-Martin Hempel. 2021. "ADC-Based Stratification of Molecular Glioma Subtypes Using High b-Value Diffusion-Weighted Imaging" Journal of Clinical Medicine 10, no. 16: 3451. https://doi.org/10.3390/jcm10163451
APA StyleNuessle, N. C., Behling, F., Tabatabai, G., Castaneda Vega, S., Schittenhelm, J., Ernemann, U., Klose, U., & Hempel, J.-M. (2021). ADC-Based Stratification of Molecular Glioma Subtypes Using High b-Value Diffusion-Weighted Imaging. Journal of Clinical Medicine, 10(16), 3451. https://doi.org/10.3390/jcm10163451