
Acute Stress-Induced Blood Lipid Reactivity in Hypertensive and Normotensive Men and Prospective Associations with Future Cardiovascular Risk


 , and
, and
Abstract
1. Introduction
2. Materials and Methods
2.1. Study Participants
2.2. Classification of Essential Hypertension and Normotension
2.3. Design and Procedure
2.3.1. First Study Day and Baseline CVD Risk Assessment
2.3.2. Second Study Day and Stress Reactivity Assessment
2.3.3. Assessment of CVD Risk at Follow-Up
2.4. Montreal Imaging Stress Task (MIST)
2.5. Biochemical Analyses
2.5.1. Blood Lipids
2.5.2. Cortisol
2.5.3. CVD Risk Assessment
2.6. Statistical Analyses
3. Results
3.1. Group Characteristics
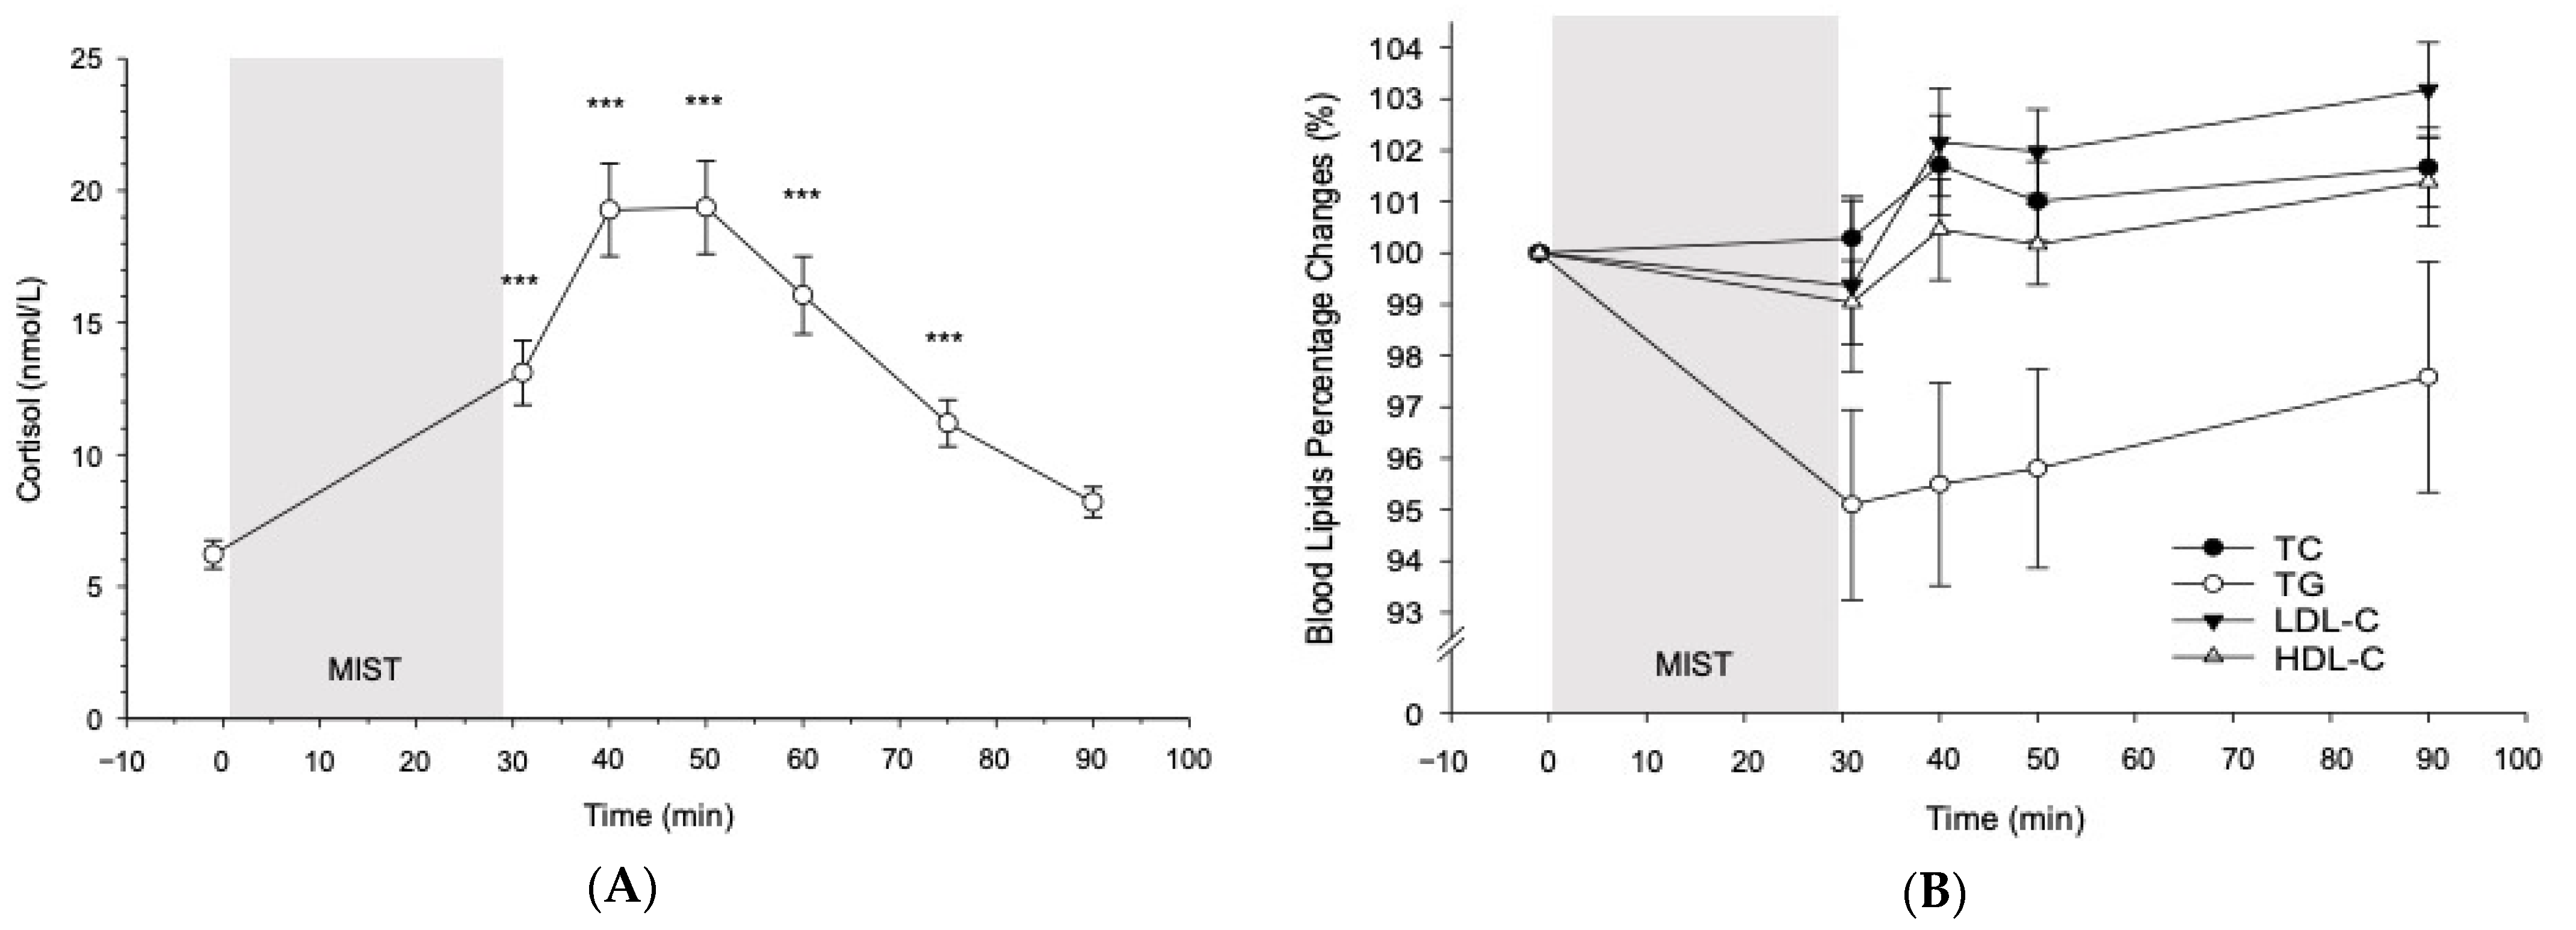
3.2. Cortisol and Blood Lipid Reactivity to the MIST in All Participants
3.2.1. Cortisol
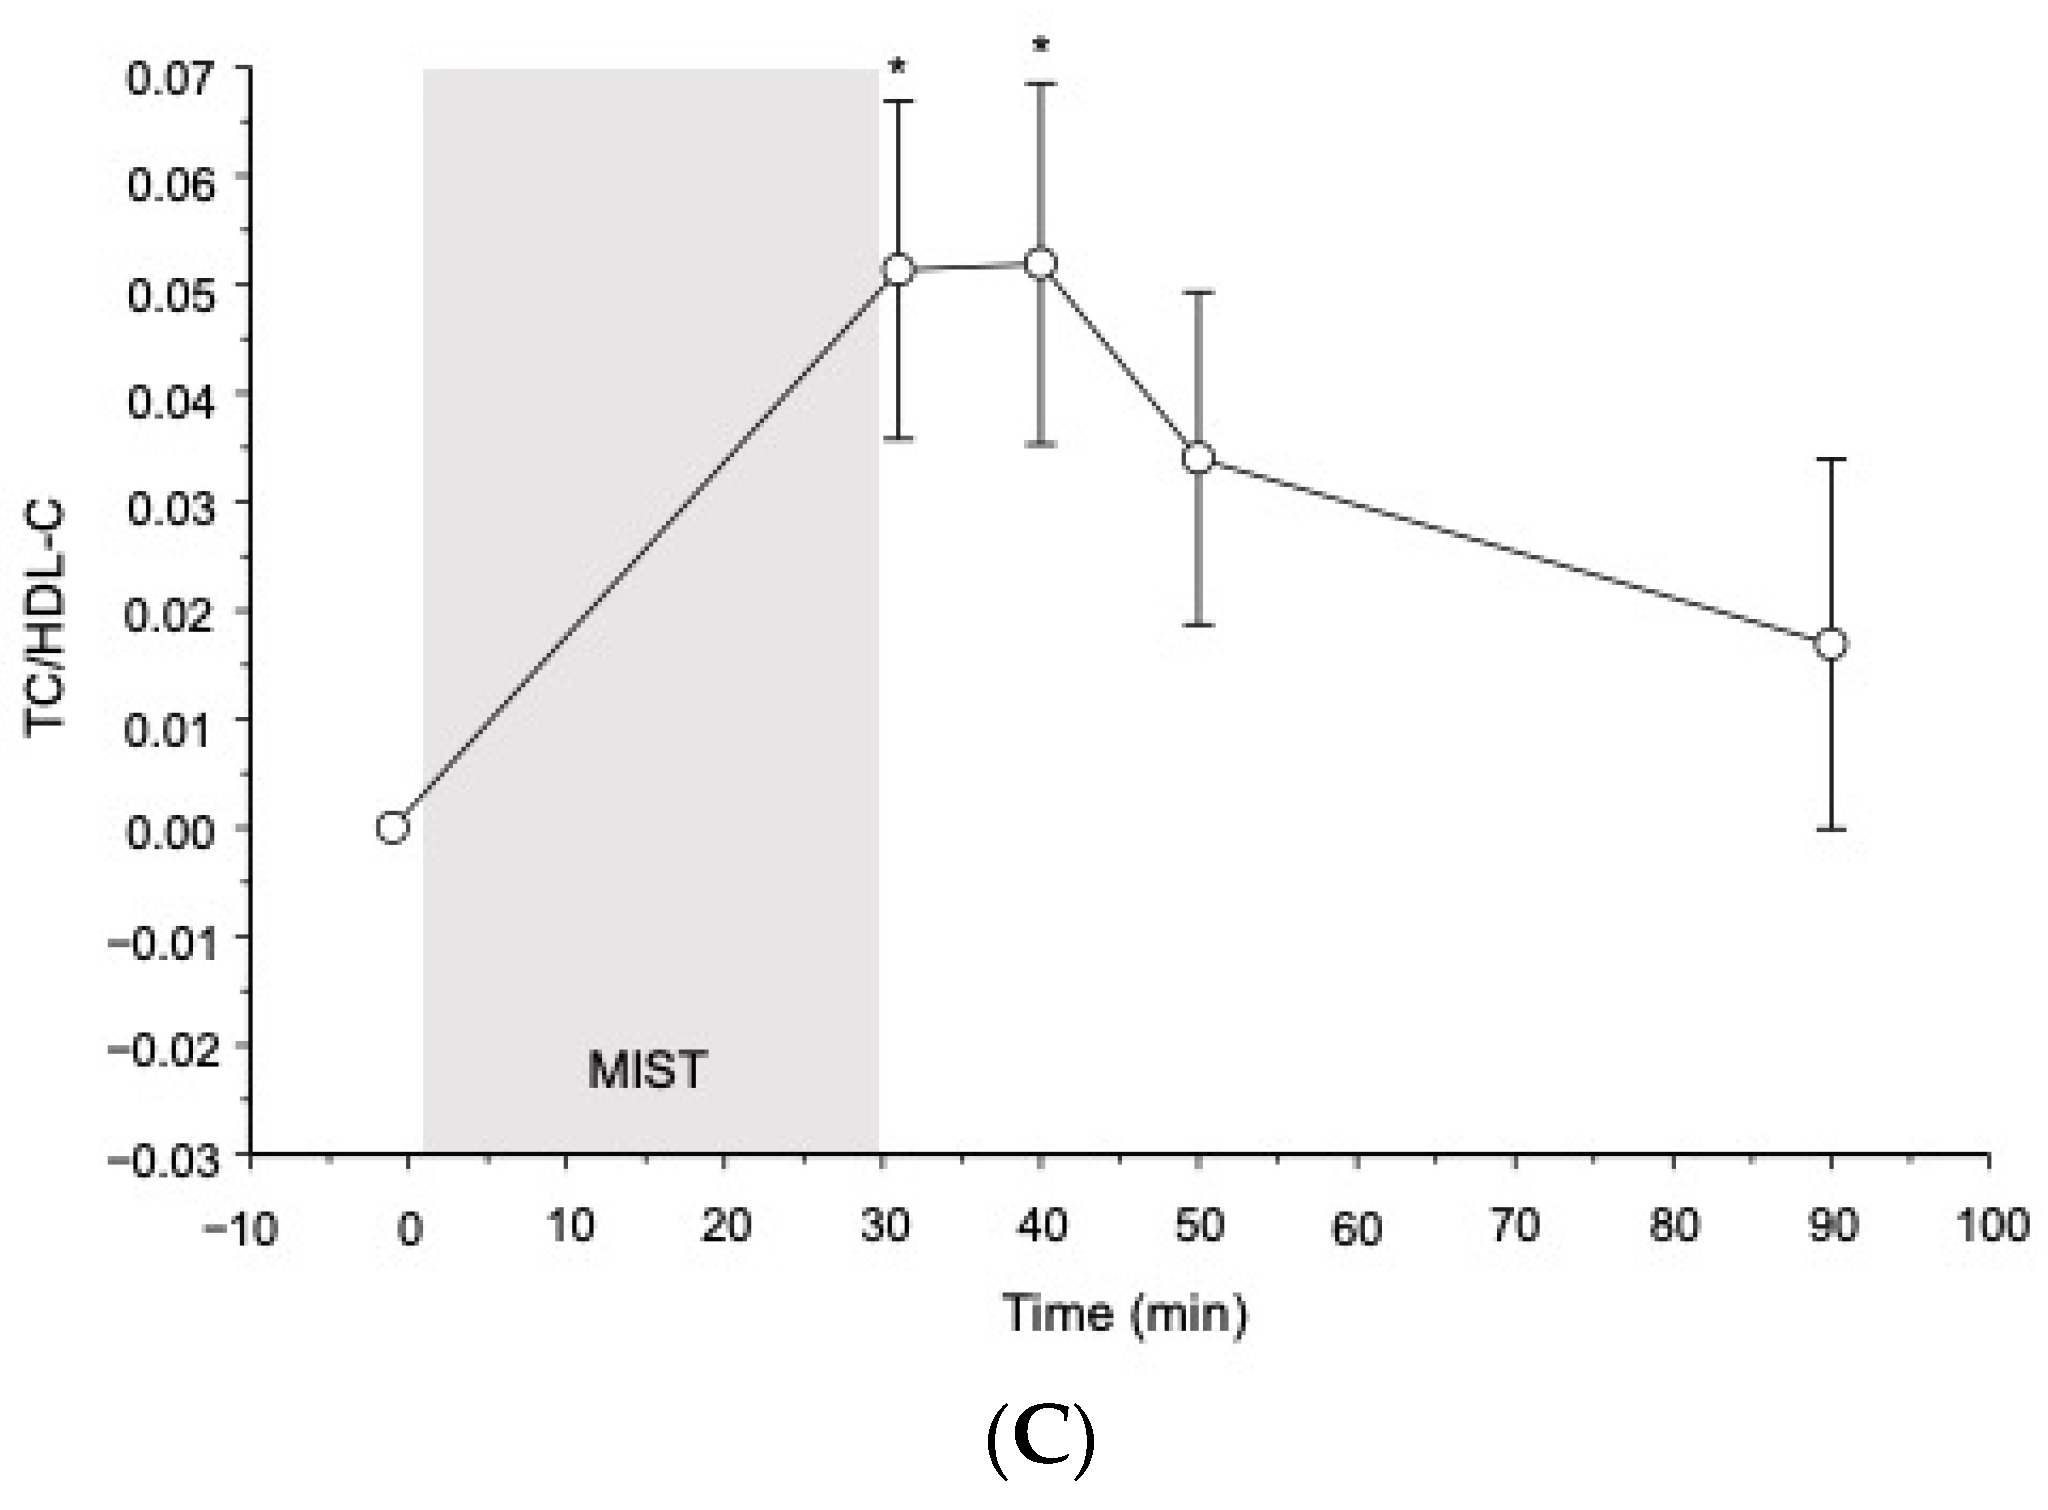
3.2.2. Blood Lipids
3.3. Reactivity to the MIST in Hypertensives as Compared to Normotensives
3.3.1. Baseline
3.3.2. Reactivity
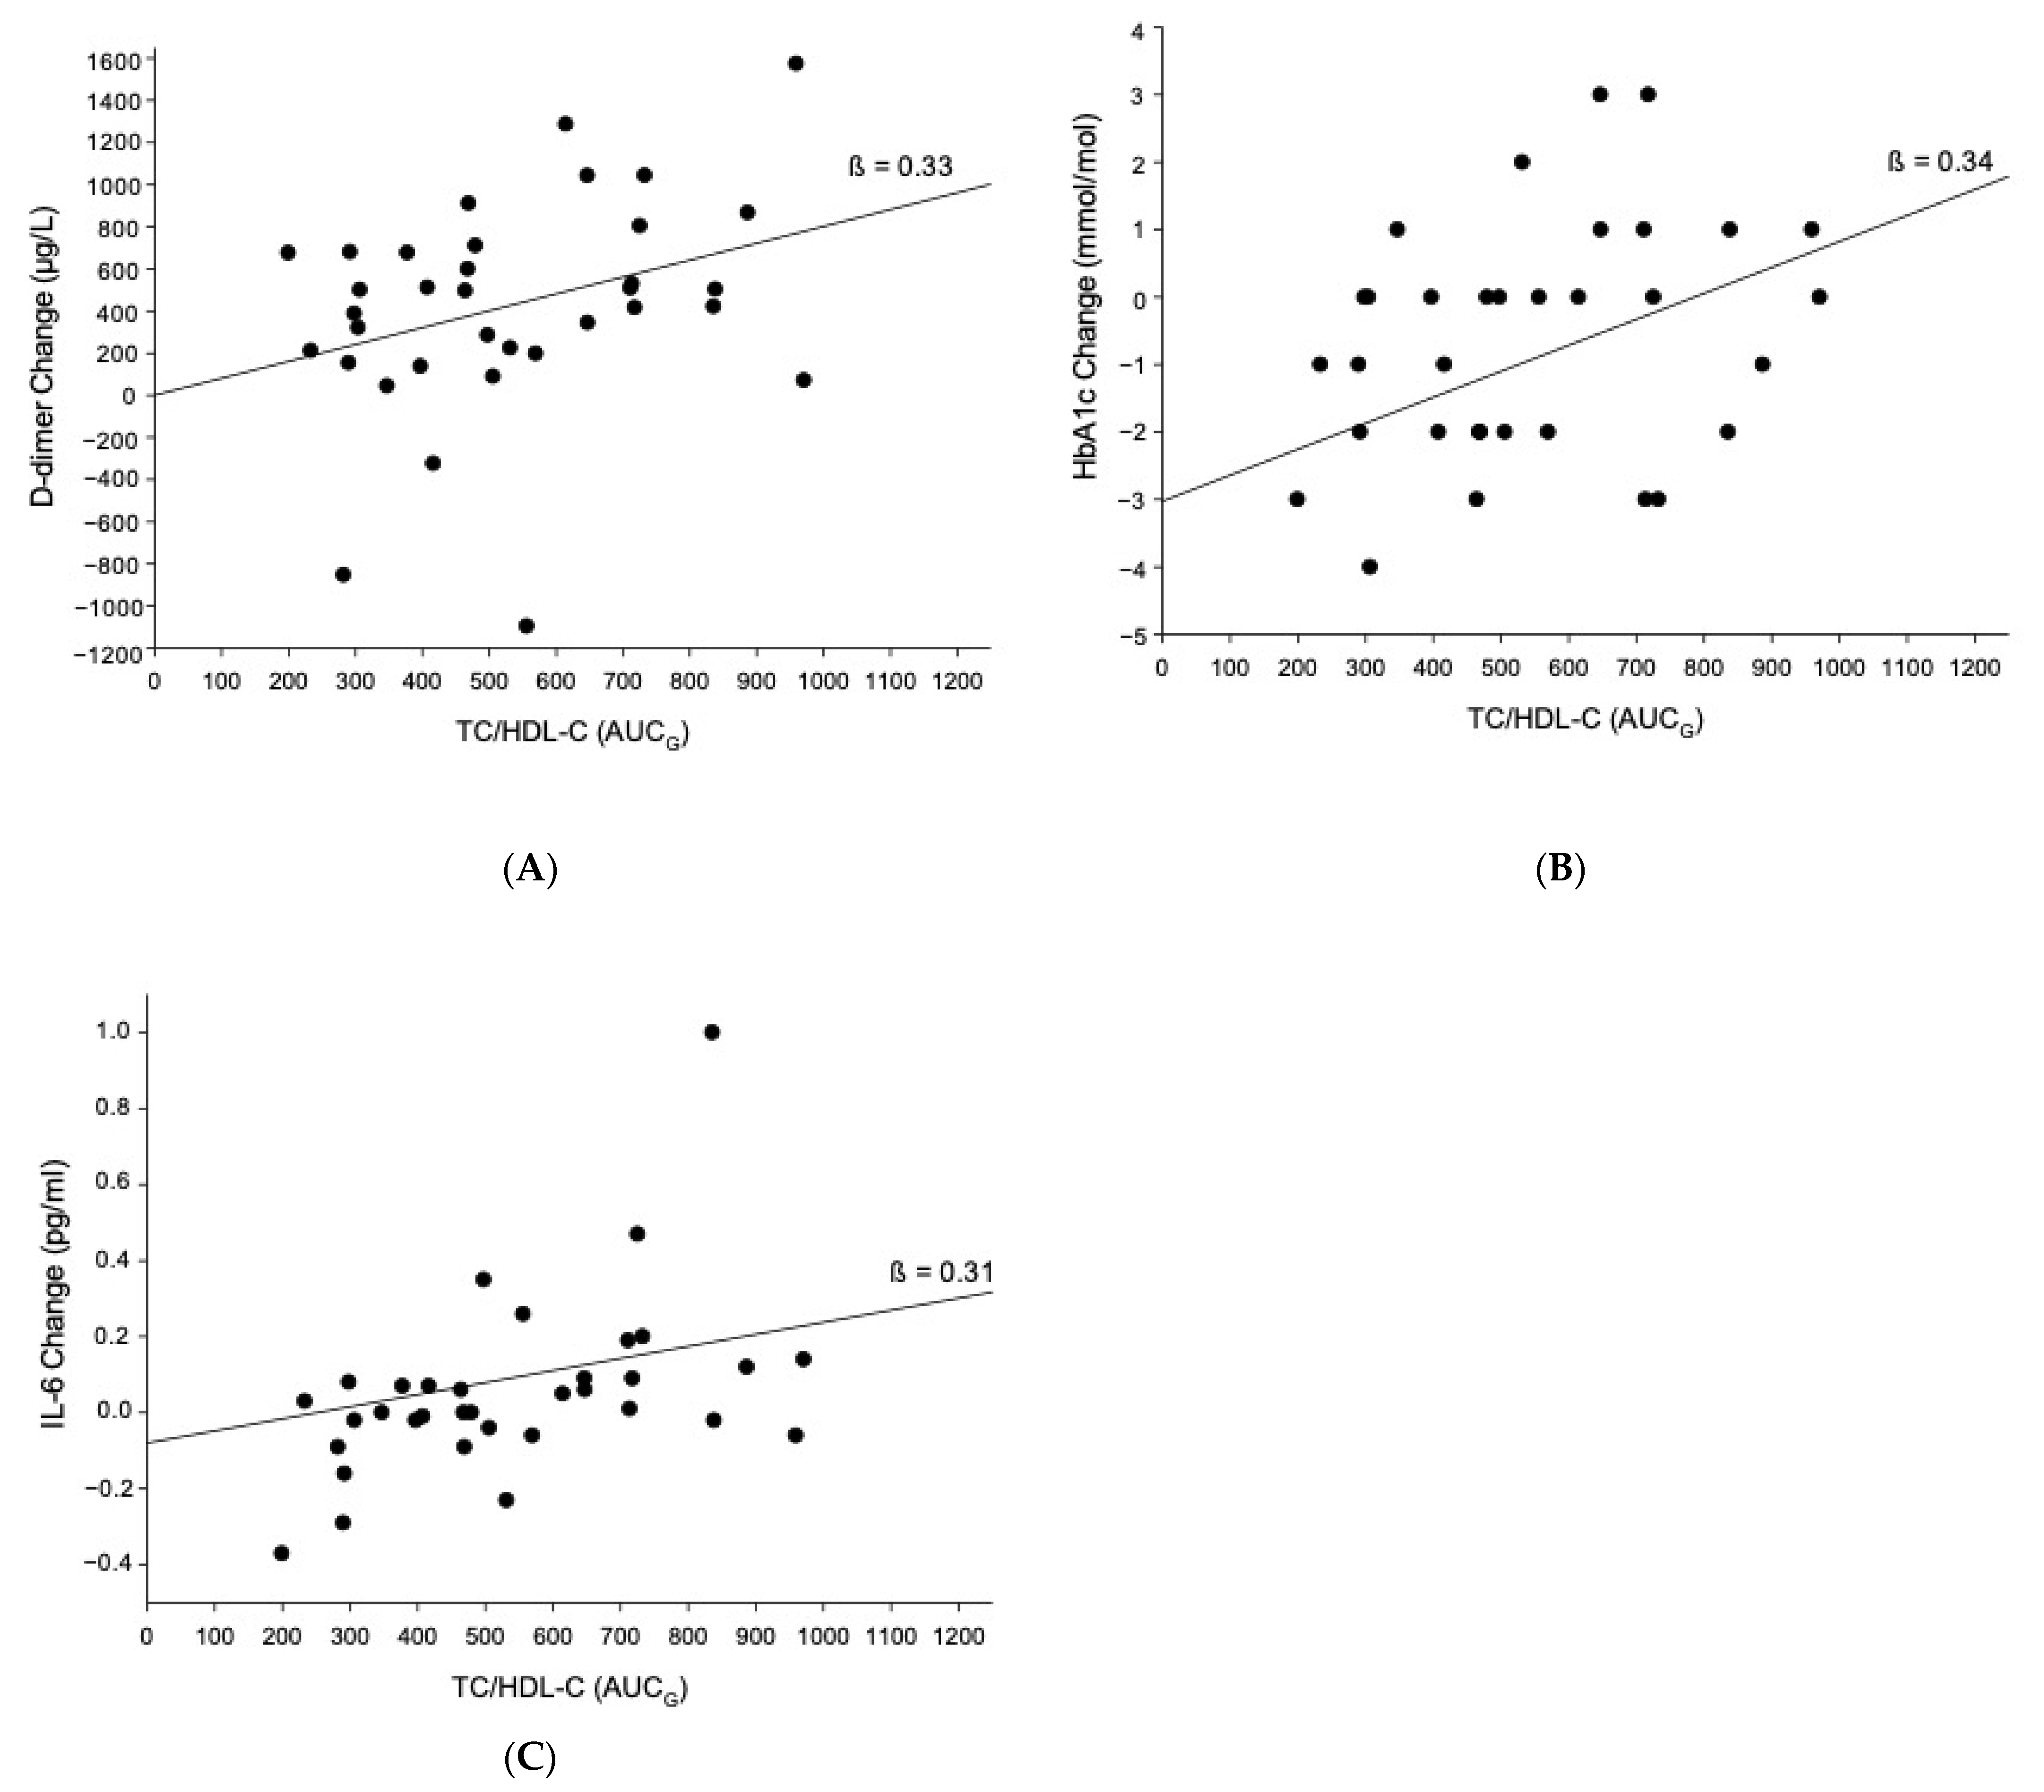
3.4. Prediction of CVD Risk Factors
4. Discussion
5. Conclusions
Author Contributions
Funding
Institutional Review Board Statement
Informed Consent Statement
Data Availability Statement
Acknowledgments
Conflicts of Interest
Appendix A

| Follow-Up (n = 35) | Drop-Out (n = 21) | p | |
|---|---|---|---|
| Age (years) | 50.20 ± 1.91 (28–74) | 49.10 ± 2.45 (25–69) | 0.72 |
| BMI (kg/m2) | 26.37 ± 0.62 (19.78–34.58) | 27.08 ± 0.73 (22.67–35.25) | 0.47 |
| Home BP (mmHg) | |||
| Home MAP | 96.17 ± 2.14 (75.06–121.50) | 97.34 ± 2.21 (82.39–110.94) | 0.66 |
| Home SBP | 131.04 ± 2.63 (105.17–162.33) | 135.03 ± 2.75 (115.17–154.50) | 0.29 |
| Home DBP | 78.77 ± 1.90 (60–103) | 78.68 ± 2.25 (62.83–91.17) | 0.98 |
| Study BP (mmHg) | |||
| Study MAP | 103.73 ± 2.58 (75.33–139.89) | 106.90 ± 2.57 (79.83–126.56) | 0.42 |
| Study SBP | 139.39 ± 3.18 (109.33–189.67) | 142.48 ± 3.44 (112.5–166.33) | 0.53 |
| Study DBP | 85.90 ± 2.37 (58.33–115) | 89.11 ± 2.32 (63.50–108.00) | 0.37 |
| TG (mmol/L) | 1.38 ± 0.11 (0.36–3.76) | 1.15 ± 0.07 (0.71–1.88) | 0.15 |
| TC (mmol/L) | 5.36 ± 0.16 (3.30–7.69) | 5.60 ± 0.27 (3.90–7.79) | 0.41 |
| LDL-C (mmol/L) | 3.61 ± 0.14 (1.73–5.69) | 3.82 ± 0.27 (2.09–6.53) | 0.45 |
| HDL-C (mmol/L) | 1.49 ± 0.06 (0.92–2.21) | 1.58 ± 0.09 (1.08–2.22) | 0.35 |
| LDL-C/HDL-C | 2.57 ± 0.14 (1.05–3.97) | 2.57 ± 0.23 (1.07–4.35) | 0.98 |
| TC/HDL-C | 3.78 ± 0.17 (2.01–5.49) | 3.72 ± 0.25 (2.03–5.77) | 0.79 |
| HbA1c (mmol/mol) | 36.26 ± 0.63 (28–43) | 35.79 ± 0.83 (26–40) | 0.67 |
| D-dimer (µg/L) | 416.43 ± 59.05 (45–1616) | 395.15 ± 52.52 (45–955) | 0.98 |
| IL-6 (pg/mL) | 0.47 ± 0.04 (0.15–1.25) | 0.55 ± 0.08 (0.21–1.85) | 0.37 |
| Hypertensives (n = 28) | Normotensives (n = 28) | p | |
|---|---|---|---|
| TC/HDL-C | |||
| −1 min | 4.14 ± 0.19 (2.46–6.29) | 3.54 ± 0.17 (2.13–5.65) | 0.023 * |
| +1 min | 4.24 ± 0.20 (2.45–6.28) | 3.54 ± 0.17 (2.15–5.51) | 0.009 ** |
| +10 min | 4.24 ± 0.20 (2.44–6.52) | 3.54 ± 0.17(2.16–5.62) | 0.010 * |
| +20 min | 4.22 ± 0.20 (2.43–6.26) | 3.53 ± 0.17 (2.17–5.53) | 0.010 * |
| +60 min | 4.20 ± 0.20 (2.42–6.14) | 3.51 ± 0.17 (2.12–5.58) | 0.011 * |
| TG (mmol/L) | |||
| −1 min | 1.66 ±0.14 (0.61–3.61) | 1.38 ± 0.11 (0.35–2.87) | 0.121 |
| +1 min | 1.61 ± 0.13 (0.62–3.44) | 1.24 ± 0.09 (0.37–2.21) | 0.022 * |
| +10 min | 1.60 ± 0.13 (0.67–3.44) | 1.24 ± 0.10 (0.39–2.30) | 0.027 * |
| +20 min | 1.63 ± 0.13 (0.68–3.22) | 1.23 ± 0.09 (0.39–2.30) | 0.014 * |
| +60 min | 1.65 ± 0.13 (0.71–3.41) | 1.24 ± 0.09 (0.39–2.29) | 0.013 * |
| TC (mmol/L) | |||
| −1 min | 4.97 ± 0.17 (3.16–6.53) | 4.63 ± 0.18 (2.69–7.01) | 0.18 |
| +1 min | 4.95 ± 0.18 (3.29–6.60) | 4.66 ± 0.18 (2.80–7.05) | 0.25 |
| +10 min | 4.99 ± 0.19 (3.20–7.13) | 4.76 ± 0.19 (2.87–7.21) | 0.39 |
| +20 min | 5.03 ± 0.19 (3.26–7.16) | 4.66 ± 0.18 (2.77–7.15) | 0.16 |
| +60 min | 5.03 ± 0.19 (3.20–6.93) | 4.73 ± 0.19 (2.79–7.41) | 0.26 |
| HDL (mmol/L) | |||
| −1 min | 1.25 ± 0.06 (0.87–1.93) | 1.35 ± 0.05 (0.86–1.83) | 0.20 |
| +1 min | 1.21 ± 0.05 (0.80–1.96) | 1.35 ± 0.05 (0.83–1.82) | 0.06 |
| +10 min | 1.23 ± 0.07 (0.67–2.02) | 1.38 ± 0.05 (0.86–1.78) | 0.09 |
| +20 min | 1.24 ± 0.06 (0.87–1.97) | 1.36 ± 0.05(0.83–1.79) | 0.14 |
| +60 min | 1.24 ± 0.06 (0.86–2.01) | 1.38 ± 0.05 (0.86–1.88) | 0.08 |
| LDL (mmol/L) | |||
| −1 min | 3.31 ± 0.15 (1.63–4.51) | 2.95 ± 0.16 (1.36–5.37) | 0.11 |
| +1 min | 3.30 ± 0.16 (1.71–4.61) | 2.92 ± 0.18 (0.57–5.48) | 0.13 |
| +10 min | 3.31 ± 0.16 (1.67–5.00) | 3.06 ± 0.17 (1.43–5.59) | 0.27 |
| +20 min | 3.36 ± 0.16 (1.73–4.99) | 3.00 ± 0.16 (1.39–5.58) | 0.13 |
| +60 min | 3.38 ± 0.16 (1.72–5.04) | 3.06 ± 0.17 (1.42–5.64) | 0.18 |
References
- Naghavi, M.; Abajobir, A.A.; Abbafati, C.; Abbas, K.M.; Abd-Allah, F.; Abera, S.F.; Aboyans, V.; Adetokunboh, O.; Afshin, A.; Agrawal, A.; et al. Global, regional, and national age-sex specific mortality for 264 causes of death, 1980–2016: A systematic analysis for the Global Burden of Disease Study 2016. Lancet 2017, 390, 1151–1210. [Google Scholar] [CrossRef]
- Whelton, P.K.; Carey, R.M.; Aronow, W.S.; Casey, D.E.; Collins, K.J.; Himmelfarb, C.D.; DePalma, S.M.; Gidding, S.; Jamerson, K.A.; Jones, D.W.; et al. 2017 ACC/AHA/AAPA/ABC/ACPM/AGS/APhA/ASH/ASPC/NMA/PCNA Guideline for the Prevention, Detection, Evaluation, and Management of High Blood Pressure in Adults. J. Am. Coll. Cardiol. 2018, 71, e127–e248. [Google Scholar] [CrossRef] [PubMed]
- Carretero, O.A.; Oparil, S. Essential hypertension. Part I: Definition and etiology. Circulation 2000, 101, 329–335. [Google Scholar] [CrossRef]
- Messerli, F.H.; Williams, B.; Ritz, E. Essential hypertension. Lancet 2007, 370, 591–603. [Google Scholar] [CrossRef]
- Choudhury, K.N.; Mainuddin, A.K.M.; Wahiduzzaman, M.; Islam, S.M.S. Serum lipid profile and its association with hypertension in Bangladesh. Vasc. Health Risk Manag. 2014, 10, 327–332. [Google Scholar] [CrossRef] [PubMed]
- Dalal, J.; Padmanabhan, T.N.C.; Jain, P.; Patil, S.; Vasnawala, H.; Gulati, A. LIPITENSION: Interplay between dyslipidemia and hypertension. Indian J. Endocrinol. Metab. 2012, 16, 240–245. [Google Scholar] [CrossRef]
- Gebrie, A.; Gnanasekaran, N.; Menon, M.; Sisay, M.; Zegeye, A. Evaluation of lipid profiles and hematological parameters in hypertensive patients: Laboratory-based cross-sectional study. SAGE Open Med. 2018, 6, 1–11. [Google Scholar] [CrossRef]
- Reiner, Z.; Catapano, A.L.; De Backer, G.; Graham, I.; Taskinen, M.R.; Wiklund, O.; Agewall, S.; Alegria, E.; Chapman, M.J.; Durrington, P.; et al. ESC/EAS Guidelines for the management of dyslipidaemias: The Task Force for the management of dyslipidaemias of the European Society of Cardiology (ESC) and the European Atherosclerosis Society (EAS). Eur. Heart J. 2011, 32, 1769–1818. [Google Scholar] [CrossRef]
- Sarwar, M.S.; Adnan, T.; Hossain, M.D.; Uddin, S.M.; Hossain, M.S.; Al Baker, S.M.; Uddin, M.N.; Islam, M.S. Evaluation of serum lipid profile in patients with hypertension living in a coastal region of Bangladesh. Drug Res. 2014, 64, 353–357. [Google Scholar] [CrossRef]
- Lemieux, I.; Lamarche, B.; Couillard, C.; Pascot, A.; Cantin, B.; Bergeron, J.; Dagenais, G.R.; Després, J.P. Total cholesterol/HDL cholesterol ratio vs. LDL cholesterol/HDL cholesterol ratio as indices of ischemic heart disease risk in men: The Quebec Cardiovascular Study. Arch. Intern. Med. 2001, 161, 2685–2692. [Google Scholar] [CrossRef]
- Calling, S.; Johansson, S.-E.; Wolff, M.; Sundquist, J.; Sundquist, K. Total cholesterol/HDL-C ratio versus non-HDL-C as predictors for ischemic heart disease: A 17-year follow-up study of women in southern Sweden. BMC Cardiovasc. Disord. 2021, 21, 163. [Google Scholar] [CrossRef] [PubMed]
- Kivimäki, M.; Nyberg, S.T.; Batty, G.D.; Fransson, E.I.; Heikkilä, K.; Alfredsson, L.; Bjorner, J.B.; Borritz, M.; Burr, H.; Casini, A.; et al. Job strain as a risk factor for coronary heart disease: A collaborative meta-analysis of individual participant data. Lancet 2012, 380, 1491–1497. [Google Scholar] [CrossRef]
- Linden, W.; Gerin, W.; Davidson, K. Cardiovascular reactivity: Status quo and a research agenda for the new millennium. Psychosom. Med. 2003, 65, 5–8. [Google Scholar] [CrossRef]
- Grant, N.; Hamer, M.; Steptoe, A. Social Isolation and Stress-related Cardiovascular, Lipid, and Cortisol Responses. Ann. Behav. Med. 2009, 37, 29–37. [Google Scholar] [CrossRef]
- Stoney, C.M.; Bausserman, L.; Niaura, R.; Marcus, B.; Flynn, M. Lipid reactivity to stress: II. Biological and behavioral influences. Health Psychol 1999, 18, 251–261. [Google Scholar] [CrossRef]
- Stoney, C.M.; Finney, M.L. Social support and stress: Influences on lipid reactivity. J. Behav. Med. 2000, 7, 111–126. [Google Scholar] [CrossRef]
- Wirtz, P.H.; Ehlert, U.; Bärtschi, C.; Redwine, L.S.; von Känel, R. Changes in plasma lipids with psychosocial stress are related to hypertension status and the norepinephrine stress response. Metabolism 2009, 58, 30–37. [Google Scholar] [CrossRef][Green Version]
- Bachen, E.A.; Muldoon, M.F.; Matthews, K.A.; Manuck, S.B. Effects of Hemoconcentration and Sympathetic Activation on Serum Lipid Responses to Brief Mental Stress. Psychosom. Med. 2002, 64, 587–594. [Google Scholar] [CrossRef]
- Radjaipour, M.; Einsiedler, K.; Brehme, U.; Braun, D.; Braun, M.; Haselberger, F.; Hagenmeyer, L.; Berner, O.; Schmahl, F.W. Cardiovascular, hormone, and lipid responses to stress induced by virtual crane handling. Int. J. Occup. Med. Environ. Health 2005, 18, 357–365. [Google Scholar]
- Allen, M.T.; Patterson, S.M. Hemoconcentration and stress: A review of physiological mechanisms and relevance for cardiovascular disease risk. Biol. Psychol. 1995, 41, 1–27. [Google Scholar] [CrossRef]
- Dickerson, S.S.; Kemeny, M.E. Acute stressors and cortisol responses: A theoretical integration and synthesis of laboratory research. Psychol. Bull. 2004, 130, 355–391. [Google Scholar] [CrossRef]
- Dedovic, K.; Renwick, R.; Mahani, N.K.; Engert, V.; Lupien, S.J.; Pruessner, J.C. The Montreal Imaging Stress Task: Using functional imaging to investigate the effects of perceiving and processing psychosocial stress in the human brain. J. Psychiatry Neurosci. 2005, 30, 319–325. [Google Scholar] [PubMed]
- Winzeler, K.; Voellmin, A.; Hug, E.; Kirmse, U.; Helmig, S.; Princip, M.; Cajochen, C.; Bader, K.; Wilhelm, F.H. Adverse childhood experiences and autonomic regulation in response to acute stress: The role of the sympathetic and parasympathetic nervous systems. Anxiety Stress Coping. 2017, 30, 145–154. [Google Scholar] [CrossRef]
- Steptoe, A.; Brydon, L. Associations between acute lipid stress responses and fasting lipid levels 3 years later. Health Psychol. 2005, 24, 601–607. [Google Scholar] [CrossRef] [PubMed]
- Ridker, P.M.; Rifai, N.; Stampfer, M.J.; Hennekens, C.H. Plasma Concentration of Interleukin-6 and the Risk of Future Myocardial Infarction Among Apparently Healthy Men. Circulation 2000, 101, 1767–1772. [Google Scholar] [CrossRef] [PubMed]
- Willeit, P.; Thompson, A.; Aspelund, T.; Rumley, A.; Eiriksdottir, G.; Lowe, G.; Gudnason, V.; Di Angelantonio, E. Hemostatic Factors and Risk of Coronary Heart Disease in General Populations: New Prospective Study and Updated Meta-Analyses. PLoS ONE 2013, 8, e55175. [Google Scholar] [CrossRef]
- Selvin, E.; Steffes, M.W.; Zhu, H.; Matsushita, K.; Wagenknecht, L.; Pankow, J.; Coresh, J.; Brancati, F.L. Glycated Hemoglobin, Diabetes, and Cardiovascular Risk in Nondiabetic Adults. N. Engl. J. Med. 2010, 362, 800–811. [Google Scholar] [CrossRef]
- Zuccarella-Hackl, C.; von Känel, R.; Thomas, L.; Hauser, M.; Kuebler, U.; Widmer, H.R.; Wirtz, P.H. Macrophage Superoxide Anion Production in Essential Hypertension: Associations with Biological and Psychological Cardiovascular Risk Factors. Psychosom. Med. 2016, 78, 750–757. [Google Scholar] [CrossRef]
- Zuccarella-Hackl, C.; von Känel, R.; Thomas, L.; Kuebler, P.; Schmid, J.-P.; Mattle, H.P.; Mono, M.-L.; Rieben, R.; Wiest, R.; Wirtz, P.H. Higher macrophage superoxide anion production in coronary artery disease (CAD) patients with Type D personality. Psychoneuroendocrinology 2016, 68, 186–193. [Google Scholar] [CrossRef]
- Williams, B.; Mancia, G.; Spiering, W.; Agabiti Rosei, E.; Azizi, M.; Burnier, M.; Clement, D.L.; Coca, A.; de Simone, G.; Dominiczak, A.; et al. 2018 ESC/ESH Guidelines for the management of arterial hypertension. Eur. Heart J. 2018, 39, 3021–3104. [Google Scholar] [CrossRef]
- Chalmers, J.; MacMahon, S.; Mancia, G.; Whitworth, J.; Beilin, L.; Hansson, L.; Neal, B.; Rodgers, A.; Ni Mhurchu, C.; Clark, T. 1999 World Health Organization-International Society of Hypertension Guidelines for the management of hypertension. Guidelines sub-committee of the World Health Organization. Clin. Exp. Hypertens. 1999, 21, 1009–1060. [Google Scholar] [CrossRef]
- Pruessner, J.; Hellhammer, D.; Kirschbaum, C. Low self-esteem, induced failure and the adrenocortical stress response. Pers. Individ. Differ. 1999, 27, 477–489. [Google Scholar] [CrossRef]
- Kuebler, U.; Trachsel, M.; von Känel, R.; Abbruzzese, E.; Ehlert, U.; Wirtz, P.H. Attributional styles and stress-related atherogenic plasma lipid reactivity in essential hypertension. J. Psychosom. Res. 2014, 77, 51–56. [Google Scholar] [CrossRef] [PubMed][Green Version]
- Austin, A.W.; Wirtz, P.H.; Patterson, S.M.; Stutz, M.; von Känel, R. Stress-induced alterations in coagulation: Assessment of a new hemoconcentration correction technique. Psychosom. Med. 2012, 74, 288–295. [Google Scholar] [CrossRef] [PubMed]
- Dill, D.B.; Costill, D.L. Calculation of percentage changes in volumes of blood, plasma, and red cells in dehydration. J. Appl. Physiol. 1974, 37, 247–248. [Google Scholar] [CrossRef] [PubMed]
- Pruessner, J.C.; Kirschbaum, C.; Meinlschmid, G.; Hellhammer, D.H. Two formulas for computation of the area under the curve represent measures of total hormone concentration versus time-dependent change. Psychoneuroendocrinology 2003, 28, 916–931. [Google Scholar] [CrossRef]
- Cohen, J. Statistical Power Analysis for the Behavioral Sciences; L. Erlbaum Associates: Hillsdale, NJ, USA, 1988. [Google Scholar]
- Hitze, B.; Hubold, C.; van Dyken, R.; Schlichting, K.; Lehnert, H.; Entringer, S.; Peters, A. How the selfish brain organizes its supply and demand. Front. Neuroenergetics 2010, 2, 7. [Google Scholar] [CrossRef]
- Arner, P. Human fat cell lipolysis: Biochemistry, regulation and clinical role. Best Pract. Res. Clin. Endocrinol. Metab. 2005, 19, 471–482. [Google Scholar] [CrossRef] [PubMed]
- Wirtz, P.H.; von Känel, R.; Mohiyeddini, C.; Emini, L.; Ruedisueli, K.; Groessbauer, S.; Ehlert, U. Low Social Support and Poor Emotional Regulation Are Associated with Increased Stress Hormone Reactivity to Mental Stress in Systemic Hypertension. J. Clin. Endocrinol. Metab. 2006, 91, 3857–3865. [Google Scholar] [CrossRef][Green Version]
- Ross, R. Atherosclerosis—An inflammatory disease. N. Engl. J. Med. 1999, 340, 115–126. [Google Scholar] [CrossRef]
- Libby, P. The changing landscape of atherosclerosis. Nature 2021, 592, 524–533. [Google Scholar] [CrossRef] [PubMed]
- Tyrrell, D.J.; Goldstein, D.R. Ageing and atherosclerosis: Vascular intrinsic and extrinsic factors and potential role of IL-6. Nat. Rev. Cardiol. 2021, 18, 58–68. [Google Scholar] [CrossRef] [PubMed]
- McEwen, B.S. Stress, adaptation, and disease. Allostasis and allostatic load. Ann. N. Y. Acad. Sci. 1998, 840, 33–44. [Google Scholar] [CrossRef] [PubMed]
- Farmer, J.A. Diabetic dyslipidemia and atherosclerosis: Evidence from clinical trials. Curr. Diab. Rep. 2008, 8, 71–77. [Google Scholar] [CrossRef] [PubMed]
- Babyak, M.A. What You See May Not Be What You Get: A Brief, Nontechnical Introduction to Overfitting in Regression-Type Models. Psychosom. Med. 2004, 66, 411–421. [Google Scholar] [CrossRef]


| Hypertensives (n = 28) | Normotensives (n = 28) | p | |
|---|---|---|---|
| Age (years) | 49.82 ± 2.04 (25–74) | 49.75 ± 2.22 (28–74) | 0.98 |
| BMI (kg/m2) | 28.29 ± 0.64 (22.67–35.25) | 24.99 ± 0.55 (19.78–30.85) | <0.001 *** |
| Home BP (mmHg) | |||
| Home MAP | 106.85 ± 1.17 (95.61–121.50), n = 26 | 87.21 ± 0.92 (75.06–94.72) | <0.001 *** |
| Home SBP | 144.83 ± 1.82 (125.67–162.33), n = 26 | 121.08 ± 1.19 (105.17–130.50) | <0.001 *** |
| Home DBP | 87.85 ± 1.28 (78.33–103.00), n = 26 | 70.27 ± 1.011 (60.00–79.33) | <0.001 *** |
| Study BP (mmHg) | |||
| Study MAP | 115.96 ± 1.84 (103.50–139.89) | 93.88 ± 1.41 (75.33–104.56) | <0.001 *** |
| Study SBP | 153.70 ± 2.65 (129.33–189.67) | 127.39 ± 1.67 (109.33–139.67) | <0.001 *** |
| Study DBP | 97.08 ± 1.58 (84.67–115.00) | 77.13 ± 1.46 (58.33–87.67) | <0.001 *** |
| TG (mmol/L) | 1.52 ± 0.12 (0.77–3.76), n = 27 | 1.10 ± 0.09 (0.36–2.35), n = 27 | 0.007 ** |
| TC (mmol/L) | 5.67 ± 0.16 (4.11–7.18), n = 27 | 5.22 ± 0.23 (3.30–7.79), n = 27 | 0.12 |
| LDL-C(mmol/L) | 3.91 ± 0.16 (2.33–5.19), n = 27 | 3.48 ± 0.22 (1.73–6.53), n = 27 | 0.11 |
| HDL-C (mmol/L) | 1.43 ± 0.07 (0.93–2.22), n = 27 | 1.59 ± 0.06 (0.92–2.21), n = 27 | 0.11 |
| LDL-C/HDL-C | 2.88 ± 0.16 (1.32–4.32), n = 27 | 2.26 ± 0.16 (1.05–4.35), n = 27 | 0.010 * |
| TC/HDL-C | 4.14 ± 0.19. (2.38–5.77), n = 27 | 3.41 ± 0.19 (2.01–5.49), n = 27 | 0.009 ** |
| HbA1c (mmol/mol) | 35.59 ± 0.82 (26–43), n = 27 | 36.59 ± 0.57 (31–42), n = 27 | 0.28 |
| D-dimer (µg/L) | 375.37 ± 40.73 (45–955), n = 27 | 440.82 ± 72.56 (45–1616) | 0.77 |
| IL-6 (pg/mL) | 0.63 ± 0.07 (0.16–1.85), n = 27 | 0.37 ± 0.03 (0.15–0.76) | <0.001 *** |
| Time between baseline and follow-up assessments (months) | 40.75 ± 2.14 (28–61) | 39.33 ± 1.81 (28–63) | 0.62 |
| Creatinine (μmol/L) | 80.48 ± 1.63 (66–93), n = 27 | ||
| Sodium (mmol/L) | 140.39 ± 0.50 (135–145), n = 23 | ||
| Calcium (mmol/L) | 2.40 ± 0.02 (2.17–2.58), n = 23 | ||
| Potassium (mmol/L) | 4.11 ± 0.04 (3.9–4.7), n = 23 |
| Hypertensives (n = 28) | Normotensives (n = 28) | p | |
|---|---|---|---|
| Cortisol (nmol/L) | 7.22 ± 0.92 (1.83–17.85) | 5.21 ± 0.50 (1.61–12.50) | 0.16 |
| HDL-C (mmol/L) | 1.25 ± 0.06 (0.87–1.93) | 1.35 ± 0.05 (0.86–1.83) | 0.20 |
| LDL-C (mmol/L) | 3.31 ± 0.15 (1.63–4.51) | 2.95 ± 0.16 (1.36–5.37) | 0.11 |
| TG (mmol/L) | 1.66 ± 0.14 (0.61–3.61) | 1.38 ± 0.11 (0.35–2.87) | 0.12 |
| TC/HDL-C | 4.14 ± 0.19 (2.46–6.29) | 3.54 ± 0.17 (2.13–5.65) | 0.023 * |
Publisher’s Note: MDPI stays neutral with regard to jurisdictional claims in published maps and institutional affiliations. |
© 2021 by the authors. Licensee MDPI, Basel, Switzerland. This article is an open access article distributed under the terms and conditions of the Creative Commons Attribution (CC BY) license (https://creativecommons.org/licenses/by/4.0/).
Share and Cite
Degroote, C.; von Känel, R.; Thomas, L.; Zuccarella-Hackl, C.; Pruessner, J.C.; Wiest, R.; Wirtz, P.H. Acute Stress-Induced Blood Lipid Reactivity in Hypertensive and Normotensive Men and Prospective Associations with Future Cardiovascular Risk. J. Clin. Med. 2021, 10, 3400. https://doi.org/10.3390/jcm10153400
Degroote C, von Känel R, Thomas L, Zuccarella-Hackl C, Pruessner JC, Wiest R, Wirtz PH. Acute Stress-Induced Blood Lipid Reactivity in Hypertensive and Normotensive Men and Prospective Associations with Future Cardiovascular Risk. Journal of Clinical Medicine. 2021; 10(15):3400. https://doi.org/10.3390/jcm10153400
Chicago/Turabian StyleDegroote, Cathy, Roland von Känel, Livia Thomas, Claudia Zuccarella-Hackl, Jens C. Pruessner, Roland Wiest, and Petra H. Wirtz. 2021. "Acute Stress-Induced Blood Lipid Reactivity in Hypertensive and Normotensive Men and Prospective Associations with Future Cardiovascular Risk" Journal of Clinical Medicine 10, no. 15: 3400. https://doi.org/10.3390/jcm10153400
APA StyleDegroote, C., von Känel, R., Thomas, L., Zuccarella-Hackl, C., Pruessner, J. C., Wiest, R., & Wirtz, P. H. (2021). Acute Stress-Induced Blood Lipid Reactivity in Hypertensive and Normotensive Men and Prospective Associations with Future Cardiovascular Risk. Journal of Clinical Medicine, 10(15), 3400. https://doi.org/10.3390/jcm10153400