
The Relationship between Gestational Diabetes Metabolic Control and Fetal Autonomic Regulation, Movement and Birth Weight

 , , ,
, , ,
Abstract
:1. Introduction
2. Materials and Methods
3. Results
4. Discussion
5. Conclusions
Author Contributions
Funding
Institutional Review Board Statement
Informed Consent Statement
Data Availability Statement
Acknowledgments
Conflicts of Interest
References
- Schäfer-Graf, U.M.; Gembruch, U.; Kainer, F.; Groten, T.; Hummel, S.; Hösli, I.; Grieshop, M.; Kaltheuner, M.; Bührer, C.; Kautzky-Willer, A.; et al. Gestational Diabetes Mellitus (GDM)-Diagnosis, Treatment and Follow-Up. Guideline of the DDG and DGGG (S3 Level, AWMF Registry Number 057/008, February 2018). Geburtshilfe Frauenheilkd. 2018, 78, 1219–1231. [Google Scholar] [CrossRef] [Green Version]
- Simmons, R. Perinatal programming of obesity. Exp. Gerontol. 2005, 40, 863–866. [Google Scholar] [CrossRef] [Green Version]
- Fadl, H.E.; Ostlund, I.K.; Magnuson, A.F.; Hanson, U.S. Maternal and neonatal outcomes and time trends of gestational diabetes mellitus in Sweden from 1991 to 2003. Diabet Med. 2010, 27, 436–441. [Google Scholar] [CrossRef]
- Belbasis, L.; Savvidou, M.D.; Kanu, C.; Evangelou, E.; Tzoulaki, I. Birth weight in relation to health and disease in later life: An umbrella review of systematic reviews and meta-analyses. BMC Med. 2016, 14, 147. [Google Scholar] [CrossRef] [Green Version]
- Zisser, H.; Jovanovic, L.; Thorsell, A.; Kupperman, A.; Taylor, L.J.; Ospina, P.; Hod, M. The fidgety fetus hypothesis: Fetal activity is an additional variable in determining birth weight of offspring of women with diabetes. Diabetes Care 2006, 29, 63–67. [Google Scholar] [CrossRef]
- Fehlert, E.; Willmann, K.; Fritsche, L.; Linder, K.; Mat-Husin, H.; Schleger, F.; Weiss, M.; Kiefer-Schmidt, I.; Brucker, S.; Häring, H.U.; et al. Gestational diabetes alters the fetal heart rate variability during an oral glucose tolerance test: A fetal magnetocardiography study. BJOG 2017, 124, 1891–1898. [Google Scholar] [CrossRef] [Green Version]
- Brändle, J.; Preissl, H.; Draganova, R.; Ortiz, E.; Kagan, K.O.; Abele, H.; Brucker, S.Y.; Kiefer-Schmidt, I. Heart rate variability parameters and fetal movement complement fetal behavioral states detection via magnetography to monitor neurovegetative development. Front. Hum. Neurosci. 2015, 9, 147. [Google Scholar] [CrossRef] [Green Version]
- Schneider, U.; Schleussner, E.; Fiedler, A.; Jaekel, S.; Liehr, M.; Haueisen, J.; Hoyer, D. Fetal heart rate variability reveals differential dynamics in the intrauterine development of the sympathetic and parasympathetic branches of the autonomic nervous system. Physiol. Meas. 2009, 30, 215–226. [Google Scholar] [CrossRef]
- Nijhuis, J.G.; Prechtl, H.F.R.; Martin, C.B., Jr.; Bots, R.S.G.M. Are there behavioural states in the human fetus? Early Hum. Dev. 1982, 6, 177–195. [Google Scholar] [CrossRef]
- Lange, S.; Van Leeuwen, P.; Schneider, U.; Frank, B.; Hoyer, D.; Geue, D.; Grönemeyer, D. Heart rate features in fetal behavioural states. Early Hum. Dev. 2009, 85, 131–135. [Google Scholar] [CrossRef]
- Schneider, U.; Bode, F.; Schmidt, A.; Nowack, S.; Rudolph, A.; Doelcker, E.M.; Schlattmann, P.; Götz, T.; Hoyer, D. Developmental milestones of the autonomic nervous system revealed via longitudinal monitoring of fetal heart rate variability. PLoS ONE 2018, 13, e0200799. [Google Scholar]
- Dawes, G.S.; Moulden, M.; Redman, C.W. The advantages of computerized fetal heart rate analysis. J. Perinat. Med. 1991, 19, 39–45. [Google Scholar] [CrossRef]
- Malik, M.; Bigger, J.T.; Camm, A.J.; Kleiger, R.E.; Malliani, A.; Moss, A.J.; Schwartz, P.J. Heart rate variability: Standards of measurement, physiological interpretation, and clinical use. Task Force of the European Society of Cardiology and the North American Society of Pacing and Electrophysiology. Eur. Heart J. 1996, 7, 354–381. [Google Scholar] [CrossRef] [Green Version]
- Hoyer, D.; Heinicke, E.; Jaekel, S.; Tetschke, F.; Paolo, D.D.P.; Haueisen, J.; Schleußner, E.; Schneider, U. Indices of fetal development derived from heart rate patterns. Early Hum. Dev. 2009, 85, 379–386. [Google Scholar] [CrossRef]
- David, M.; Hirsch, M.; Karin, J.; Toledo, E.; Akselrod, S. An estimate of fetal autonomic state by time-frequency analysis of fetal heart rate variability. J. Appl. Physiol. 2007, 102, 1057–1064. [Google Scholar] [CrossRef] [Green Version]
- de Vries, J.I.; Visser, G.H.; Prechtl, H.F. The emergence of fetal behaviour. I. Qualitative aspects. Early Hum. Dev. 1982, 7, 301–322. [Google Scholar] [CrossRef]
- Schmidt, A.; Witte, R.; Swiderski, L.; Zollkau, J.; Schneider, U.; Hoyer, D. Advanced automatic detection of fetal body movements from multichannel magnetocardiographic signals. Physiol. Meas. 2019, 40, 085005. [Google Scholar] [CrossRef]
- Schmidt, A.; Schukat-Talamazzini, E.G.; Zöllkau, J.; Pytlik, A.; Leibl, S.; Kumm, K.; Bode, F.; Kynass, I.; Witte, O.W.; Schleussner, E.; et al. Universal characteristics of evolution and development are inherent in fetal autonomic brain maturation. Auton. Neurosci. 2018, 212, 32–41. [Google Scholar] [CrossRef]
- AWMF. S3-Leitlinie Gestationsdiabetes Mellitus (GDM), Diagnostik, Therapie und Nachsorge. 2. Auflage. 2018. Available online: https://www.awmf.org/uploads/tx_szleitlinien/057-008l_S3_Gestationsdiabetes-mellitus-GDM-Diagnostik-Therapie-Nachsorge_2019-06.pdf (accessed on 15 July 2021).
- Villar, J.; Puglia, F.A.; Fenton, T.R.; Ismail, L.C.; Staines-Urias, E.; Giuliani, F.; Ohuma, E.O.; Victora, C.G.; Sullivan, P.; Barros, F.C.; et al. Body composition at birth and its relationship with neonatal anthropometric ratios: The newborn body composition study of the INTERGROWTH-21(st) project. Pediatr. Res. 2017, 82, 305–316. [Google Scholar] [CrossRef]
- Lange, S.; Van Leeuwen, P.; Geue, D.; Hatzmann, W.; Gronemeyer, D. Influence of gestational age, heart rate, gender and time of day on fetal heart rate variability. Med. Biol. Eng. Comput. 2005, 43, 481–486. [Google Scholar] [CrossRef] [PubMed]
- Schmidt, A.; Schneider, U.; Witte, O.W.; Schleussner, E.; Hoyer, D. Developing fetal motor-cardiovascular coordination analyzed from multi-channel magnetocardiography. Physiol. Meas. 2014, 35, 1943–1959. [Google Scholar] [CrossRef] [PubMed] [Green Version]
- Mulder, E.J.; Boersma, M.; Meeuse, M.; van der Wal, M.; van de Weerd, E.; Visser, G.H. Patterns of breathing movements in the near-term human fetus: Relationship to behavioural states. Early Hum. Dev. 1994, 36, 127–135. [Google Scholar] [CrossRef]
- Bergman, R.N.; Miller, R.E. Direct enhancement of insulin secretion by vagal stimulation of the isolated pancreas. Am. J. Physiol. 1973, 225, 481–486. [Google Scholar] [CrossRef] [Green Version]
- Weschenfelder, F.; Hein, F.; Lehmann, T.; Schleussner, E.; Groten, T. Contributing Factors to Perinatal Outcome in Pregnancies with Gestational Diabetes-What Matters Most? A Retrospective Analysis. J. Clin. Med. 2021, 10, 348. [Google Scholar] [CrossRef] [PubMed]
- Weschenfelder, F.; Lehmann, T.; Schleussner, E.; Groten, T. Gestational Weight Gain Particularly Affects the Risk of Large for Gestational Age Infants in Non-obese Mothers. Geburtshilfe Frauenheilkd. 2019, 79, 1183–1190. [Google Scholar] [CrossRef] [Green Version]
- Kc, K.; Shakya, S.; Zhang, H. Gestational diabetes mellitus and macrosomia: A literature review. Ann. Nutr. Metab. 2015, 66 (Suppl. 2), 14–20. [Google Scholar] [CrossRef]
- Kim, C. Gestational diabetes: Risks, management, and treatment options. Int. J. Womens Health 2010, 2, 339–351. [Google Scholar] [CrossRef] [Green Version]
- de Vries, J.I.; Visser, G.H.; Mulder, E.J.; Prechtl, H.F. Diurnal and other variations in fetal movement and heart rate patterns at 20–22 weeks. Early Hum. Dev. 1987, 15, 333–348. [Google Scholar] [CrossRef]
- Hoyer, D.; Schmidt, A.; Pytlik, A.; Viehöfer, L.; Gonçalves, H.; Amorim-Costa, C.; Bernardes, J.; Ayres-de-Campos, D.; Lobmaier, S.M.; Schneider, U. Can fetal heart rate variability obtained from cardiotocography provide the same diagnostic value like from electrophysiological interbeat intervals? Physiol. Meas. 2021, 42, 015006. [Google Scholar] [CrossRef] [PubMed]


| Parameter | Calculation | Interpretation |
|---|---|---|
| Parameters of the Time Domain | ||
| SDNN (ms) | Standard deviation of NN intervals | Overall (sympathetic and parasympathetic influences), predominantly sympathetic |
| RMSSD (ms) | Root mean square of successive NN-interval differences | predominantly vagal activity |
| Actamp20 (bmp) | 20–95 inter-percentile distance of the trend-corrected NN interval series in beats per minute | Overall (sympathetic and parasympathetic influences), predominantly sympathetic |
| pNN5 (%) | Percentage of successive NN-interval differences that are > 5 ms | Predominantly vagal activity |
| Parameters of the Frequency Domain | ||
| VLF (ms2) | Very low frequency, spectral power of the frequency band from 0.02–0.08 Hz | Baseline-fluctuations, sympathetic influence |
| HF (ms2) | High frequency, spectral power of the frequency band from 0.4–1.7 Hz | vagal influences, respiratory sinus arrhythmia |
| Study Cohort (GDM) | Controls | ||||||
|---|---|---|---|---|---|---|---|
| No. | mean/% | SD | No. | mean/% | SD | p | |
| Maternal Characteristics | |||||||
| Maternal age (years) | 17 | 30.1 | 4.7 | 147 | 28.8 | 4.7 | 0.92 |
| Maternal weight (kg) | 16 | 80.6 | 14.4 | 146 | 67.1 | 11.7 | <0.01 |
| Height (cm) | 16 | 167.1 | 6.0 | 146 | 167.1 | 6.7 | 0.84 |
| BMI (kg/m2) | 16 | 28.9 | 4.8 | 146 | 24.0 | 3.8 | <0.01 |
| Pregnancy weight gain (kg) | 9 | 12.33 | 7.25 | ||||
| mMBG (mmol/L) | 16 | 5.99 | 0.51 | ||||
| min/max MBG (mmol/L) | 16 | 5.1/7.1 | |||||
| mMBGpp (mmol/L) | 12 | 6.62 | 0.65 | ||||
| min/max mMBGpp (mmol/L) | 12 | 5.4/8.0 | |||||
| Hb1Ac (%) | 10 | 5.31 | 0.29 | ||||
| min/max HbA1c (%) | 10 | 4.8/5.8 | |||||
| Neonatal Outcome | |||||||
| birthweight (g) | 17 | 3353.5 | 509.5 | 147 | 3402 | 539.9 | 0.84 |
| Z score birthweight | 17 | 0.45 | 0.99 | 147 | 0.40 | 0.94 | 0.73 |
| percentile birthweight | 17 | 60.2 | 26.5 | 147 | 61.4 | 27.1 | 0.83 |
| LGA > 90th Percentile LGA > 4000 g | 4 1 | 23.5% 5.9% | 25 17 | 17% 11.6% | 2.9 | 0.06 | |
| head circumference (cm) | 17 | 34.2 | 1.9 | 147 | 34.4 | 1.8 | 0.84 |
| APGAR 5 | 17 | 9.1 | 0.6 | 147 | 9.1 | 0.8 | 0.40 |
| pH umbilical artery | 17 | 7.27 | 0.25 | 147 | 7.25 | 0.07 | 0.80 |
| Newborn sex | 17 | 152 | |||||
| male | 9 | 52.9% | 68 | 44.7% | 0.61 * | ||
| female | 8 | 47.1% | 84 | 55.3% | |||
| Mode of Delivery | |||||||
| spontaneous vaginal | 10 | 58.8% | 106 | 69.7% | 0.41 * | ||
| caesarean section | 6 | 35.3% | 34 | 22.4% | |||
| operative vaginal | 1 | 5.9% | 12 | 7.9% | |||
| admission to NICU | 4 | 23.5% | 24 | 16.3% | 0.49 * | ||
| Overall | <32 Weeks of Gestation | ≥32 Weeks of Gestation | |||||||
|---|---|---|---|---|---|---|---|---|---|
| GDM | Controls | p | GDM | Controls | p | GDM | Controls | p | |
| Sympathetic | |||||||||
| SDNN (ms) | 22.9 ± 6.5 | 22.1 ± 7.3 | 0.39 | 22.1 ± 6.8 | 19.5 ± 6.5 | 0.19 | 23.2 ± 6.4 | 24.0 ± 7.2 | 0.47 |
| Actamp20 (bpm) | 18.1 ± 5.7 | 17.8 ± 5.8 | 0.81 | 17.0 ± 5.4 | 15.1 ± 5.0 | 0.25 | 18.4 ± 5.8 | 19.7 ± 5.6 | 0.23 |
| VLF (ms2) | 2.2 ± 0.2 | 2.1 ± 0.3 | 0.38 | 2.1 ± 0.3 | 2.0 ± 0.3 | 0.17 | 2.2 ± 0.2 | 2.2 ± 0.3 | 0.54 |
| Vagal | |||||||||
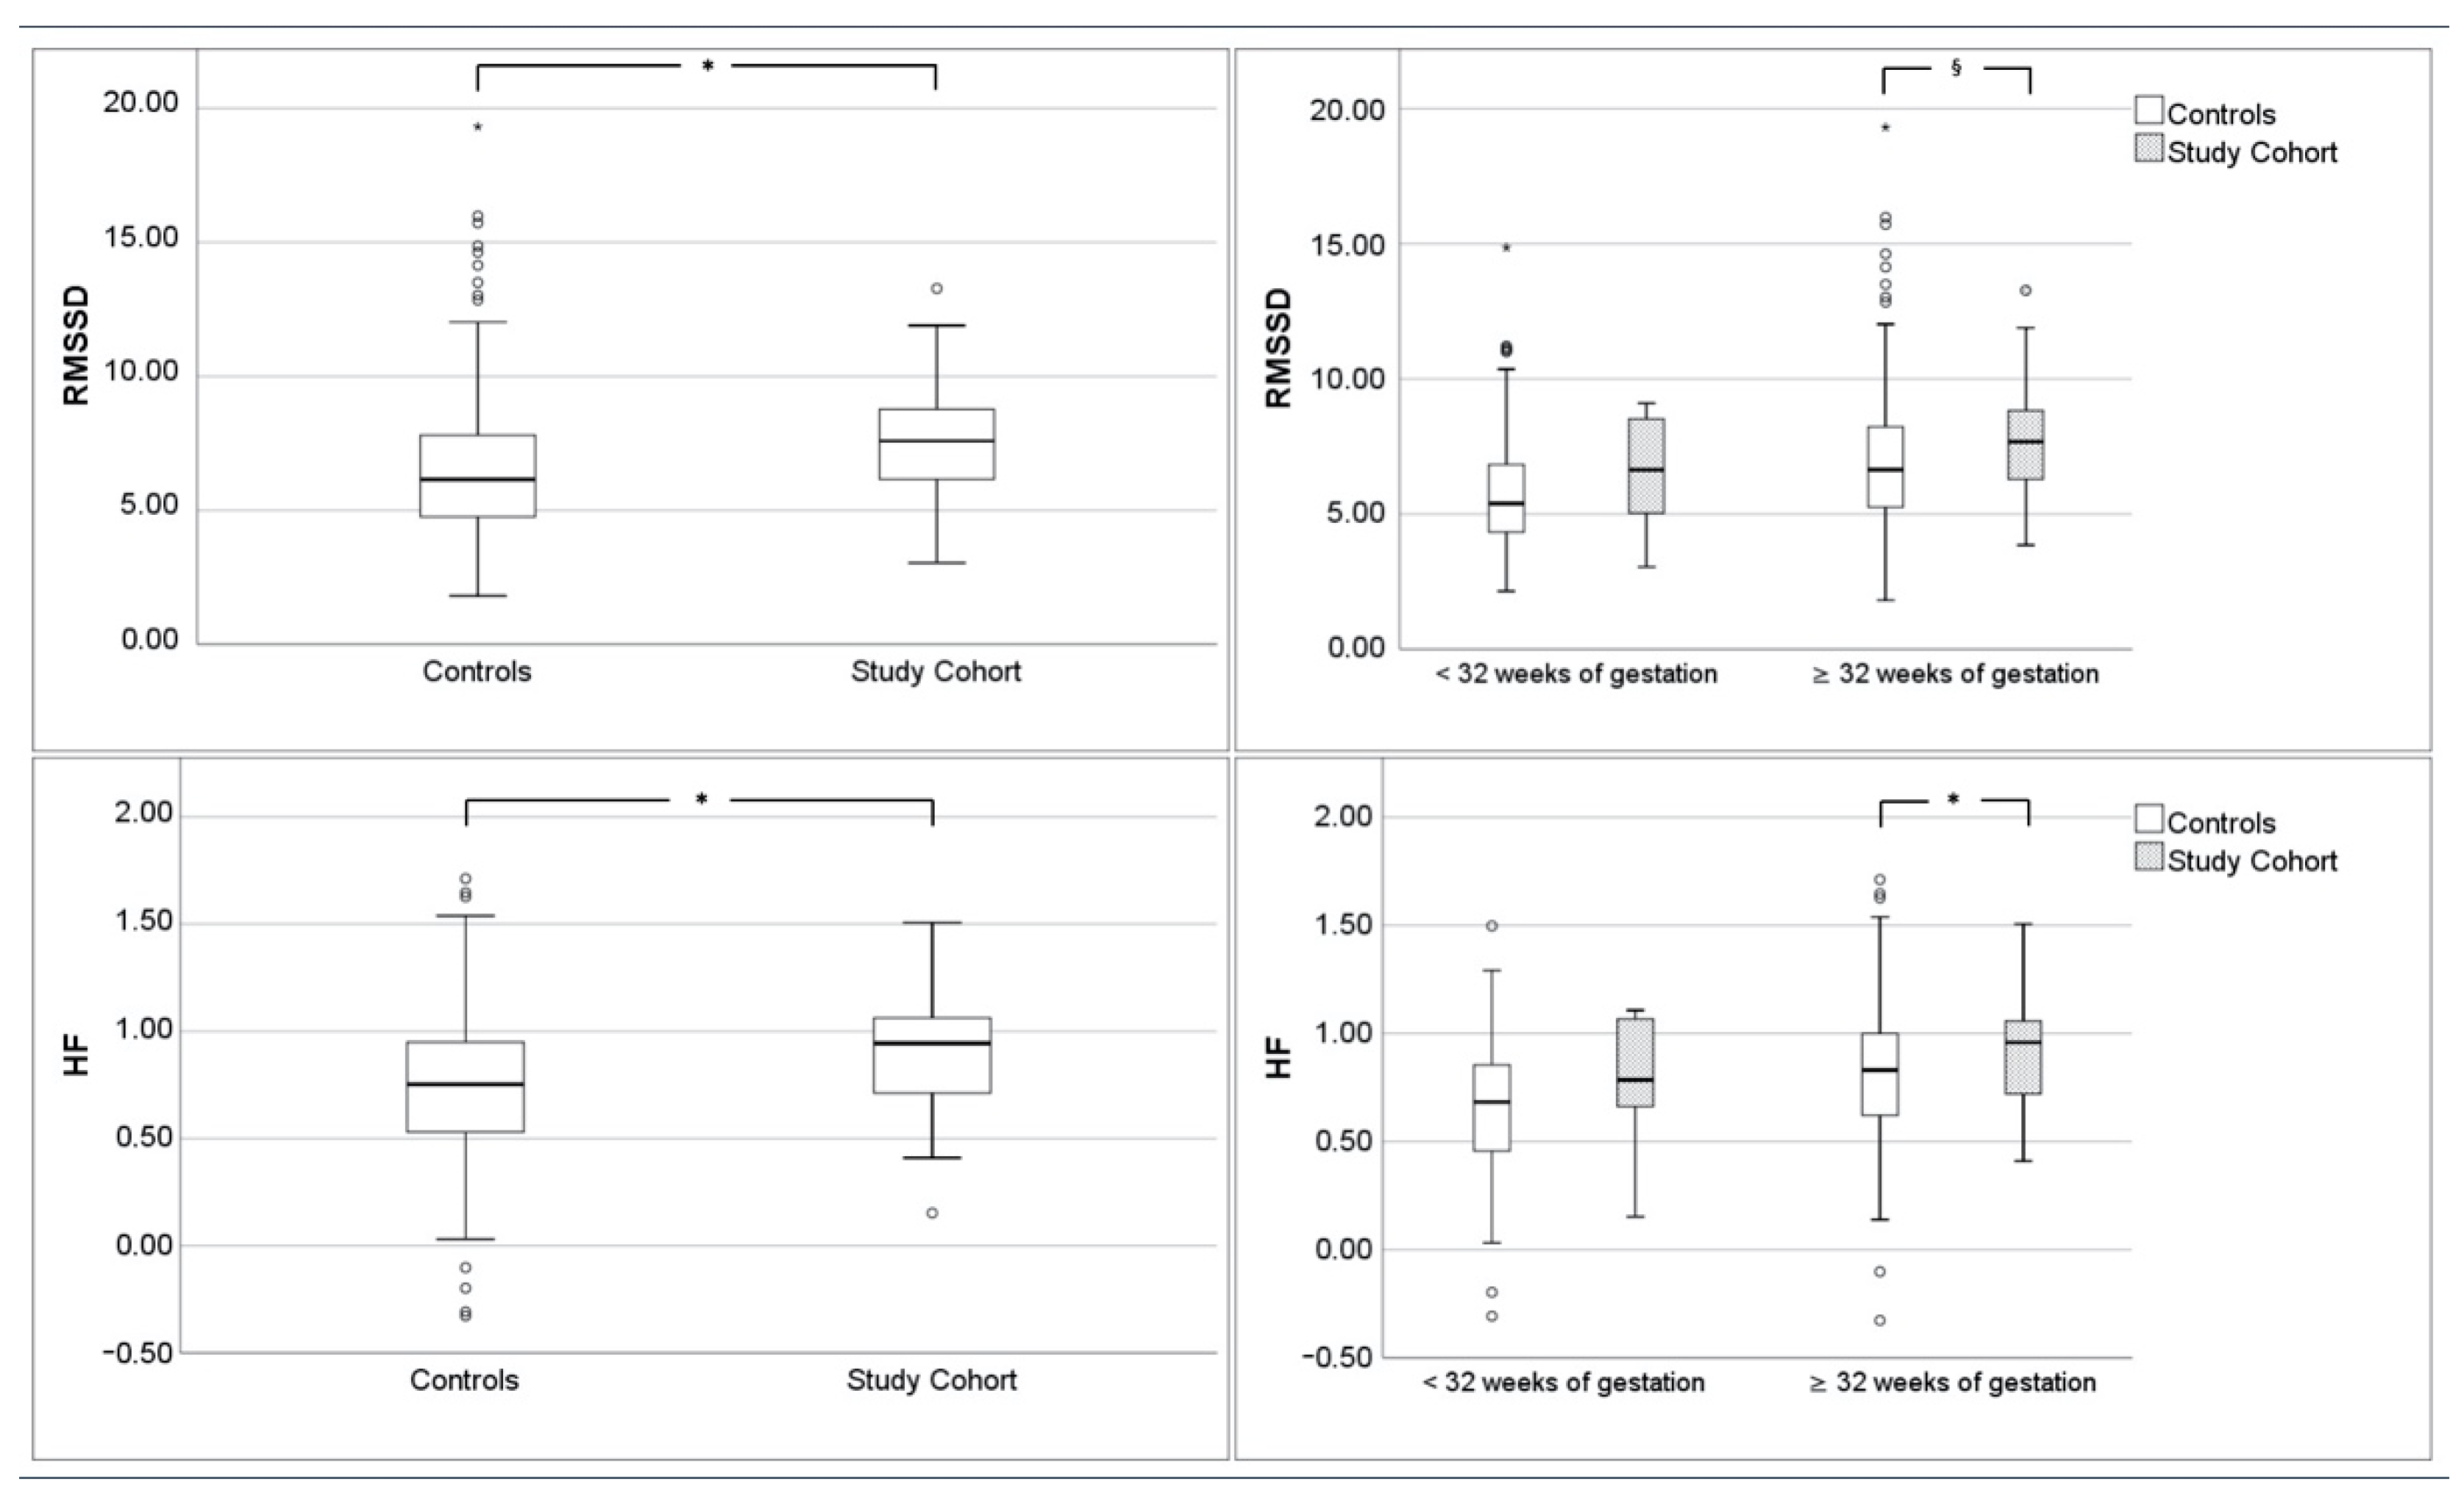
| RMSSD (ms) | 7.4 ± 2.1 | 6.6 ± 2.4 | <0.01 | 6.6 ± 2.1 | 5.8 ± 2.0 | 0.16 | 7.7 ± 2.1 | 7.1 ± 2.6 | 0.06 |
| pNN5 (%) | 0.30 ± 0.10 | 0.28 ± 0.12 | 0.13 | 0.24 ± 0.11 | 0.22 ± 0.1 | 0.51 | 0.36 ± 0.10 | 0.36 ± 0.12 | 0.98 |
| HF (ms2) | 0.9 ± 0.3 | 0.8 ± 0.3 | <0.01 | 0.8 ± 0.3 | 0.7 ± 0.3 | 0.18 | 1.0 ± 0.3 | 0.8 ± 0.3 | 0.04 |
| Movement | |||||||||
| fMI (%) | 36.5 ± 20.4 | 39.9 ± 21.7 | 0.34 | 31.3 ± 21.5 | 35.0 ± 20.8 | 0.49 | 38.0 ± 20.1 | 43.3 ± 21.7 | 0.23 |
| SDNN | Actamp20 | |||
|---|---|---|---|---|
| RcB | p | RcB | p | |
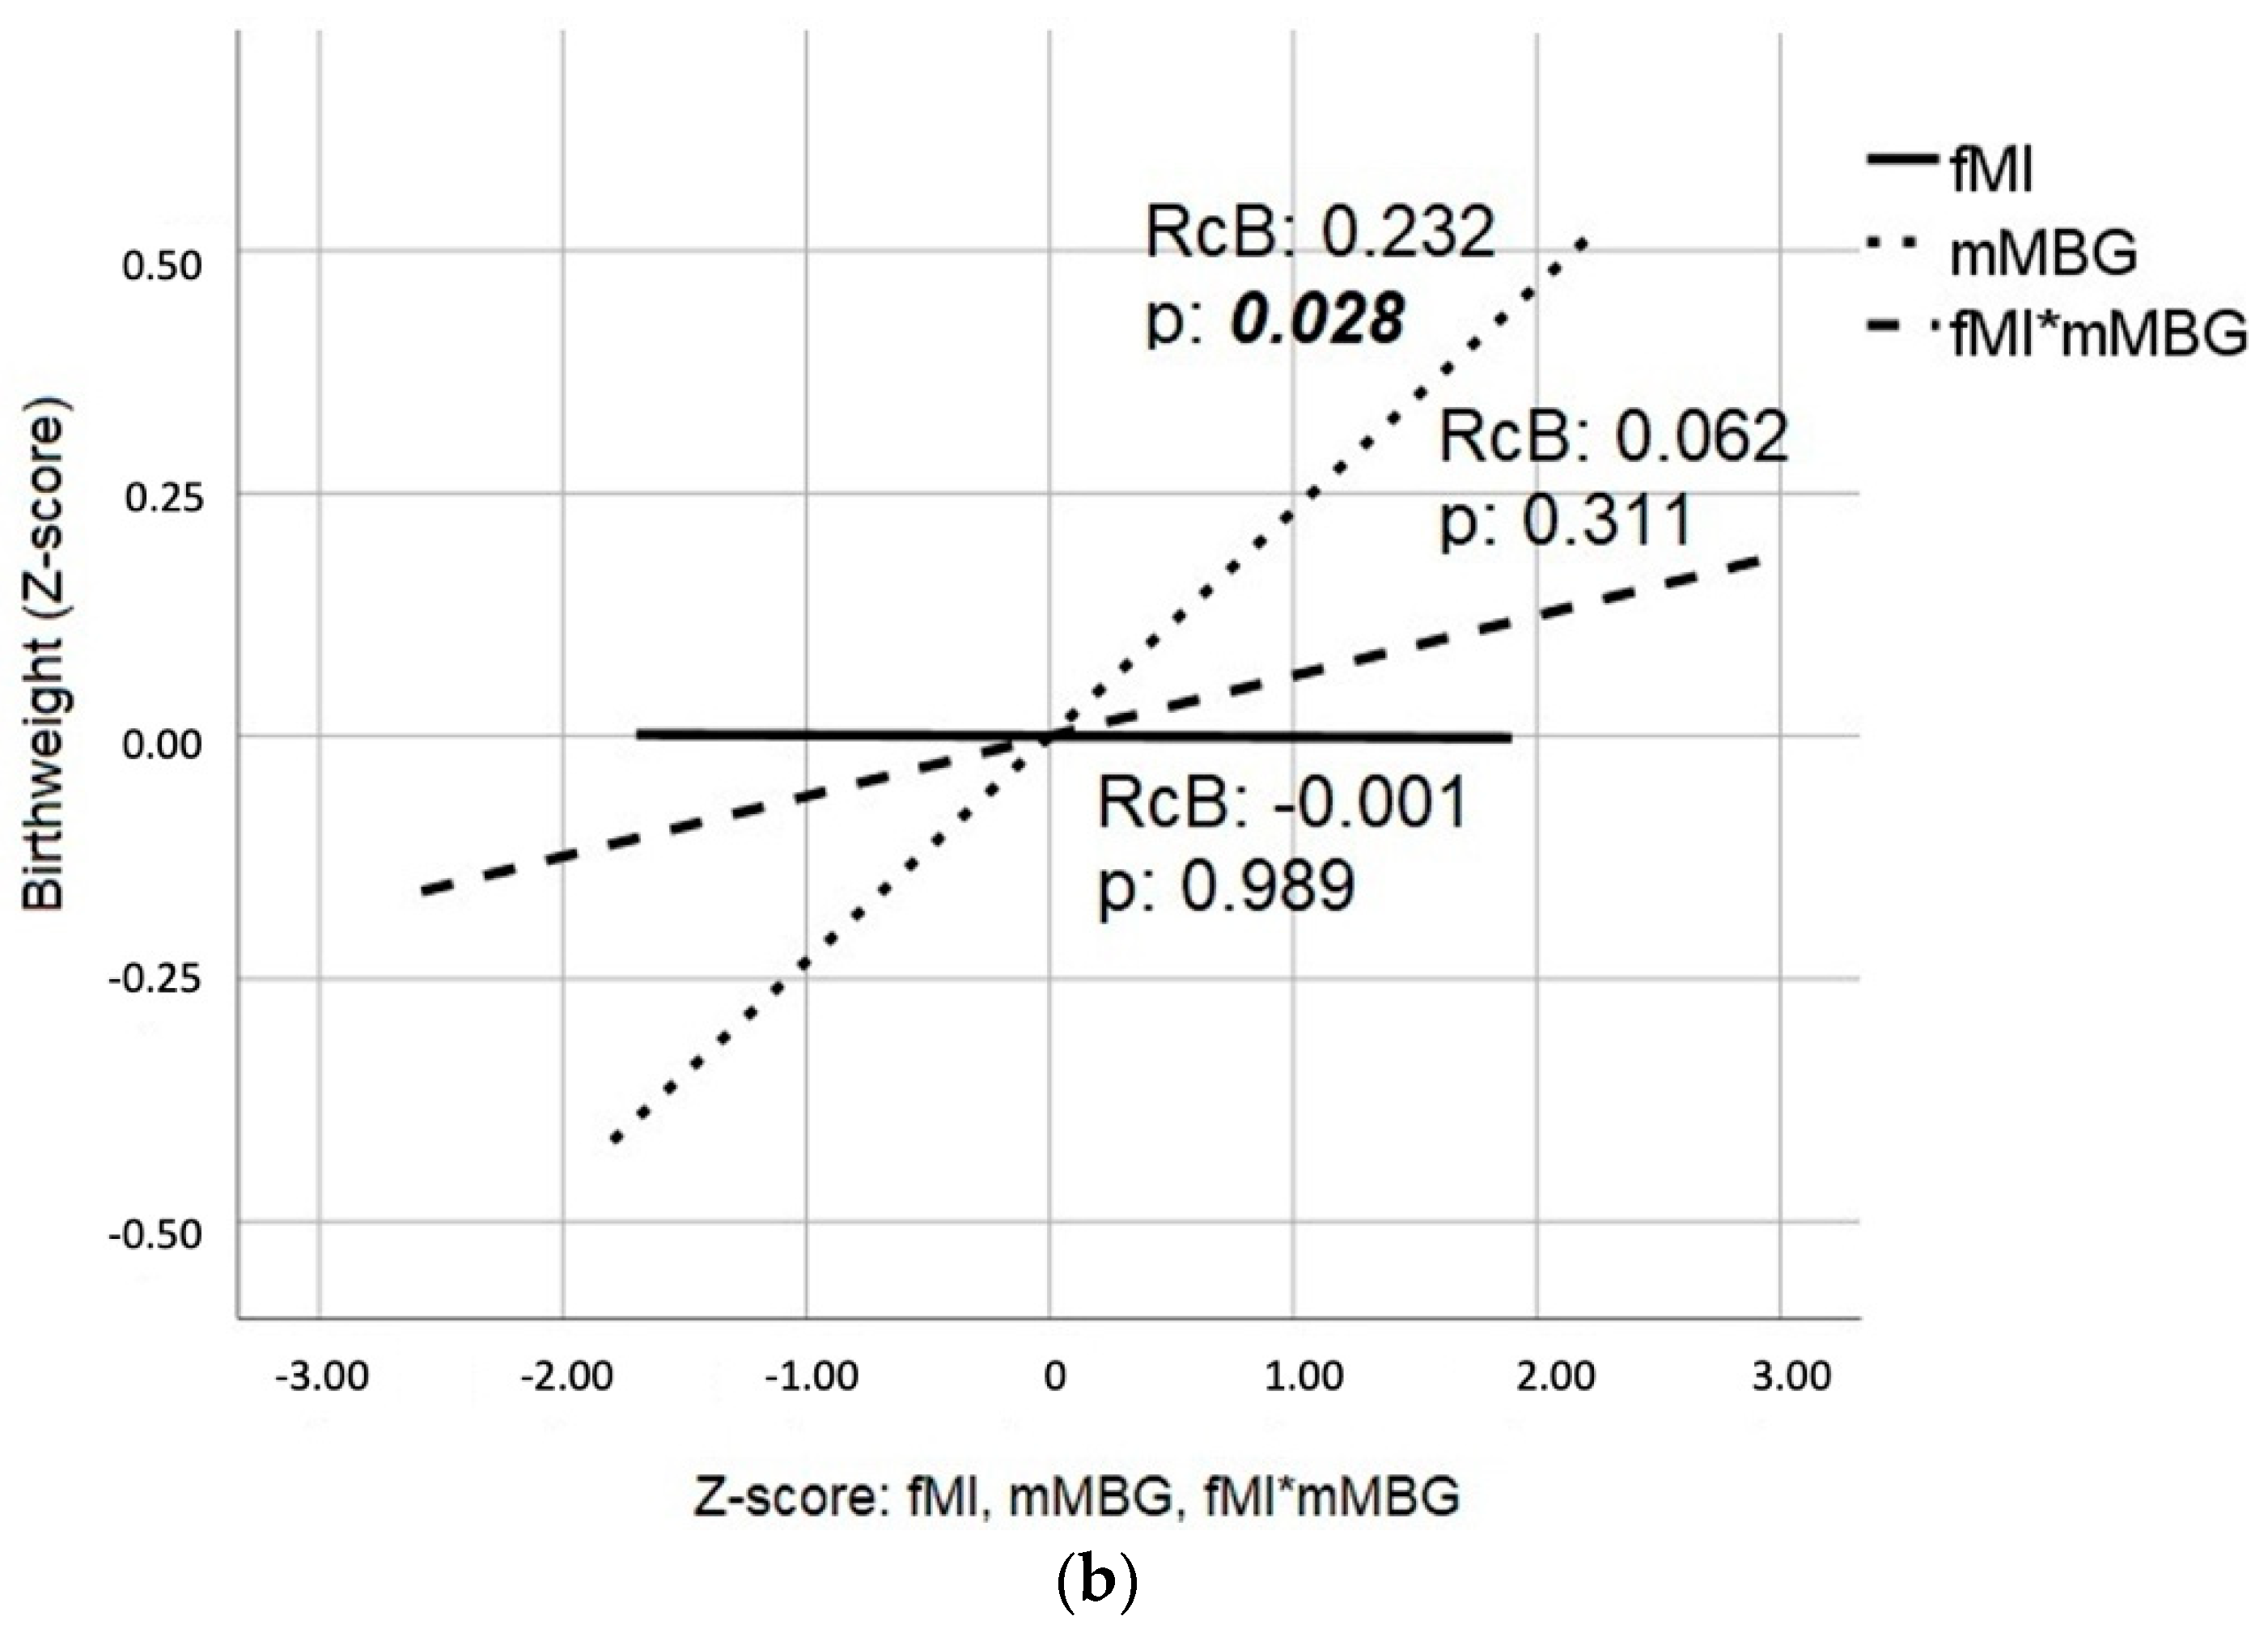
| fMI | 0.490 | <0.001 | 0.553 | <0.001 |
| mMBG | 0.185 | 0.121 | 0.112 | 0.359 |
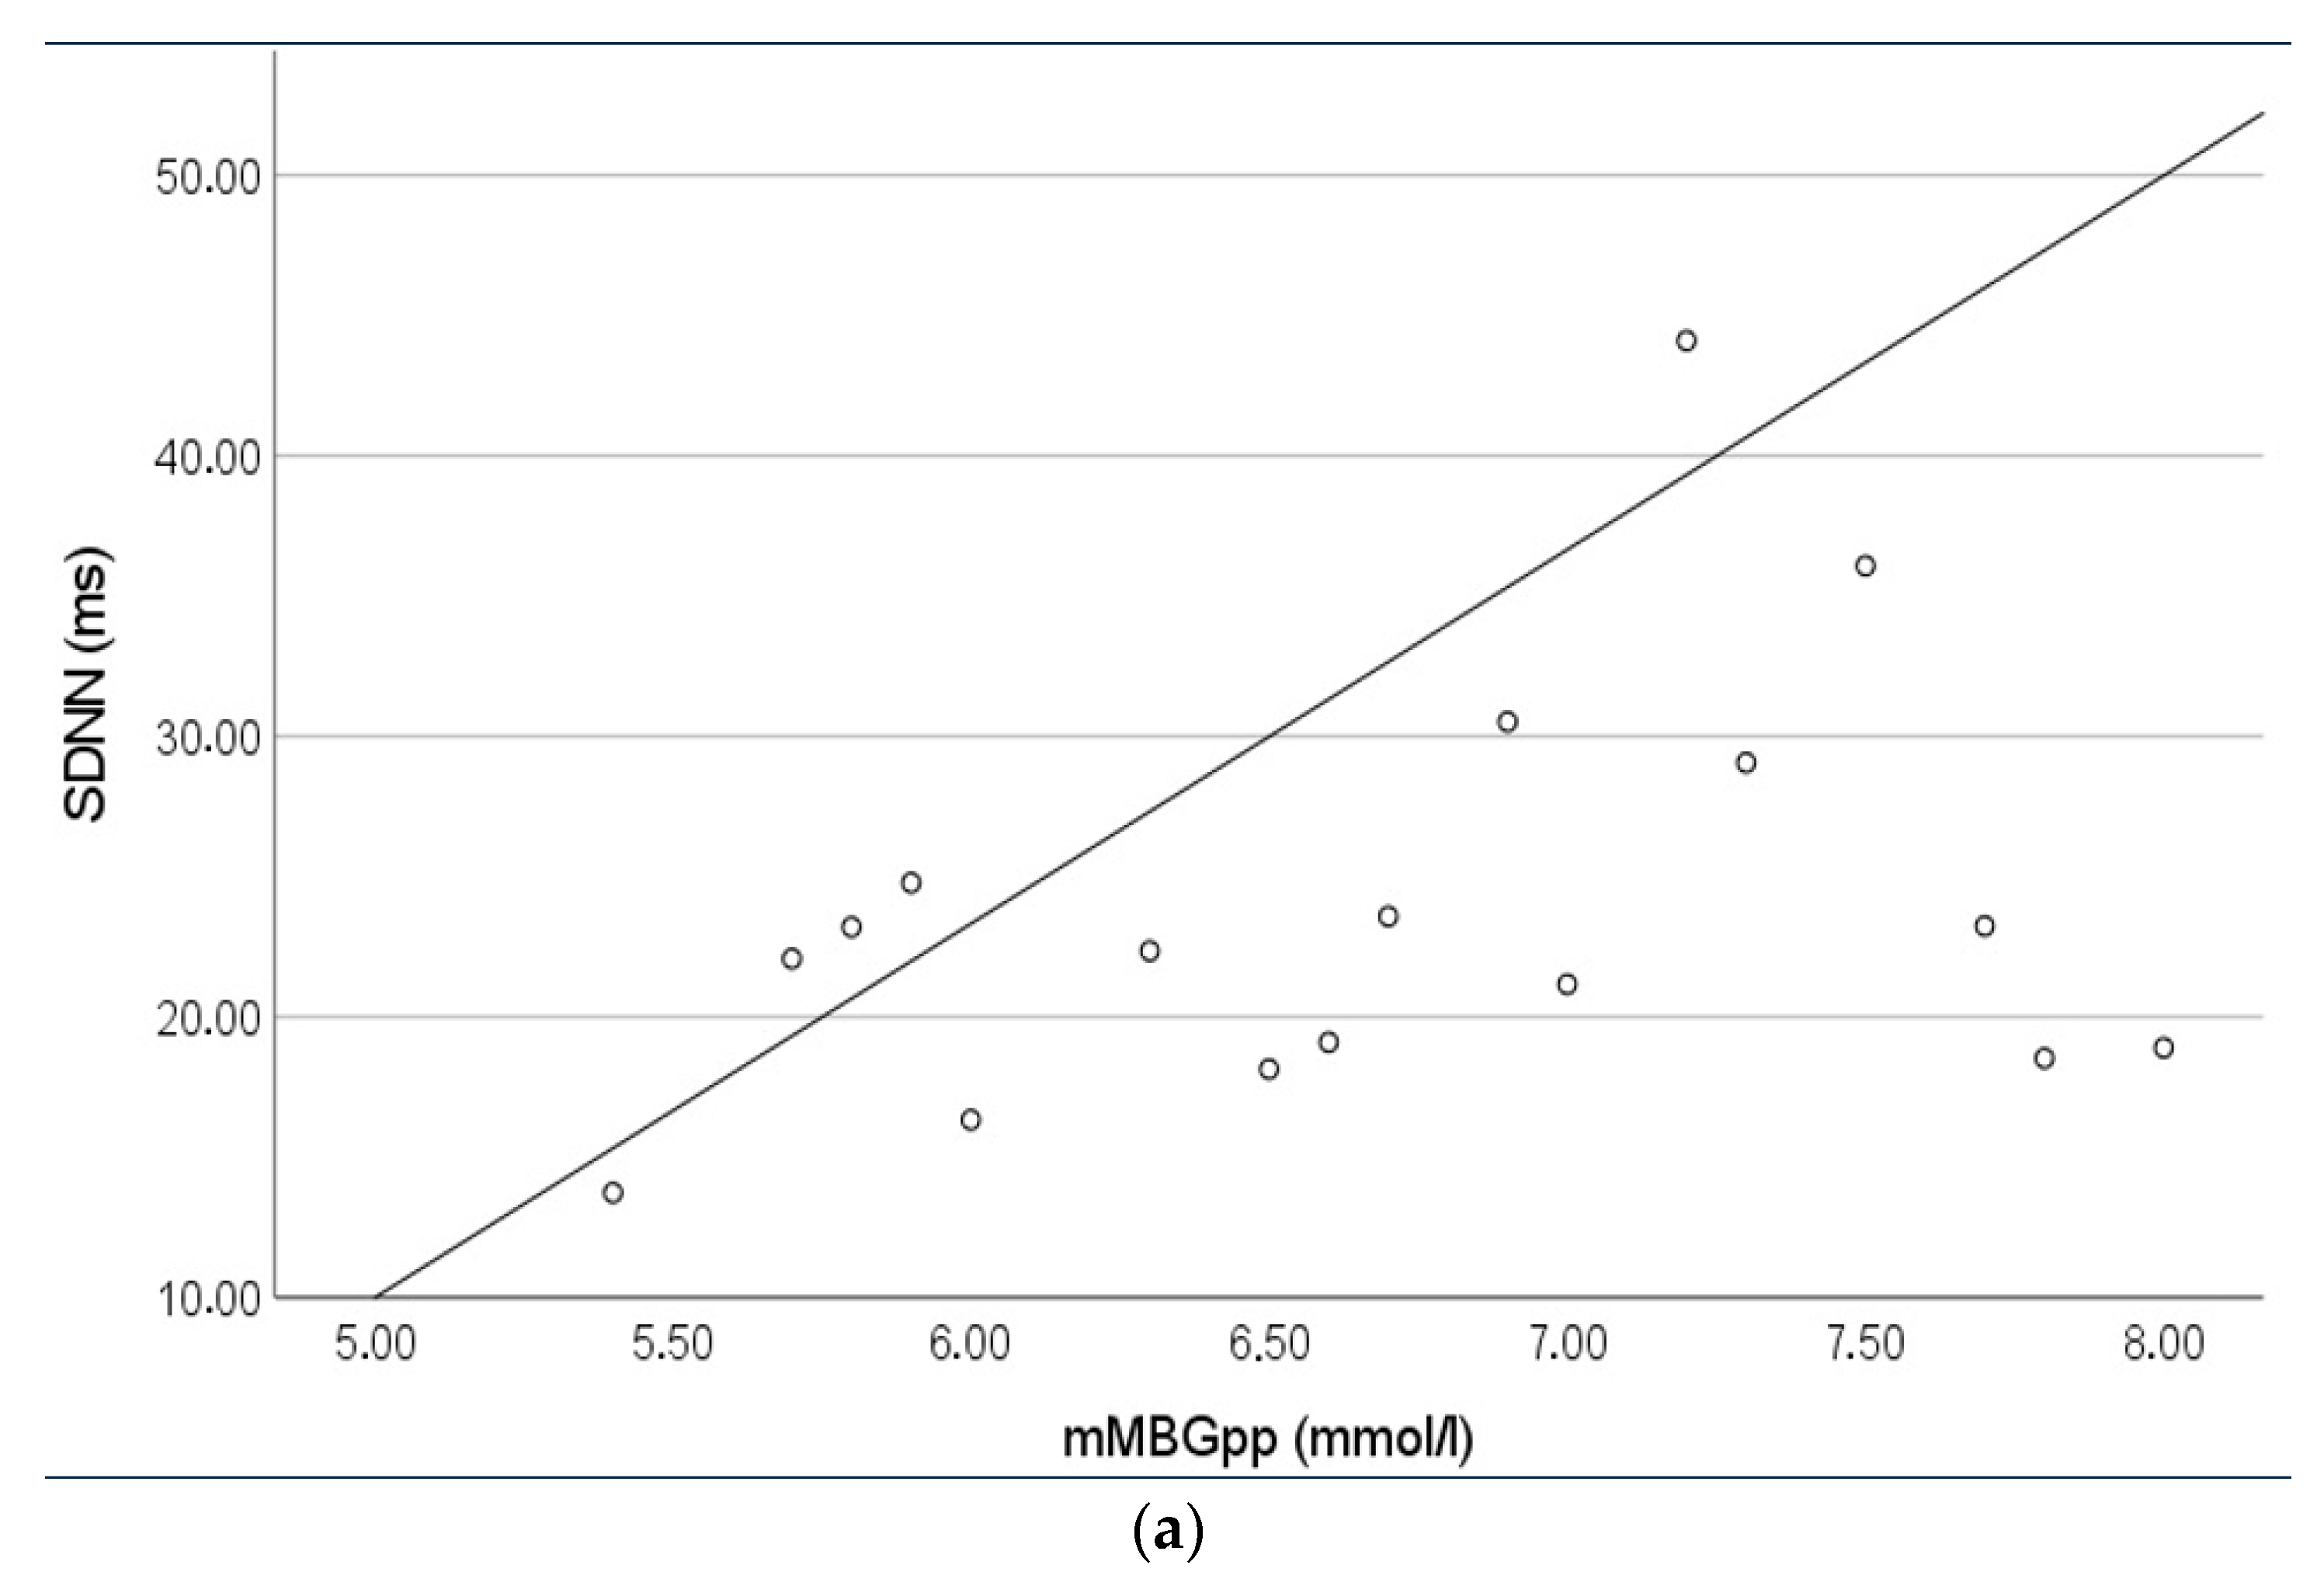
| mMBGpp | 0.339 | 0.009 | 0.282 | 0.016 |
| fMI*mMBG | 0.231 | 0.026 | 0.272 | 0.035 |
| fMI*mMBGpp | 0.302 | 0.025 | 0.264 | 0.138 |
Publisher’s Note: MDPI stays neutral with regard to jurisdictional claims in published maps and institutional affiliations. |
© 2021 by the authors. Licensee MDPI, Basel, Switzerland. This article is an open access article distributed under the terms and conditions of the Creative Commons Attribution (CC BY) license (https://creativecommons.org/licenses/by/4.0/).
Share and Cite
Zöllkau, J.; Swiderski, L.; Schmidt, A.; Weschenfelder, F.; Groten, T.; Hoyer, D.; Schneider, U. The Relationship between Gestational Diabetes Metabolic Control and Fetal Autonomic Regulation, Movement and Birth Weight. J. Clin. Med. 2021, 10, 3378. https://doi.org/10.3390/jcm10153378
Zöllkau J, Swiderski L, Schmidt A, Weschenfelder F, Groten T, Hoyer D, Schneider U. The Relationship between Gestational Diabetes Metabolic Control and Fetal Autonomic Regulation, Movement and Birth Weight. Journal of Clinical Medicine. 2021; 10(15):3378. https://doi.org/10.3390/jcm10153378
Chicago/Turabian StyleZöllkau, Janine, Laura Swiderski, Alexander Schmidt, Friederike Weschenfelder, Tanja Groten, Dirk Hoyer, and Uwe Schneider. 2021. "The Relationship between Gestational Diabetes Metabolic Control and Fetal Autonomic Regulation, Movement and Birth Weight" Journal of Clinical Medicine 10, no. 15: 3378. https://doi.org/10.3390/jcm10153378
APA StyleZöllkau, J., Swiderski, L., Schmidt, A., Weschenfelder, F., Groten, T., Hoyer, D., & Schneider, U. (2021). The Relationship between Gestational Diabetes Metabolic Control and Fetal Autonomic Regulation, Movement and Birth Weight. Journal of Clinical Medicine, 10(15), 3378. https://doi.org/10.3390/jcm10153378