
Eye Tracking—An Innovative Tool in Medical Parasitology

 , , , , ,
  , and
, and
Abstract
:1. Introduction
2. Materials and Methods
2.1. Participants
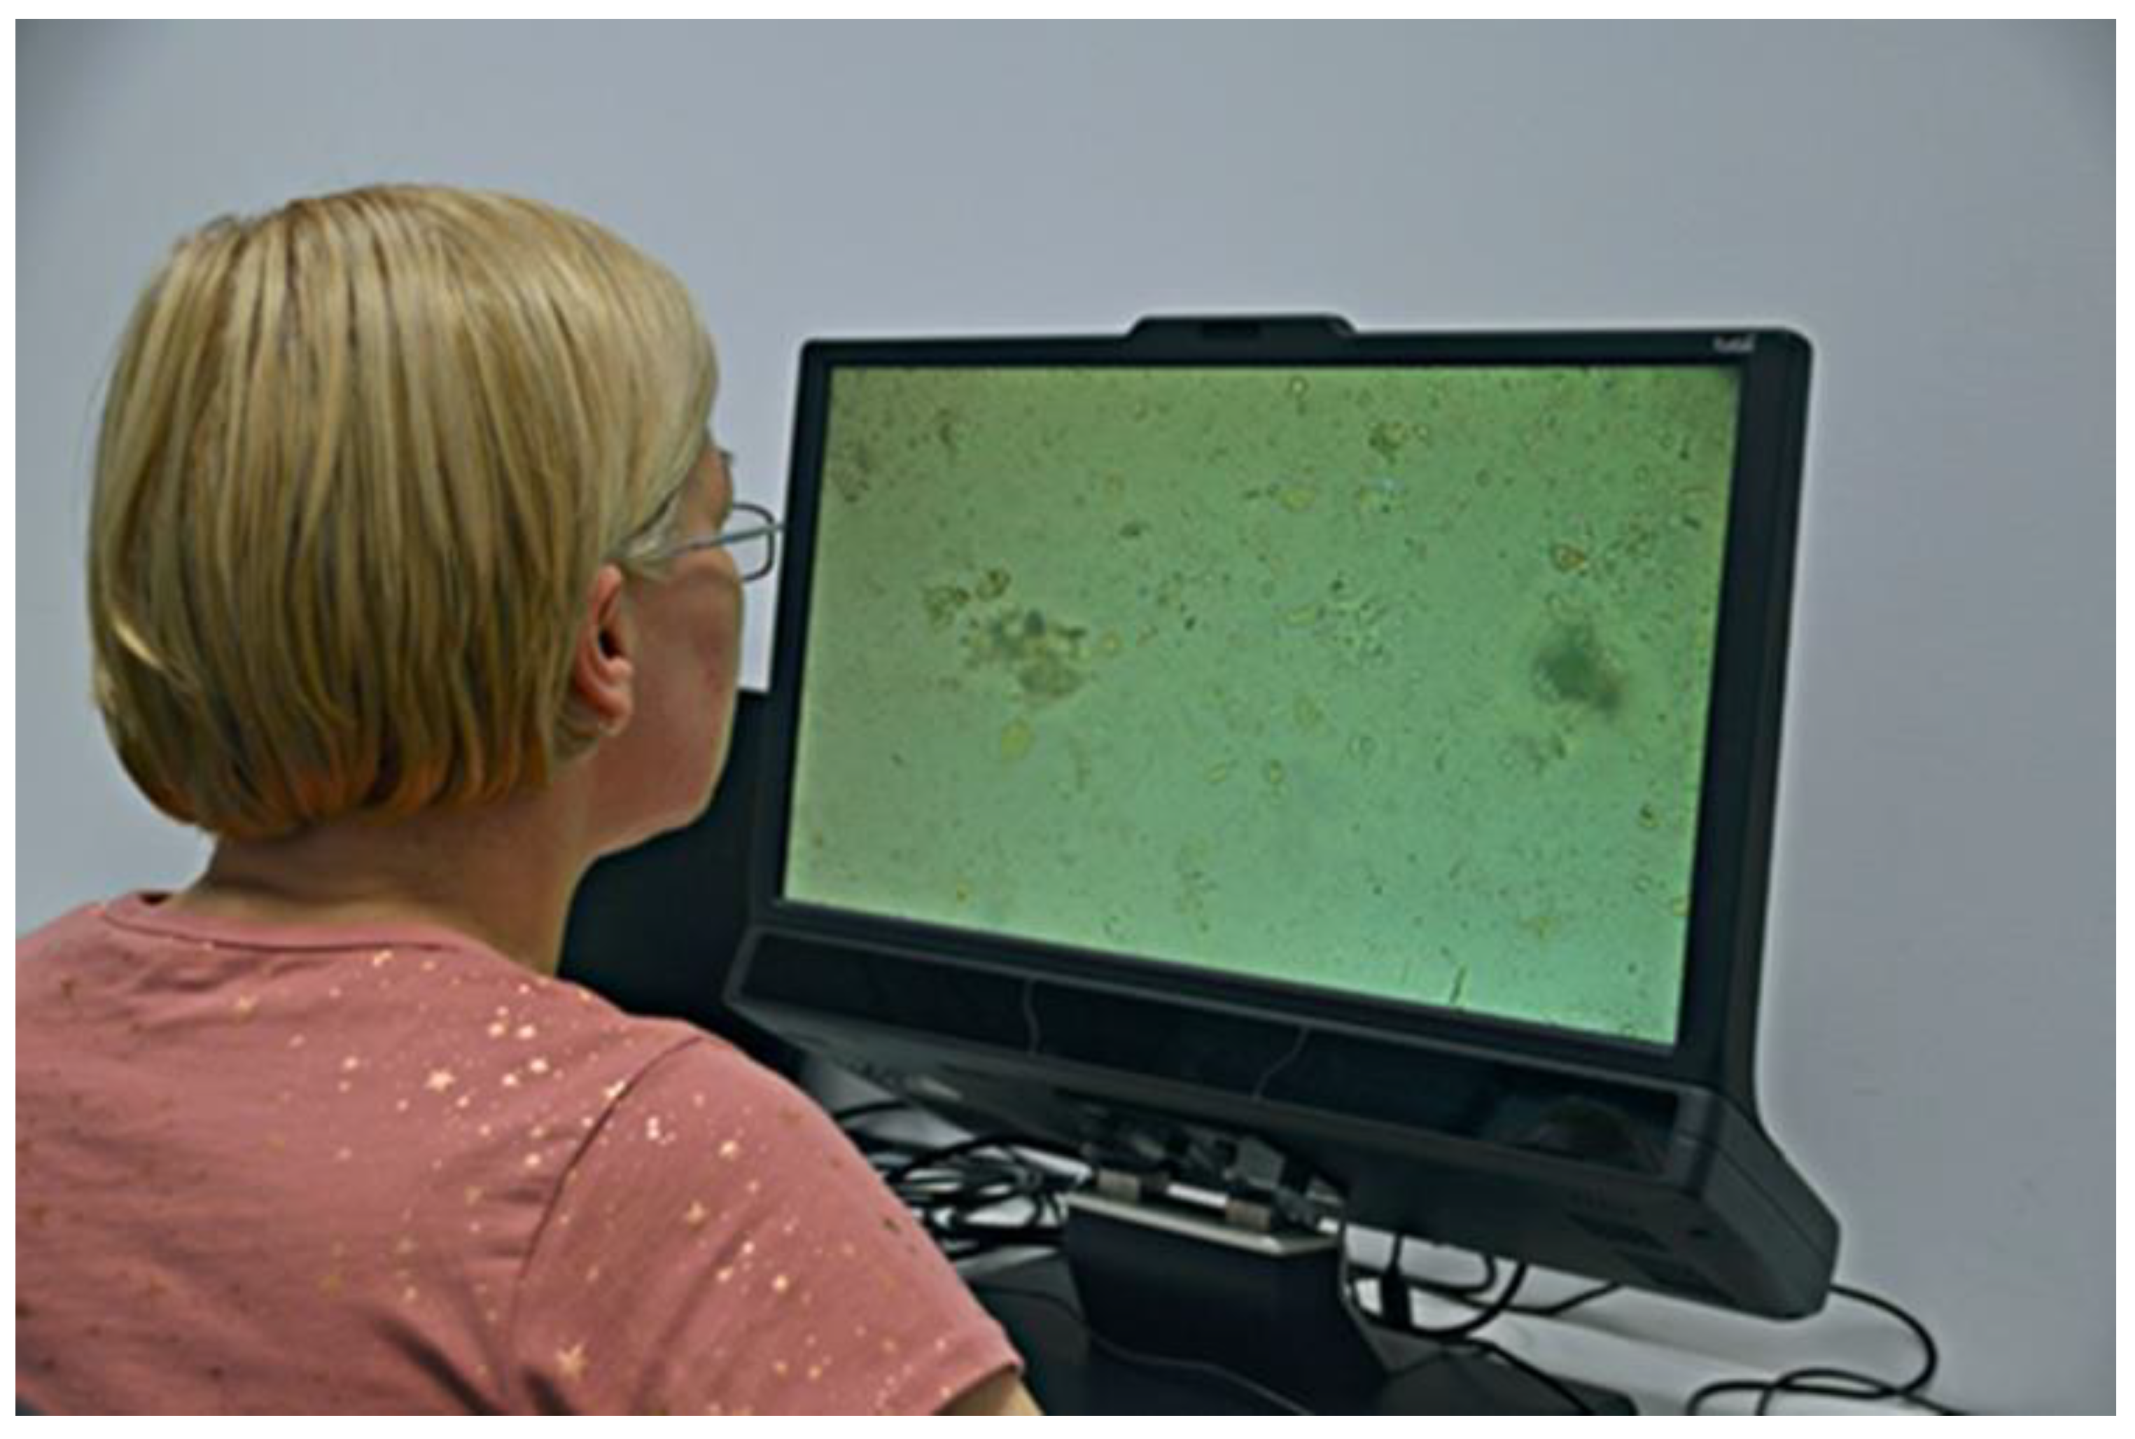
2.2. Apparatus
2.3. Material
2.4. Procedure
- (1)
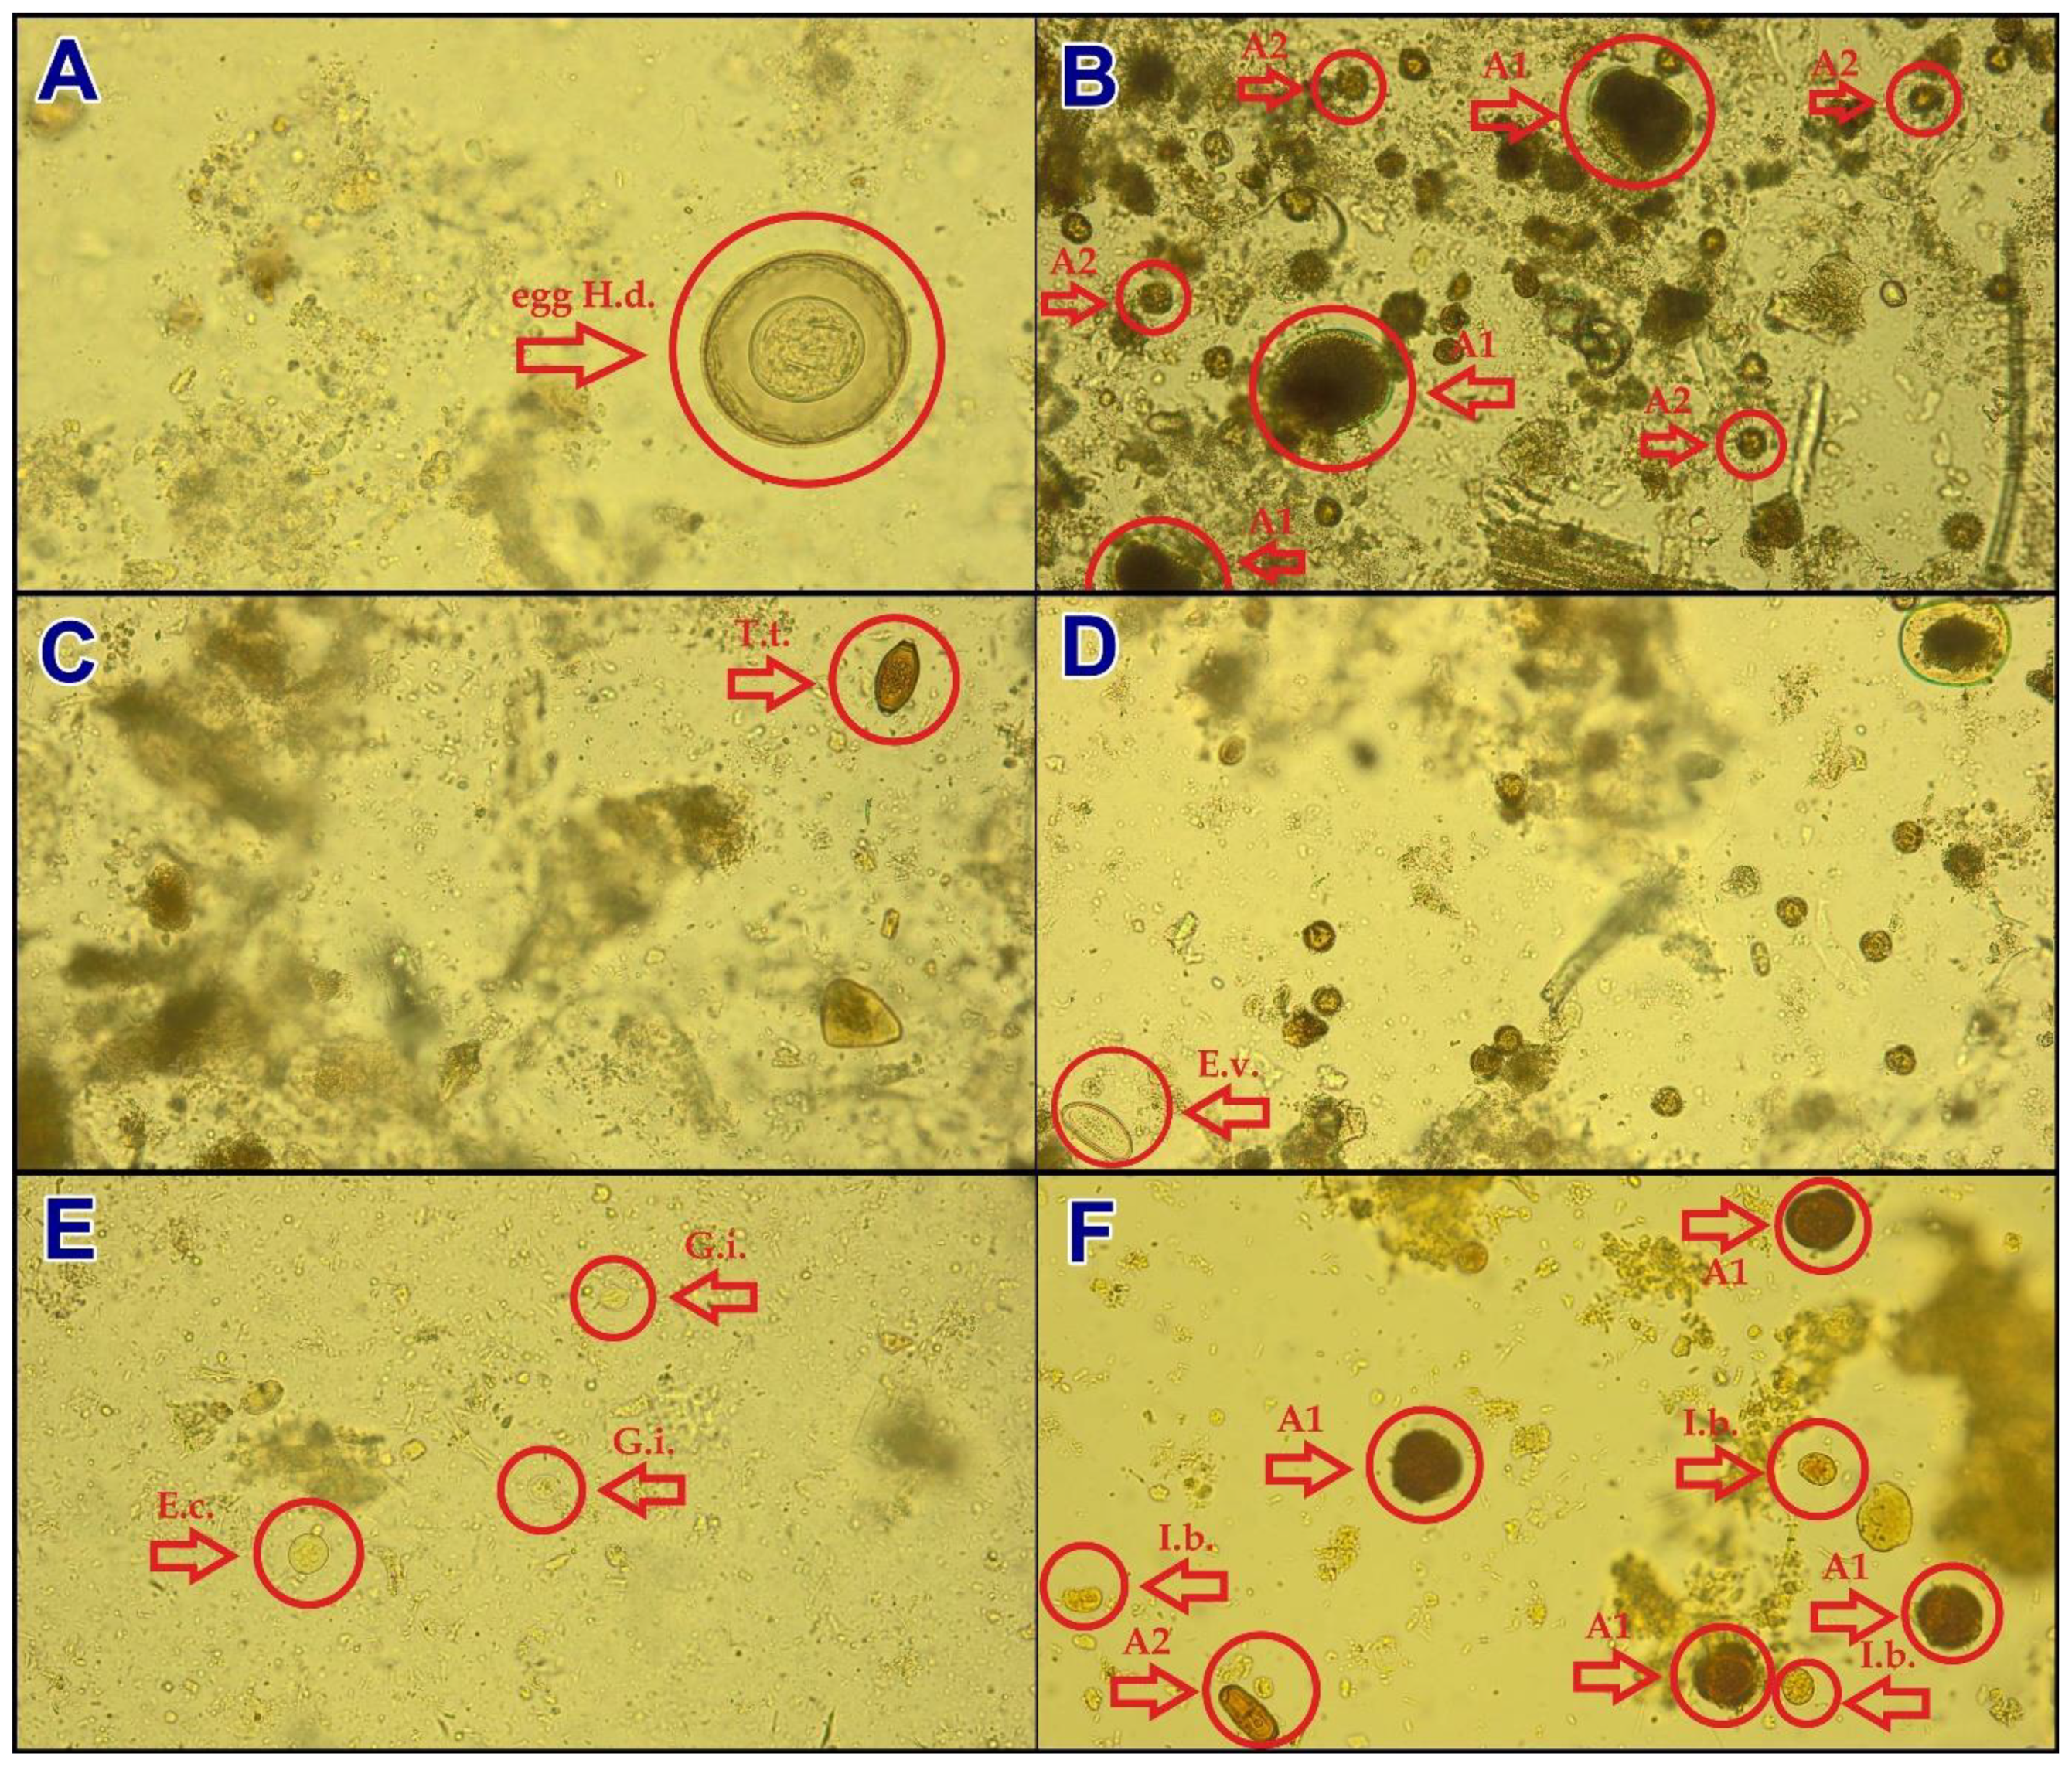
- The study participant analysed analyse six parasitological preparations (Hymenolepis diminuta, artefacts, Trichuris trichiura, Enterobius vermicularis, Giardia intestinalis and Entamoeba sp., Iodamoeba bütschlii and artefacts.
- (2)
- The slides were displayed in a predetermined order, each for 60 s; however, the participants could make the decision to stop watching the slides before the specified time deadline.
- (3)
- After watching each slide, the participant had to decide what he/she saw on the presented preparation, and in the questionnaire he/she had to tick one or more checkbox.
- (4)
- The multiple-choice questions encompassed five options: three parasites, artefacts and an “I don’t know” option.
- (5)
- It is worth adding that all the participants of the study had valid medical qualifications, enabling them to study medical faculties and practice the profession, which eliminates the possibility of distorting the test results by possible vision defects. The presented preparations did not contain any content that was not discussed during the didactic classes in which the surveyed students participated.
2.5. Statistics
3. Results
3.1. Quantitative Analysis
- (1)
- Hymenolepis diminuta. The analysis showed statistically significant differences in the distribution of diagnoses across respondents from the examined groups. Experts B (100%) and Students (85.71%) provided the highest number of incorrect diagnoses, compared to 43.75% by Experts A. The difference was statistically significant.
- (2)
- Artefacts. The analysis did not show statistically significant differences in the distribution of diagnoses across respondents from the examined groups. Experts B (70%) and Experts A (56.25%) made the most incorrect diagnoses, with Students (64.29%) providing the highest percentage of correct diagnoses. However, the difference was not statistically significant.
- (3)
- Trichuris trichiura. The analysis showed statistically significant differences in the distribution of diagnoses across respondents from the examined groups. Experts B (80%) provided for the highest number of incorrect diagnoses, whereas Experts A (100%) and Students (94.64%) made most of the correct ones. The difference was statistically significant.
- (4)
- Enterobius vermicularis. The analysis showed statistically significant differences in the distribution of diagnoses across respondents from the examined groups. Experts B (90%) provided the highest number of incorrect diagnoses, whereas Students (76.79%) and Experts A (62.50%) made most of the correct ones. The difference was statistically significant.
- (5)
- Giardia intestinalis and Entamoeba sp. The analysis showed statistically significant differences in the distribution of diagnoses across respondents from the examined groups. Experts B (100%) and Students (96%) provided the highest number of incorrect diagnoses, compared to 25% by Experts A. The difference was statistically significant.
- (6)
- Iodamoeba bütschlii and artefacts. The analysis did not show any significant differences in the distribution of correct diagnoses in respondents from the examined groups—incorrect diagnoses in all groups exceeded 80% (Supplementary Figure S1, Table 1).
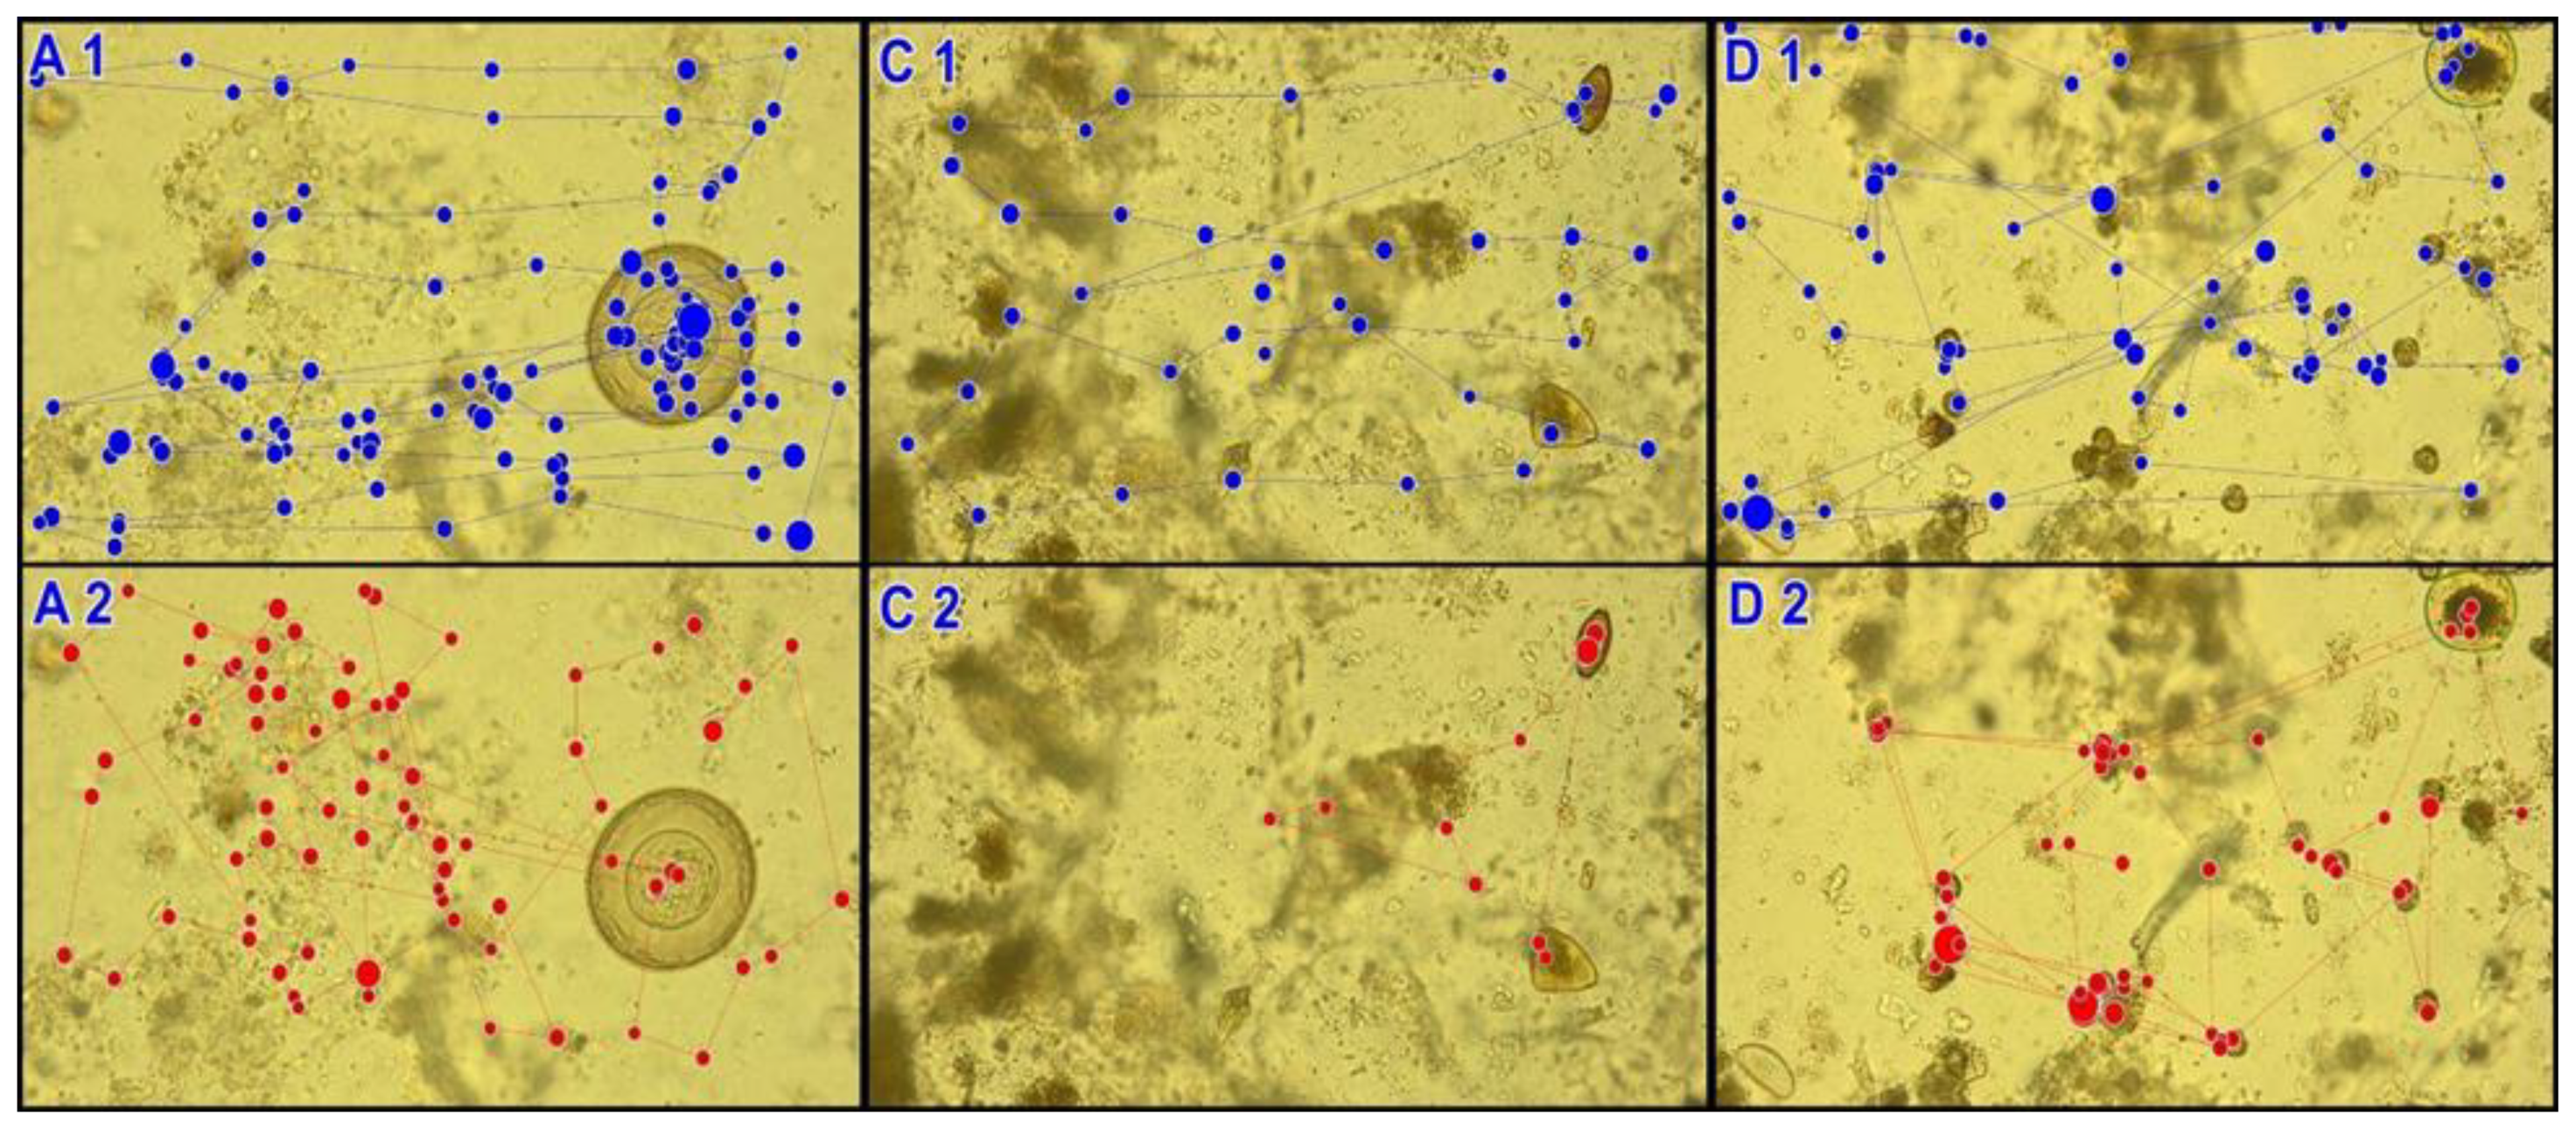
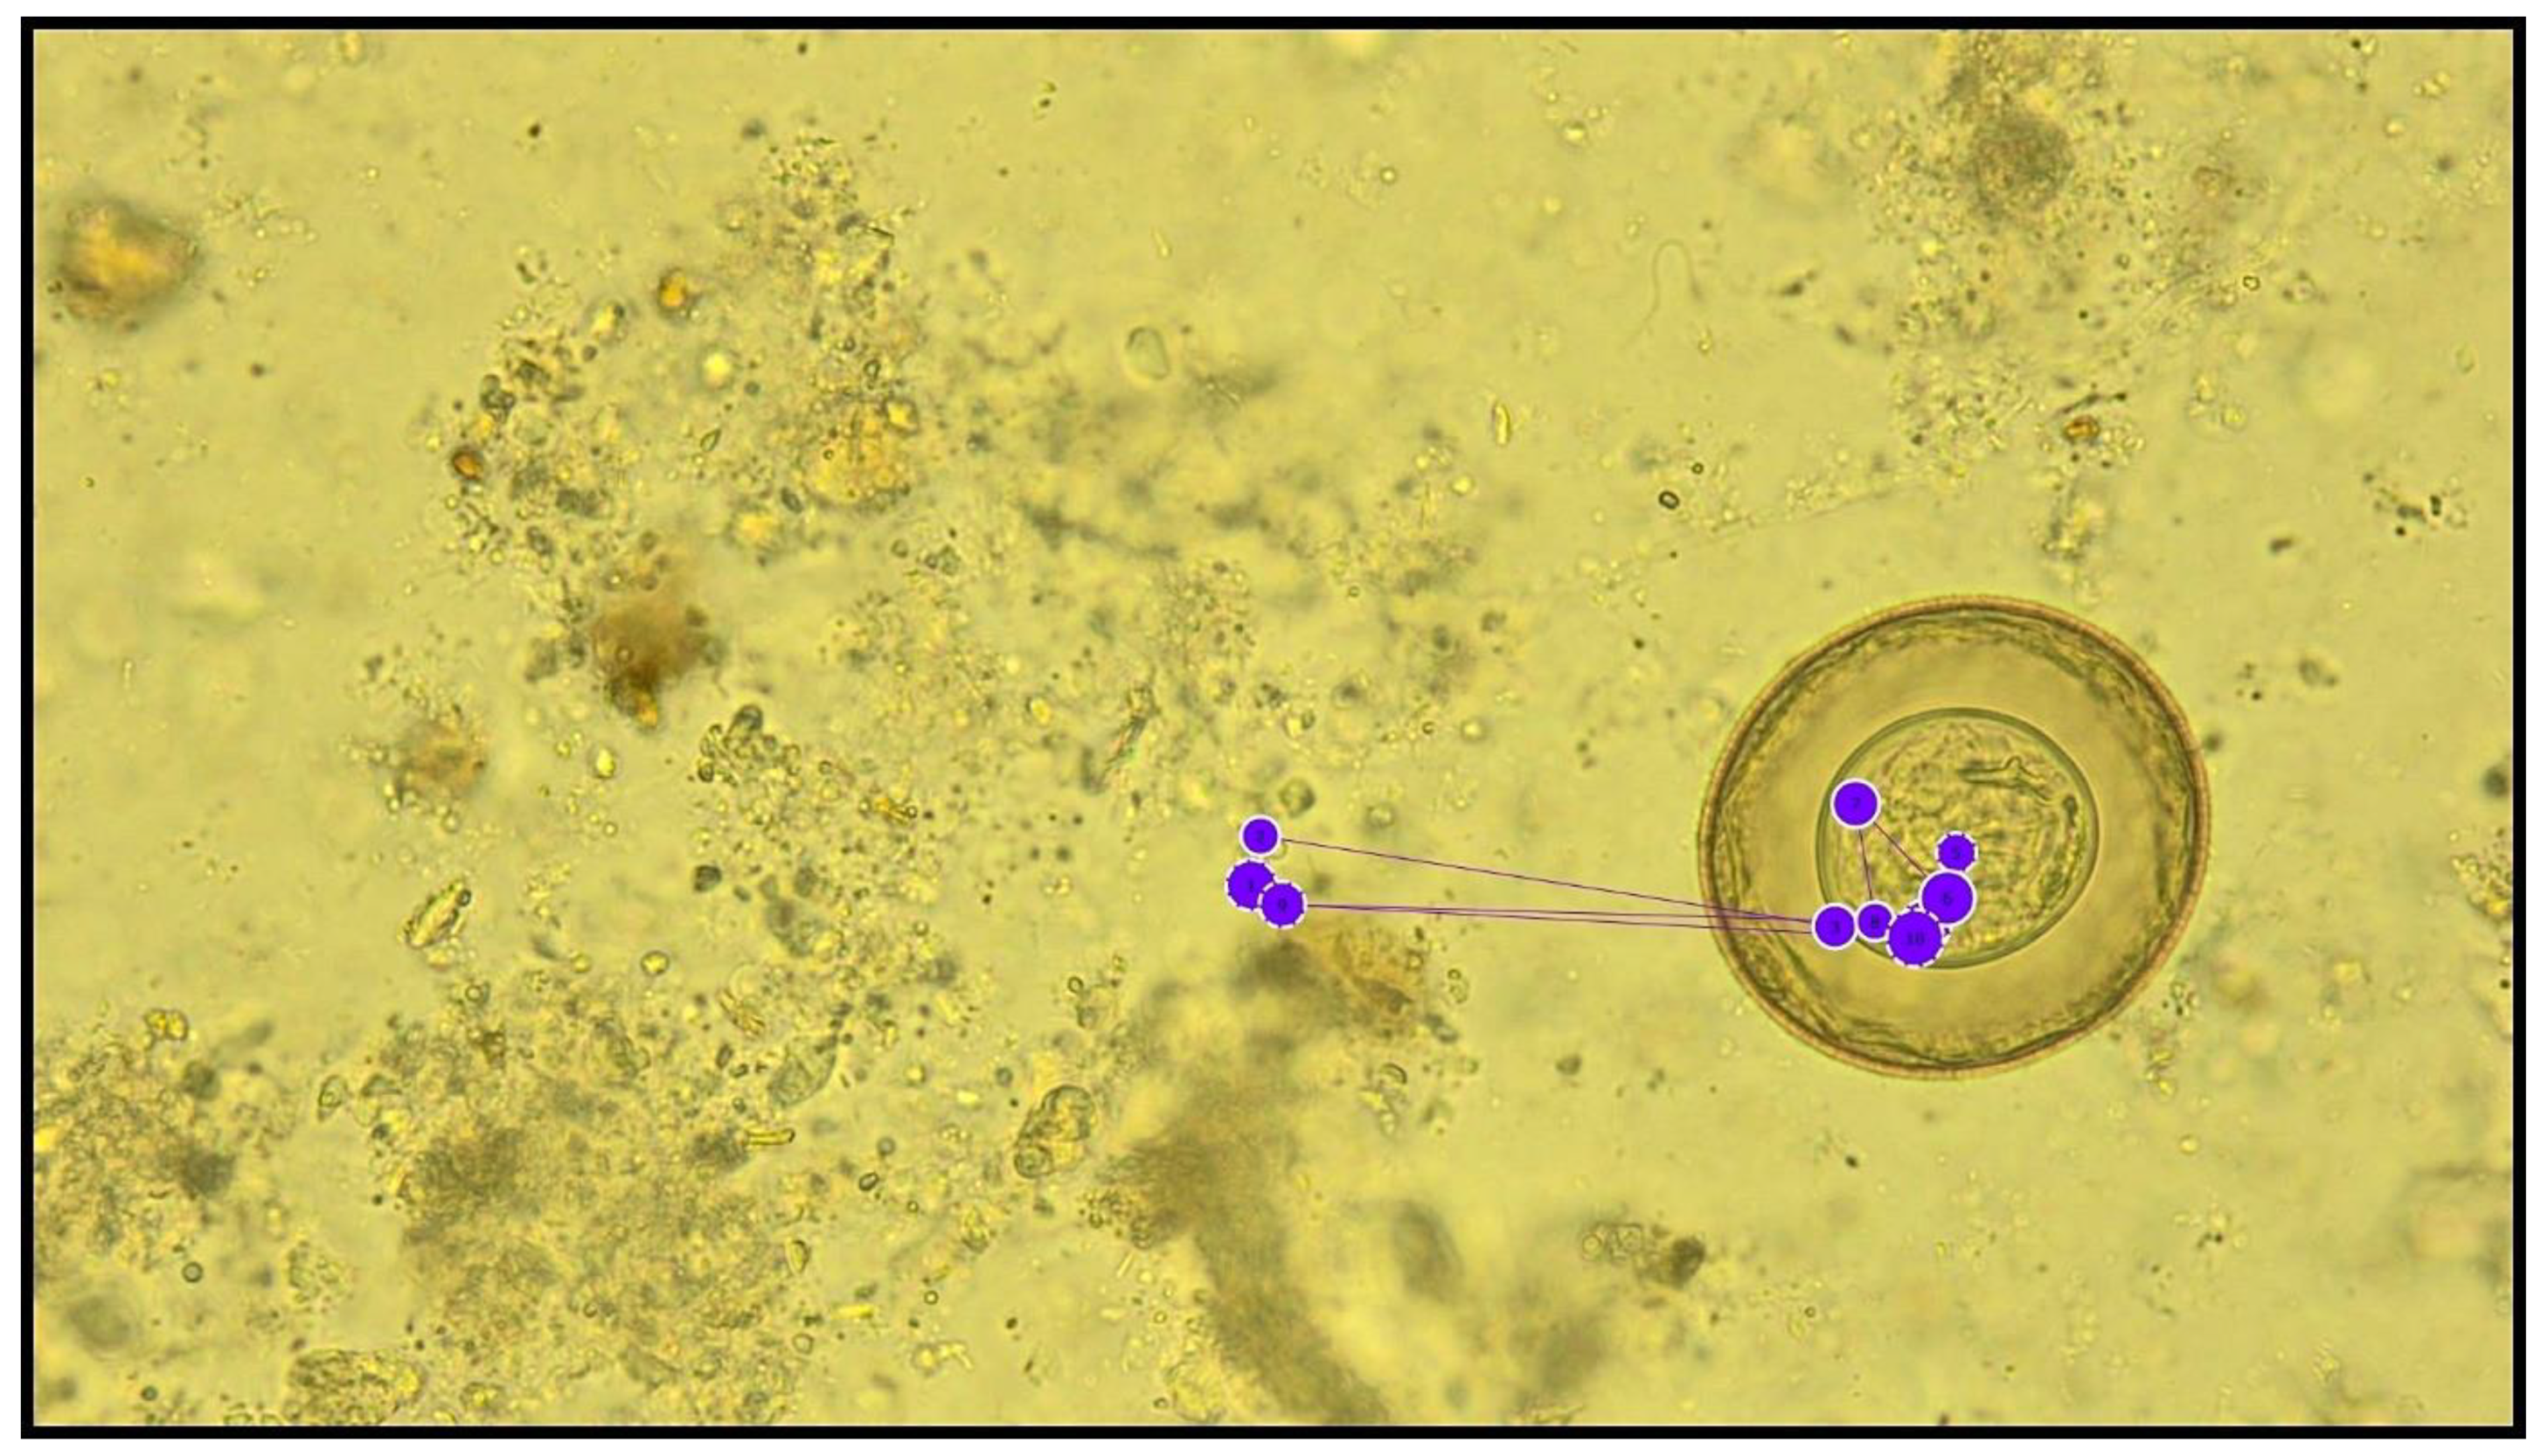
3.2. Qualitative Analysis
4. Discussion
5. Conclusions
Supplementary Materials
Author Contributions
Funding
Institutional Review Board Statement
Informed Consent Statement
Data Availability Statement
Conflicts of Interest
References
- Brunyé, T.T.; Drew, T.; Weaver, D.L.; Elmore, J.G. A review of eye tracking for understanding and improving diagnostic interpretation. Cogn. Res. Princ. Implic. 2019, 4, 7. [Google Scholar] [CrossRef]
- Jarodzka, H.; Holmqvist, K.; Gruber, H. Eye tracking in Educational Science: Theoretical frameworks and research agendas. J. Eye Mov. Res. 2017, 10, 1–8. [Google Scholar] [CrossRef]
- Kok, E.M.; Jarodzka, H. Before your very eyes: The value and limitations of eye tracking in medical education. Med. Educ. 2017, 51, 114–122. [Google Scholar] [CrossRef] [PubMed]
- Ashraf, H.; Sodergren, M.H.; Merali, N.; Mylonas, G.; Singh, H.; Darzi, A. Eye-tracking technology in medical education: A systematic review. Med. Teach. 2018, 40, 62–69. [Google Scholar] [CrossRef] [PubMed]
- Jaarsma, T.; Jarodzka, H.; Nap, M.; Van Merriénboer, J.J.G.; Boshuizen, H.P.A. Expertise under the microscope: Processing histopathological slides. Med. Educ. 2014, 48, 292–300. [Google Scholar] [CrossRef] [PubMed]
- Nielsona, J.A.; Mamidala, R.N.; Khan, J. In-situ eye-tracking of emergency physician result review. Stud. Health Technol. Inform. 2013, 192, 1156. [Google Scholar]
- Ahmidi, N.; Hager, G.D.; Ishii, L.; Fichtinger, G.; Gallia, G.L.; Ishii, M. Surgical task and skill classification from eye tracking and tool motion in minimally invasive surgery. In MICCAI 2010: Medical Image Computing and Computer-Assisted Intervention, Proceedings of the International Conference on Medical Image Computing and Computer-Assisted Intervention, Beijing, China, 20–24 September 2010; Springer: Berlin/Heidelberg, Germany, 2010; Volume 13, pp. 295–302. [Google Scholar] [CrossRef] [Green Version]
- Law, B.; Atkins, M.S.; Kirkpatrick, A.E.; Lomax, A.J. Eye gaze patterns differentiate novice and experts in a virtual laparoscopic surgery training environment. In Proceedings of the 2004 Eye Tracking Research and Applications Symposium, San Antonio, TX, USA, 22–24 March 2004; ACM Press: New York, NY, USA, 2004; pp. 41–48. [Google Scholar]
- Tien, G.; Atkins, M.S.; Zheng, B.; Swindells, C. Measuring situation awareness of surgeons in laparoscopic training. In Proceedings of the Eye Tracking Research and Applications ETRA, Austin, TX, USA, 22–24 March 2010; pp. 149–152. [Google Scholar]
- Zheng, B.; Tien, G.; Atkins, S.M.; Swindells, C.; Tanin, H.; Meneghetti, A.; Qayumi, K.A.; Panton, O.N.M. Surgeon’s vigilance in the operating room. Am. J. Surg. 2011, 201, 673–677. [Google Scholar] [CrossRef] [PubMed]
- Forsman, J.; Anani, N.; Eghdam, A.; Falkenhav, M.; Koch, S. Integrated information visualization to support decision making for use of antibiotics in intensive care: Design and usability evaluation. Inform. Health Soc. Care 2013, 38, 330–353. [Google Scholar] [CrossRef] [PubMed]
- King, A.J.; Hochheiser, H.; Visweswaran, S.; Clermont, G.; Cooper, G.F. Eye-tracking for clinical decision support: A method to capture automatically what physicians are viewing in the EMR. AMIA Jt. Summits Transl. Sci. Proc. 2017, 2017, 512–521. [Google Scholar] [PubMed]
- King, A.J.; Cooper, G.F.; Clermont, G.; Hochheiser, H.; Hauskrecht, M.; Sittig, D.F.; Visweswaran, S. Leveraging Eye Tracking to Prioritize Relevant Medical Record Data: Comparative Machine Learning Study. J. Med. Internet Res. 2020, 22, e15876. [Google Scholar] [CrossRef]
- Jarodzka, H.; Scheiter, K.; Gerjets, P.; van Gog, T. In the eyes of the beholder: How experts and novices interpret dynamic stimuli. Learn. Instr. 2010, 20, 146–154. [Google Scholar] [CrossRef] [Green Version]
- Jarodzka, H.; van Gog, T.; Dorr, M.; Scheiter, K.; Gerjets, P. Learning to see: Guiding students’ attention via a Model’s eye movements fosters learning. Learn. Instr. 2013, 25, 62–70. [Google Scholar] [CrossRef]
- Jabbar, A.; Gauci, C.G.; Anstead, C.A. Parasitology Education Before and After the COVID-19 Pandemic. Trends Parasitol. 2021, 37, 3–6. [Google Scholar] [CrossRef]
- Ahmed, H.; Allaf, M.; Elghazaly, H. COVID-19 and medical education. Lancet Infect. Dis. 2020, 20, 777–778. [Google Scholar] [CrossRef] [Green Version]
- Dewhurst, R.; Nyström, M.; Jarodzka, H.; Foulsham, T.; Johansson, R.; Holmqvist, K. It depends on how you look at it: Scanpath comparison in multiple dimensions with MultiMatch, a vector-based approach. Behav. Res. Methods 2012, 44, 1079–1100. [Google Scholar] [CrossRef] [Green Version]
- Fuhl, W.; Castner, N.; Kübler, T.; Lotz, A.; Rosenstiel, W.; Kasneci, E. Ferns for area of interest free scanpath classification. In Proceedings of the 11th ACM Symposium on Eye Tracking Research & Applications, ETRA ’19, Denver, CO, USA, 25–28 June 2019; Volume 39, p. 39. [Google Scholar]
- Kübler, T.C.; Rothe, C.; Schiefer, U.; Rosenstiel, W.; Kasneci, E. SubsMatch 2.0: Scanpath comparison and classification based on subsequence frequencies. Behav. Res. Methods 2017, 49, 1048–1064. [Google Scholar] [CrossRef] [Green Version]
- Fuhl, W.; Bozkir, E.; Hosp, B.; Castner, N.; Geisler, D.; Santini, T.C.; Kasneci, E. Encodji. In Proceedings of the 11th ACM Symposium on Eye Tracking Research & Applications, ETRA ’19, Denver, CO, USA, 25–28 June 2019; Volume 64, p. 64. [Google Scholar]
- Tobii, A.B. Tobii Studio User’s Manual. Version 3.4.5. Available online: https://www.tobiipro.com/siteassets/tobii-pro/user-manuals/tobii-pro-studio-user-manual.pdf (accessed on 9 June 2021).
- Goldberg, J.H.; Kotval, X.P. Computer interface evaluation using eye movements: Methods and constructs. Int. J. Ind. Ergon. 1999, 24, 631–645. [Google Scholar] [CrossRef]
- Poole, A.; Ball, L.J. Eye Tracking in HCI and Usability Research. In Encyclopedia of Human Computer Interaction; Ghaoui, C., Ed.; Idea Group, Inc.: Hershey, PA, USA, 2006; pp. 211–219. [Google Scholar]
- Poole, A.; Ball, L.J.; Phillips, P. In search of salience: A response time and eye movement analysis of bookmark recognition. In People and Computers XVIII-Design for Life: Proceedings of HCI; Fincher, S., Markopolous, P., Moore, D., Ruddle, R., Eds.; Springer: London, UK, 2004; pp. 363–378. [Google Scholar]
- Leigh, R.J.; Zee, D.S. The Neurology of Eye Movements, 3rd ed.; Oxford University Press: Oxford, UK, 1999. [Google Scholar]
- Krauzlis, R.J. Eye Movements. In Fundamental Neuroscience, 3rd ed.; Elsevier: Amsterdam, The Netherlands, 2008. [Google Scholar]
- Wang, R.; Chen, L.; Ayesh, A.; Shell, J.; Solheim, I. Gaze-Based Assessment of Dyslexic Students’ Motivation within an E-Learning Environment. In Proceedings of the 2019 IEEE SmartWorld, Ubiquitous Intelligence & Computing, Advanced & Trusted Computing, Scalable Computing & Communications, Cloud & Big Data Computing, Internet of People and Smart City Innovation (SmartWorld/SCALCOM/UIC/ATC/CBDCom/IOP/SCI), Leicester, UK, 19–23 August 2019. [Google Scholar]
- Hofstetter, H.; Griffin, J.R.; Berman, M.S.; Everson, R.W. Dictionary of Visual Science and Related Clinical Terms, 5th ed.; Butterworth-Heinemann: Oxford, UK, 2000. [Google Scholar]
- Noton, D.; Stark, L.W. Scan paths in eye movements during pattern perception. Science 1971, 171, 308–311. [Google Scholar] [CrossRef] [PubMed]
- Noton, D.; Stark, L.W. Eye movements and visual perception. Sci. Am. 1971, 224, 35–43. [Google Scholar] [PubMed]
- Myjak, P.; Głowniak, C.; Gołąb, E.; Jaborowska-Jarmoluk, M.; Kosik-Bogacka, D.; Matowicka-Karna, J.; Nowak, P.; Pietkiewicz, H.; Szostakowska, B.; Wnukowska, N.; et al. Standards in the range of laboratory activities in medical parasitology, estimation of their quality and diagnostics value, as well as interpretation and authorization of the tests results (proposals). J. Lab. Diagn. 2011, 47, 341–351. [Google Scholar]
- Tuszyńska-Bogucka, W.; Kwiatkowski, B.; Chmielewska, M.; Dzieńkowski, M.; Kocki, W.; Pełka, J.; Przesmycka, N.; Bogucki, J.; Galkowski, D. The effects of interior design on wellness—Eye tracking analysis in determining emotional experience of architectural space. A survey on a group of volunteers from the Lublin Region, Eastern Poland. Ann. Agric. Environ. Med. 2020, 27, 113–122. [Google Scholar] [CrossRef] [PubMed]
- Wayne, D.B.; Green, M.; Neilson, E.G. Medical education in the time of COVID-19. Sci. Adv. 2020, 6, eabc7110. [Google Scholar] [CrossRef]
- Jumreornvong, O.; Yang, E.; Race, J.; Appel, J. Telemedicine and Medical Education in the Age of COVID-19. Acad. Med. 2020, 95, 1838–1843. [Google Scholar] [CrossRef]
- Caruso, M.C. Virtual Microscopy and Other Technologies for Teaching Histology during Covid-19. Anat. Sci. Educ. 2021, 14, 19–21. [Google Scholar] [CrossRef]
- Rhoads, D.D.; Mathison, B.A.; Bishop, H.S.; Da Silva, A.J.; Pantanowitz, L. Review of Telemicrobiology. Arch. Pathol. Lab. Med. 2016, 140, 362–370. [Google Scholar] [CrossRef] [PubMed]
- Ekeland, A.G.; Bowes, A.; Flottorp, S. Effectiveness of telemedicine: A systematic review of reviews. Int. J. Med. Inform. 2010, 79, 736–771. [Google Scholar] [CrossRef] [PubMed] [Green Version]
- Pfeiffer, C.N.; Jabbar, A. Adaptive e-Learning: Emerging Digital Tools for Teaching Parasitology. Trends Parasitol. 2019, 35, 270–274. [Google Scholar] [CrossRef] [PubMed]
- Jabbar, A.; Gasser, R.B.; Lodge, J. Can New Digital Technologies Support Parasitology Teaching and Learning? Trends Parasitol. 2016, 32, 522–530. [Google Scholar] [CrossRef]
- Jabbar, A.; Gasser, R.B. Special issue—Learning and teaching of veterinary parasitology. Vet. Parasitol. 2018, 253, 120–121. [Google Scholar] [CrossRef]
- Peña-Fernández, A.; Acosta, L.; Fenoy, S.; Magnet, A.; Izquierdo, F.; Bornay, F.J.; Ollero, M.D.; Hurtado, C.; Del Aguila, C. Evaluation of a novel digital environment for learning medical parasitology. High. Educ. Pedagog. 2020, 5, 1–18. [Google Scholar] [CrossRef] [Green Version]
- Meléndez, R.D. Trends in teaching parasitology: Where to complain? Trends Parasitol. 2003, 19, 387. [Google Scholar] [CrossRef]
- Mathison, B.A. What Can the CDC Do for You? Telediagnosis and Molecular Technologies for Diagnosing Parasitic Diseases. In Proceedings of the 114th ASM General Meeting, Boston, MA, USA, 17–20 May 2014. [Google Scholar]
- Mathison, B.A.; Bishop, H.; Eberhard, M.L.; Johnston, S.P.; Long, E.K.; da Silva, A.J. Usefulness of telediagnosis in the identification of tissue parasites: An evaluation based on two years (from 2006–2008) of telediagnosis submissions to the CDC DPDx Project. In Proceedings of the 57th American Society of Tropical Medicine and Hygiene Annual Meeting, New Orleans, LA, USA, 7–11 December 2008. [Google Scholar]
- Rodak, B.F.; Fritsma, G.A.; Doig, K. Hematology—Clinical Principles and Applications, 3rd ed.; Saunders: Philadelphia, PA, USA, 2007. [Google Scholar]
- Keller, E.L.; Lee, B.-T.; Lee, K.-M. Frontal eye field signals that may trigger the brainstem saccade generator. Prog. Brain Res. 2008, 171, 107–114. [Google Scholar] [CrossRef]
- Wong, A.M.F. Eye Movements; Saccades, Encyclopedia of the Neurological Sciences, 2nd ed.; Academic Press: Oxford, UK, 2014; pp. 249–251. [Google Scholar]
- Humphrey, K.; Underwood, G. Domain knowledge moderates the influence of visual saliency in scene recognition. Br. J. Psychol. 2009, 100, 377–398. [Google Scholar] [CrossRef] [PubMed] [Green Version]
- Tatler, B.W.; Baddeley, R.J.; Vincent, B. The long and the short of it: Spatial statistics at fixation vary with saccade amplitude and task. Vis. Res. 2006, 46, 1857–1862. [Google Scholar] [CrossRef] [Green Version]
- Micic, D.; Ehrlichman, H.; Chen, R. Why do we move our eyes while trying to remember? The relationship between non-visual gaze patterns and memory. Brain Cogn. 2010, 74, 210–224. [Google Scholar] [CrossRef] [PubMed]
- Płużyczka, M.; Warszawski, U. Przestrzenne ruchy sakadowe a pamięć długotrwała [Spatial saccadic movements and long-term memory]. Lingwist. Stosow. 2016, 20, 101–118. [Google Scholar] [CrossRef]
- Commision of European Communities. Making a European Area of Lifelong Learning a Reality; COM 678 Final; Commision of European Communities: Brussels, Belgium, 2014. [Google Scholar]


| Slides | Experts A | Experts B | Students | χ2 Pearson | p | |||
|---|---|---|---|---|---|---|---|---|
| COR | INCOR | COR | INCOR | COR | INCOR | |||
| Hymenolepis diminuta | 43.75 | 56.25 | 0 | 100 | 14.29 | 85.71 | 9.777 * | 0.007 * |
| Artefacts | 43.75 | 56.25 | 30 | 70 | 64.29 | 35.71 | 5.280 | 0.071 |
| Trichuris trichiura | 100 | 0 | 20 | 80 | 94.64 | 5.36 | 43.780 * | 0.0000 * |
| Enterobius vermicularis | 62.5 | 37.5 | 10 | 90 | 76.79 | 23.21 | 16.929 * | 0.0002 * |
| Giardia intestinalis and Entamoeba sp. | 25 | 75 | 0 | 100 | 3.57 | 66.43 | 9.325 * | 0.0094 * |
| Iodamoeba bütschlii and artefacts | 18.75 | 81.25 | 20 | 80 | 7.14 | 92.86 | 2.665 | 0.263 |
Publisher’s Note: MDPI stays neutral with regard to jurisdictional claims in published maps and institutional affiliations. |
© 2021 by the authors. Licensee MDPI, Basel, Switzerland. This article is an open access article distributed under the terms and conditions of the Creative Commons Attribution (CC BY) license (https://creativecommons.org/licenses/by/4.0/).
Share and Cite
Kołodziej, P.; Tuszyńska-Bogucka, W.; Dzieńkowski, M.; Bogucki, J.; Kocki, J.; Milosz, M.; Kocki, M.; Reszka, P.; Kocki, W.; Bogucka-Kocka, A. Eye Tracking—An Innovative Tool in Medical Parasitology. J. Clin. Med. 2021, 10, 2989. https://doi.org/10.3390/jcm10132989
Kołodziej P, Tuszyńska-Bogucka W, Dzieńkowski M, Bogucki J, Kocki J, Milosz M, Kocki M, Reszka P, Kocki W, Bogucka-Kocka A. Eye Tracking—An Innovative Tool in Medical Parasitology. Journal of Clinical Medicine. 2021; 10(13):2989. https://doi.org/10.3390/jcm10132989
Chicago/Turabian StyleKołodziej, Przemysław, Wioletta Tuszyńska-Bogucka, Mariusz Dzieńkowski, Jacek Bogucki, Janusz Kocki, Marek Milosz, Marcin Kocki, Patrycja Reszka, Wojciech Kocki, and Anna Bogucka-Kocka. 2021. "Eye Tracking—An Innovative Tool in Medical Parasitology" Journal of Clinical Medicine 10, no. 13: 2989. https://doi.org/10.3390/jcm10132989
APA StyleKołodziej, P., Tuszyńska-Bogucka, W., Dzieńkowski, M., Bogucki, J., Kocki, J., Milosz, M., Kocki, M., Reszka, P., Kocki, W., & Bogucka-Kocka, A. (2021). Eye Tracking—An Innovative Tool in Medical Parasitology. Journal of Clinical Medicine, 10(13), 2989. https://doi.org/10.3390/jcm10132989