
Management of High-Risk Atherosclerotic Patients by Statins May Be Supported by Logistic Model of Intima-Media Thickening

 ,
,  , ,
, ,
Abstract
:1. Introduction
2. Cardio Poznan Data
3. Support for S-Shaped Growth of the Atherosclerotic Plaque
3.1. Importance of S-Shaped Growth for Atherosclerosis Treatment
3.2. The S-Shape Conjecture
- is an initial condition;
- c (called “carrying capacity” in population dynamics) is the terminal size of IMT toward which a patient’s plaque size converges, given this patient’s overall health level; presumably, a severely sick patient will have a large c and if, eventually, IMT = c, the artery will not be able to handle this plaque thickness and the patient will pass away;
- a determines the speed of plaque buildup.
4. New Data Support
4.1. Patient Aggregate
- 1.
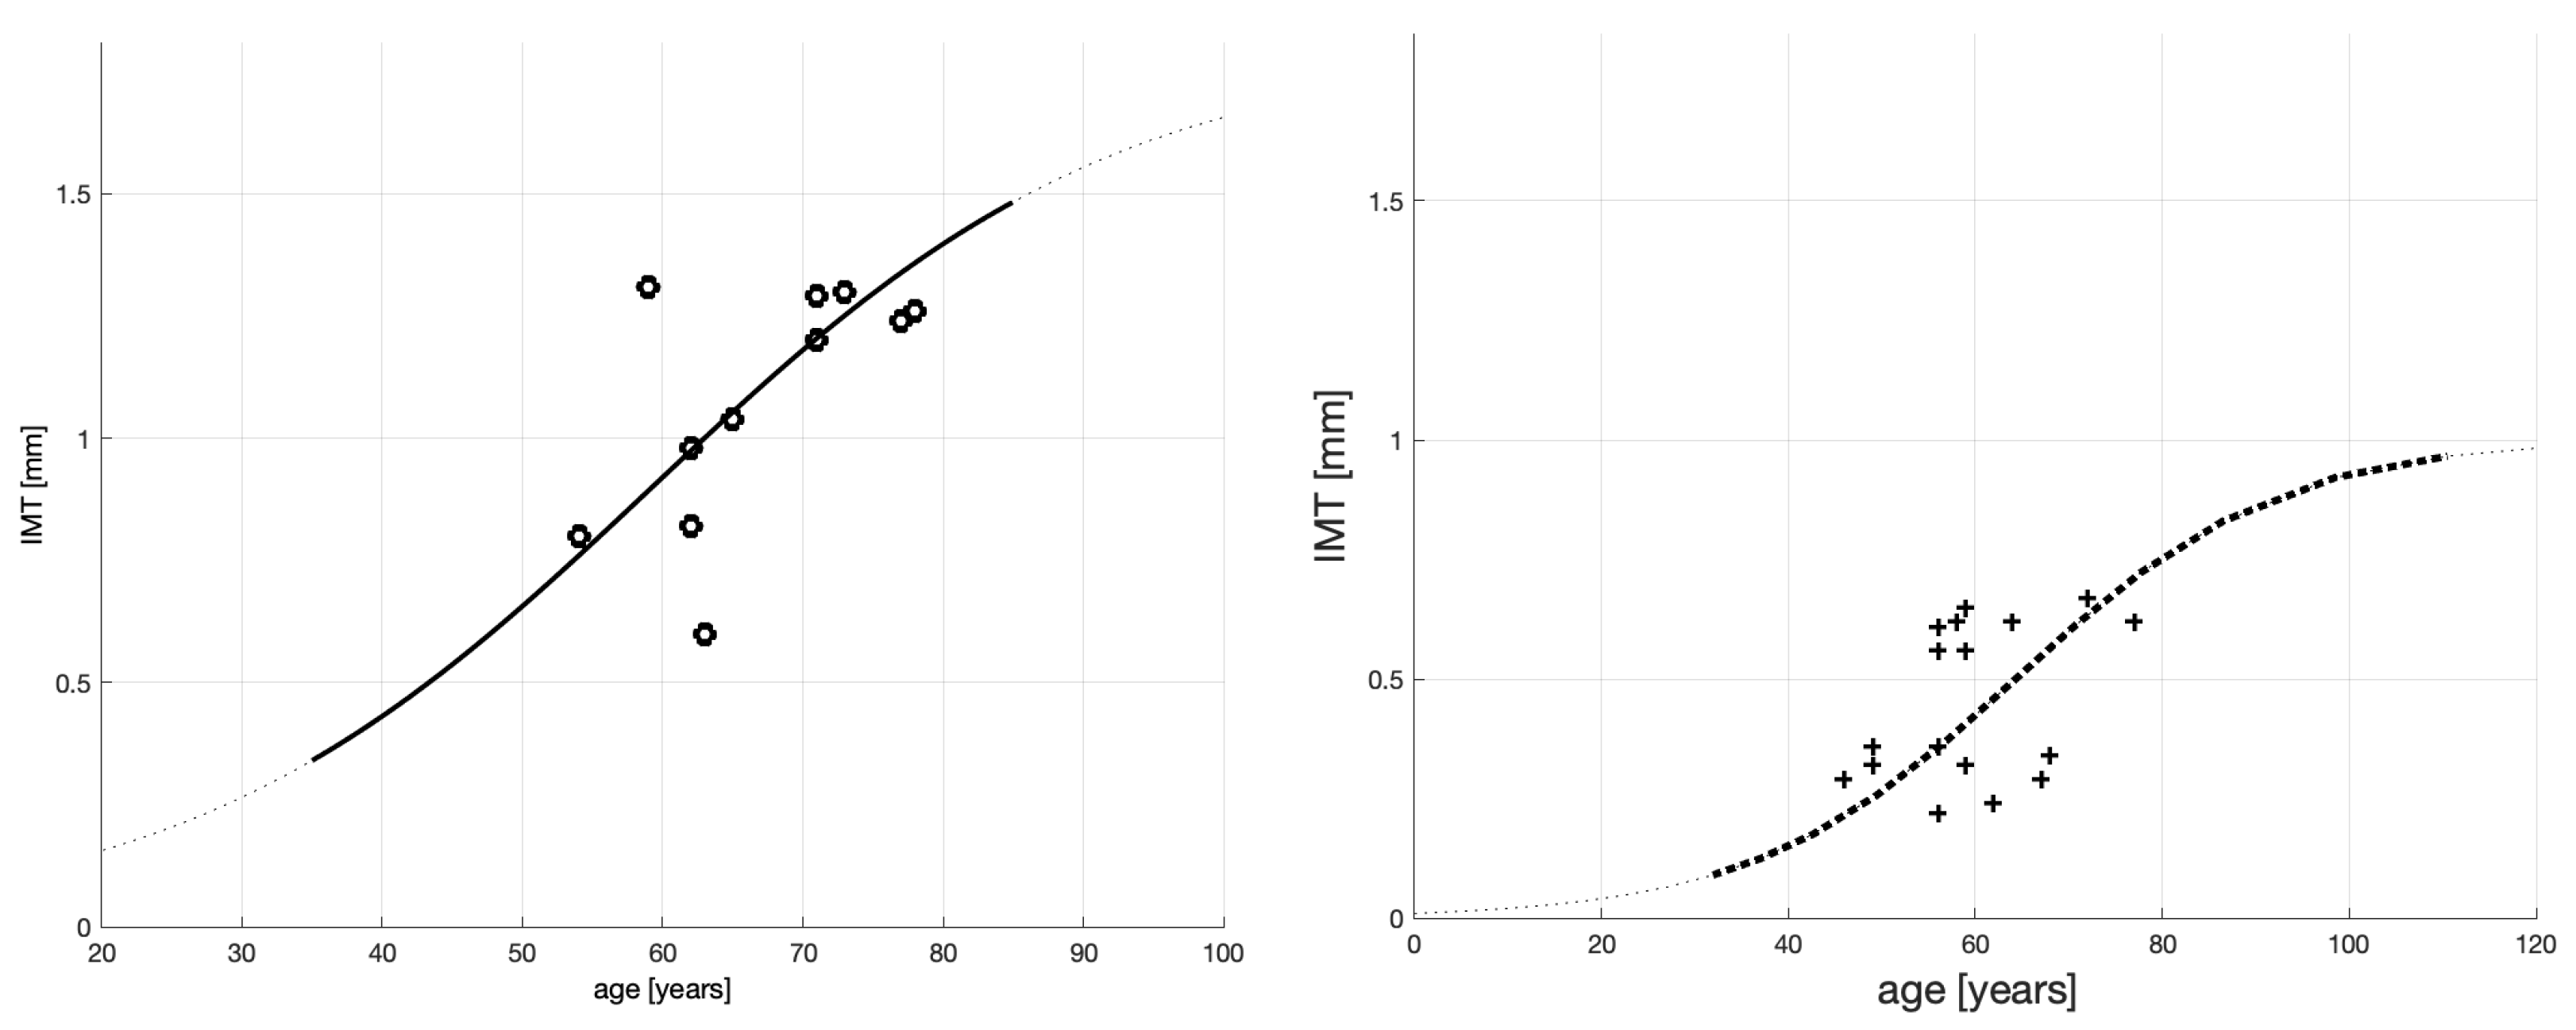
- The 2008–2011 population of sick men on dialysis (shown in Figure 1 left panel; see also the black empty circles in Figure 2) must indeed have been composed of sicker patients than those in the current sample. The black empty circles with a value of IMT over IMT ≥ 1.2 (mm), for example, constitute more than 50% of the whole sample; among the blue and red crosses (current sample), only 1 in 62 exceeds this value.
- 2.
- The old data spread of patient ages (horizontal axis) is much smaller (53–78 years old) than that of the new data (19–74 years old). This, combined with the fairly large spread of the old-sample IMT values (vertical axis), means that the old curve’s steepness ( Figure 1) should be greater than that of the new one (Figure 2). Indeed, we computed the slope on this curve to be between 58 and 67 years old, and it is more than three times larger than the maximum slope reported in Table 2 (i.e., 0.0265 vs. 0.0086). This is consistent with the severity of accelerated atherosclerosis among the-old data patients.
- 3.
- We note that it should be easier to fit a 3-parameter (logistic) curve to 9 observations than to 62. Therefore, the distance between an observation point and its model should be shorter in the old model, but it is not. Remarkably, the RMSE of the new model is smaller than that of the old one. This indicates that the logistic model for the new data guarantees a smaller mean distance between an observation point and its logistic model’s value. Therefore, in terms of these distances, the new logistic model is better aligned with the new data than the old model was with the old data.
- 4.
- The new model is smaller than that of the old model, which is an undesirable result. However, small or even negative values of may occur when fitting non-linear functions to data. Our model is non-linear. Therefore, alone cannot be used to judge how good, or bad, our model is.
4.2. Non-Medicated, Severely Sick Men
- 5.
- As per the goodness-of-fit statistics, the obtained model for the non-medicated, severely sick men is more reliable than that for the aggregate of the severely sick men. In particular, RMSE shrunk from 0.1664 mm for the aggregated patient group to 0.1263 mm for the non-medicated group. This means that the root mean square error (RMSE)—practically, the expected distance between an actual measurement and the corresponding model value— diminished by about 25%.
- 6.
- SSE and also improved (the latter only marginally).
- 7.
- 8.
- Patient age when the plaque growth is maximum (see the inflection points marked by the beige circles in each figure) differs between the groups. The maxima are 38 and 21 years old
- 9.
- The non-medicated patient model’s is slightly larger than that of the aggregate group. We cannot though dwell on this improvement, however, since both models’ determination coefficients are very small.
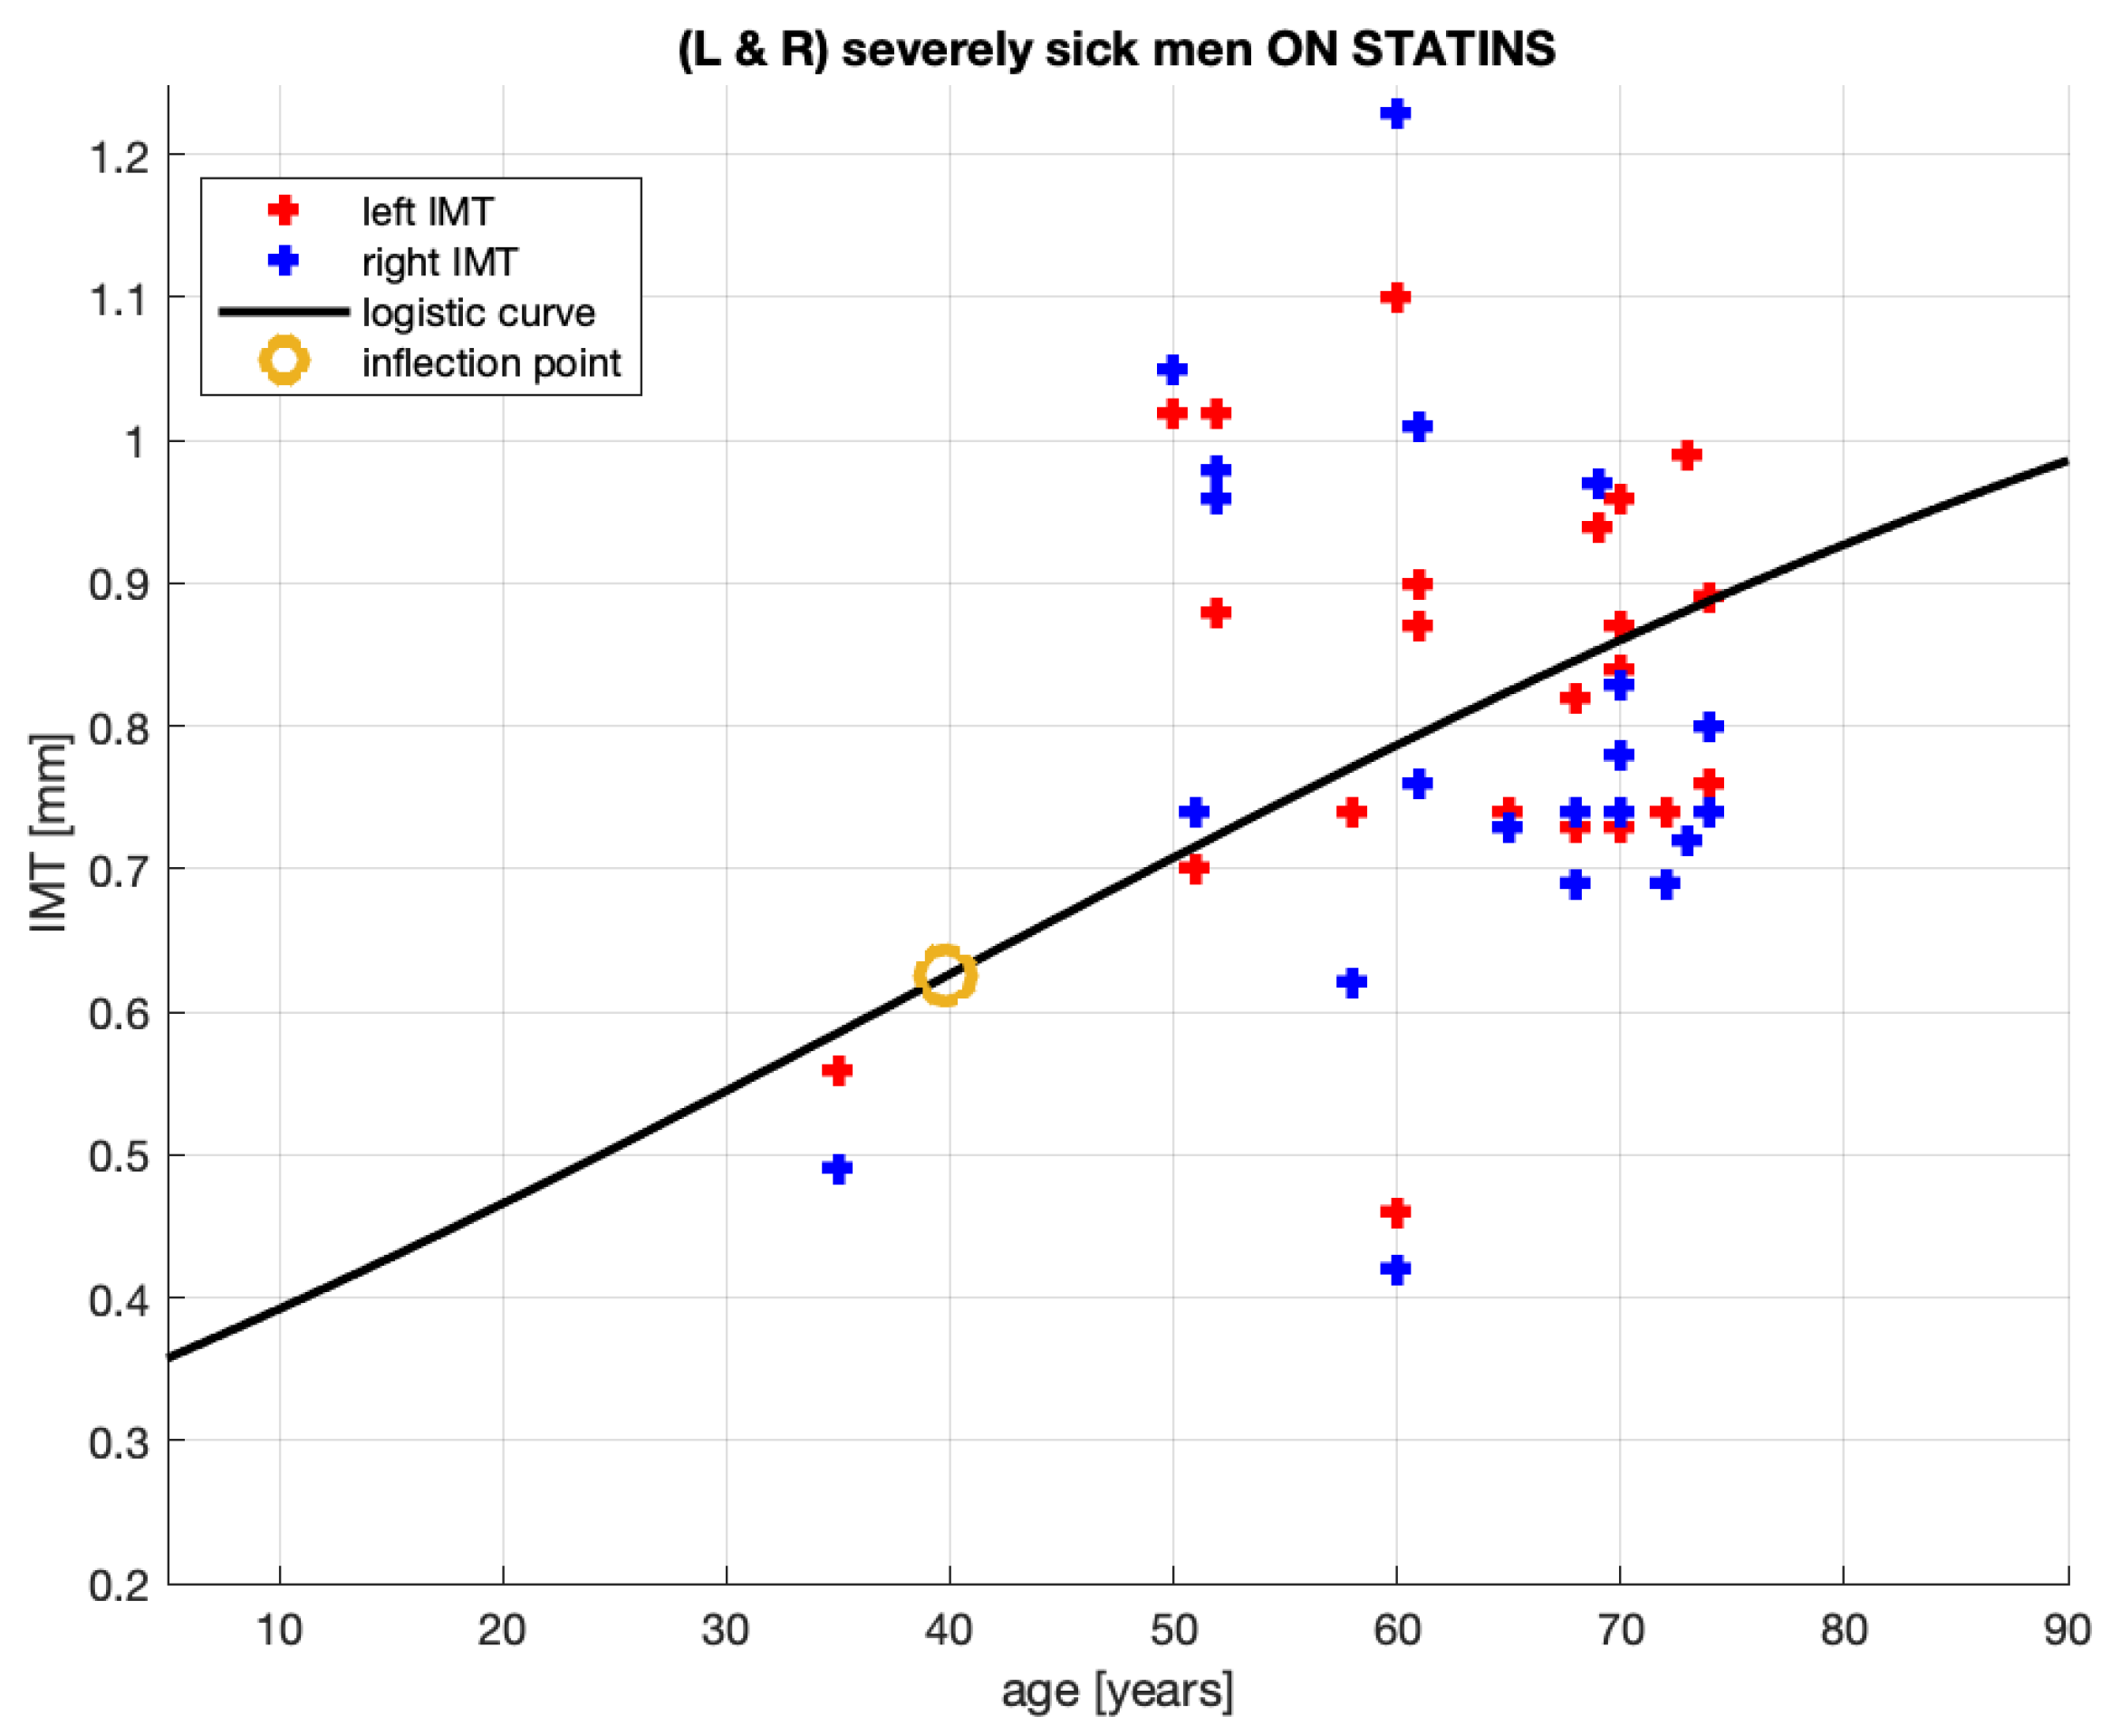
4.3. Statin-Medicated, Severely Sick Men
- 10.
- The group analyzed here, while extracted from the severely sick men aggregate, is not necessarily composed of patients of much the same conditions. It is composed of patients who are severely sick and receive statins. Some patients in this group receive atorvastatin, some others—rosuvastatin, two not identical statin medications; the treatment periods vary between 2 and 36 months; the doses vary between 5 and 40 [mg]. This implies that—in this group—some patients may have suffered from an advanced stage of atherosclerosis mitigated by statins administered for short or for long periods. Undoubtedly, these inhomogeneities will complicate obtaining a reliable quantitative relationship between the age and plaque thickness formation.
- 11.
- 12.
- 13.
- Qualitatively, the model corresponds quite well to the intuition we may have about this patient group. To be medicated, their initial conditions should be worse than in the aggregate of the medicated and non-medicated patients. Indeed, the levels are , where the first number is for the statin-medicated group and the second is for the aggregate. Their c levels suggest that should these patients have remained non-medicated, the plaque would have grown larger in the medicated group than in the aggregate. The patients are being medicated and, as a result of that, the plaque grows at a slower pace for these patients than for the patient aggregate. See the coefficients a and the maximum slopes document.
- 14.
- The slower plaque growth in the medicated patients is also observed in Figure 5: the dash-dotted (blue) line remains below the solid (black) line, where the latter corresponds to the patient aggregate.
- 15.
- The goodness-of-fit statistics of the statin-medicated patient model do not suggest that this model is better than the one proposed for the patient aggregate. Although SSE has improved (), the expected distances between an actual measurement and the corresponding model’s value (RMSE ) and have worsened. We remind the reader that even should not alone disqualify a nonlinear model.
5. How to Infer an Optimal Age for Starting Statin Treatment
6. Limitations and Strength of This Study
7. Concluding Remarks
Author Contributions
Funding
Institutional Review Board Statement
Informed Consent Statement
Data Availability Statement
Conflicts of Interest
Appendix A. CARDIO POZNAN DATA—Summary Statistics

| All [n = 31] | Statin(−) [n = 9] | Statin(+) [n = 22] | |
|---|---|---|---|
| Age [years] | 58.3 (13.4) | 47.4 (14.9) | 62.6 (10.2) |
| 70 years + | 8 (25.8) | 0 | 8 (36.4) |
| Height [m] | 1.77 (0.08) | 1.83 (0.08) | 1.75 (0.07) |
| Weight [kg] | 92.2 (16.7) | 106.4 (21.3) | 96.2 (13.9) |
| BMI [kg/m2] | 32.3 (4.8) | 32.7 (6.5) | 32.2 (4.1) |
| Obesity (BMI > 30 kg/m2) | 19 (61.3) | 5( 55.6) | 14 (63.6) |
| CAD | 18 (58.1) | 1 (11.1) | 17 (77.3) |
| ACS in history | 7 (22.6) | 0 | 7 (31.8) |
| PVD | 16 (51.6) | 2 (22.2) | 14 (63.6) |
| Cerebral * | 16 (51.6) | 2 (22.2) | 14 (63.6) |
| stroke | 2 (6.5) | 0 | 2 (9.1) |
| Lower extremities | 5 (16.1) | 0 | 5 (22.7) |
| CKD ** | 7 (22.6) | 3 (33.3) | 4 (18.2) |
| COPD | 3 (9.7) | 1 (11.1) | 2 (9.1) |
| Thyroid diseases | 2 (6.5) | 1 (11.1) | 1 (4.5) |
| GI disorders | 1 (3.2) | 1( 11.1) | 0 |
| Active smokers | 9 (29.0) | 3 (33.3) | 6 (27.3) |
| DM | 12 (38.7) | 2 (22.2) | 10 (45.5) |
| All [n = 31] | Statin(−) [n = 9] | Statin(+) [n = 22] | |
|---|---|---|---|
| WBC [109/L] | 8.02 (1.99) | 8.70 (2.10) | 7.74 (1.91) |
| Neutrophils | 5.14 (1.50) | 5.67 (1.88) | 4.92 (1.29) |
| Lymphocytes | 1.86 (0.66) | 1.95 (0.79) | 1.81 (0.62) |
| NLR | 3.15 (1.69) | 3.67 (2.79) | 2.93 (0.99) |
| RBC [1012/L] | 4.75 (0.30) | 4.78 (0.3) | 4.79 (0.31) |
| HGB [mM/L] | 9.14 (0.74) | 9.20 (1.05) | 9.11 (0.60) |
| Platelets [109/L] | 250 (60) | 251 (43) | 250 (67) |
| PLR | 154.0 (75.1) | 157.5 (87.6) | 152.5 (71.7) |
| Total cholesterol [mM/L] | 4.49 (1.07) | 4.66 (1.07) | 4.42 (1.09) |
| LDL cholesterol | 2.86 (1.21) | 3.37 (1.12) | 2.65 (1.20) |
| HDL cholesterol | 1.12 (0.34) | 1.11 (0.17) | 1.12 (0.26) |
| Triglicerydes [mM/L] | 1.90 (1.43) | 1.64 (0.87) | 2.0 (1.61) |
| Creatinine [mg/dL] | 1.29 (0.80) | 1.65 (1.38) | 1.15 (0.32) |
| eGFR [mL/min/1.73 m2] | 74.8 (26.7) | 76.7 (39.6) | 74.2 (20.5) |
| CRP [mg/L] | 10.3 (3.4) | 8.3 (4.2) | 11.3 (2.9) |
| IMT [mm] | 0.78 (0.16) | 0.70 (0.12) | 0.81 (0.16) |
Appendix B. Assessment of Carotid Intima-Media Thickness (IMT)
Appendix C. Data Management and Statistical Analysis
References
- Formanowicz, D.; Krawczyk, J.B.; Perek, B.; Formanowicz, P. A Control-Theoretic Model of Atherosclerosis. Int. J. Mol. Sci. 2019, 20, 785. [Google Scholar] [CrossRef] [PubMed] [Green Version]
- Formanowicz, D.; Krawczyk, J.B. Controlling the thickness of the atherosclerotic plaque by statin medication. PLoS ONE 2020, 15, e0239953. [Google Scholar] [CrossRef] [PubMed]
- Wang, J.; Bennett, M. Aging and Atherosclerosis: Mechanisms, Functional Consequences, and Potential Therapeutics for Cellular Senescence. Circ. Res. 2012, 111, 245–259. [Google Scholar] [CrossRef] [Green Version]
- Biondi-Zoccai, G.; Mastrangeli, S.; Romagnoli, E.; Peruzzi, M.; Frati, G.; Roever, L.; Giordano, A. What We Have Learned from the Recent Meta-analyses on Diagnostic Methods for Atherosclerotic Plaque Regression. Curr. Atheroscler. Rep. 2018, 20, 2. [Google Scholar] [CrossRef]
- Perrotta, I.; Aquila, S. The Role of Oxidative Stress and Autophagy in Atherosclerosis. Oxidative Med. Cell. Longev. 2015, 2015, 130315. [Google Scholar] [CrossRef] [Green Version]
- Herrington, W.; Lacey, B.; Sherliker, P.; Armitage, J.; Lewington, S. Epidemiology of atherosclerosis and the potential to reduce the global burden of atherothrombotic disease. Circ. Res. 2016, 535–546. [Google Scholar] [CrossRef] [PubMed]
- Nissen, S.; Nicholls, S.; Sipahi, I.; Libby, P.; Raichlen, J.; Ballantyne, C.; Davignon, J.; Erbel, R.; Fruchart, J.; Tardif, J.C.; et al. Effect of very high-intensity statin therapy on regression of coronary atherosclerosis: The ASTEROID trial. JAMA 2006, 1556–1565. [Google Scholar] [CrossRef]
- van Staa, T.; Smeeth, L.; Ng, E.; Goldacre, B.; Gulliford, M. The efficiency of cardiovascular risk assessment: Do the right patients get statin treatment? Heart 2013, 99, 1597–1602. [Google Scholar] [CrossRef] [Green Version]
- Adhyaru, B.; Jacobson, T. Safety and efficacy of statin therapy. Nat. Rev. Cardiol. 2018, 15, 757–769. [Google Scholar] [CrossRef]
- Gitsels, L.; Bakbergenuly, I.; Steel, N.; Kulinskaya, E. Do statins reduce mortality in older people? Findings from a longitudinal study using primary care records. Fam. Med. Community Health 2021, 9, e000780. [Google Scholar] [CrossRef]
- Nezu, T.; Hosomi, N.; Aoki, S.; Matsumoto, M. Carotid intima-media thickness for atherosclerosis. J. Atheroscler. Thromb. 2016, 18–31. [Google Scholar] [CrossRef] [Green Version]
- Centurión, O.A. Carotid intima-media thickness as a cardiovascular risk factor and imaging pathway of atherosclerosis. Crit. Pathw. Cardiol. 2016, 15, 152–160. [Google Scholar] [CrossRef]
- Goff, D.C.; Lloyd-Jones, D.M.; Bennett, G.; Coady, S.; D’Agostino, R.B.; Gibbons, R.; Greenland, P.; Lackland, D.T.; Levy, D.; O’Donnell, C.J.; et al. 2013 ACC/AHA Guideline on the Assessment of Cardiovascular Risk. Circulation 2014, 129, S49–S73. [Google Scholar] [CrossRef] [Green Version]
- Costanzo, P.; Perrone-Filardi, P.; Vassallo, E.; Paolillo, S.; Cesarano, P.; Brevetti, G.; Chiariello, M. Does Carotid Intima-Media Thickness Regression Predict Reduction of Cardiovascular Events?: A Meta-Analysis of 41 Randomized Trials. J. Am. Coll. Cardiol. 2010, 56, 2006–2020. [Google Scholar] [CrossRef] [Green Version]
- Kablak-Ziembicka, A.; Tracz, W.; Przewlocki, T.; Pieniazek, P.; Sokolowski, A.; Konieczynska, M. Association of increased carotid intima-media thickness with the extent of coronary artery disease. Heart 2004, 90, 1286–1290. [Google Scholar] [CrossRef] [Green Version]
- Zaidi, N.; Gilani, S.; Mehboob, R.; Waseem, H.; Hassan, A. A Diagnostic accuracy of carotid intima-media thickness by B-mode ultrasonography in coronary artery disease patients. Arch. Med. Sci. Atheroscler. Dis. 2020, e79–e84. [Google Scholar] [CrossRef]
- Liu, D.; Du, C.; Shao, W.; Ma, G. Diagnostic Role of Carotid Intima-Media Thickness for Coronary Artery Disease: A Meta-Analysis. BioMed Res. Int. 2020, 5. [Google Scholar] [CrossRef] [Green Version]
- Simon, A.; Megnien, J.L.; Chironi, G. The Value of Carotid Intima-Media Thickness for Predicting Cardiovascular Risk. Arterioscler. Thromb. Vasc. Biol. 2010, 30, 182–185. [Google Scholar] [CrossRef] [PubMed] [Green Version]
- Willeit, P.; Tschiderer, L.; Allara, E.; Reuber, K.; Seekircher, L.; Gao, L.; Liao, X.; Lonn, E.; Gerstein, H.C.; Yusuf, S.; et al. Carotid Intima-Media Thickness Progression as Surrogate Marker for Cardiovascular Risk. Circulation 2020, 142, 621–642. [Google Scholar] [CrossRef] [PubMed]
- Data Base. Poznan Cardio Data. 2020. Available online: https://www.researchgate.net/publication/351355752_CARDIO_POZNAN_DATA (accessed on 25 June 2021).
- Homma, S.; Hirose, N.; Ishida, H.; Ishii, T.; Araki, G. Carotid plaque and intima-media thickness assessed by B-mode ultrasonography in subjects ranging from young adults to centenarians. Stroke 2001, 32, 830–835. [Google Scholar] [CrossRef] [PubMed] [Green Version]
- Formanowicz, D.; Wanic-Kossowska, M.; Pawliczak, E.; Radom, M.; Formanowicz, P. Usefulness of serum interleukin-18 in predicting cardiovascular mortality in patients with chronic kidney disease—Systems and clinical approach. Sci. Rep. 2015, 5. [Google Scholar] [CrossRef] [PubMed] [Green Version]
- Ridker, P.M. The JUPITER Trial. Circ. Cardiovasc. Qual. Outcomes 2009, 2, 279–285. [Google Scholar] [CrossRef] [PubMed] [Green Version]


| c | a | SSE | RMSE | Sample Size | ||
|---|---|---|---|---|---|---|
| 0.05 | 1.8 | 0.06 | 0.389 | 0.1881 | 0.36 | 11 |
| c | a | SSE | RMSE | Infl. Point | Max Slope | Sample Size | ||
|---|---|---|---|---|---|---|---|---|
| 0.3 | 1.2 | 0.02875 | 1.689 | 0.1664 | 0.0526 | [≈38, 0.6] | 0.008625 | 62 |
| c | a | SSE | RMSE | Infl. Point | Max Slope | Sample Size | ||
|---|---|---|---|---|---|---|---|---|
| 0.275 | 0.9 | 0.03962 | 0.2713 | 0.1263 | 0.0563 | [≈21, 0.45] | 0.008915 | 18 |
| c | a | SSE | RMSE | Infl. Point | Max Slope | Sample Size | ||
|---|---|---|---|---|---|---|---|---|
| 0.325 | 1.25 | 0.02625 | 1.369 | 0.1784 | −0.13 | [≈40, 0.625] | 0.008203 | 44 |
Publisher’s Note: MDPI stays neutral with regard to jurisdictional claims in published maps and institutional affiliations. |
© 2021 by the authors. Licensee MDPI, Basel, Switzerland. This article is an open access article distributed under the terms and conditions of the Creative Commons Attribution (CC BY) license (https://creativecommons.org/licenses/by/4.0/).
Share and Cite
Formanowicz, D.; Krawczyk, J.B.; Perek, B.; Lipski, D.; Tykarski, A. Management of High-Risk Atherosclerotic Patients by Statins May Be Supported by Logistic Model of Intima-Media Thickening. J. Clin. Med. 2021, 10, 2876. https://doi.org/10.3390/jcm10132876
Formanowicz D, Krawczyk JB, Perek B, Lipski D, Tykarski A. Management of High-Risk Atherosclerotic Patients by Statins May Be Supported by Logistic Model of Intima-Media Thickening. Journal of Clinical Medicine. 2021; 10(13):2876. https://doi.org/10.3390/jcm10132876
Chicago/Turabian StyleFormanowicz, Dorota, Jacek B. Krawczyk, Bartłomiej Perek, Dawid Lipski, and Andrzej Tykarski. 2021. "Management of High-Risk Atherosclerotic Patients by Statins May Be Supported by Logistic Model of Intima-Media Thickening" Journal of Clinical Medicine 10, no. 13: 2876. https://doi.org/10.3390/jcm10132876
APA StyleFormanowicz, D., Krawczyk, J. B., Perek, B., Lipski, D., & Tykarski, A. (2021). Management of High-Risk Atherosclerotic Patients by Statins May Be Supported by Logistic Model of Intima-Media Thickening. Journal of Clinical Medicine, 10(13), 2876. https://doi.org/10.3390/jcm10132876