
The Effect of Ametropia on Glaucomatous Visual Field Loss

 , , , ,
Abstract
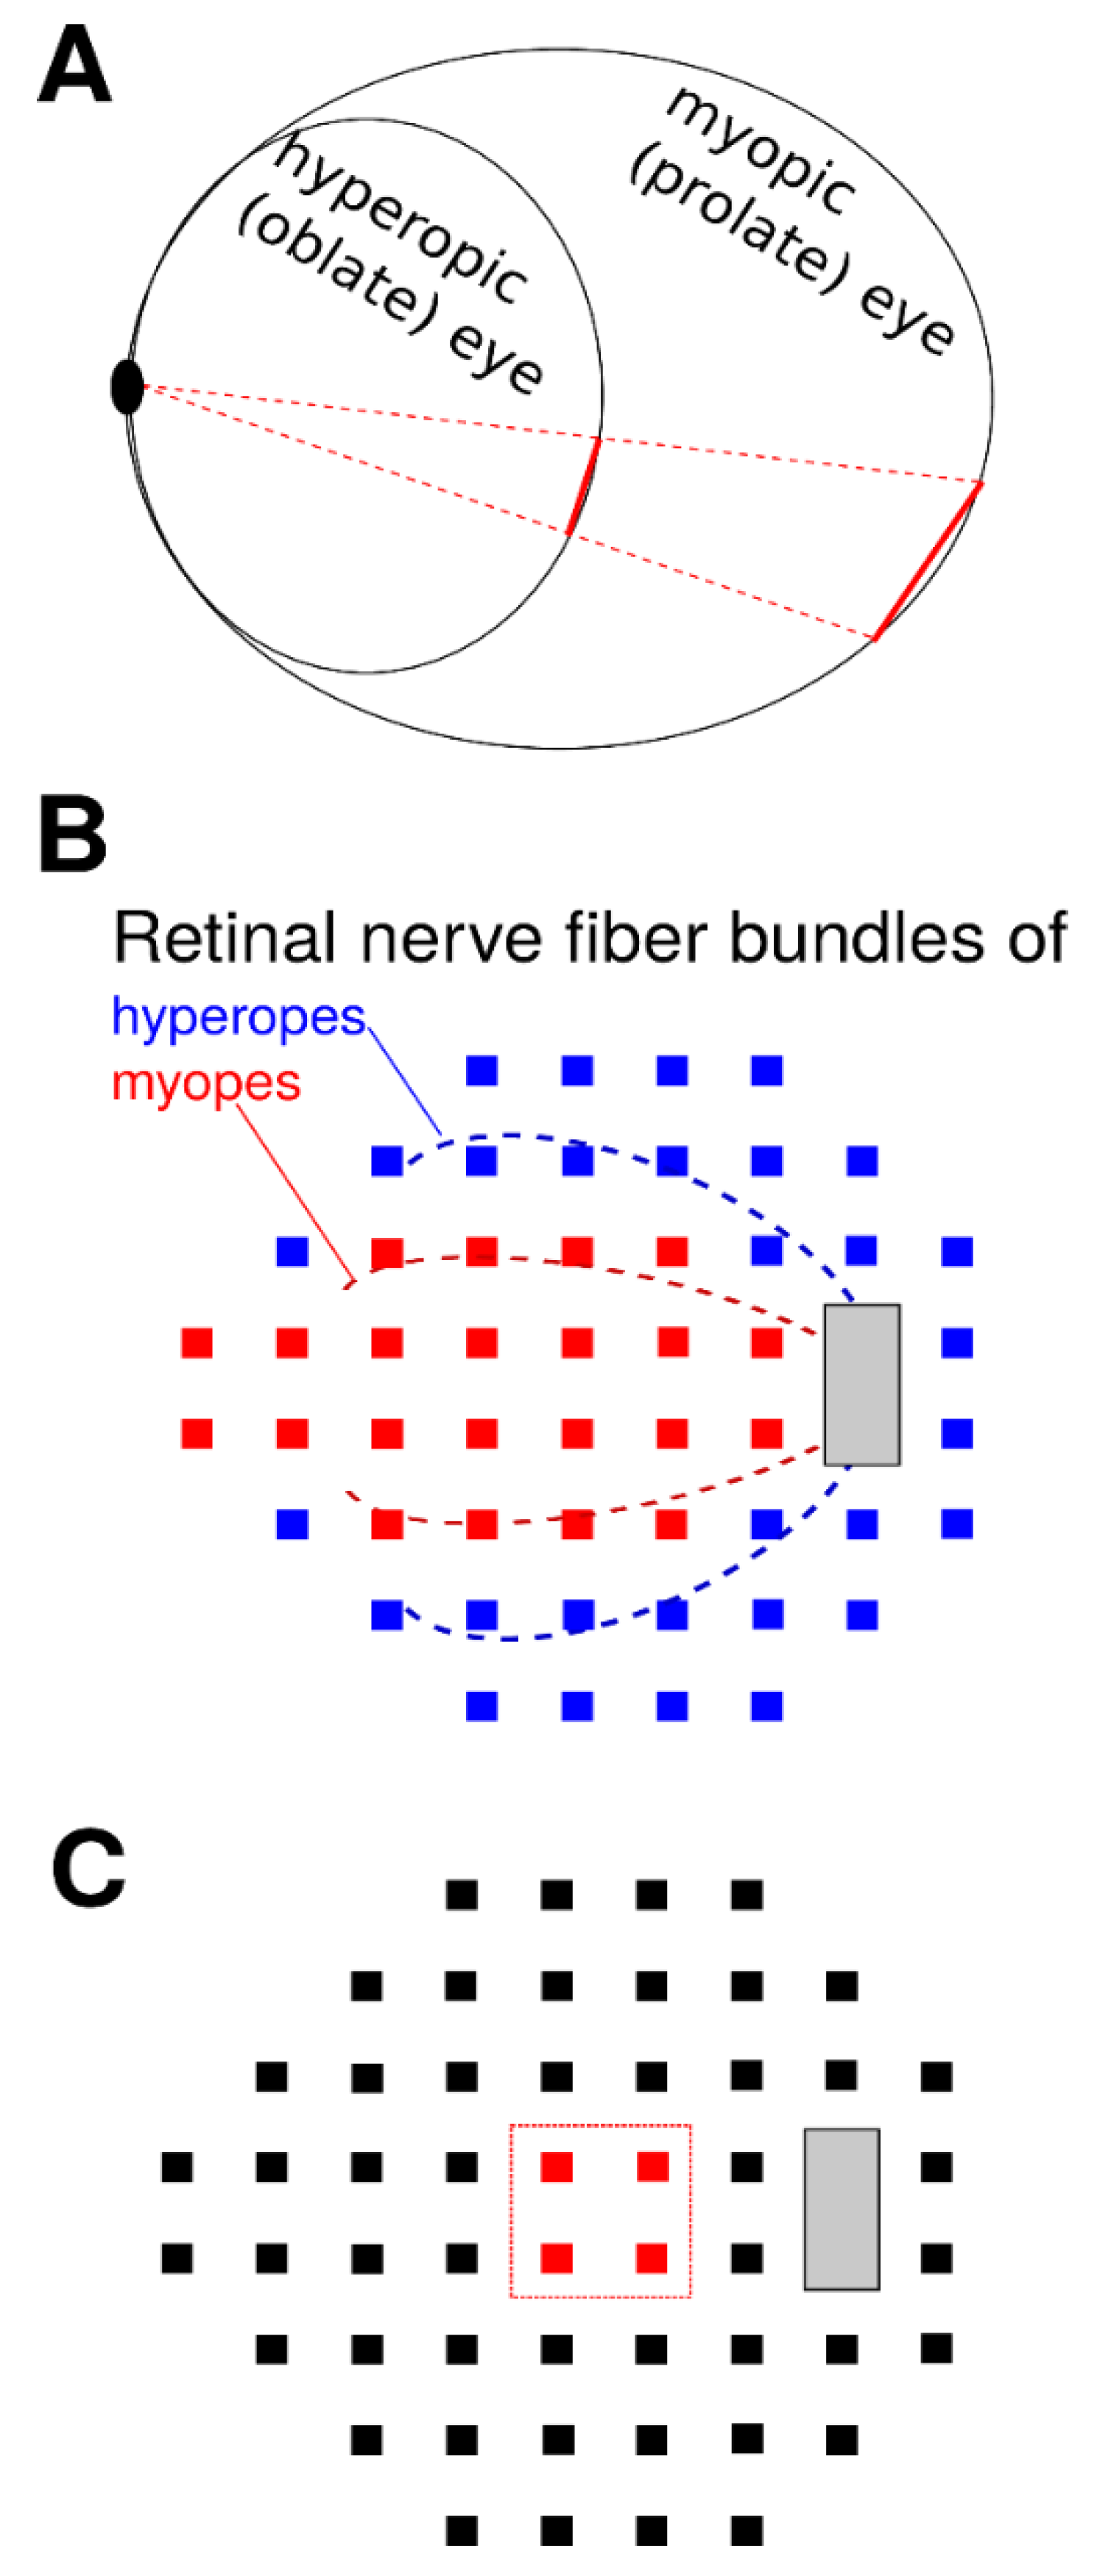
1. Introduction
2. Methods
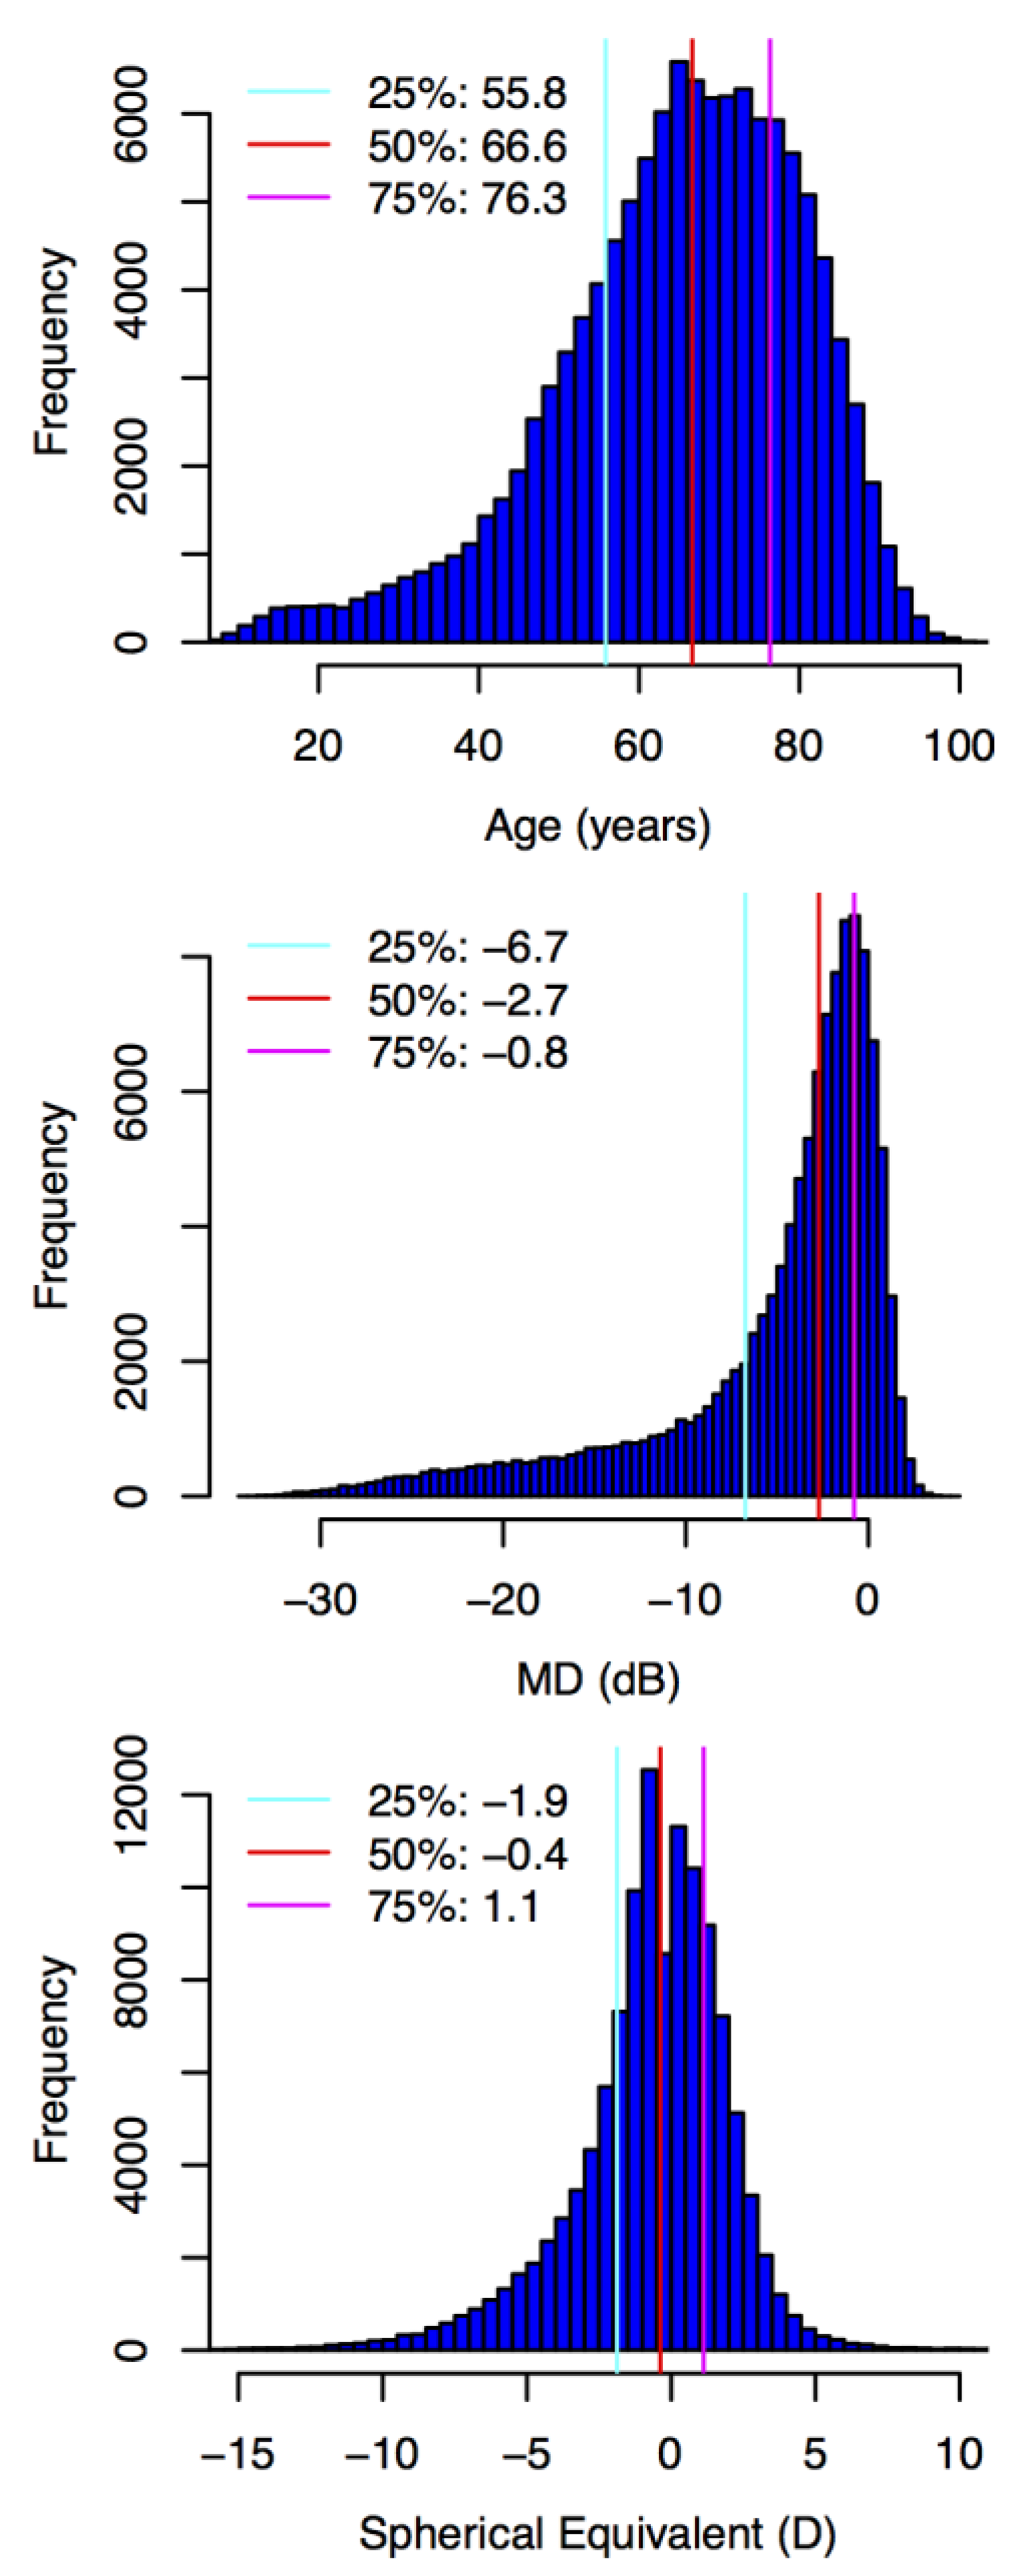
2.1. Participants and Data
2.2. Statistical Analyses
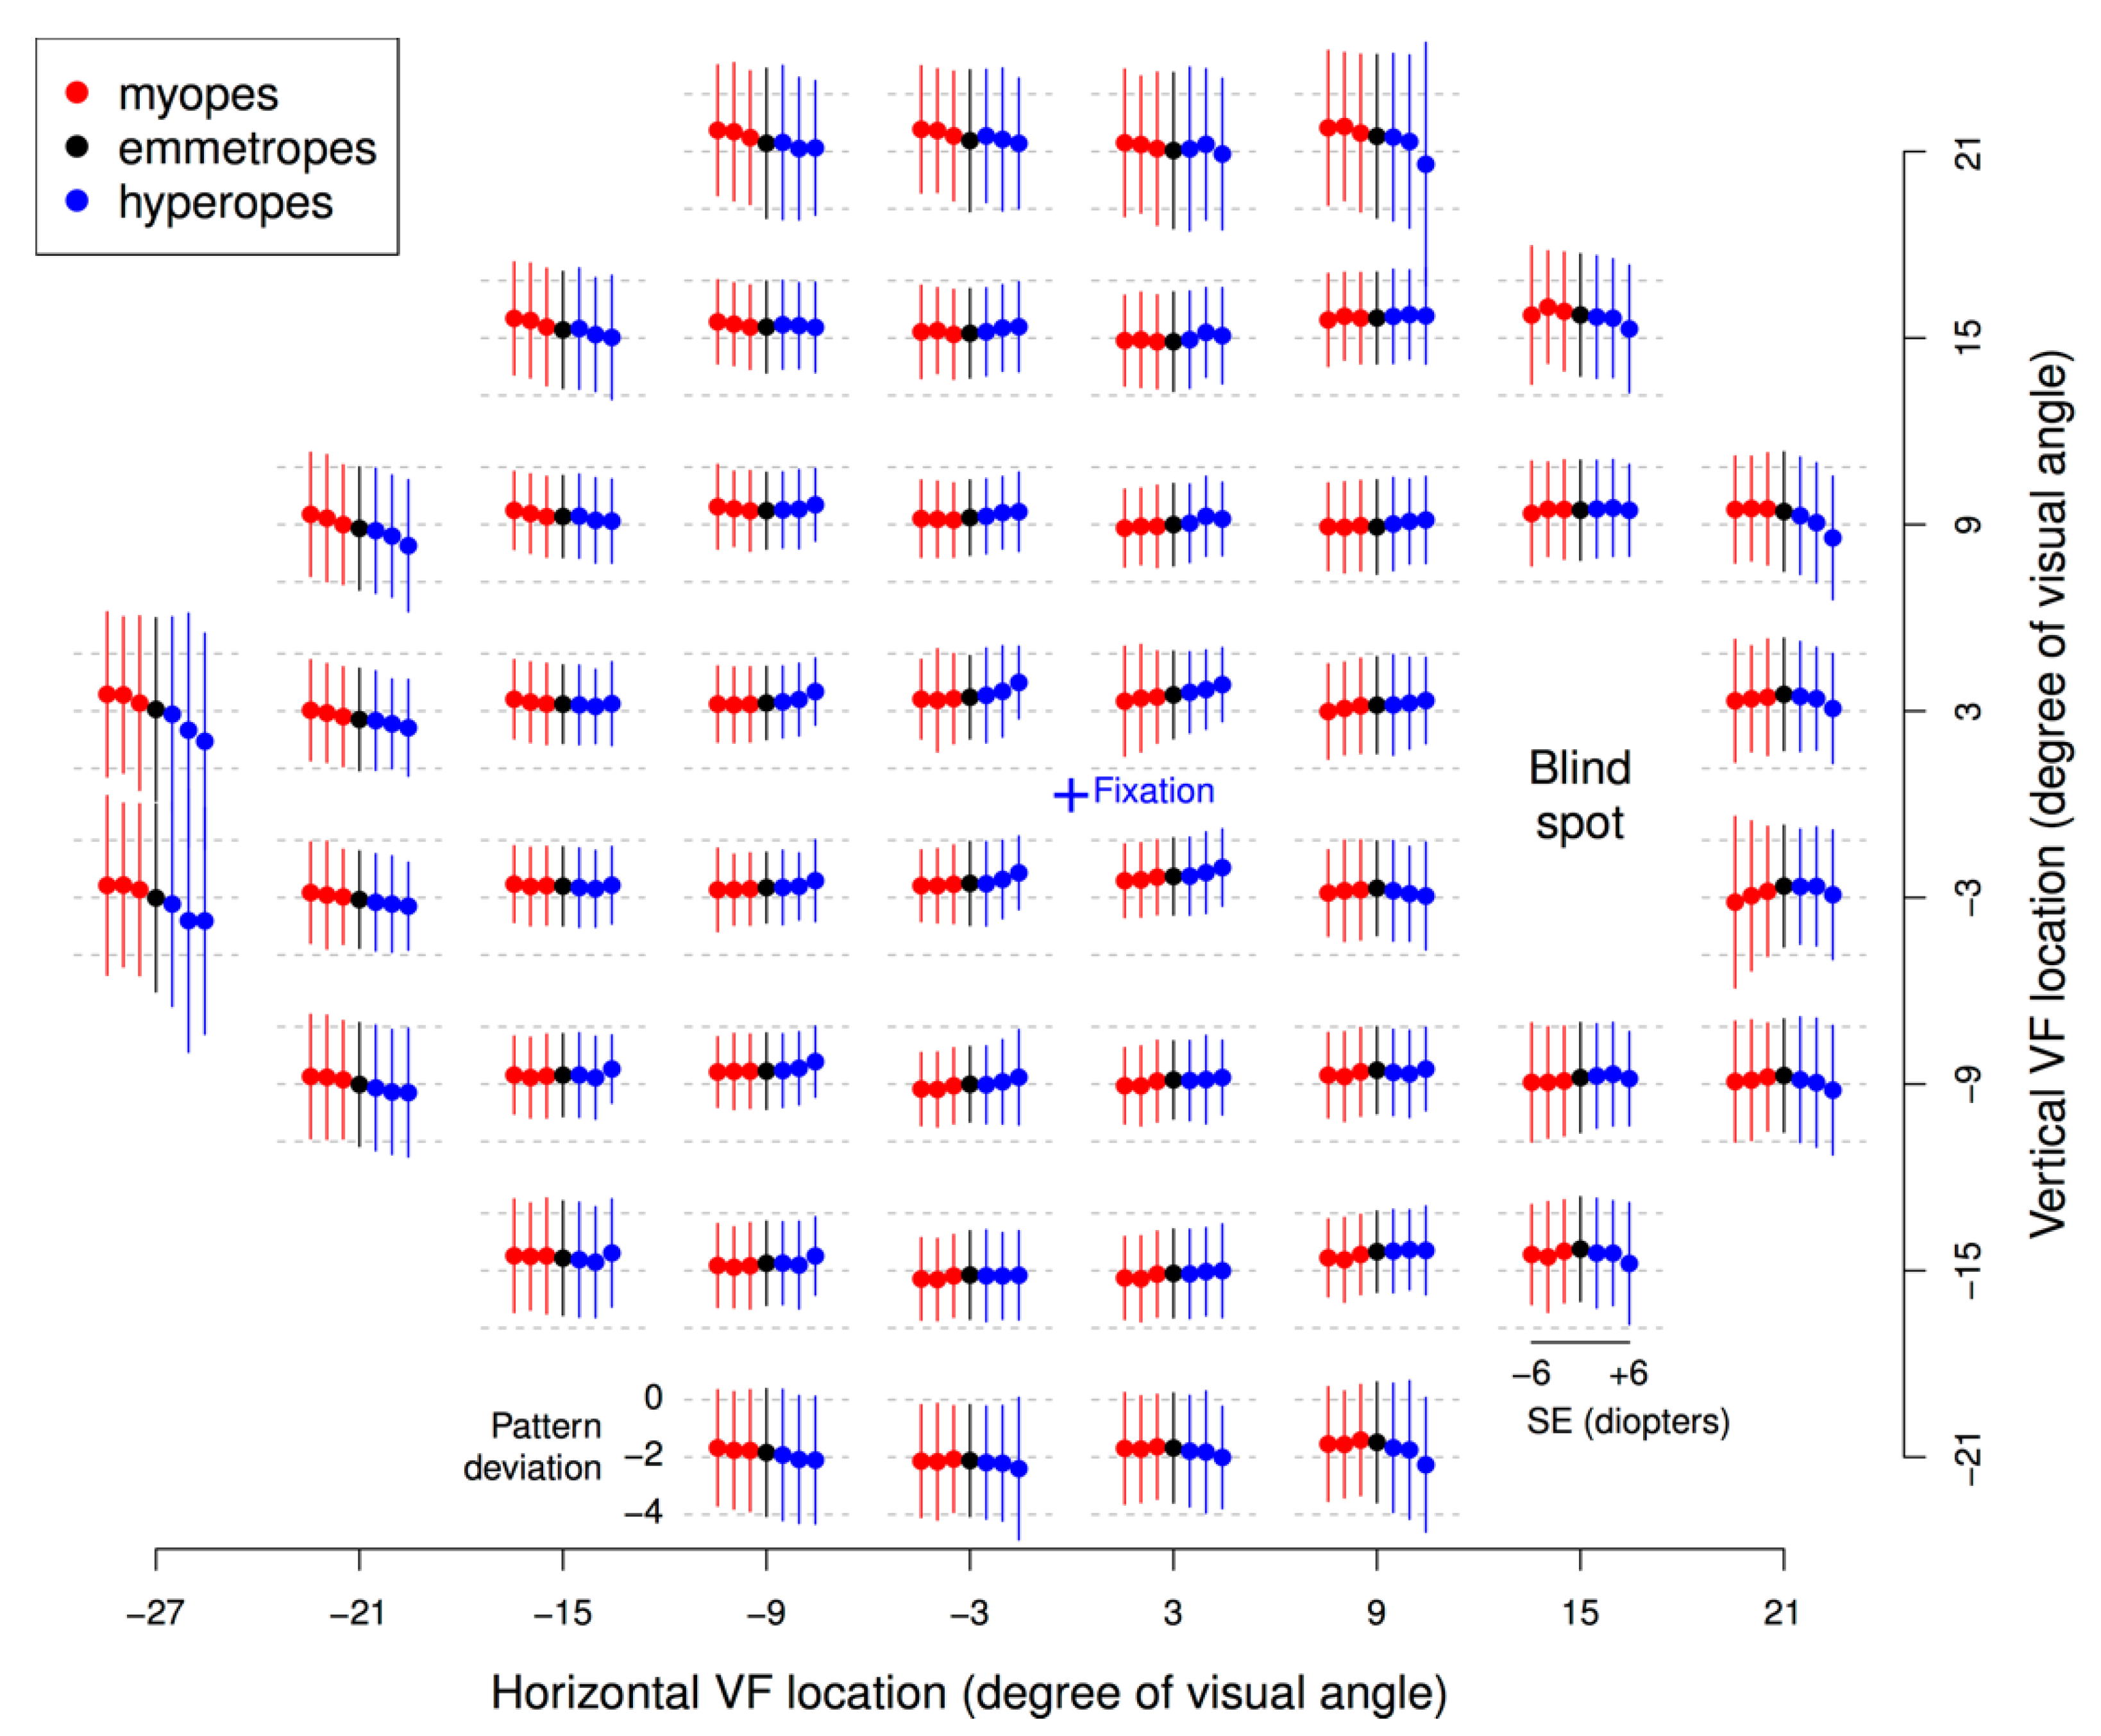
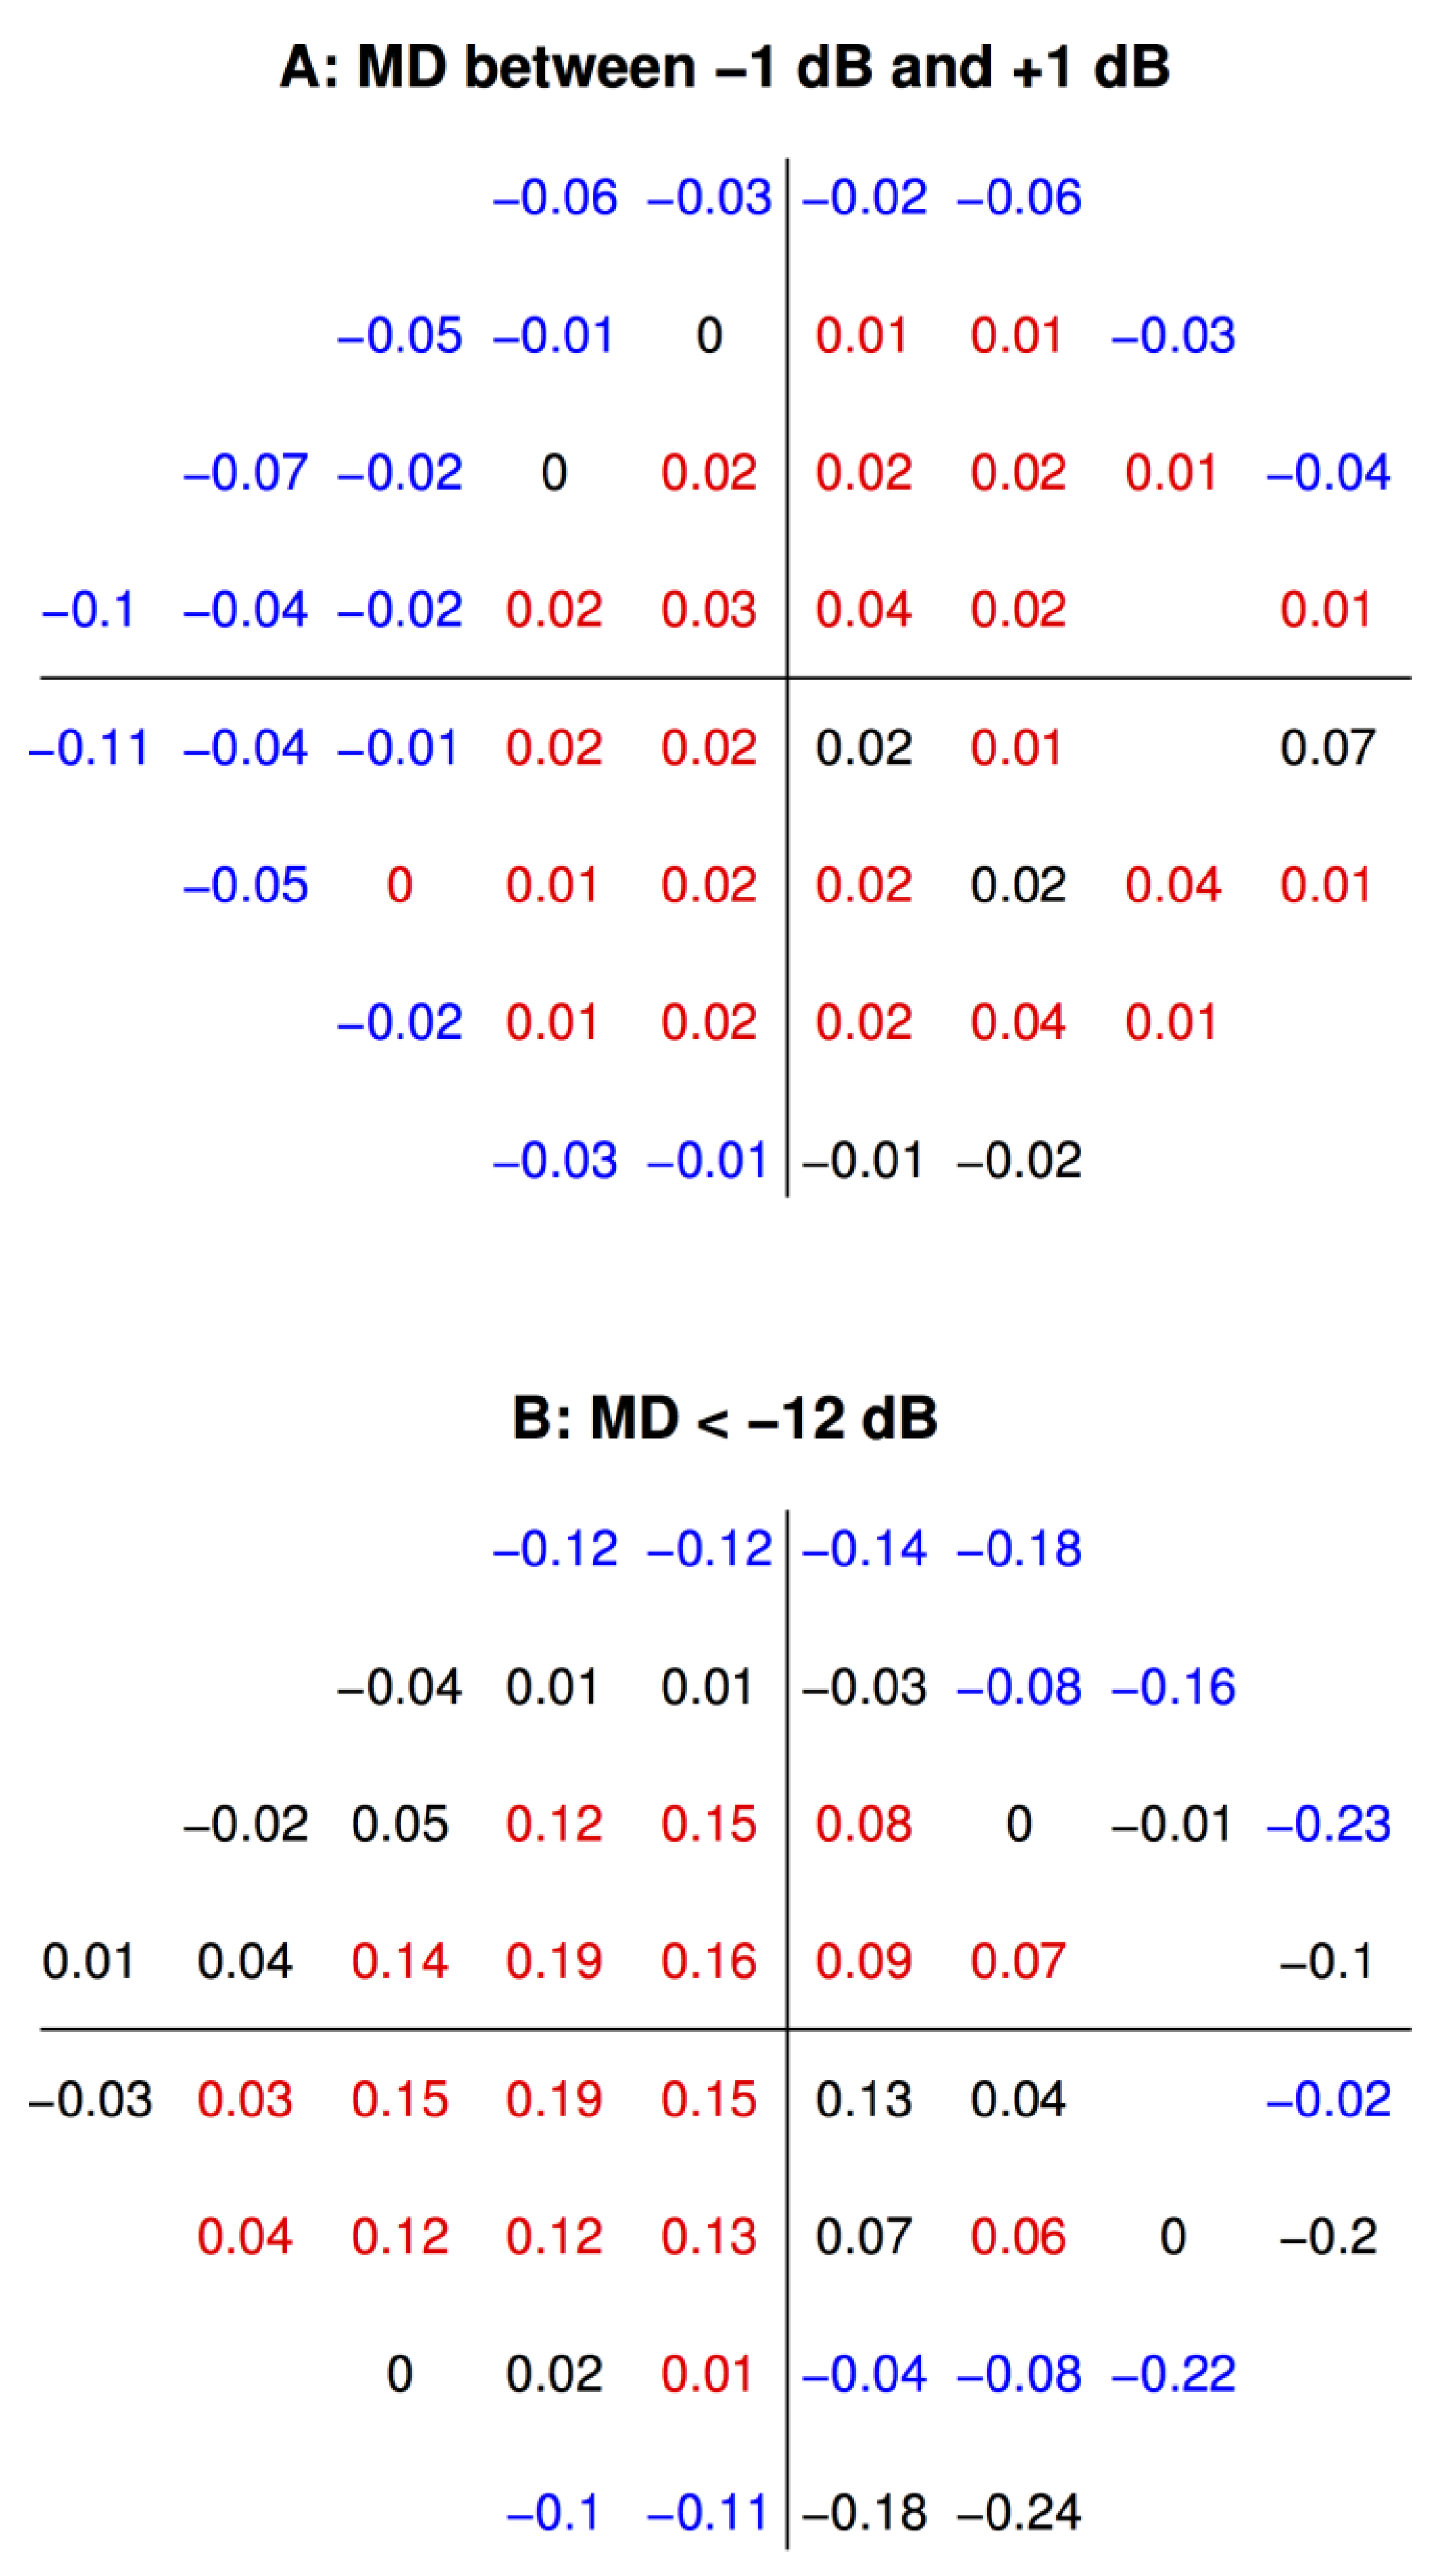
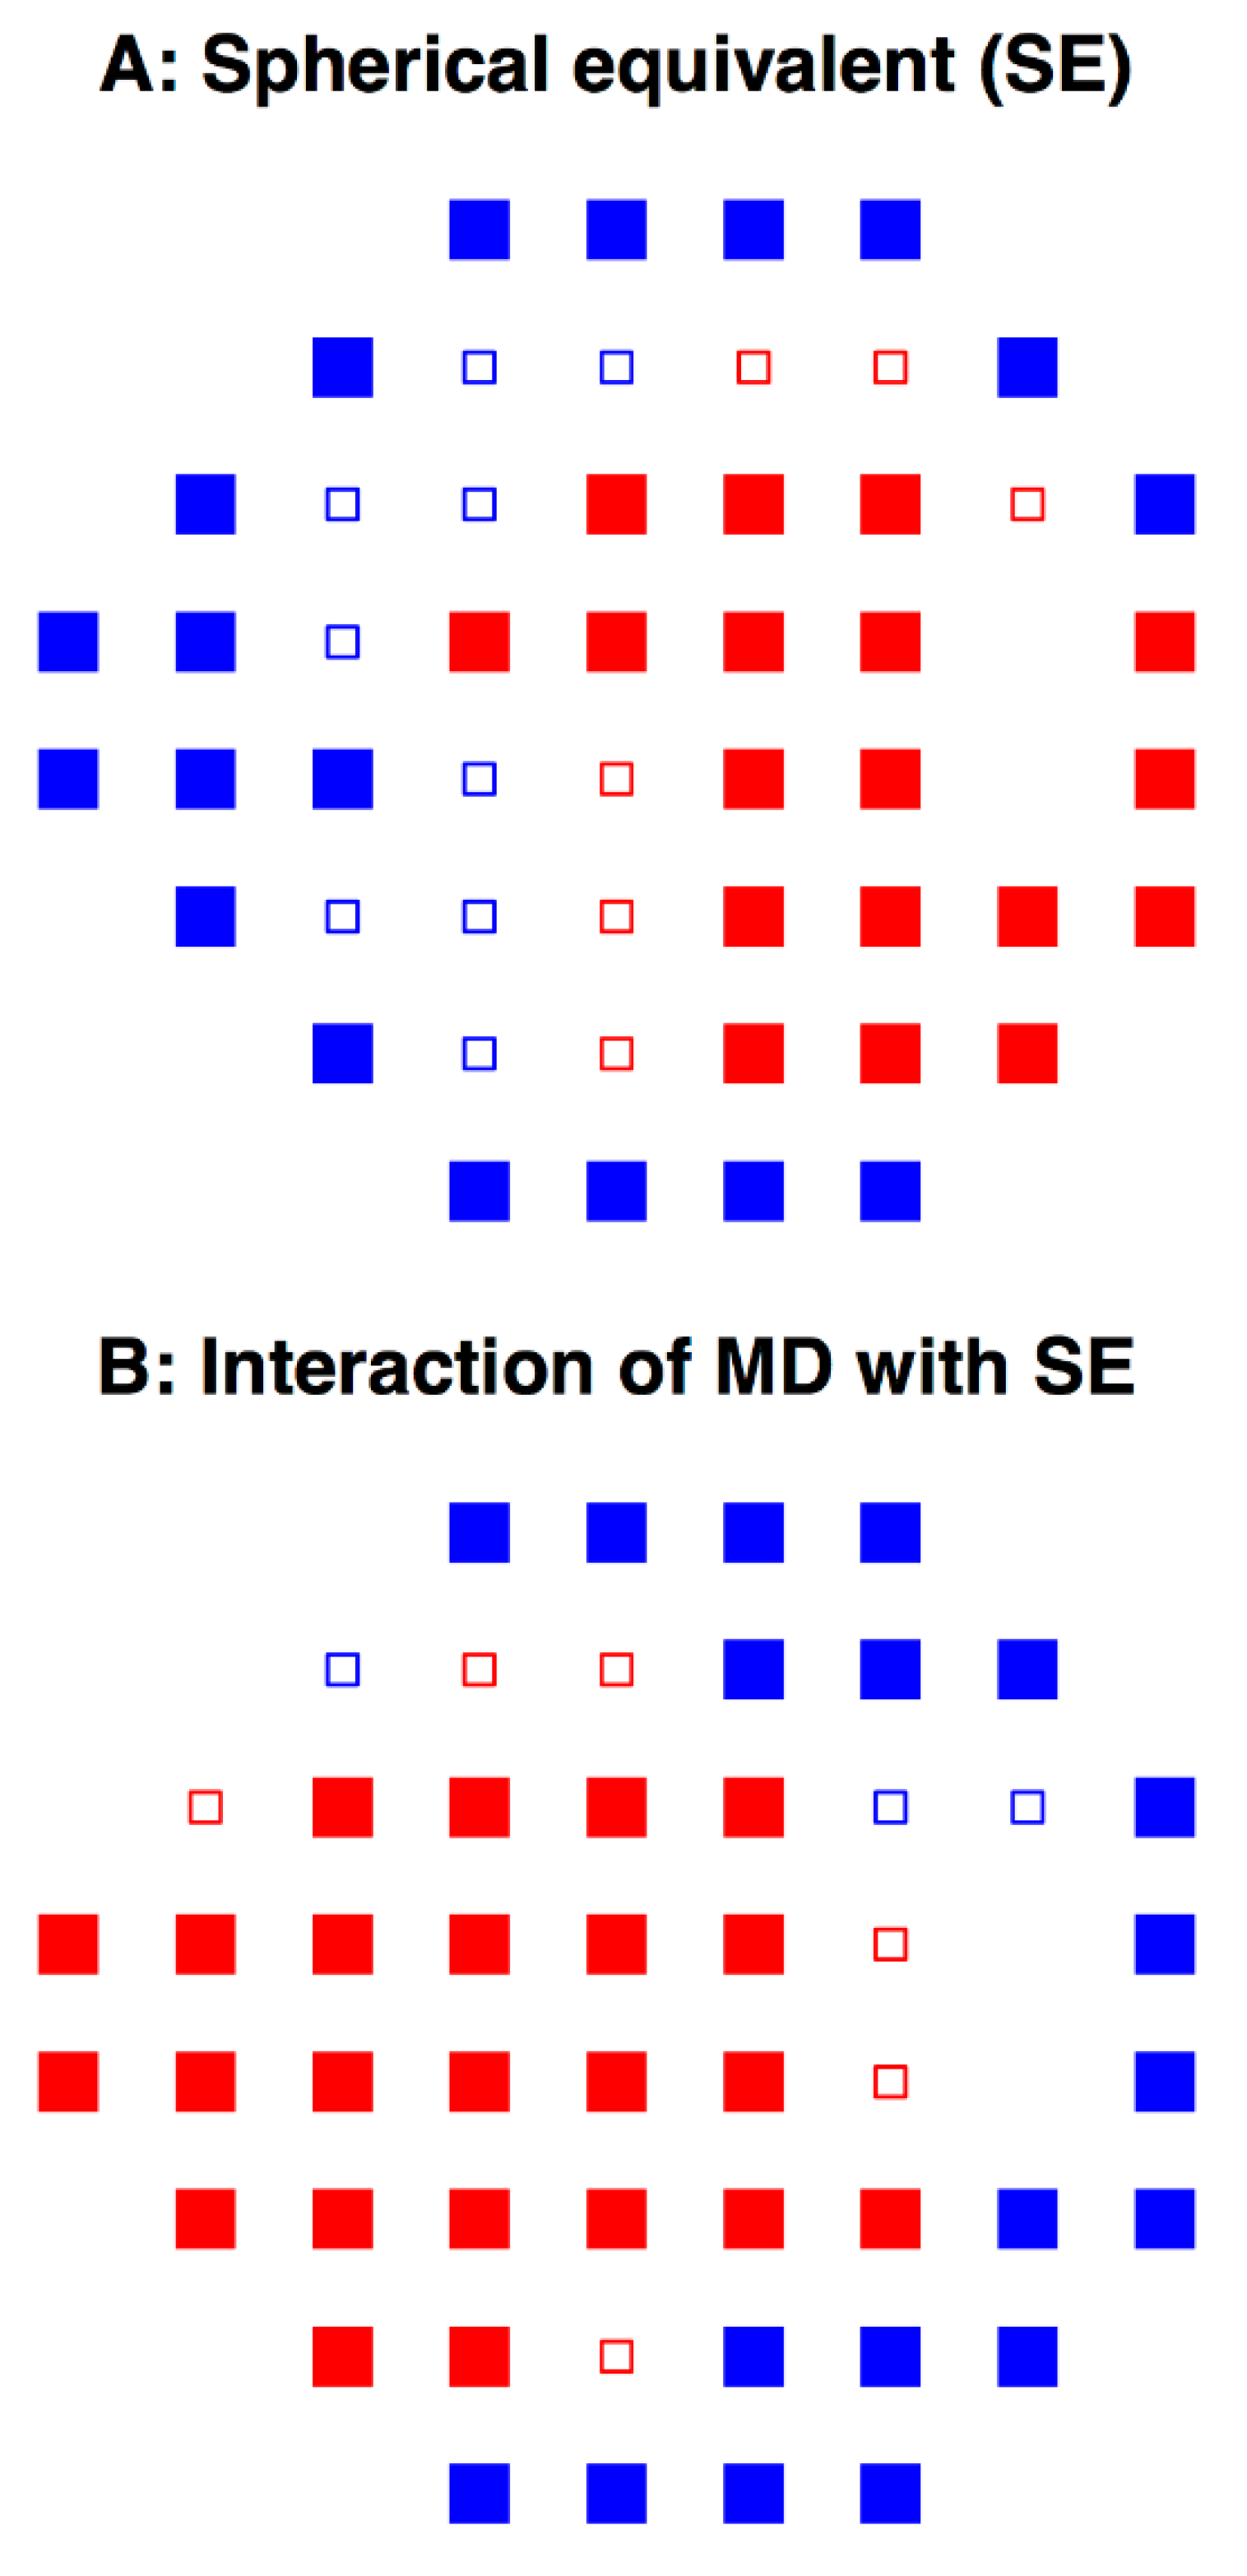
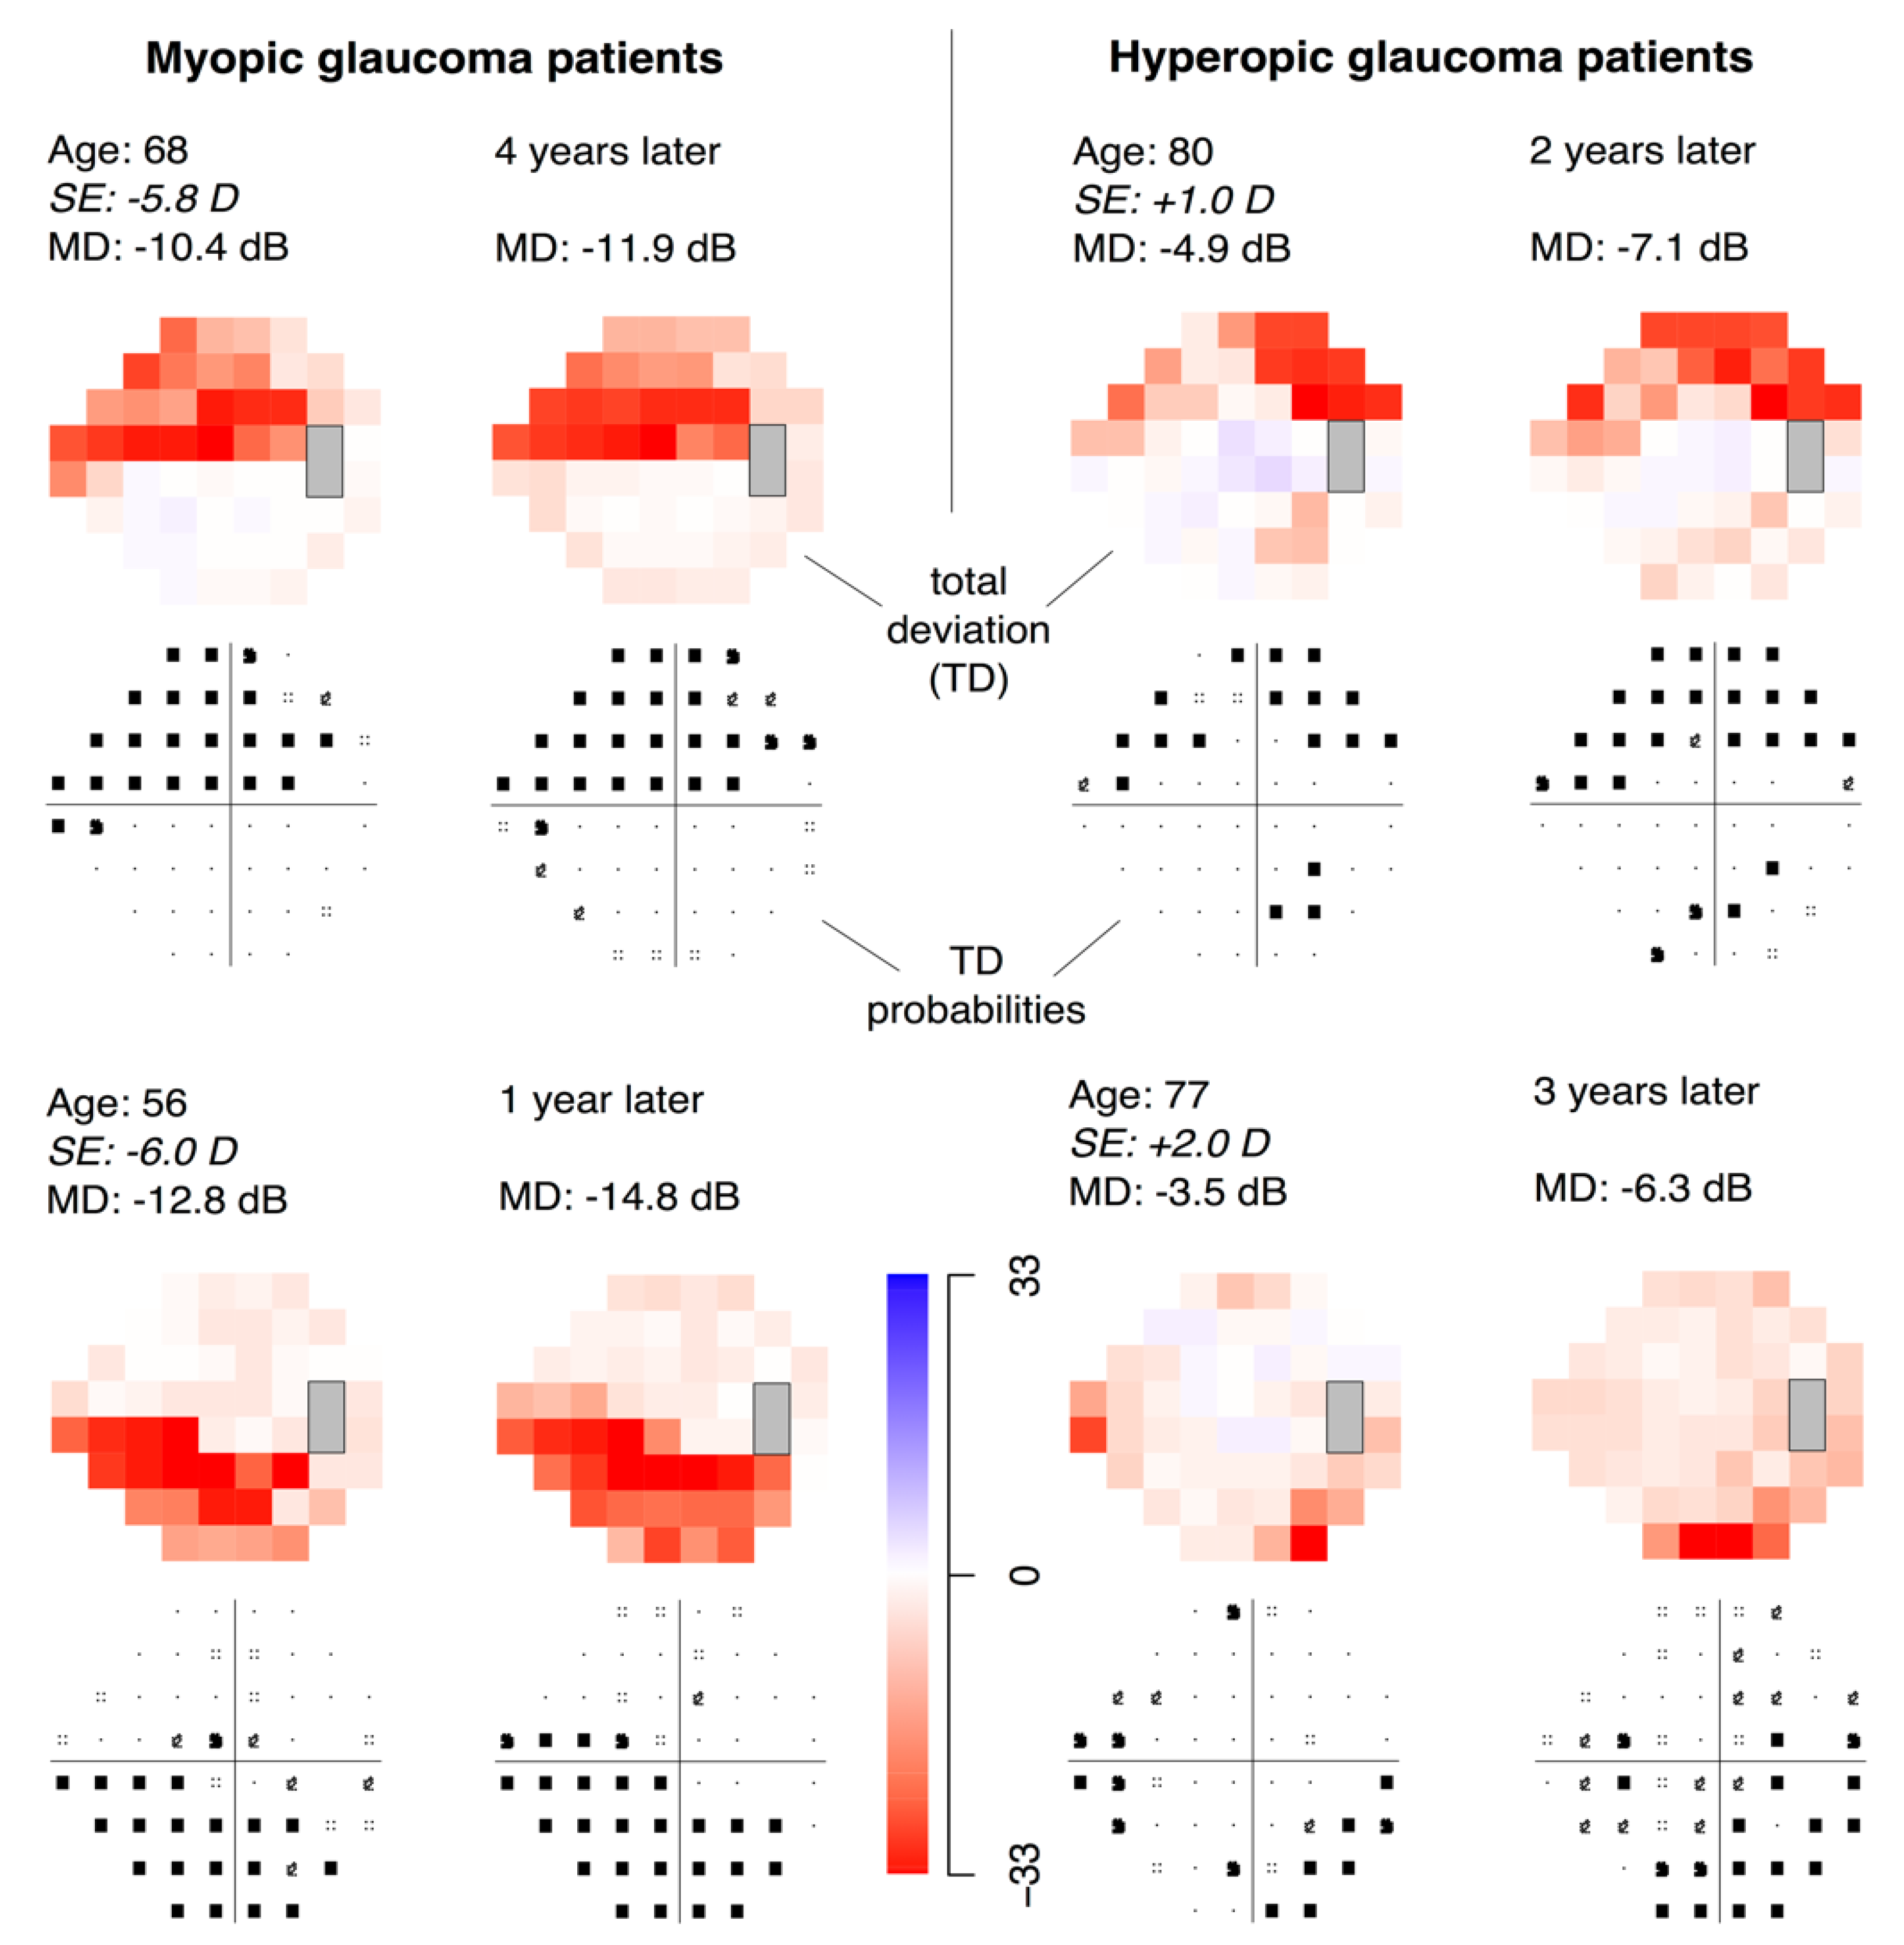
3. Results
4. Discussion
Supplementary Materials
Author Contributions
Funding
Institutional Review Board Statement
Informed Consent Statement
Data Availability Statement
Conflicts of Interest
References
- Ferreras, A.; Pablo, L.E.; Garway-Heath, D.F.; Fogagnolo, P.; García-Feijoo, J. Mapping standard automated perimetry to the peripapillary retinal nerve fiber layer in glaucoma. Investig. Ophthalmol. Vis. Sci. 2008, 49, 3018–3025. [Google Scholar] [CrossRef]
- Advanced Glaucoma Intervention Study. 2. Visual field test scoring and reliability. Ophthalmology 1994, 101, 1445–1455. [CrossRef]
- Jampel, H.D.; Singh, K.; Lin, S.C.; Chen, T.C.; Francis, B.A.; Hodapp, E.; Smith, S.D. Assessment of Visual Function in Glaucoma. Ophthalmology 2011, 118, 986–1002. [Google Scholar] [CrossRef]
- Hood, D.C.; Kardon, R.H. A framework for comparing structural and functional measures of glaucomatous damage. Prog. Retin. Eye Res. 2007, 26, 688–710. [Google Scholar] [CrossRef]
- Perkins, E.S.; Phelps, C.D. Open angle glaucoma, ocular hypertension, low-tension glaucoma, and refraction. Arch. Ophthalmol. 1982, 100, 1464–1467. [Google Scholar] [CrossRef]
- Marcus, M.W.; de Vries, M.M.; Montolio, F.G.J.; Jansonius, N.M. Myopia as a Risk Factor for Open-Angle Glaucoma: A Systematic Review and Meta-Analysis. Ophthalmology 2011, 118, 1989–1994.e2. [Google Scholar] [CrossRef] [PubMed]
- Shen, L.; Melles, R.B.; Metlapally, R.; Barcellos, L.; Schaefer, C.; Risch, N.; Herrinton, L.J.; Wildsoet, C.; Jorgenson, E. The Association of Refractive Error with Glaucoma in a Multiethnic Population. Ophthalmology 2016, 123, 92–101. [Google Scholar] [CrossRef] [PubMed]
- Llorente, L.; Barbero, S.; Cano, D.; Dorronsoro, C.; Marcos, S. Myopic versus hyperopic eyes: Axial length, corneal shape and optical aberrations. J. Vis. 2004, 4, 288–298. [Google Scholar] [CrossRef] [PubMed]
- Morgan, I.G.; Ohno-Matsui, K.; Saw, S.-M. Myopia. Lancet 2012, 379, 1739–1748. [Google Scholar] [CrossRef]
- Kang, S.H.; Hong, S.W.; Im, S.K.; Lee, S.H.; Ahn, M.D. Effect of Myopia on the Thickness of the Retinal Nerve Fiber Layer Measured by Cirrus HD Optical Coherence Tomography. Investig. Ophthalmol. Vis. Sci. 2010, 51, 4075–4083. [Google Scholar] [CrossRef]
- Hong, S.W.; Ahn, M.D.; Kang, S.H.; Im, S.K. Analysis of Peripapillary Retinal Nerve Fiber Distribution in Normal Young Adults. Investig. Opthalmol. Vis. Sci. 2010, 51, 3515–3523. [Google Scholar] [CrossRef] [PubMed]
- Leung, C.K.-S.; Yu, M.; Weinreb, R.N.; Mak, H.K.; Lai, G.; Ye, C.; Lam, D.S.-C. Retinal Nerve Fiber Layer Imaging with Spectral-Domain Optical Coherence Tomography: Interpreting the RNFL Maps in Healthy Myopic Eyes. Investig. Opthalmol. Vis. Sci. 2012, 53, 7194–7200. [Google Scholar] [CrossRef]
- Elze, T.; Baniasadi, N.; Jin, Q.; Wang, H. Ametropia, retinal anatomy, and OCT abnormality patterns in glaucoma. 1. Impacts of refractive error and interartery angle. J. Biomed. Opt. 2017, 22, 1. [Google Scholar] [CrossRef] [PubMed]
- Vongphanit, J.; Mitchell, P.; Wang, J.J. Population prevalence of tilted optic disks and the relationship of this sign to refractive error. Am. J. Ophthalmol. 2002, 133, 679–685. [Google Scholar] [CrossRef]
- Baniasadi, N.; Wang, M.; Wang, H.; Mahd, M.; Elze, T. Associations between Optic Nerve Head–Related Anatomical Parameters and Refractive Error over the Full Range of Glaucoma Severity. Transl. Vis. Sci Technol. 2017, 6, 9. [Google Scholar] [CrossRef][Green Version]
- Huang, H.; Jonas, J.B.; Dai, Y.; Hong, J.; Wang, M.; Chen, J.; Sun, X. Position of the central retinal vessel trunk and pattern of remaining visual field in advanced glaucoma. Br. J. Ophthalmol. 2013, 97, 96–100. [Google Scholar] [CrossRef]
- Wang, M.; Wang, H.; Pasquale, L.R.; Baniasadi, N.; Shen, L.Q.; Bex, P.J.; Elze, T. Relationship Between Central Retinal Vessel Trunk Location and Visual Field Loss in Glaucoma. Am. J. Ophthalmol. 2017, 176, 53–60. [Google Scholar] [CrossRef] [PubMed]
- Besombes, G.; Grunewald, F.; Ramdane, N.; Salleron, J.; Labalette, P.; Rouland, J.-F. Position of the central retinal vessel trunk and location of visual field and parapapillary nerve fibers damage in early to moderate glaucoma. Investig. Ophthalmol. Vis. Sci. 2014, 55, 950. [Google Scholar] [CrossRef]
- Mayama, C.; Suzuki, Y.; Araie, M.; Ishida, K.; Akira, T.; Yamamoto, T.; Kitazawa, Y.; Funaki, S.; Shirakashi, M.; Abe, H.; et al. Myopia and advanced-stage open-angle glaucoma. Ophthalmology 2002, 109, 2072–2077. [Google Scholar] [CrossRef]
- Sakata, R.; Aihara, M.; Murata, H.; Mayama, C.; Tomidokoro, A.; Iwase, A.; Araie, M. Contributing Factors for Progression of Visual Field Loss in Normal-tension Glaucoma Patients With Medical Treatment. J. Glaucoma 2013, 22, 250–254. [Google Scholar] [CrossRef]
- Dias, D.T.; Almeida, I.; Sassaki, A.M.; Juncal, V.R.; Ushida, M.; Lopes, F.S.; Alhadeff, P.; Ritch, R.; Prata, T.S. Factors associated with the presence of parafoveal scotoma in glaucomatous eyes with optic disc hemorrhages. Eye 2018, 32, 1669–1674. [Google Scholar] [CrossRef] [PubMed]
- Araie, M.; Arai, M.; Koseki, N.; Suzuki, Y. Influence of myopic refraction on visual field defects in normal tension and primary open angle glaucoma. Jpn. J. Ophthalmol. 1995, 39, 60–64. [Google Scholar] [PubMed]
- Ohno-Matsui, K.; Shimada, N.; Yasuzumi, K.; Hayashi, K.; Yoshida, T.; Kojima, A.; Moriyama, M.; Tokoro, T. Long-term Development of Significant Visual Field Defects in Highly Myopic Eyes. Am. J. Ophthalmol. 2011, 152, 256–265.e1. [Google Scholar] [CrossRef] [PubMed]
- Birt, C.M.; Shin, D.H.; Samudrala, V.; Hughes, B.A.; Kim, C.; Lee, D. Analysis of reliability indices from Humphrey visual field tests in an urban glaucoma population. Ophthalmology 1997, 104, 1126–1130. [Google Scholar] [CrossRef]
- Newkirk, M.R.; Gardiner, S.K.; Demirel, S.; Johnson, C.A. Assessment of False Positives with the Humphrey Field Analyzer II Perimeter with the SITA Algorithm. Investig. Opthalmol. Vis. Sci. 2006, 47, 4632. [Google Scholar] [CrossRef]
- Pasquale, L.R.; Kang, J.H.; Manson, J.E.; Willett, W.C.; Rosner, B.A.; Hankinson, S.E. Prospective Study of Type 2 Diabetes Mellitus and Risk of Primary Open-Angle Glaucoma in Women. Ophthalmology 2006, 113, 1081–1086. [Google Scholar] [CrossRef]
- Pasquale, L.R.; Willett, W.C.; Rosner, B.A.; Kang, J.H. Anthropometric measures and their relation to incident primary open-angle glaucoma. Ophthalmology 2010, 117, 1521–1529. [Google Scholar] [CrossRef]
- R Core Team. R: A Language and Environment for Statistical Computing; R Core Team: Vienna, Austria, 2014. [Google Scholar]
- Benjamini, Y.; Hochberg, Y. Controlling the False Discovery Rate—A Practical and Powerful Approach to Multiple Testing. J. R. Stat. Soc. Ser. B 1995, 57, 289–300. [Google Scholar] [CrossRef]
- Heo, D.W.; Kim, K.N.; Lee, M.W.; Lee, S.B.; Kim, C. Properties of pattern standard deviation in open-angle glaucoma patients with hemi-optic neuropathy and bi-optic neuropathy. PLoS ONE 2017, 12, e0171960. [Google Scholar] [CrossRef] [PubMed]
- Garway-Heath, D.F.; Poinoosawmy, D.; Fitzke, F.W.; Hitchings, R.A. Mapping the visual field to the optic disc in normal tension glaucoma eyes. Ophthalmology 2000, 107, 1809–1815. [Google Scholar] [CrossRef]
- Fujita, K.; Yasuda, N.; Oda, K.; Yuzawa, M. [Reading performance in patients with central visual field disturbance due to glaucoma]. Nihon Ganka Gakkai Zasshi 2006, 110, 914–918. [Google Scholar]
- Coeckelbergh, T.R.M.; Brouwer, W.H.; Cornelissen, F.W.; Van Wolffelaar, P.; Kooijman, A.C. The effect of visual field defects on driving performance: A driving simulator study. Arch. Ophthalmol. 2002, 120, 1509–1516. [Google Scholar] [CrossRef] [PubMed]
- Park, H.-Y.L.; Choi, S.I.; Choi, J.-A.; Park, C.K. Disc Torsion and Vertical Disc Tilt Are Related to Subfoveal Scleral Thickness in Open-Angle Glaucoma Patients With Myopia. Investig. Ophthalmol. Vis. Sci. 2015, 56, 4927–4935. [Google Scholar] [CrossRef]
- Lee, K.S.; Lee, J.R.; Kook, M.S. Optic disc torsion presenting as unilateral glaucomatous-appearing visual field defect in young myopic korean eyes. Ophthalmology 2014, 121, 1013–1019. [Google Scholar] [CrossRef]
- Minckler, D.S. The organization of nerve fiber bundles in the primate optic nerve head. Arch. Ophthalmol. 1980, 98, 1630–1636. [Google Scholar] [CrossRef]
- Hood, D.C.; Raza, A.S.; de Moraes, C.G.V.; Liebmann, J.M.; Ritch, R. Glaucomatous damage of the macula. Prog. Retin. Eye Res. 2013, 32, 1–21. [Google Scholar] [CrossRef] [PubMed]
- Baniasadi, N.; Wang, M.; Wang, H.; Jin, Q.; Elze, T. Ametropia, retinal anatomy, and OCT abnormality patterns in glaucoma. 2. Impacts of optic nerve head parameters. J. Biomed. Opt. 2017, 22, 1–9. [Google Scholar] [CrossRef] [PubMed]
- Lundström, M.; Dickman, M.; Henry, Y.; Manning, S.; Rosen, P.; Tassignon, M.-J.; Young, D.; Stenevi, U. Risk factors for refractive error after cataract surgery: Analysis of 282 811 cataract extractions reported to the European Registry of Quality Outcomes for cataract and refractive surgery. J. Cataract Refract. Surg. 2018, 44, 447–452. [Google Scholar] [CrossRef]
- Hangai, M.; Ikeda, H.O.; Akagi, T.; Yoshimura, N. Paracentral scotoma in glaucoma detected by 10-2 but not by 24-2 perimetry. Jpn. J. Ophthalmol. 2014, 58, 188–196. [Google Scholar] [CrossRef] [PubMed]


| MD Bin Center (dB) | SE Coefficient | p Value |
|---|---|---|
| 0 | 0.03 | 6.82 × 10−46 |
| −6 | 0.05 | 3.22 × 10⁻¹⁴ |
| −12 | 0.06 | 0.000455 |
| −18 | 0.12 | 7.04 × 10⁻⁵ |
| −24 | 0.20 | 5.92 × 10⁻⁶ |
Publisher’s Note: MDPI stays neutral with regard to jurisdictional claims in published maps and institutional affiliations. |
© 2021 by the authors. Licensee MDPI, Basel, Switzerland. This article is an open access article distributed under the terms and conditions of the Creative Commons Attribution (CC BY) license (https://creativecommons.org/licenses/by/4.0/).
Share and Cite
Choi, E.Y.; Wong, R.C.S.; Thein, T.; Pasquale, L.R.; Shen, L.Q.; Wang, M.; Li, D.; Jin, Q.; Wang, H.; Baniasadi, N.; et al. The Effect of Ametropia on Glaucomatous Visual Field Loss. J. Clin. Med. 2021, 10, 2796. https://doi.org/10.3390/jcm10132796
Choi EY, Wong RCS, Thein T, Pasquale LR, Shen LQ, Wang M, Li D, Jin Q, Wang H, Baniasadi N, et al. The Effect of Ametropia on Glaucomatous Visual Field Loss. Journal of Clinical Medicine. 2021; 10(13):2796. https://doi.org/10.3390/jcm10132796
Chicago/Turabian StyleChoi, Eun Young, Raymond C. S. Wong, Thuzar Thein, Louis R. Pasquale, Lucy Q. Shen, Mengyu Wang, Dian Li, Qingying Jin, Hui Wang, Neda Baniasadi, and et al. 2021. "The Effect of Ametropia on Glaucomatous Visual Field Loss" Journal of Clinical Medicine 10, no. 13: 2796. https://doi.org/10.3390/jcm10132796
APA StyleChoi, E. Y., Wong, R. C. S., Thein, T., Pasquale, L. R., Shen, L. Q., Wang, M., Li, D., Jin, Q., Wang, H., Baniasadi, N., Boland, M. V., Yousefi, S., Wellik, S. R., De Moraes, C. G., Myers, J. S., Bex, P. J., & Elze, T. (2021). The Effect of Ametropia on Glaucomatous Visual Field Loss. Journal of Clinical Medicine, 10(13), 2796. https://doi.org/10.3390/jcm10132796