
Risk Factors of Infection, Hospitalization and Death from SARS-CoV-2: A Population-Based Cohort Study

 , , , , ,
Abstract
1. Introduction
2. Materials and Methods
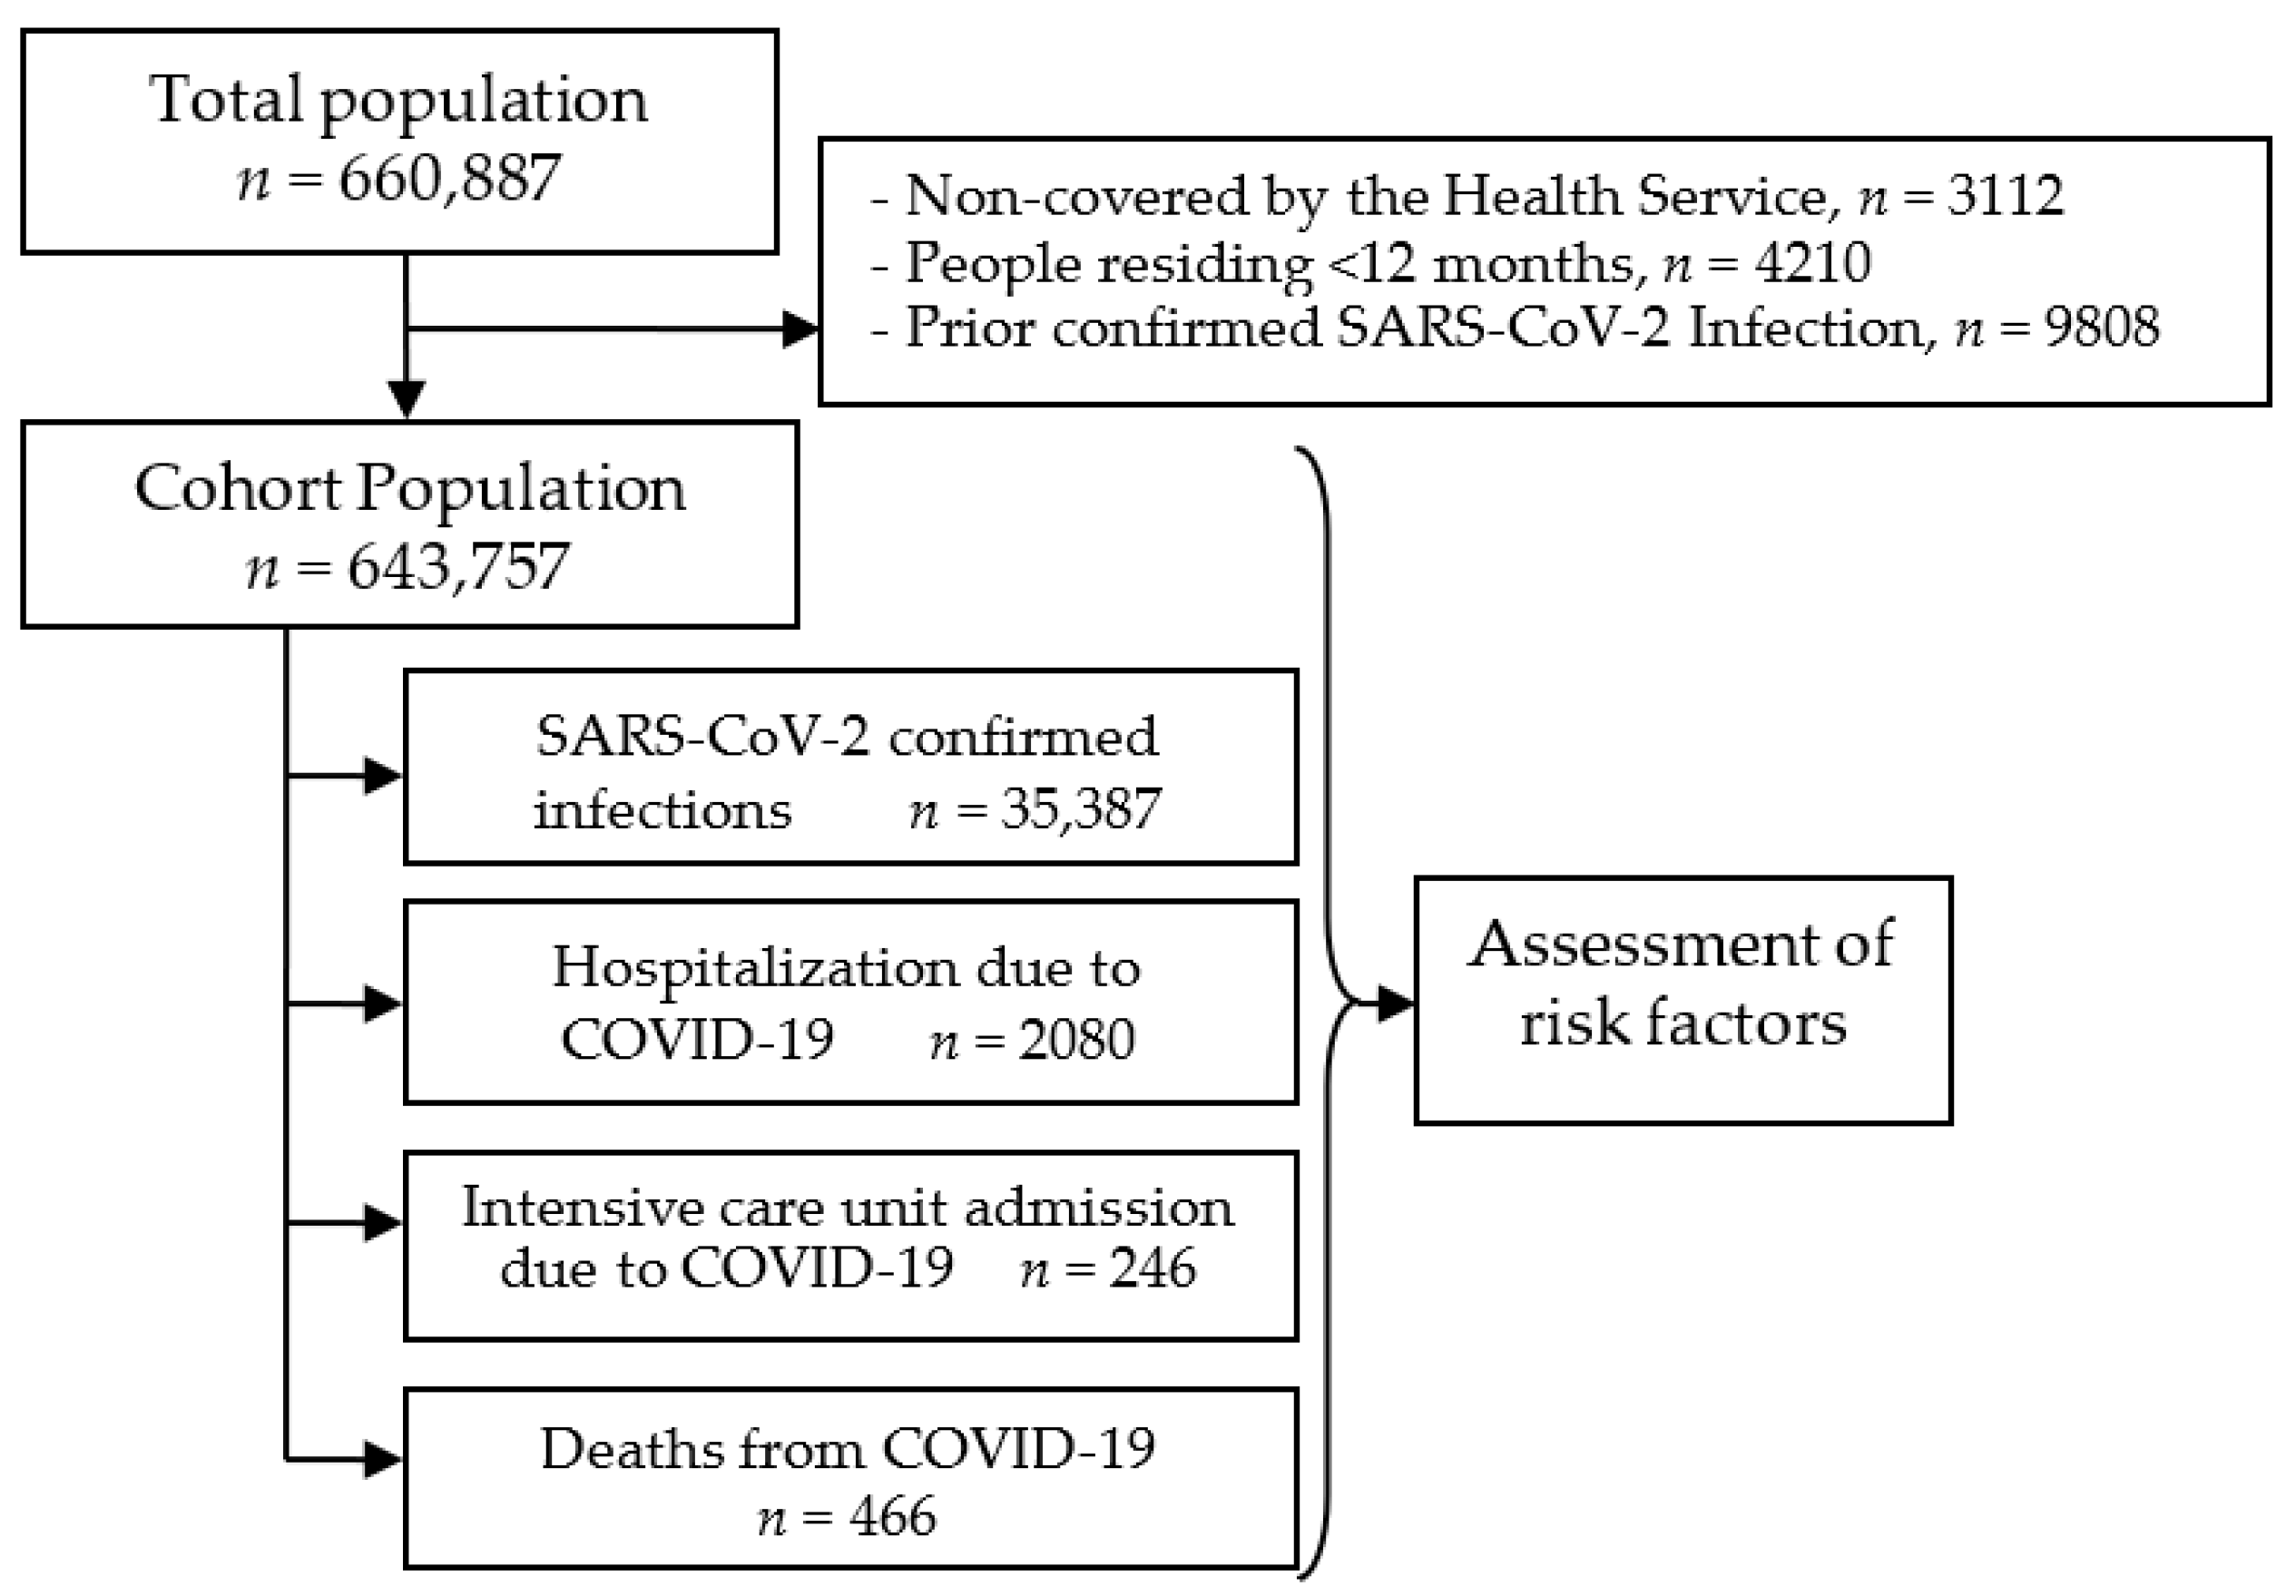
2.1. Study Design and Setting
2.2. Variables
2.3. Statistical Analysis
2.4. Ethical Aspects
3. Results
3.1. Cumulative Incidence by Population Characteristics
3.2. Predictive Factors for Infection, Hospitalization and Severe Outcomes
3.3. Assessing Priority Groups for Vaccination
4. Discussion
5. Conclusions
Author Contributions
Funding
Institutional Review Board Statement
Informed Consent Statement
Data Availability Statement
Acknowledgments
Conflicts of Interest
References
- European Centre for Disease Prevention and Control. COVID-19 Situation Update for the EU/EEA, as of 20 January 2021. Available online: https://www.ecdc.europa.eu/en/cases-2019-ncov-eueea (accessed on 23 January 2021).
- Wu, Z.; McGoogan, J.M. Characteristics of and important lessons from the coronavirus disease 2019 (COVID-19) outbreak in China: Summary of a report of 72314 cases from the Chinese Center for Disease Control and Prevention. JAMA. 2020, 323, 1239–1242. [Google Scholar] [CrossRef] [PubMed]
- World Health Organization (WHO). WHO SAGE Roadmap for Prioritizing Uses of Covid-19 Vaccines in the Context of Limited Supply. Version 1.1. Geneva. 13 November 2020. Available online: https://cdn.who.int/media/docs/default-source/immunization/sage/covid/sage-prioritization-roadmap-covid19-vaccines_31a59ccd-1fbf-4a36-a12f-73344134e49d.pdf?sfvrsn=bf227443_36&download=true (accessed on 16 April 2021).
- Karagiannidis, C.; Mostert, C.; Hentschker, C.; Voshaar, T.; Malzahn, J.; Schillinger, G.; Klauber, J.; Janssens, U.; Marx, G.; Weber-Carstens, S.; et al. Case characteristics, resource use, and outcomes of 10 021 patients with COVID-19 admitted to 920 German hospitals: An observational study. Lancet Respir. Med. 2020, 8, 853–862. [Google Scholar] [CrossRef]
- Piroth, L.; Cottenet, J.; Mariet, A.S.; Bonniaud, P.; Blot, M.; Tubert-Bitter, P.; Quantin, C. Comparison of the characteristics, morbidity, and mortality of COVID-19 and seasonal influenza: A nationwide, population-based retrospective cohort study. Lancet Respir Med. 2021, 9, 251–259. [Google Scholar] [CrossRef]
- Zhou, F.; Yu, T.; Du, R.; Fan, G.; Liu, Y.; Liu, Z.; Xiang, J.; Wang, Y.; Song, B.; Gu, X.; et al. Clinical course and risk factors for mortality of adult inpatients with COVID-19 in Wuhan, China: A retrospective cohort study. Lancet. 2020, 395, 1054–1062. [Google Scholar] [CrossRef]
- Working Group for the Surveillance and Control of COVID-19 in Spain; Members of the Working Group for the Surveillance and Control of COVID-19 in Spain. The first wave of the COVID-19 pandemic in Spain: Characterisation of cases and risk factors for severe outcomes, as at 27 April 2020. Euro. Surveill. 2020, 25, 2001431. [Google Scholar] [CrossRef]
- de Lusignan, S.; Dorward, J.; Correa, A.; Jones, N.; Akinyemi, O.; Amirthalingam, G.; Andrews, N.; Byford, R.; Dabrera, G.; Elliot, A.; et al. Risk factors for SARS-CoV-2 among patients in the Oxford Royal College of General Practitioners Research and Surveillance Centre primary care network: A cross-sectional study. Lancet Infect. Dis. 2020, 20, 1034–1042. [Google Scholar] [CrossRef]
- Reilev, M.; Kristensen, K.B.; Pottegård, A.; Lund, L.C.; Hallas, J.; Ernst, M.T.; Christiansen, C.F.; Sørensen, H.T.; Johansen, N.B.; Brun, N.C.; et al. Characteristics and predictors of hospitalization and death in the first 11 122 cases with a positive RT-PCR test for SARS-CoV-2 in Denmark: A nationwide cohort. Int. J. Epidemiol. 2020, 49, 1468–1481. [Google Scholar] [CrossRef]
- Williamson, E.J.; Walker, A.J.; Bhaskaran, K.; Bacon, S.; Bates, C.; Morton, C.E.; Curtis, H.J.; Mehrkar, A.; Evans, D.; Inglesby, P.; et al. Factors associated with COVID-19-related death using OpenSAFELY. Nature 2020, 584, 430–436. [Google Scholar] [CrossRef] [PubMed]
- Clift, A.K.; Coupland, C.A.C.; Keogh, R.H.; Diaz-Ordaz, K.; Williamson, E.; Harrison, E.M.; Hayward, A.; Hemingway, H.; Horby, P.; Mehta, N.; et al. Living risk prediction algorithm (QCOVID) for risk of hospital admission and mortality from coronavirus 19 in adults: National derivation and validation cohort study. BMJ 2020, 371, m3731. [Google Scholar] [CrossRef]
- Bergman, J.; Ballin, M.; Nordström, A.; Nordström, P. Risk factors for COVID-19 diagnosis, hospitalization, and subsequent all-cause mortality in Sweden: A nationwide study. Eur. J. Epidemiol. 2021, 36, 287–298. [Google Scholar] [CrossRef]
- Yang, J.; Zheng, Y.; Gou, X.; Yang, J.; Zheng, Y.; Gou, X.; Pu, K.; Chen, Z.; Guo, Q.; Ji, R.; et al. Prevalence of comorbidities and its effects in patients infected with SARS-CoV-2: A systematic review and meta-analysis. Int. J. Infect Dis. 2020, 94, 91–95. [Google Scholar] [CrossRef]
- Zheng, Z.; Peng, F.; Xu, B.; Zhao, J.; Liu, H.; Peng, J.; Li, Q.; Jiang, C.; Zhou, Y.; Liu, S.; et al. Risk factors of critical & mortal COVID-19 cases: A systematic literature review and meta-analysis. J. Infect. 2020, 81, e16–e25. [Google Scholar] [CrossRef] [PubMed]
- Kim, L.; Garg, S.; O’Halloran, A.; Whitaker, M.; Pham, H.; Anderson, E.J.; Armistead, I.; Bennett, N.M.; Billing, L.; Como-Sabetti, K.; et al. Risk factors for intensive care unit admission and in-hospital mortality among hospitalized adults identified through the U.S. Coronavirus Disease 2019 (COVID-19)-associated Hospitalization Surveillance Network (COVID-NET). Clin. Infect. Dis. 2020, 16, ciaa1012. [Google Scholar] [CrossRef]
- Cummings, M.J.; Baldwin, M.R.; Abrams, D.; Jacobson, S.D.; Meyer, B.J.; Balough, E.M.; Aaron, J.G.; Claassen, J.; Rabbani, L.E.; Hastie, J.; et al. Epidemiology, clinical course, and outcomes of critically ill adults with COVID-19 in New York City: A prospective cohort study. Lancet 2020, 395, 1763–1770. [Google Scholar] [CrossRef]
- Pijls, B.G.; Jolani, S.; Atherley, A.; Derckx, R.T.; Dijkstra, J.I.R.; Franssen, G.H.L.; Hendriks, S.; Richters, A.; Venemans-Jellema, A.; Zalpuri, S.; et al. Demographic risk factors for COVID-19 infection, severity, ICU admission and death: A meta-analysis of 59 studies. BMJ Open. 2020, 11, e044640. [Google Scholar] [CrossRef] [PubMed]
- European Centre for Disease Prevention and Control. Case Definition for Coronavirus Disease 2019 (COVID-19), as of 29 May 2020. Available online: https://www.ecdc.europa.eu/en/covid-19/surveillance/case-definition (accessed on 16 April 2021).
- Moreno-Iribas, C.; Sayon-Orea, C.; Delfrade, J.; Ardanaz, E.; Gorricho, J.; Burgui, R.; Nuin, M.; Guevara, M. Validity of type 2 diabetes diagnosis in a population-based electronic health record database. BMC Med. Inform. Decis. Mak. 2017, 17, 34. [Google Scholar] [CrossRef] [PubMed]
- Hobart, J.C.; Thompson, A.J. The five item Barthel index. J. Neurol. Neurosurg. Psychiatry. 2001, 71, 225–230. [Google Scholar] [CrossRef]
- Grupos de trabajo COVID-19 de la Comisión Delegada y del Comité Consultivo del Consejo Territorial de Servicios Sociales y del Sistema para la Autonomía y Atención a la Dependencia. Ministerio de Derechos Sociales y Agenda 2030. Informe del Grupo de Trabajo COVID 19 y Residencias. Vers. final (24/11/2020). Available online: https://www.mscbs.gob.es/ssi/imserso/docs/GTCOVID_19_RESIDENCIAS.pdf (accessed on 16 April 2021).
- Pollán, M.; Pérez-Gómez, B.; Pastor-Barriuso, R.; Oteo, J.; Hernán, M.A.; Pérez-Olmeda, M.; Sanmartín, J.L.; Fernández-García, A.; Cruz, I.; Fernández de Larrea, N.; et al. Prevalence of SARS-CoV-2 in Spain (ENE-COVID): A nationwide, population-based seroepidemiological study. Lancet 2020, 396, 535–544. [Google Scholar] [CrossRef]
- Pastor-Barriuso, R.; Pérez-Gómez, B.; Hernán, M.A.; Pérez-Olmeda, M.; Yotti, R.; Oteo-Iglesias, J.; Sanmartín, J.L.; León-Gómez, I.; Fernández-García, A.; Fernández-Navarro, P.; et al. Infection fatality risk for SARS-CoV-2 in community dwelling population of Spain: Nationwide seroepidemiological study. BMJ 2020, 371, m4509. [Google Scholar] [CrossRef] [PubMed]
- Killerby, M.E.; Link-Gelles, R.; Haight, S.C.; Schrodt, C.A.; England, L.; Gomes, D.J.; Shamout, M.; Pettrone, K.; O’Laughlin, K.; Kimball, A.; et al. Characteristics associated with hospitalization among patients with COVID-19—Metropolitan Atlanta, Georgia, March-April 2020. MMWR Morb. Mortal. Wkly. Rep. 2020, 69, 790–794. [Google Scholar] [CrossRef]
- Lippi, G.; Henry, B.M. Active smoking is not associated with severity of coronavirus disease 2019 (COVID-19). Eur. J. Intern. Med. 2020, 75, 107–108. [Google Scholar] [CrossRef] [PubMed]
- Reddy, R.K.; Charles, W.N.; Sklavounos, A.; Dutt, A.; Seed, P.T.; Khajuria, A. The effect of smoking on COVID-19 severity: A systematic review and meta-analysis. J. Med. Virol. 2021, 93, 1045–1056. [Google Scholar] [CrossRef]
- World Health Organization. Smoking and COVID-19. Scientific Brief. 30 June 2020. Available online: https://escholarship.org/content/qt22m8z3sq/qt22m8z3sq.pdf (accessed on 16 April 2021).
- Fresán, U.; Guevara, M.; Elía, F.; Albéniz, E.; Burgui, C.; Castilla, J.; Working Group for the Study of COVID-19 in Navarra. Independent role of severe obesity as a risk factor for COVID-19 hospitalization: A Spanish population-based cohort study. Obesity 2021, 29, 29–37. [Google Scholar] [CrossRef] [PubMed]
- Wang, B.; Li, R.; Lu, Z.; Huang, Y. Does comorbidity increase the risk of patients with COVID-19: Evidence from meta-analysis. Aging 2020, 12, 6049–6057. [Google Scholar] [CrossRef]
- Fresán, U.; Guevara, M.; Trobajo-Sanmartín, C.; Burgui, C.; Ezpeleta, C.; Castilla, J. Hypertension and related comorbidities as potential risk factors for COVID-19 hospitalization and severity: A prospective population-based cohort study. J. Clin. Med. 2021, 10, 1194. [Google Scholar] [CrossRef] [PubMed]
- Merino, P.; Guinea, J.; Muñoz-Gallego, I.; González-Donapetry, P.; Galán, J.C.; Antona, N.; Cilla, G.; Hernáez-Crespo, S.; Díaz-de Tuesta, J.L.; Gual-de Torrella, A.; et al. Multicenter evaluation of the Panbio™ COVID-19 rapid antigen-detection test for the diagnosis of SARS-CoV-2 infection. Clin. Microbiol. Infect. 2021, 27, 758–761. [Google Scholar] [CrossRef]


| Infections | Sex- and Age-Adjusted Analysis | Fully Adjusted Analysis * | ||||||
|---|---|---|---|---|---|---|---|---|
| n | Cases per 100,000 | RR | 95% CI | p Value | RR | 95% CI | p Value | |
| Total | 35,387 | 5497 | ||||||
| Sex | ||||||||
| Female | 18,215 | 5609 | 1 | 1 | ||||
| Male | 17,172 | 5383 | 0.95 | 0.93–0.97 | <0.001 | 0.98 | 0.96–1.00 | 0.078 |
| Age, years | ||||||||
| 0–14 | 5625 | 5457 | 0.99 | 0.95–1.02 | 0.441 | 1.01 | 0.97–1.05 | 0.526 |
| 15–29 | 7640 | 7611 | 1.37 | 1.33–1.42 | <0.001 | 1.28 | 1.24–1.33 | <0.001 |
| 30–49 | 10,248 | 5544 | 1.00 | 0.97–1.03 | 0.976 | 0.96 | 0.93–0.99 | 0.017 |
| 50–59 | 5187 | 5541 | 1 | 1 | ||||
| 60–69 | 2986 | 4204 | 0.76 | 0.72–0.79 | <0.001 | 0.75 | 0.72–0.79 | <0.001 |
| 70–79 | 1899 | 3557 | 0.64 | 0.61–0.68 | <0.001 | 0.59 | 0.56–0.62 | <0.001 |
| 80+ | 1802 | 4818 | 0.86 | 0.82–0.91 | <0.001 | 0.64 | 0.59–0.68 | <0.001 |
| Nursing home resident | 681 | 13,830 | 3.28 | 3.02–3.55 | <0.001 | 3.24 | 2.98–3.53 | <0.001 |
| Healthcare worker | 692 | 6290 | 1.11 | 1.03–1.20 | 0.005 | 1.23 | 1.14–1.33 | <0.001 |
| Place of birth | ||||||||
| Spain | 26,779 | 4959 | 1 | 1 | ||||
| Europe | 1049 | 4114 | 0.80 | 0.75–0.85 | <0.001 | 0.81 | 0.76–0.86 | <0.001 |
| Latin America | 5738 | 11,175 | 2.11 | 2.04–2.17 | <0.001 | 2.08 | 2.01–2.14 | <0.001 |
| North Africa | 1213 | 7586 | 1.45 | 1.36–1.53 | <0.001 | 1.44 | 1.36–1.53 | <0.001 |
| Sub-Saharan Africa | 459 | 6387 | 1.23 | 1.13–1.35 | <0.001 | 1.21 | 1.10–1.32 | <0.001 |
| Other | 149 | 3951 | 0.75 | 0.64–0.88 | 0.001 | 0.75 | 0.64–0.88 | 0.001 |
| Place of residence | ||||||||
| >50,000 inhabitants | 11,249 | 5548 | 1.06 | 1.03–1.09 | <0.001 | 1.01 | 0.99–1.04 | 0.355 |
| 5000–50,000 inhabitants | 12,711 | 5708 | 1.07 | 1.05–1.10 | <0.001 | 1.04 | 1.02–1.07 | 0.001 |
| <5000 inhabitants | 11,427 | 5234 | 1 | 1 | ||||
| Income level | ||||||||
| Very low | 1734 | 6201 | 1.16 | 1.10–1.22 | <0.001 | 1.00 | 0.95–1.05 | 0.929 |
| Low | 20,437 | 5760 | 1.10 | 1.08–1.13 | <0.001 | 0.99 | 0.97–1.02 | 0.521 |
| Middle | 12,983 | 5064 | 1 | 1 | ||||
| High | 233 | 5080 | 0.98 | 0.86–1.11 | 0.747 | 0.99 | 0.87–1.13 | 0.922 |
| Smoking status | ||||||||
| Never smoker | 3191 | 3884 | 1 | 1 | ||||
| Current smoker | 6119 | 5788 | 0.63 | 0.60–0.66 | <0.001 | 0.67 | 0.64–0.70 | <0.001 |
| Former smoker | 1235 | 5136 | 0.98 | 0.92–1.04 | 0.445 | 1.01 | 0.95–1.07 | 0.785 |
| Unknown | 24,842 | 5752 | 0.88 | 0.85–0.90 | <0.001 | 0.87 | 0.85–0.90 | <0.001 |
| Hospitalization in prior year | 1917 | 5718 | 1.13 | 1.08–1.18 | <0.001 | 1.09 | 1.04–1.14 | 0.001 |
| Immunodeficiency | 267 | 5501 | 1.04 | 0.93–1.18 | 0.487 | 1.00 | 0.89–1.13 | 0.984 |
| Diabetes | 1893 | 4992 | 1.14 | 1.08–1.19 | <0.001 | 1.06 | 1.01–1.11 | 0.024 |
| Cardiovascular disease | 2736 | 5216 | 1.07 | 1.03–1.12 | 0.001 | 1.08 | 1.03–1.12 | <0.001 |
| COPD | 1404 | 5074 | 1.04 | 0.99–1.10 | 0.112 | 1.10 | 1.04–1.16 | 0.001 |
| Asthma | 2330 | 5535 | 0.97 | 0.93–1.01 | 0.162 | 1.00 | 0.96–1.04 | 0.969 |
| Chronic kidney disease | 989 | 5130 | 1.16 | 1.08–1.24 | <0.001 | 1.11 | 1.04–1.19 | 0.002 |
| Cerebrovascular disease | 470 | 4868 | 1.10 | 1.00–1.21 | 0.048 | 0.99 | 0.90–1.09 | 0.841 |
| Liver cirrhosis | 632 | 5244 | 1.11 | 1.03–1.21 | 0.008 | 1.06 | 0.98–1.15 | 0.127 |
| Dementia | 369 | 7420 | 1.72 | 1.54–1.92 | <0.001 | 1.25 | 1.11–1.40 | <0.001 |
| Hematological malignancy | 110 | 4073 | 0.85 | 0.70–1.02 | 0.087 | 0.87 | 0.72–1.05 | 0.139 |
| Non-hematological cancer | 1695 | 4363 | 0.96 | 0.91–1.01 | 0.090 | 0.98 | 0.93–1.03 | 0.454 |
| Severe obesity | 527 | 6295 | 1.24 | 1.13–1.35 | <0.001 | 1.18 | 1.08–1.29 | <0.001 |
| Hypertension | 4543 | 4666 | 1.07 | 1.03–1.12 | <0.001 | 1.05 | 1.01–1.09 | 0.013 |
| Functional dependence | 339 | 7399 | 1.65 | 1.48–1.85 | <0.001 | 1.22 | 1.08–1.38 | 0.001 |
| Hospitalizations | Sex- and Age-Adjusted Analysis | Fully Adjusted Analysis * | ||||||
|---|---|---|---|---|---|---|---|---|
| n | Cases per 100,000 | RR | 95% CI | p Value | RR | 95% CI | p Value | |
| Total | 2080 | 323 | ||||||
| Sex | ||||||||
| Female | 1000 | 308 | 1 | 1 | ||||
| Male | 1080 | 339 | 1.27 | 1.16–1.38 | <0.001 | 1.32 | 1.21–1.45 | <0.001 |
| Age, years | ||||||||
| 0–14 | 24 | 23 | 0.06 | 0.04–0.09 | <0.001 | 0.07 | 0.04–0.10 | <0.001 |
| 15–29 | 48 | 48 | 0.12 | 0.09–0.17 | <0.001 | 0.11 | 0.08–0.15 | <0.001 |
| 30–49 | 368 | 199 | 0.51 | 0.44–0.59 | <0.001 | 0.48 | 0.41–0.55 | <0.001 |
| 50–59 | 365 | 390 | 1 | 1 | ||||
| 60–69 | 353 | 497 | 1.28 | 1.10–1.48 | 0.001 | 1.25 | 1.07–1.45 | 0.004 |
| 70–79 | 365 | 684 | 1.77 | 1.53–2.05 | <0.001 | 1.49 | 1.27–1.75 | <0.001 |
| 80+ | 557 | 1489 | 3.95 | 3.46–4.51 | <0.001 | 2.42 | 2.04–2.87 | <0.001 |
| Nursing home resident | 162 | 3290 | 3.56 | 3.00–4.22 | <0.001 | 3.23 | 2.69–3.88 | <0.001 |
| Healthcare worker | 22 | 200 | 0.76 | 0.50–1.16 | 0.199 | 0.98 | 0.64–1.51 | 0.936 |
| Place of birth | ||||||||
| Spain | 1640 | 304 | 1 | 1 | ||||
| Europe | 62 | 243 | 1.30 | 1.01–1.69 | 0.043 | 1.27 | 0.98–1.64 | 0.075 |
| Latin America | 296 | 576 | 3.70 | 3.24–4.23 | <0.001 | 3.47 | 3.02–3.99 | <0.001 |
| North Africa | 53 | 331 | 2.22 | 1.68–2.94 | <0.001 | 2.17 | 1.63–2.89 | <0.001 |
| Sub-Saharan Africa | 21 | 292 | 1.86 | 1.20–2.87 | 0.005 | 1.63 | 1.05–2.54 | 0.029 |
| Other | 8 | 212 | 1.30 | 0.65–2.60 | 0.463 | 1.28 | 0.64–2.57 | 0.489 |
| Place of residence | ||||||||
| >50,000 inhabitants | 723 | 357 | 1.17 | 1.05–1.30 | 0.004 | 1.14 | 1.02–1.27 | 0.019 |
| 5000–50,000 inhabitants | 695 | 312 | 1.20 | 1.08–1.34 | 0.001 | 1.16 | 1.04–1.29 | 0.007 |
| <5000 inhabitants | 662 | 303 | 1 | 1 | ||||
| Income level | ||||||||
| Very low | 102 | 365 | 2.04 | 1.66–2.52 | <0.001 | 1.27 | 1.02–1.58 | 0.034 |
| Low | 1288 | 363 | 1.28 | 1.16–1.41 | <0.001 | 1.05 | 0.95–1.16 | 0.372 |
| Middle | 677 | 264 | 1 | 1 | ||||
| High | 13 | 283 | 1.08 | 0.62–1.86 | 0.796 | 1.11 | 0.64–1.92 | 0.715 |
| Smoking status | ||||||||
| Never smoker | 191 | 233 | 1 | 1 | ||||
| Current smoker | 611 | 578 | 0.54 | 0.45–0.64 | <0.001 | 0.54 | 0.46–0.65 | <0.001 |
| Former smoker | 181 | 753 | 1.05 | 0.89–1.24 | 0.580 | 1.02 | 0.86–1.21 | 0.798 |
| Unknown | 1097 | 254 | 0.86 | 0.77–0.96 | 0.006 | 0.84 | 0.76–0.94 | 0.002 |
| Hospitalization in prior year | 243 | 725 | 1.52 | 1.33–1.74 | <0.001 | 1.28 | 1.11–1.47 | 0.001 |
| Immunodeficiency | 36 | 742 | 2.04 | 1.47–2.84 | <0.001 | 1.67 | 1.20–2.32 | 0.003 |
| Diabetes | 408 | 1076 | 1.61 | 1.43–1.80 | <0.001 | 1.33 | 1.18–1.49 | <0.001 |
| Cardiovascular disease | 411 | 784 | 1.33 | 1.19–1.50 | <0.001 | 1.18 | 1.05–1.33 | 0.007 |
| COPD | 195 | 705 | 1.29 | 1.11–1.50 | 0.001 | 1.30 | 1.11–1.51 | 0.001 |
| Asthma | 147 | 349 | 1.29 | 1.09–1.53 | 0.003 | 1.27 | 1.07–1.50 | 0.006 |
| Chronic kidney disease | 275 | 1426 | 1.65 | 1.43–1.89 | <0.001 | 1.41 | 1.23–1.63 | <0.001 |
| Cerebrovascular disease | 135 | 1398 | 1.58 | 1.32–1.89 | <0.001 | 1.27 | 1.06–1.52 | 0.011 |
| Liver cirrhosis | 105 | 871 | 1.66 | 1.36–2.02 | <0.001 | 1.42 | 1.17–1.74 | 0.001 |
| Dementia | 108 | 2172 | 1.89 | 1.54–2.32 | <0.001 | 1.28 | 1.02–1.59 | 0.032 |
| Hematological malignancy | 24 | 889 | 1.40 | 0.94–2.10 | 0.099 | 1.38 | 0.92–2.06 | 0.119 |
| Non-hematological cancer | 255 | 656 | 0.97 | 0.85–1.11 | 0.651 | 0.96 | 0.84–1.11 | 0.605 |
| Severe obesity | 79 | 944 | 2.20 | 1.75–2.75 | <0.001 | 1.79 | 1.42–2.25 | <0.001 |
| Hypertension | 840 | 863 | 1.27 | 1.15–1.41 | <0.001 | 1.11 | 1.01–1.25 | 0.040 |
| Functional dependence | 116 | 2532 | 2.28 | 1.87–2.79 | <0.001 | 1.54 | 1.24–1.91 | <0.001 |
| Intensive Care Unit Admissions | Sex- and Age-Adjusted Analysis | Fully Adjusted Analysis * | ||||||
|---|---|---|---|---|---|---|---|---|
| n | Cases per 100,000 | RR | 95% CI | p Value | RR | 95% CI | p Value | |
| Total | 246 | 38 | ||||||
| Sex | ||||||||
| Female | 92 | 28 | 1 | 1 | ||||
| Male | 154 | 48 | 1.79 | 1.38–2.31 | <0.001 | 2.02 | 1.53–2.66 | <0.001 |
| Age, years | ||||||||
| 0–14 | 1 | 1 | 0.02 | 0.00–0.11 | <0.001 | 0.02 | 0–0.14 | <0.001 |
| 15–29 | 2 | 2 | 0.03 | 0.01–0.13 | <0.001 | 0.03 | 0.01–0.11 | <0.001 |
| 30–49 | 30 | 16 | 0.26 | 0.17–0.40 | <0.001 | 0.23 | 0.15–0.37 | <0.001 |
| 50–59 | 59 | 63 | 1 | 1 | ||||
| 60–69 | 72 | 101 | 1.62 | 1.15–2.29 | 0.006 | 1.73 | 1.21–2.46 | 0.003 |
| 70–79 | 68 | 127 | 2.07 | 1.46–2.93 | <0.001 | 2.21 | 1.49–3.29 | <0.001 |
| 80+ | 14 | 37 | 0.64 | 0.36–1.15 | 0.139 | 0.72 | 0.37–1.38 | 0.320 |
| Nursing home resident | 4 | 81 | 1.47 | 0.54–4.01 | 0.455 | 2.07 | 0.75–5.74 | 0.161 |
| Healthcare worker | 4 | 36 | 1.10 | 0.41–2.99 | 0.850 | 1.55 | 0.56–4.23 | 0.397 |
| Place of birth | ||||||||
| Spain | 175 | 32 | 1 | 1 | ||||
| Europe | 7 | 27 | 1.31 | 0.61–2.80 | 0.491 | 1.24 | 0.57–2.67 | 0.588 |
| Latin America | 55 | 107 | 6.73 | 4.88–9.30 | <0.001 | 6.15 | 4.34–8.72 | <0.001 |
| North Africa | 7 | 44 | 2.84 | 1.32–6.10 | 0.008 | 2.88 | 1.30–6.36 | 0.009 |
| Sub-Saharan Africa | 2 | 28 | 1.67 | 0.41–6.80 | 0.472 | 1.38 | 0.34–5.70 | 0.654 |
| Other | 0 | 0 | NE | NE | ||||
| Place of residence | ||||||||
| >50,000 inhabitants | 84 | 41 | 1.55 | 1.11–2.17 | 0.010 | 1.39 | 0.99–1.95 | 0.061 |
| 5000–50,000 inhabitants | 104 | 47 | 1.97 | 1.43–2.71 | <0.001 | 1.80 | 1.30–2.50 | <0.001 |
| <5000 inhabitants | 58 | 27 | 1 | 1 | ||||
| Income level | ||||||||
| Very low | 17 | 61 | 2.79 | 1.66–4.70 | <0.001 | 1.49 | 0.85–2.61 | 0.162 |
| Low | 131 | 37 | 1.21 | 0.93–1.59 | 0.158 | 0.96 | 0.72–1.27 | 0.755 |
| Middle | 96 | 37 | 1 | 1 | ||||
| High | 2 | 44 | 1.08 | 0.27–4.38 | 0.917 | 1.15 | 0.28–4.67 | 0.846 |
| Smoking status | ||||||||
| Never smoker | 30 | 37 | 1 | 1 | ||||
| Current smoker | 67 | 63 | 0.50 | 0.32–0.77 | 0.002 | 0.57 | 0.36–0.89 | 0.014 |
| Former smoker | 27 | 112 | 0.97 | 0.62–1.53 | 0.895 | 1.01 | 0.64–1.60 | 0.961 |
| Unknown | 122 | 28 | 0.72 | 0.52–0.98 | 0.037 | 0.77 | 0.56–1.05 | 0.099 |
| Hospitalization in prior year | 16 | 48 | 0.89 | 0.54–1.49 | 0.662 | 0.84 | 0.50–1.41 | 0.516 |
| Immunodeficiency | 5 | 103 | 1.93 | 0.80–4.69 | 0.145 | 1.66 | 0.68–4.06 | 0.267 |
| Diabetes | 46 | 121 | 1.56 | 1.11–2.17 | 0.009 | 1.21 | 0.86–1.72 | 0.276 |
| Cardiovascular disease | 33 | 63 | 1.00 | 0.69–1.47 | 0.988 | 0.90 | 0.61–1.33 | 0.595 |
| COPD | 22 | 80 | 1.14 | 0.73–1.78 | 0.559 | 1.22 | 0.78–1.92 | 0.386 |
| Asthma | 23 | 55 | 1.94 | 1.26–2.99 | 0.003 | 1.84 | 1.19–2.83 | 0.006 |
| Chronic kidney disease | 22 | 114 | 1.70 | 1.07–2.68 | 0.025 | 1.49 | 0.94–2.39 | 0.093 |
| Cerebrovascular disease | 7 | 73 | 0.89 | 0.42–1.91 | 0.774 | 0.85 | 0.40–1.83 | 0.679 |
| Liver cirrhosis | 16 | 133 | 1.72 | 1.03–2.86 | 0.037 | 1.43 | 0.85–2.39 | 0.173 |
| Dementia | 0 | 0 | NE | NE | ||||
| Hematological malignancy | 1 | 37 | 0.52 | 0.07–3.72 | 0.516 | 0.55 | 0.08–3.91 | 0.548 |
| Non-hematological cancer | 29 | 75 | 0.87 | 0.59–1.30 | 0.506 | 0.92 | 0.61–1.37 | 0.673 |
| Severe obesity | 16 | 191 | 3.69 | 2.22–6.13 | <0.001 | 3.05 | 1.81–5.14 | <0.001 |
| Hypertension | 100 | 103 | 1.53 | 1.15–2.03 | 0.003 | 1.36 | 1.01–1.83 | 0.041 |
| Functional dependence | 1 | 22 | 0.42 | 0.06–3.05 | 0.392 | 0.52 | 0.07–3.81 | 0.520 |
| Deaths | Sex- and Age-Adjusted Analysis | Fully Adjusted Analysis * | ||||||
|---|---|---|---|---|---|---|---|---|
| n | Cases per 100,000 | RR | 95% CI | p Value | RR | 95% CI | p Value | |
| Total | 466 | 72 | ||||||
| Sex | ||||||||
| Female | 240 | 74 | 1 | 1 | ||||
| Male | 226 | 71 | 1.42 | 1.19–1.71 | <0.001 | 1.61 | 1.31–1.97 | <0.001 |
| Age, years | ||||||||
| 0–29 | 0 | 0 | NE | NE | ||||
| 30-49 | 2 | 1 | 0.06 | 0.01-0.28 | <0.001 | 0.06 | 0.01-0.27 | <0.001 |
| 50-59 | 16 | 17 | 1 | 1 | ||||
| 60–69 | 32 | 45 | 2.65 | 1.45–4.83 | 0.002 | 2.44 | 1.33–4.48 | 0.004 |
| 70–79 | 72 | 135 | 8.00 | 4.65–13.75 | <0.001 | 5.88 | 3.34–10.34 | <0.001 |
| 80+ | 344 | 920 | 56.53 | 34.22–93.37 | <0.001 | 24.43 | 14.12–42.29 | <0.001 |
| Nursing home resident | 112 | 2275 | 5.30 | 4.25–6.62 | <0.001 | 4.19 | 3.28–5.36 | <0.001 |
| Healthcare worker | 0 | 0 | NE | NE | ||||
| Place of birth | ||||||||
| Spain | 444 | 82 | 1 | 1 | ||||
| Europe | 1 | 4 | 0.25 | 0.04–1.80 | 0.169 | 0.23 | 0.03–1.67 | 0.148 |
| Latin America | 16 | 31 | 2.64 | 1.59–4.40 | <0.001 | 2.57 | 1.52–4.36 | 0.001 |
| North Africa | 3 | 19 | 1.96 | 0.63–6.14 | 0.247 | 2.03 | 0.64–6.43 | 0.230 |
| Sub-Saharan Africa | 2 | 28 | 3.96 | 0.97–16.09 | 0.055 | 3.41 | 0.82–14.08 | 0.090 |
| Other | 0 | 0 | NE | NE | ||||
| Place of residence | ||||||||
| >50,000 inhabitants | 147 | 72 | 0.87 | 0.70–1.08 | 0.203 | 1.00 | 0.80–1.25 | 0.988 |
| 5000–50,000 inhabitants | 135 | 61 | 1.06 | 0.85–1.32 | 0.611 | 1.07 | 0.86–1.34 | 0.537 |
| <5000 inhabitants | 184 | 84 | 1 | 1 | ||||
| Income level | ||||||||
| Very low | 18 | 64 | 3.52 | 2.12–5.86 | <0.001 | 1.95 | 1.15–3.32 | 0.013 |
| Low | 352 | 99 | 1.66 | 1.31–2.10 | <0.001 | 1.35 | 1.06–1.72 | 0.016 |
| Middle | 95 | 37 | 1 | 1 | ||||
| High | 1 | 22 | 0.65 | 0.09–4.68 | 0.671 | 0.67 | 0.09–4.79 | 0.687 |
| Smoking status | ||||||||
| Never smoker | 29 | 35 | 1 | 1 | ||||
| Current smoker | 200 | 189 | 0.77 | 0.51–1.15 | 0.202 | 0.67 | 0.44–1.01 | 0.058 |
| Former smoker | 47 | 195 | 1.08 | 0.78–1.51 | 0.643 | 1.03 | 0.74–1.44 | 0.852 |
| Unknown | 190 | 44 | 0.97 | 0.79–1.18 | 0.741 | 0.80 | 0.65–0.99 | 0.039 |
| Hospitalization in prior year | 88 | 262 | 1.72 | 1.36–2.17 | <0.001 | 1.30 | 1.02–1.65 | 0.034 |
| Immunodeficiency | 8 | 165 | 2.74 | 1.36–5.52 | 0.005 | 2.22 | 1.10–4.48 | 0.027 |
| Diabetes | 143 | 377 | 1.58 | 1.29–1.92 | <0.001 | 1.29 | 1.05–1.58 | 0.014 |
| Cardiovascular disease | 172 | 328 | 1.52 | 1.25–1.84 | <0.001 | 1.33 | 1.09–1.63 | 0.004 |
| COPD | 69 | 249 | 1.58 | 1.22–2.05 | 0.001 | 1.47 | 1.12–1.91 | 0.005 |
| Asthma | 28 | 67 | 1.05 | 0.72–1.54 | 0.796 | 1.03 | 0.70–1.51 | 0.886 |
| Chronic kidney disease | 134 | 695 | 1.73 | 1.41–1.13 | <0.001 | 1.48 | 1.20–1.83 | <0.001 |
| Cerebrovascular disease | 56 | 580 | 1.45 | 1.09–1.92 | 0.010 | 1.04 | 0.78–1.38 | 0.803 |
| Liver cirrhosis | 22 | 183 | 1.52 | 0.99–2.34 | 0.056 | 1.37 | 0.89–2.11 | 0.156 |
| Dementia | 83 | 1669 | 2.89 | 2.26–3.69 | <0.001 | 1.56 | 1.19–2.04 | 0.002 |
| Hematological malignancy | 9 | 333 | 1.54 | 0.80–2.98 | 0.201 | 1.59 | 0.82–3.09 | 0.167 |
| Non-hematological cancer | 64 | 165 | 0.72 | 0.55–0.93 | 0.014 | 0.72 | 0.55–0.94 | 0.014 |
| Severe obesity | 10 | 119 | 1.24 | 0.66–2.33 | 0.497 | 0.88 | 0.47–1.66 | 0.701 |
| Hypertension | 314 | 322 | 1.36 | 1.11–1.66 | 0.003 | 1.23 | 1.00–1.51 | 0.055 |
| Functional dependence | 95 | 2073 | 3.77 | 2.98–4.76 | <0.001 | 2.24 | 1.72–2.90 | <0.001 |
| COVID-19 Hospitalization | Intensive Care Unit Admission by COVID-19 | Death from COVID-19 | |||||||
|---|---|---|---|---|---|---|---|---|---|
| Categories | n | % | Events per 100,000 | n | % | Events per 100,000 | n | % | Events per 100,000 |
| Nursing home resident | 162 | 7.8 | 3290 | 4 | 1.6 | 81 | 112 | 24.0 | 2275 |
| Functional dependent | 86 | 4.1 | 2288 | 1 | 0.4 | 27 | 55 | 11.8 | 1463 |
| ≥80 years | |||||||||
| Chronic conditions | 323 | 15.5 | 1411 | 11 | 4.5 | 48 | 171 | 36.7 | 747 |
| No chronic conditions | 69 | 3.3 | 789 | 3 | 1.2 | 34 | 30 | 6.4 | 343 |
| 70–79 years | |||||||||
| Chronic conditions | 232 | 11.2 | 741 | 46 | 18.7 | 147 | 46 | 9.9 | 147 |
| No chronic conditions | 93 | 4.5 | 449 | 21 | 8.5 | 101 | 11 | 2.4 | 53 |
| 60–69 years | |||||||||
| Chronic conditions | 184 | 8.8 | 583 | 39 | 15.9 | 123 | 21 | 4.5 | 66 |
| No chronic conditions | 152 | 7.3 | 391 | 31 | 12.6 | 80 | 7 | 1.5 | 18 |
| 50–59 years | |||||||||
| Chronic conditions | 144 | 6.9 | 517 | 27 | 11.0 | 97 | 7 | 1.5 | 25 |
| No chronic conditions | 204 | 9.8 | 312 | 31 | 12.6 | 47 | 4 | 0.9 | 6 |
| 0–49 years | |||||||||
| Chronic conditions | 106 | 5.1 | 162 | 17 | 6.9 | 26 | 1 | 0.2 | 2 |
| No chronic conditions | 325 | 15.6 | 101 | 15 | 6.1 | 5 | 1 | 0.2 | 0.3 |
| Total | 2080 | 100.0 | 323 | 246 | 100.0 | 38 | 466 | 100.0 | 72 |
Publisher’s Note: MDPI stays neutral with regard to jurisdictional claims in published maps and institutional affiliations. |
© 2021 by the authors. Licensee MDPI, Basel, Switzerland. This article is an open access article distributed under the terms and conditions of the Creative Commons Attribution (CC BY) license (https://creativecommons.org/licenses/by/4.0/).
Share and Cite
Castilla, J.; Guevara, M.; Miqueleiz, A.; Baigorria, F.; Ibero-Esparza, C.; Navascués, A.; Trobajo-Sanmartín, C.; Martínez-Baz, I.; Casado, I.; Burgui, C.; et al. Risk Factors of Infection, Hospitalization and Death from SARS-CoV-2: A Population-Based Cohort Study. J. Clin. Med. 2021, 10, 2608. https://doi.org/10.3390/jcm10122608
Castilla J, Guevara M, Miqueleiz A, Baigorria F, Ibero-Esparza C, Navascués A, Trobajo-Sanmartín C, Martínez-Baz I, Casado I, Burgui C, et al. Risk Factors of Infection, Hospitalization and Death from SARS-CoV-2: A Population-Based Cohort Study. Journal of Clinical Medicine. 2021; 10(12):2608. https://doi.org/10.3390/jcm10122608
Chicago/Turabian StyleCastilla, Jesús, Marcela Guevara, Ana Miqueleiz, Fernando Baigorria, Carlos Ibero-Esparza, Ana Navascués, Camino Trobajo-Sanmartín, Iván Martínez-Baz, Itziar Casado, Cristina Burgui, and et al. 2021. "Risk Factors of Infection, Hospitalization and Death from SARS-CoV-2: A Population-Based Cohort Study" Journal of Clinical Medicine 10, no. 12: 2608. https://doi.org/10.3390/jcm10122608
APA StyleCastilla, J., Guevara, M., Miqueleiz, A., Baigorria, F., Ibero-Esparza, C., Navascués, A., Trobajo-Sanmartín, C., Martínez-Baz, I., Casado, I., Burgui, C., Ezpeleta, C., & The Working Group for the Study of COVID-19 in Navarra. (2021). Risk Factors of Infection, Hospitalization and Death from SARS-CoV-2: A Population-Based Cohort Study. Journal of Clinical Medicine, 10(12), 2608. https://doi.org/10.3390/jcm10122608