
Faecal Calprotectin in Assessment of Mucosal Healing in Adults with Inflammatory Bowel Disease: A Meta-Analysis

 , , and
Abstract
1. Introduction
2. Materials and Methods
3. Results
4. Discussion
5. Conclusions
Supplementary Materials
Author Contributions
Funding
Institutional Review Board Statement
Informed Consent Statement
Data Availability Statement
Conflicts of Interest
References
- Colombel, J.F.; Mahadevan, U. Inflammatory Bowel Disease 2017: Innovations and Changing Paradigms. Gastroenterology 2017, 152, 309–312. [Google Scholar] [CrossRef] [PubMed]
- De Souza, H.S.P.; Fiocchi, C. Network Medicine: A Mandatory Next Step for Inflammatory Bowel Disease. Inflamm. Bowel Dis. 2018, 4, 671–679. [Google Scholar] [CrossRef]
- Vavricka, S.R.; Schoepfer, A.; Scharl, M.; Lakatos, P.L.; Navarini, A.; Rogler, G. Extraintestinal Manifestations of Inflammatory Bowel Disease. Inflamm. Bowel Dis. 2015, 21, 1982–1992. [Google Scholar] [CrossRef]
- Colombel, J.-F.; D’haens, G.; Lee, W.-J.; Petersson, J.; Panaccione, R. Outcomes and Strategies to Support a Treat-to-target Approach in Inflammatory Bowel Disease: A Systematic Review. J. Crohn’s Colitis 2020, 14, 254–266. [Google Scholar] [CrossRef] [PubMed]
- Peyrin-Biroulet, L.; Sandborn, W.; Sands, B.E.; Reinisch, W.; Bemelman, W.; Bryant, R.V.; D’Haens, G.; Dotan, I.; Dubinsky, M.; Feagan, B.; et al. Selecting Therapeutic Targets in Inflammatory Bowel Disease (STRIDE): Determining Therapeutic Goals for Treat-to-Target. Am. J. Gastroenterol. 2015, 110, 1324–1338. [Google Scholar] [CrossRef] [PubMed]
- Magro, F.; Gionchetti, P.; Eliakim, R.; Ardizzone, S.; Armuzzi, A.; Barreiro-de Acosta, M.; Burisch, J.; Gecse, K.; Hart, A.; Hindryckx, P.; et al. Third European Evidence-based Consensus on Diagnosis and Management of Ulcerative Colitis. Part 1: Definitions, Diagnosis, Extra-intestinal Manifestations, Pregnancy, Cancer Surveillance, Surgery, and Ileo-anal Pouch Disorders. J. Crohn’s Colitis 2017, 11, 649–670. [Google Scholar] [CrossRef] [PubMed]
- Sandborn, W.J.; Colombel, J.-F.; Panaccione, R.; Dulai, P.S.; Rosario, M.; Cao, C.; Barocas, M.; Lasch, K. Deep Remission with Vedolizumab in Patients with Moderately to Severely Active Ulcerative Colitis: A GEMINI 1 post hoc Analysis. J. Crohn’s Colitis 2019, 13, 172–181. [Google Scholar] [CrossRef]
- Schroeder, K.W.; Tremaine, W.J.; Ilstrup, D.M. Coated Oral 5-Aminosalicylic Acid Therapy for Mildly to Moderately Active Ulcerative Colitis. N. Engl. J. Med. 1987, 17, 1625–1629. [Google Scholar] [CrossRef]
- Rutgeerts, P.; Sandborn, W.J.; Feagan, B.G.; Reinisch, W.; Olson, A.; Johanns, J.; Travers, S.; Rachmilewitz, D.; Hanauer, S.B.; Lichtenstein, G.R.; et al. Infliximab for induction and maintenance therapy for ulcerative colitis. N. Engl. J. Med. 2005, 53, 2462–2476. [Google Scholar] [CrossRef]
- Maaser, C.; Sturm, A.; Vavricka, S.R.; Kucharzik, T.; Fiorino, G.; Annese, V.; Calabrese, E.; Baumgart, D.C.; Bettenworth, D.; Borralho Nunes, P.; et al. ECCO-ESGAR Guideline for Diagnostic Assessment in IBD Part 1: Initial diagnosis, monitoring of known IBD, detection of complications. J. Crohn’s Colitis 2019, 13, 144–164K. [Google Scholar] [CrossRef] [PubMed]
- Sturm, A.; Maaser, C.; Calabrese, E.; Annese, V.; Fiorino, G.; Kucharzik, T.; Vavricka, S.R.; Verstockt, B.; Van Rheenen, P.; Tolan, D.; et al. ECCO-ESGAR guideline for diagnostic assessment in ibd part 2: IBD scores and general principles and technical aspects. J. Crohn’s Colitis 2019, 13, 273–284. [Google Scholar] [CrossRef] [PubMed]
- Matsuoka, K.; Kobayashi, T.; Ueno, F.; Matsui, T.; Hirai, F.; Inoue, N.; Kato, J.; Kobayashi, K.; Kobayashi, K.; Koganei, K.; et al. Evidence-based clinical practice guidelines for inflammatory bowel disease. J. Gastroenterol. 2018, 53, 305–353. [Google Scholar] [CrossRef]
- Annese, V.; Daperno, M.; Rutter, M.D.; Amiot, A.; Bossuyt, P.; East, J.; Ferrante, M.; Götz, M.; Katsanos, K.H.; Kießlich, R.; et al. European evidence based consensus for endoscopy in inflammatory bowel disease. J. Crohn’s Colitis 2013, 7, 982–1018. [Google Scholar] [CrossRef] [PubMed]
- Daperno, M.; D’Haens, G.; Van Assche, G.; Baert, F.; Bulois, P.; Maunoury, V.; Sostegni, R.; Rocca, R.; Pera, A.; Gevers, A.; et al. Development and validation of a new, simplified endoscopic activity score for Crohn’s disease: The SES-CD. Gastrointest. Endosc. 2004, 60, 505–512. [Google Scholar] [CrossRef]
- Ardizzone, S.; Cassinotti, A.; Duca, P.; Mazzali, C.; Penati, C.; Manes, G.; Marmo, R.; Massari, A.; Molteni, P.; Maconi, G.; et al. Mucosal Healing Predicts Late Outcomes After the First Course of Corticosteroids for Newly Diagnosed Ulcerative Colitis. Clin. Gastroenterol. Hepatol. 2011, 9, 483–489. [Google Scholar] [CrossRef]
- Colombel, J.F.; Rutgeerts, P.; Reinisch, W.; Esser, D.; Wang, Y.; Lang, Y.; Marano, C.W.; Strauss, R.; Oddens, B.J.; Feagan, B.G.; et al. Early mucosal healing with infliximab is associated with improved long-term clinical outcomes in ulcerative colitis. Gastroenterology 2011, 141, 1194–1201. [Google Scholar] [CrossRef]
- Rutter, M.; Saunders, B.; Wilkinson, K.; Rumbles, S.; Schofield, G.; Kamm, M.; Williams, C.; Price, A.; Talbot, I.; Forbes, A. Severity of inflammation is a risk factor for colorectal neoplasia in ulcerative colitis. Gastroenterology 2004, 126, 451–459. [Google Scholar] [CrossRef] [PubMed]
- Rutter, M.D.; Saunders, B.P.; Wilkinson, K.H.; Rumbles, S.; Schofield, G.; Kamm, M.A.; Williams, C.B.; Price, A.B.; Talbot, I.C.; Forbes, A. Cancer surveillance in longstanding ulcerative colitis: Endoscopic appearances help predict cancer risk. Gut 2004, 53, 1813–1816. [Google Scholar] [CrossRef]
- Frøslie, K.F.; Jahnsen, J.; Moum, B.A.; Vatn, M.H. Mucosal Healing in Inflammatory Bowel Disease: Results From a Norwegian Population-Based Cohort. Gastroenterology 2007, 133, 412–422. [Google Scholar] [CrossRef]
- Shah, S.C.; Colombel, J.F.; Sands, B.E.; Narula, N. Systematic review with meta-analysis: Mucosal healing is associated with improved long-term outcomes in Crohn’s disease. Aliment. Pharmacol. Ther. 2016, 43, 317–333. [Google Scholar] [CrossRef]
- Reinink, A.R.; Lee, T.C.; Higgins, P.D.R. Endoscopic Mucosal Healing Predicts Favorable Clinical Outcomes in Inflammatory Bowel Disease: A Meta-analysis. Inflamm. Bowel Dis. 2016, 22, 1859–1869. [Google Scholar] [CrossRef]
- Levartovsky, A.; Ungar, B.; Yavzori, M.; Picard, O.; Fudim, E.; Eliakim, R.; Paul, S.; Roblin, X.; Ben-Horin, S.; Kopylov, U. Infliximab levels and antibodies in IBD-related peripheral arthralgia. Int. J. Colorectal Dis. 2020, 35, 1141–1148. [Google Scholar] [CrossRef]
- Mancina, R.M.; Pagnotta, R.; Pagliuso, C.; Albi, V.; Bruno, D.; Garieri, P.; Doldo, P.; Spagnuolo, R. Gastrointestinal Symptoms of and Psychosocial Changes in Inflammatory Bowel Disease: A Nursing-Led Cross-Sectional Study of Patients in Clinical Remission. Medicina 2020, 56, 45. [Google Scholar] [CrossRef] [PubMed]
- Mak, W.Y.; Zhao, M.; Ng, S.C.; Burisch, J. The epidemiology of inflammatory bowel disease: East meets west. J. Gastroenterol. Hepatol. 2020, 35, 380–389. [Google Scholar] [CrossRef]
- Occhipinti, V.; Pastorelli, L. Challenges in the Care of IBD Patients During the CoViD-19 Pandemic: Report From a “Red Zone” Area in Northern Italy. Inflamm. Bowel Dis. 2020, 26, 793–796. [Google Scholar] [CrossRef] [PubMed]
- Gonzalez, H.A.; Myers, S.; Whitehead, E.; Pattinson, A.; Stamp, K.; Turnbull, J.; Fory, R.; Featherstone, B.; Wilkinson, A.; Lisle, J.; et al. React, reset and restore: Adaptation of a large inflammatory bowel disease service during COVID-19 pandemic. Clin. Med. 2020, 20, e183–e188. [Google Scholar] [CrossRef] [PubMed]
- Spagnuolo, R.; Larussa, T.; Iannelli, C.; Cosco, C.; Nisticò, E.; Manduci, E.; Bruno, A.; Boccuto, L.; Abenavoli, L.; Luzza, F.; et al. COVID-19 and Inflammatory Bowel Disease: Patient Knowledge and Perceptions in a Single Center Survey. Medicina 2020, 56, 407. [Google Scholar] [CrossRef]
- Krzystek-Korpacka, M.; Kempiński, R.; Bromke, M.; Neubauer, K. Biochemical Biomarkers of Mucosal Healing for Inflammatory Bowel Disease in Adults. Diagnostics 2020, 10, 367. [Google Scholar] [CrossRef]
- Voganatsi, A.; Panyutich, A.; Miyasaki, K.T.; Murthy, R.K. Mechanism of extracellular release of human neutrophil calprotectin complex. J. Leukoc. Biol. 2001, 70, 130–134. [Google Scholar] [CrossRef]
- Naess-Andresen, C.F.; Egelandsdal, B.; Fagerhol, M.K. Calcium binding and concomitant changes in the structure and heat stability of calprotectin (L1 protein). Clin. Mol. Pathol. 1995, 48, M278–M284. [Google Scholar] [CrossRef] [PubMed]
- Moher, D.; Liberati, A.; Tetzlaff, J.; Altman, D.G. Preferred Reporting Items for Systematic Reviews and Meta-Analyses: The PRISMA Statement. Ann. Intern. Med. 2009, 151, 264–269. [Google Scholar] [CrossRef]
- Karczewski, J.; Swora-Cwynar, E.; Rzymski, P.; Poniedziałek, B.; Adamski, Z. Selected biologic markers of inflammation and activity of Crohn’s disease. Autoimmunity 2015, 48, 318–327. [Google Scholar] [CrossRef]
- Lin, W.-C.; Wong, J.-M.; Tung, C.-C.; Lin, C.-P.; Chou, J.-W.; Wang, H.-Y.; Shieh, M.-J.; Chang, C.-H.; Liu, H.-H.; Wei, S.-C.; et al. Fecal calprotectin correlated with endoscopic remission for Asian inflammatory bowel disease patients. World J. Gastroenterol. 2015, 21, 13566–13573. [Google Scholar] [CrossRef] [PubMed]
- Lobatón, T.; López-García, A.; Rodríguez-Moranta, F.; Ruiz, A.; Rodríguez, L.; Guardiola, J. A new rapid test for fecal calprotectin predicts endoscopic remission and postoperative recurrence in Crohn’s disease. J. Crohn’s Colitis 2013, 7, e641–e651. [Google Scholar] [CrossRef]
- Reinisch, W.; Panaccione, R.; Bossuyt, P.; Baert, F.; Armuzzi, A.; Hébuterne, X.; Travis, S.; Danese, S.; Sandborn, W.J.; Schreiber, S.; et al. Association of Biomarker Cutoffs and Endoscopic Outcomes in Crohn’s Disease: A Post Hoc Analysis from the CALM Study. Inflamm. Bowel Dis. 2020, 26, 1562–1571. [Google Scholar] [CrossRef]
- Inokuchi, T.; Kato, J.; Hiraoka, S.; Takashima, S.; Nakarai, A.; Takei, D.; Sugihara, Y.; Takahara, M.; Kawano, S.; Harada, K.; et al. Fecal Immunochemical Test Versus Fecal Calprotectin for Prediction of Mucosal Healing in Crohn’s Disease. Inflamm. Bowel Dis. 2016, 22, 1078–1085. [Google Scholar] [CrossRef] [PubMed]
- Iwamoto, F.; Matsuoka, K.; Motobayashi, M.; Takenaka, K.; Kuno, T.; Tanaka, K.; Tsukui, Y.; Kobayashi, S.; Yoshida, T.; Fujii, T.; et al. Prediction of disease activity of Crohn’s disease through fecal calprotectin evaluated by balloon-assisted endoscopy. J. Gastroenterol. Hepatol. 2018, 33, 1984–1989. [Google Scholar] [CrossRef] [PubMed]
- Jusué, V.; Chaparro, M.; Gisbert, J.P. Accuracy of fecal calprotectin for the prediction of endoscopic activity in patients with inflammatory bowel disease. Dig. Liver Dis. 2018, 50, 353–359. [Google Scholar] [CrossRef] [PubMed]
- Lopes, S.; Andrade, P.; Afonso, J.; Cunha, R.; Rodrigues-Pinto, E.; Ramos, I.; Macedo, G.; Magro, F. Monitoring Crohn’s disease activity: Endoscopy, fecalmarkers and computed tomography enterography. Therap. Adv. Gastroenterol. 2018, 11, e175628481876907. [Google Scholar] [CrossRef]
- AfBjörkesten, C.G.; Nieminen, U.; Turunen, U.; Arkkila, P.; Sipponen, T.; Frkkil, M. Surrogate markers and clinical indices, alone or combined, as indicators for endoscopic remission in anti-TNF-treated luminal Crohn’s disease. Scand. J. Gastroenterol. 2012, 47, 528–537. [Google Scholar] [CrossRef]
- E Penna, F.G.C.; Rosa, R.M.; da Cunha, P.F.S.; de Souza, S.C.S.; de Abreu Ferrari, M.D.L. Faecal calprotectin is the biomarker that best distinguishes remission from different degrees of endoscopic activity in Crohn’s disease. BMC Gastroenterol. 2020, 20, 35. [Google Scholar] [CrossRef]
- Cannatelli, R.; Bazarova, A.; Zardo, D.; Nardone, O.M.; Shivaji, U.; Smith, S.C.L.; Gkoutos, G.; Ricci, C.; Gui, X.S.; Ghosh, S.; et al. Fecal Calprotectin Thresholds to Predict Endoscopic Remission Using Advanced Optical Enhancement Techniques and Histological Remission in IBD Patients. Inflamm. Bowel Dis. 2020, 27, 647–654. [Google Scholar] [CrossRef] [PubMed]
- Falvey, J.D.; Hoskin, T.; Meijer, B.; Ashcroft, A.; Walmsley, R.; Day, A.S.; Gearry, R.B. Disease activity assessment in IBD: Clinical indices and biomarkers fail to predict endoscopic remission. Inflamm. Bowel Dis. 2015, 21, 824–831. [Google Scholar] [CrossRef]
- Nancey, S.; Boschetti, G.; Moussata, D.; Cotte, E.; Peyras, J.; Cuerq, C.; Haybrard, J.; Charlois, A.-L.; Mialon, A.; Chauvenet, M.; et al. Neopterin Is a Novel Reliable Fecal Marker as Accurate as Calprotectin for Predicting Endoscopic Disease Activity in Patients with Inflammatory Bowel Diseases. Inflamm. Bowel Dis. 2013, 19, 1043–1052. [Google Scholar] [CrossRef]
- Vázquez-Morón, J.M.; Pallarés-Manrique, H.; Machancoses, F.H.; Ramos-Lora, M.; Ruiz-Frutos, C. Accurate cut-offs for predicting endoscopic activity and mucosal healing in Crohn’s disease with fecal calprotectin. Rev. Española Enfermedades Dig. 2017, 109, 130–136. [Google Scholar] [CrossRef][Green Version]
- Chen, J.M.; Liu, T.; Gao, S.; Tong, X.D.; Deng, F.H.; Nie, B. Efficacy of noninvasive evaluations in monitoring inflammatory bowel disease activity: A prospective study in China. World J. Gastroenterol. 2017, 23, 8235–8247. [Google Scholar] [CrossRef] [PubMed]
- Schaffer, T.; Schoepfer, A.M.; Seibold, F. Serum ficolin-2 correlates worse than fecal calprotectin and CRP with endoscopic Crohn’s disease activity. J. Crohn’s Colitis 2014, 8, 1125–1132. [Google Scholar] [CrossRef] [PubMed]
- Schoepfer, A.M.; Beglinger, C.; Straumann, A.; Safroneeva, E.; Romero, Y.; Armstrong, D.; Schmidt, C.; Trummler, M.; Pittet, V.; Vavricka, S.R. Fecal Calprotectin More Accurately Reflects Endoscopic Activity of Ulcerative Colitis than the Lichtiger Index, C-reactive Protein, Platelets, Hemoglobin, and Blood Leukocytes. Inflamm. Bowel Dis. 2013, 19, 332–341. [Google Scholar] [CrossRef] [PubMed]
- Carlsen, K.; Riis, L.B.; Elsberg, H.; Maagaard, L.; Thorkilgaard, T.; Sørbye, S.W.; Jakobsen, C.; Wewer, V.; Florholmen, J.; Goll, R.; et al. The sensitivity of fecal calprotectin in predicting deep remission in ulcerative colitis. Scand. J. Gastroenterol. 2018, 53, 825–830. [Google Scholar] [CrossRef]
- Hiraoka, S.; Takashima, S.; Inokuchi, T.; Nakarai, A.; Takahara, M.; Harada, K.; Seki, Y.; Watanabe, K.; Kato, J.; Okada, H. The novel latex agglutination turbidimetric immunoassay system for simultaneous measurements of calprotectin and hemoglobin in feces. Intest. Res. 2019, 17, 202–209. [Google Scholar] [CrossRef]
- Karling, P.; Lundgren, D.; Eklöf, V.; Palmqvist, R.; Hultdin, J. Improved monitoring of inflammatory activity in patients with ulcerative colitis by combination of faecal tests for haemoglobin and calprotectin. Scand. J. Clin. Lab. Investig. 2019, 79, 341–346. [Google Scholar] [CrossRef]
- Kim, E.S.; Lee, H.S.; Kim, S.K.; Kim, E.Y.; Jang, B.I.; Kim, K.O.; Yang, C.H.; Lee, Y.J. Fecal calprotectin is more accurate than fecal immunochemical test for predicting mucosal healing in quiescent ulcerative colitis: A prospective multicenter study. Scand. J. Gastroenterol. 2020, 55, 163–168. [Google Scholar] [CrossRef]
- Kostas, A.; Siakavellas, S.I.; Kosmidis, C.; Takou, A.; Nikou, J.; Maropoulos, G.; Vlachogiannakos, J.; Papatheodoridis, G.V.; Papaconstantinou, I.; Bamias, G. Fecal calprotectin measurement is a marker of short-term clinical outcome and presence of mucosal healing in patients with inflammatory bowel disease. World J. Gastroenterol. 2017, 23, 7387–7396. [Google Scholar] [CrossRef]
- Kristensen, V.; Klepp, P.; Cvancarova, M.; Roseth, A.; Skar, V.; Moum, B. Prediction of Endoscopic Disease Activity in Ulcerative Colitis by Two Different Assays for Fecal Calprotectin. J. Crohn’s Colitis 2015, 9, 164–169. [Google Scholar] [CrossRef]
- Lee, S.-H.; Kim, M.-J.; Chang, K.; Song, E.M.; Hwang, S.W.; Park, S.H.; Yang, D.-H.; Kim, K.-J.; Byeon, J.-S.; Myung, S.-J.; et al. Fecal calprotectin predicts complete mucosal healing and better correlates with the ulcerative colitis endoscopic index of severity than with the Mayo endoscopic subscore in patients with ulcerative colitis. BMC Gastroenterol. 2017, 17, 110. [Google Scholar] [CrossRef] [PubMed]
- Lee, Y.W.; Lee, K.-M.; Lee, J.M.; Chung, Y.Y.; Kim, D.B.; Kim, Y.J.; Chung, W.C.; Paik, C.-N. The usefulness of fecal calprotectin in assessing inflammatory bowel disease activity. Korean J. Intern. Med. 2019, 34, 72–80. [Google Scholar] [CrossRef] [PubMed]
- Lobatón, T.; Rodríguez-Moranta, F.; Lopez, A.; Sánchez, E.; Rodríguez-Alonso, L.; Guardiola, J. A New Rapid Quantitative Test for Fecal Calprotectin Predicts Endoscopic Activity in Ulcerative Colitis. Inflamm. Bowel Dis. 2013, 19, 1034–1042. [Google Scholar] [CrossRef]
- Mine, S.; Takeshima, F.; Akazawa, Y.; Matsushima, K.; Minami, H.; Yamaguchi, N.; Ohnita, K.; Isomoto, H.; Nakao, K. Correlation of Fecal Markers with Magnifying Endoscopic Stratification in Patients with Ulcerative Colitis Who Are in Clinical Remission. Digestion 2018, 97, 82–89. [Google Scholar] [CrossRef]
- Nakov, R.; Velikova, T.; Nakov, V.; Ianiro, G.; Gerova, V.; Tankova, L. Serum trefoil factor 3 predicts disease activity in patients with ulcerative colitis. Eur. Rev. Med. Pharmacol. Sci. 2019, 23, 788–794. [Google Scholar] [CrossRef] [PubMed]
- Ryu, D.G.; Kim, H.W.; Park, S.B.; Kang, D.H.; Choi, C.W.; Kim, S.J.; Nam, H.S. Clinical implications of fecal calprotectin and fecal immunochemical test on mucosal status in patients with ulcerative colitis. Medicine 2019, 98, e17080. [Google Scholar] [CrossRef] [PubMed]
- Scaioli, E.; Scagliarini, M.; Cardamone, C.; Liverani, E.; Ugolini, G.; Festi, D.; Bazzoli, F.; Belluzzi, A. Clinical application of faecal calprotectin in ulcerative colitis patients. Eur. J. Gastroenterol. Hepatol. 2015, 27, 1418–1424. [Google Scholar] [CrossRef] [PubMed]
- Stevens, T.W.; Gecse, K.; Turner, J.R.; de Hertogh, G.; Rubin, D.T.; D’Haens, G.R. Diagnostic Accuracy of Fecal Calprotectin Concentration in Evaluating Therapeutic Outcomes of Patients with Ulcerative Colitis. Clin. Gastroenterol. Hepatol. 2020, in press. [Google Scholar] [CrossRef] [PubMed]
- Theede, K.; Holck, S.; Ibsen, P.; Ladelund, S.; Nordgaard-Lassen, I.; Nielsen, A.M. Level of Fecal Calprotectin Correlates with Endoscopic and Histologic Inflammation and Identifies Patients With Mucosal Healing in Ulcerative Colitis. Clin. Gastroenterol. Hepatol. 2015, 13, 1929–1936.e1. [Google Scholar] [CrossRef]
- Voiosu, T.; Benguş, A.; Dinu, R.; Voiosu, A.M.; Bǎlǎnescu, P.; Bǎicuş, C.; Diculescu, M.; Voiosu, R.; Mateescu, B. Rapid fecal calprotectin level assessment and the SIBDQ score can accurately detect active mucosal inflammation in IBD patients in clinical remission: A prospective study. J. Gastrointest. Liver Dis. 2014, 23, 273–278. [Google Scholar] [CrossRef] [PubMed]
- Yamaguchi, S.; Takeuchi, Y.; Arai, K.; Fukuda, K.; Kuroki, Y.; Asonuma, K.; Takahashi, H.; Saruta, M.; Yoshida, H. Fecal calprotectin is a clinically relevant biomarker of mucosal healing in patients with quiescent ulcerative colitis. J. Gastroenterol. Hepatol. 2016, 31, 93–98. [Google Scholar] [CrossRef] [PubMed]
- Yen, H.-H.; Chen, M.-W.; Chang, Y.-Y.; Huang, H.-Y.; Hsu, T.-C.; Chen, Y.-Y. Predictive values of stool-based tests for mucosal healing among Taiwanese patients with ulcerative colitis: A retrospective cohort analysis. PeerJ 2020, 8, e9537. [Google Scholar] [CrossRef]
- Zittan, E.; Kelly, O.B.; Kirsch, R.; Milgrom, R.; Burns, J.; Nguyen, G.C.; Croitoru, K.; Van Assche, G.; Silverberg, M.S.; Steinhart, A.H. Low Fecal Calprotectin Correlates with Histological Remission and Mucosal Healing in Ulcerative Colitis and Colonic Crohn’s Disease. Inflamm. Bowel Dis. 2016, 22, 623–630. [Google Scholar] [CrossRef]
- Bertani, L.; Blandizzi, C.; Mumolo, M.G.; Ceccarelli, L.; Albano, E.; Tapete, G.; BaianoSvizzero, G.; Zanzi, F.; Coppini, F.; de Bortoli, N.; et al. Fecal Calprotectin Predicts Mucosal Healing in Patients With Ulcerative Colitis Treated With Biological Therapies: A Prospective Study. Clin. Transl. Gastroenterol. 2020, 11, e00174. [Google Scholar] [CrossRef]
- Hart, L.; Chavannes, M.; Kherad, O.; Maedler, C.; Mourad, N.; Marcus, V.; Afif, W.; Bitton, A.; Lakatos, P.L.; Brassard, P.; et al. Faecal Calprotectin Predicts Endoscopic and Histological Activity in Clinically Quiescent Ulcerative Colitis. J. Crohn’s Colitis 2020, 14, 46–52. [Google Scholar] [CrossRef] [PubMed]
- Jha, A.K.; Chaudhary, M.; Dayal, V.M.; Kumar, A.; Jha, S.K.; Jha, P.; Purkayastha, S.; Ranjan, R. Optimal cut-off value of fecal calprotectin for the evaluation of ulcerative colitis: An unsolved issue? JGH Open 2018, 2, 207–213. [Google Scholar] [CrossRef] [PubMed]
- Mak, W.Y.; Buisson, A.; Andersen, M.J.; Lei, D.; Pekow, J.; Cohen, R.D.; Kahn, S.A.; Pereira, B.; Rubin, D.T. Fecal Calprotectin in Assessing Endoscopic and Histological Remission in Patients with Ulcerative Colitis. Dig. Dis. Sci. 2018, 63, 1294–1301. [Google Scholar] [CrossRef] [PubMed]
- Patel, A.; Panchal, H.; Dubinsky, M.C. Fecal Calprotectin Levels Predict Histological Healing in Ulcerative Colitis. Inflamm. Bowel Dis. 2017, 23, 1600–1604. [Google Scholar] [CrossRef]
- Takashima, S.; Kato, J.; Hiraoka, S.; Nakarai, A.; Takei, D.; Inokuchi, T.; Sugihara, Y.; Takahara, M.; Harada, K.; Okada, H.; et al. Evaluation of Mucosal Healing in Ulcerative Colitis by Fecal Calprotectin Vs. Fecal Immunochemical Test. Am. J. Gastroenterol. 2015, 110, 873–880. [Google Scholar] [CrossRef]
- Langhorst, J.; Boone, J.; Lauche, R.; Rueffer, A.; Dobos, G. Faecal Lactoferrin, Calprotectin, PMN-elastase, CRP, and White Blood Cell Count as Indicators for Mucosal Healing and Clinical Course of Disease in Patients with Mild to Moderate Ulcerative Colitis: Post Hoc Analysis of a Prospective Clinical Trial. J. Crohn’s Colitis 2016, 10, 786–794. [Google Scholar] [CrossRef] [PubMed]
- Onal, I.K.; Beyazit, Y.; Sener, B.; Savuk, B.; Ozer Etik, D.; Sayilir, A.; Oztas, E.; Torun, S.; OzderinOzin, Y.; TuncDemirel, B.; et al. The value of fecal calprotectin as a marker of intestinal inflammation in patients with ulcerative colitis. Turkish J. Gastroenterol. 2012, 23, 509–514. [Google Scholar] [CrossRef] [PubMed]
- Walsh, A.; Kormilitzin, A.; Hinds, C.; Sexton, V.; Brain, O.; Keshav, S.; Uhlig, H.; Geddes, J.; Goodwin, G.; Peters, M.; et al. Defining Faecal Calprotectin Thresholds as a Surrogate for Endoscopic and Histological Disease Activity in Ulcerative Colitis—A Prospective Analysis. J. Crohn’s Colitis 2019, 13, 424–430. [Google Scholar] [CrossRef] [PubMed]
- Reitsma, J.B.; Glas, A.S.; Rutjes, A.W.S.; Scholten, R.J.P.M.; Bossuyt, P.M.; Zwinderman, A.H. Bivariate analysis of sensitivity and specificity produces informative summary measures in diagnostic reviews. J. Clin. Epidemiol. 2005, 58, 982–990. [Google Scholar] [CrossRef]
- Travis, S.P.L.; Schnell, D.; Krzeski, P.; Abreu, M.T.; Altman, D.G.; Colombel, J.; Feagan, B.G.; Hanauer, S.B.; Lichtenstein, G.R.; Marteau, P.R.; et al. Reliability and Initial Validation of the Ulcerative Colitis Endoscopic Index of Severity. Gastroenterology 2013, 145, 987–995. [Google Scholar] [CrossRef]
- Moniuszko, A.; Głuszek, S.; Rydzewska, G. Does the rapid fecal calprotectin test equally predict mucosal inflammation in both ulcerative colitis (UC) and Crohn’s disease (CD)? A prospective analysis of an IBD cohort. Pol. Arch. Intern. Med. 2017, 127, 312–318. [Google Scholar] [CrossRef]
- Meucci, G.; D’Incà, R.; Maieron, R.; Orzes, N.; Vecchi, M.; Visentini, D.; Minoli, G.; Dal Pont, E.; Zilli, M.; Benedetti, E.; et al. Diagnostic value of faecal calprotectin in unselected outpatients referred for colonoscopy: A multicenter prospective study. Dig. Liver Dis. 2010, 42, 191–195. [Google Scholar] [CrossRef]
- Lundgren, D.; Eklöf, V.; Palmqvist, R.; Hultdin, J.; Karling, P. Proton pump inhibitor use is associated with elevated faecal calprotectin levels. A cross-sectional study on subjects referred for colonoscopy. Scand. J. Gastroenterol. 2019, 54, 152–157. [Google Scholar] [CrossRef] [PubMed]
- Julsgaard, M.; Hvas, C.L.; Gearry, R.B.; Vestergaard, T.; Fallingborg, J.; Svenningsen, L.; Kjeldsen, J.; Sparrow, M.P.; Wildt, S.; Kelsen, J.; et al. Fecal Calprotectin Is Not Affected by Pregnancy. Inflamm. Bowel Dis. 2017, 23, 1240–1246. [Google Scholar] [CrossRef] [PubMed]


| Author, Year of Publication | Ref. | Sens. (95%-CI) | Spec. (95%-CI) | Mucosal Healing Definition |
|---|---|---|---|---|
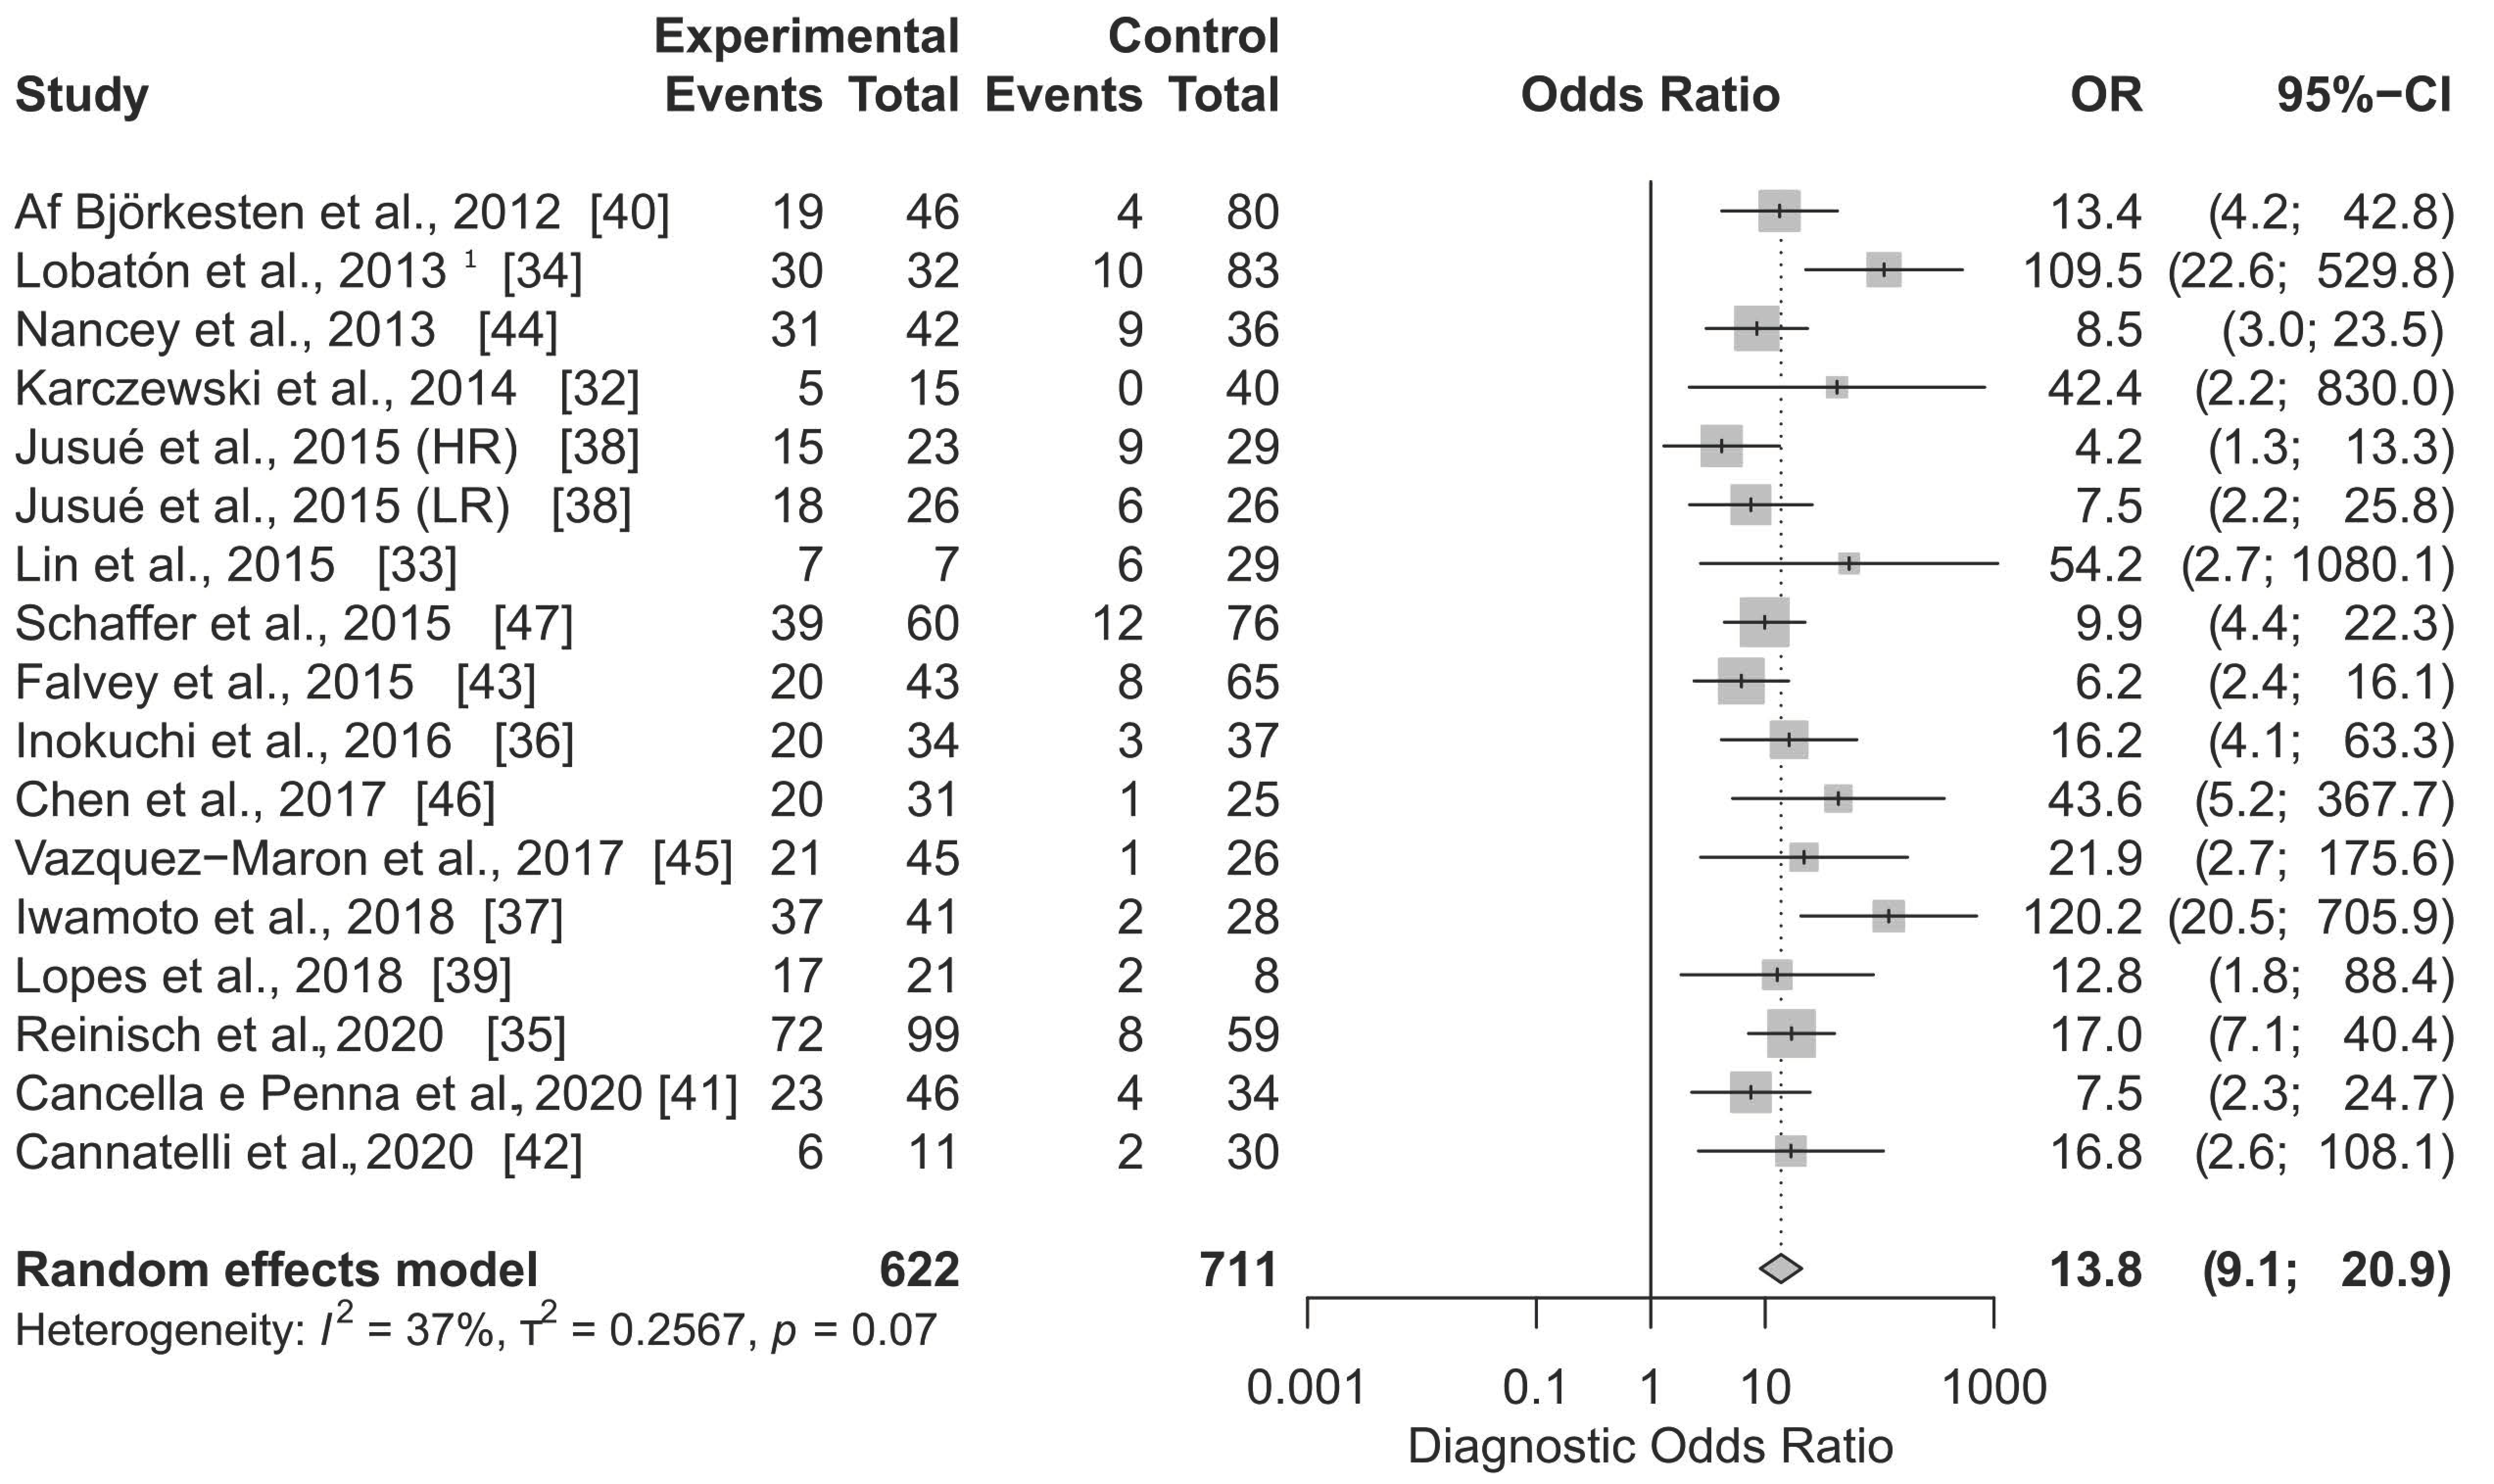
| Karczewski et al., 2014 | [32] | 1.000 (0.478; 1.000) | 0.800 (0.663; 0.900) | CDEIS < 3 |
| Lin et al., 2015 | [33] | 0.538 (0.251; 0.808) | 1.000 (0.852; 1.000) | CDEIS < 6 |
| Lobatón et al., 2013 1 | [34] | 0.750 (0.588; 0.873) | 0.973 (0.907; 0.997) | CDEIS ≤ 3 |
| Reinischet al., 2020 | [35] | 0.900 (0.812; 0.956) | 0.654 (0.538; 0.758) | CDEIS ≤ 3 |
| Inokuchi et al., 2016 | [36] | 0.870 (0.664; 0.972) | 0.708 (0.559; 0.830) | SES-CD = 0 |
| Iwamoto et al., 2018 | [37] | 0.949 (0.827; 0.994) | 0.867 (0.693; 0.962) | SES-CD = 0 |
| Jusué et al., 2015 (HR) | [38] | 0.625 (0.406; 0.812) | 0.714 (0.513; 0.868) | SES-CD = 0 |
| Jusué et al., 2015 (LR) | [38] | 0.750 (0.533; 0.902) | 0.714 (0.513; 0.868) | SES-CD = 0 |
| Lopes et al., 2018 | [39] | 0.895 (0.669; 0.987) | 0.600 (0.262; 0.878) | SES-CD = 0 |
| Af Björkesten et al., 2012 | [40] | 0.826 (0.612; 0.950) | 0.738 (0.642; 0.820) | SES-CD ≤ 2 |
| Cancella e Penna et al., 2020 | [41] | 0.852 (0.663; 0.958) | 0.566 (0.423; 0.702) | SES-CD ≤ 2 |
| Cannatelli et al., 2020 | [42] | 0.750 (0.349; 0.968) | 0.848 (0.681; 0.949) | SES-CD ≤ 2 |
| Falvey et al., 2015 | [43] | 0.714 (0.513; 0.868) | 0.713 (0.600; 0.808) | SES-CD ≤ 2 |
| Nancey et al., 2013 | [44] | 0.775 (0.615; 0.892) | 0.711 (0.541; 0.846) | SES-CD ≤ 2 |
| Vazquez-Morón et al., 2017 | [45] | 0.955 (0.772; 0.999) | 0.510 (0.363; 0.656) | SES-CD ≤ 2 |
| Chen et al., 2017 | [46] | 0.952 (0.762; 0.999) | 0.686 (0.507; 0.831) | SES-CD ≤ 3 |
| Schaffer et al., 2015 | [47] | 0.765 (0.625; 0.872) | 0.753 (0.647; 0.840) | SES-CD ≤ 3 |
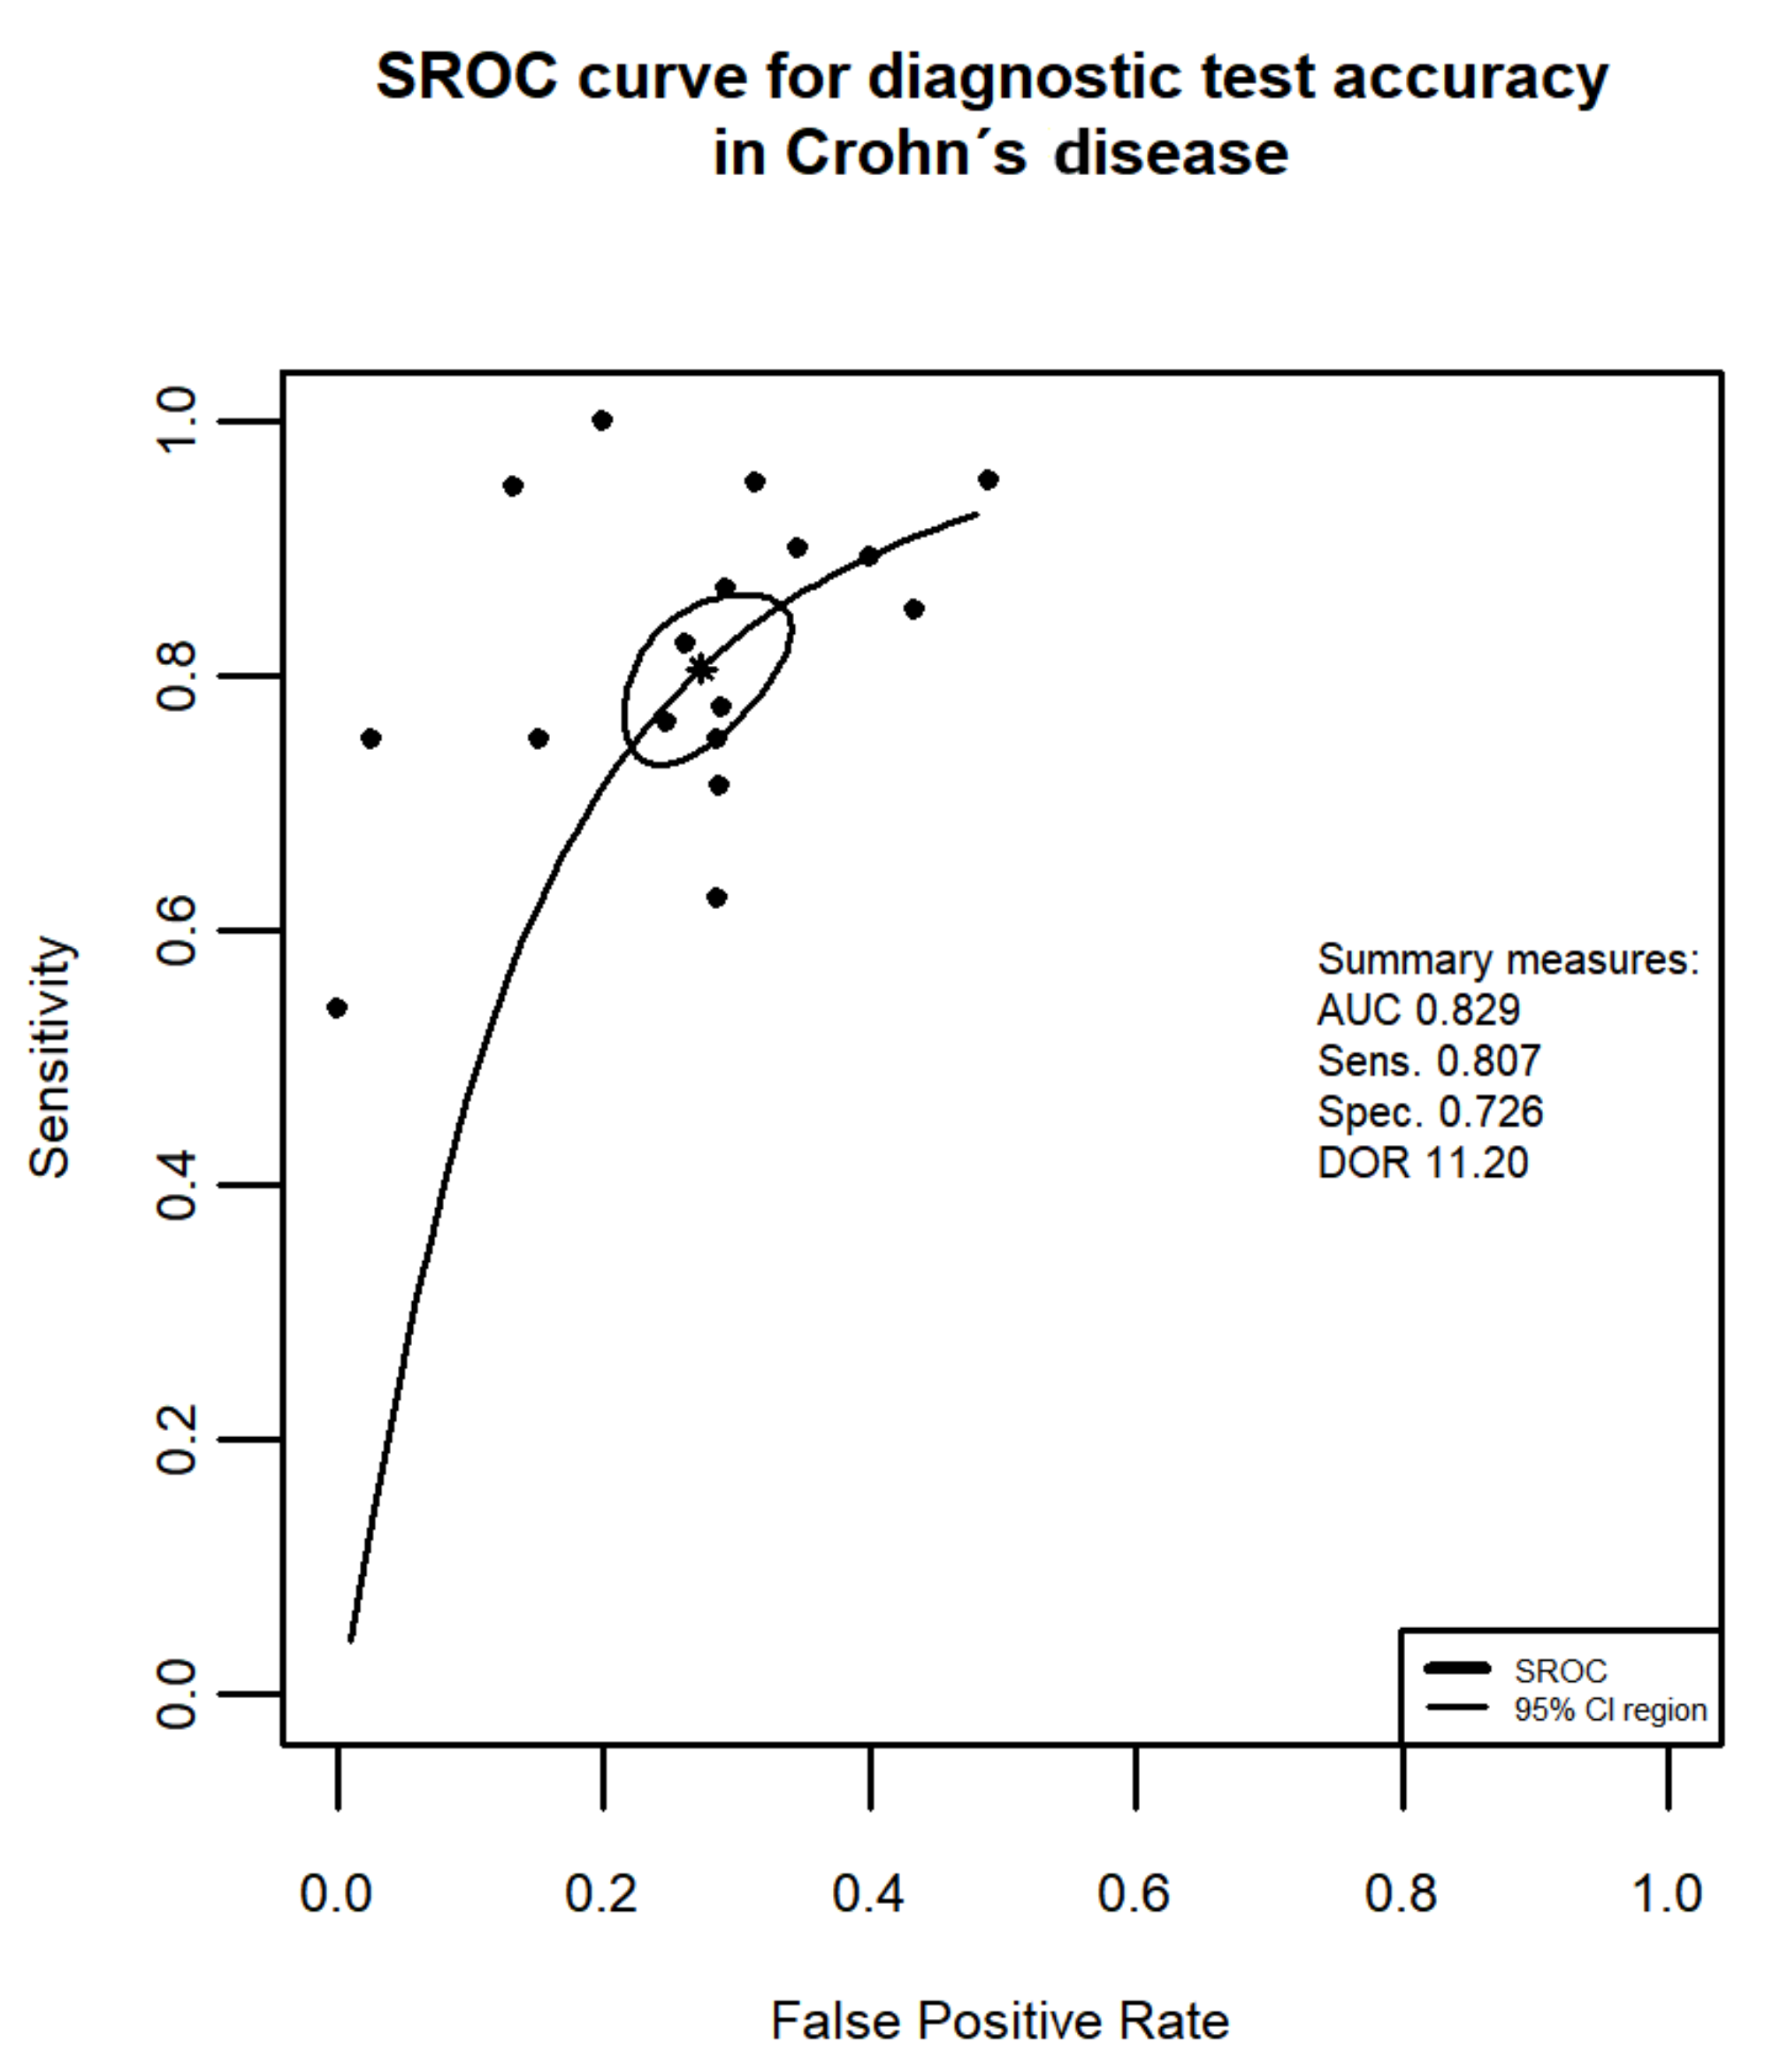
| Random effects model: | 0.828 (0.769; 0.874) | 0.759 (0.683; 0.821) | ||
| Quantifying heterogeneity: | ||||
| tau2 = 0.2803 | tau2 = 0.4648 | |||
| I2 = 51.7% | I2 = 80.2% | |||
| Q = 36.18 (0.0027) | Q = 75.41 (<0.0001) |
| Author, Year of Publication | Ref. | Sens. (95%-CI) | Spec. (95%-CI) | Mucosal Healing Definition |
|---|---|---|---|---|
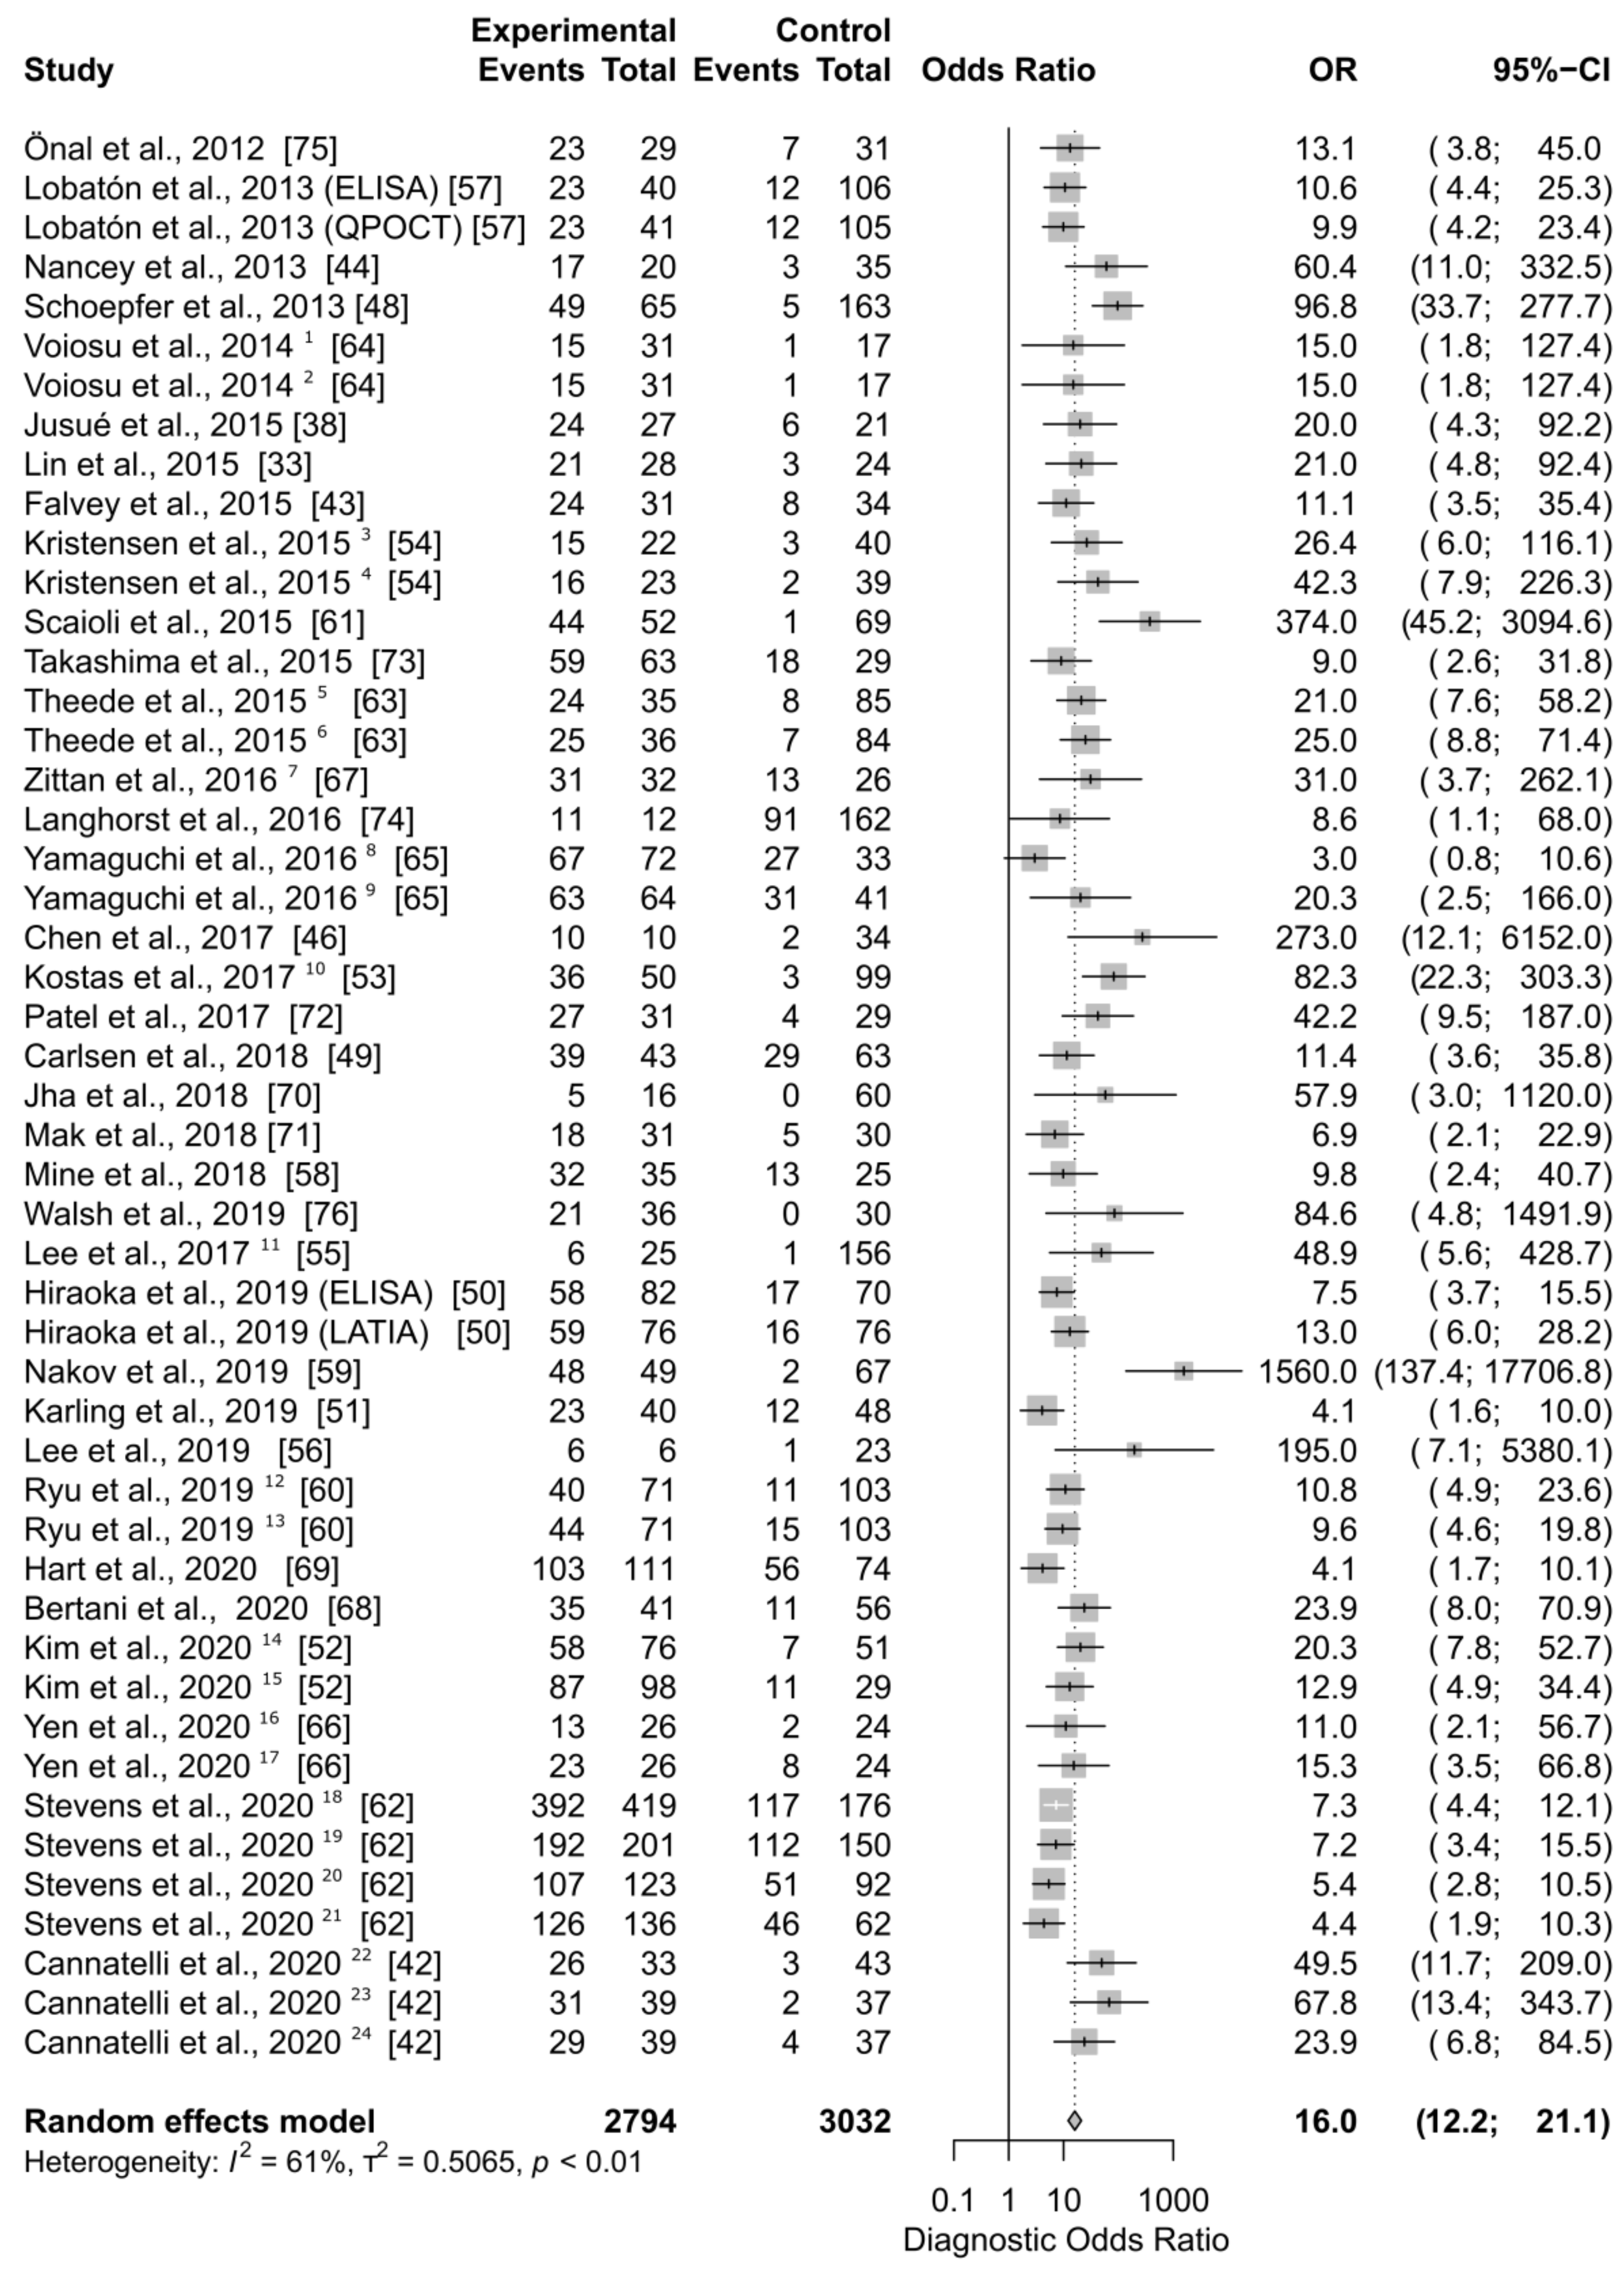
| Falvey et al., 2015 | [43] | 0.750 (0.566; 0.885) | 0.788 (0.611; 0.910) | mBS = 0 |
| Schoepfer et al., 2013 | [48] | 0.907 (0.797; 0.969) | 0.908 (0.855; 0.947) | mBS ≤ 1 |
| Cannatelli et al., 2020 | [42] | 0.897 (0.726; 0.978) | 0.851 (0.717; 0.938) | MES = 0 |
| Carlsen et al., 2018 | [49] | 0.574 (0.448; 0.693) | 0.895 (0.752; 0.971) | MES = 0 |
| Hiraoka et al., 2019 (ELISA) | [50] | 0.773 (0.662; 0.862) | 0.688 (0.573; 0.789) | MES = 0 |
| Hiraoka et al., 2019 (LATIA) | [50] | 0.787 (0.677; 0.873) | 0.779 (0.670; 0.866) | MES = 0 |
| Jusué et al., 2015 | [38] | 0.800 (0.614; 0.923) | 0.833 (0.586; 0.964) | MES = 0 |
| Karling et al., 2019 | [51] | 0.657 (0.478; 0.809) | 0.679 (0.537; 0.801) | MES = 0 |
| Kim et al., 2020 | [52] | 0.892 (0.791; 0.956) | 0.710 (0.581; 0.818) | MES = 0 |
| Kostas et al., 2017 | [53] | 0.923 (0.791; 0.984) | 0.873 (0.796; 0.929) | MES = 0 |
| Kristensen et al., 2015 | [54] | 0.833 (0.586; 0.964) | 0.841 (0.699; 0.934) | MES = 0 |
| Lee et al., 2017 | [55] | 0.857 (0.421; 0.996) | 1.000 (0.846; 1.000) | MES = 0 |
| Lee et al., 2019 | [56] | 0.857 (0.421; 0.996) | 0.891 (0.835; 0.933) | MES = 0 |
| Lobatón et al., 2013 (ELISA) | [57] | 0.657 (0.478; 0.809) | 0.847 (0.766; 0.908) | MES = 0 |
| Lobatón et al., 2013 (QPOCT) | [57] | 0.657 (0.478; 0.809) | 0.838 (0.756; 0.901) | MES = 0 |
| Mine et al., 2018 | [58] | 0.711 (0.557; 0.836) | 0.800 (0.519; 0.957) | MES = 0 |
| Nakov et al., 2019 | [59] | 0.960 (0.863; 0.995) | 0.985 (0.918; 1.000) | MES = 0 |
| Ryu et al., 2019 | [60] | 0.784 (0.647; 0.887) | 0.748 (0.662; 0.822) | MES = 0 |
| Scaioli et al., 2015 | [61] | 0.978 (0.882; 0.999) | 0.895 (0.803; 0.953) | MES = 0 |
| Stevens et al., 2020 (wk 8) | [62] | 0.677 (0.598; 0.749) | 0.719 (0.585; 0.830) | MES = 0 |
| Stevens et al., 2020 (wk 52) | [62] | 0.733 (0.660; 0.797) | 0.615 (0.406; 0.798) | MES = 0 |
| Theede et al., 2015 | [63] | 0.750 (0.566; 0.885) | 0.875 (0.787; 0.936) | MES = 0 |
| Voiosu et al., 2014 | [64] | 0.938 (0.698; 0.998) | 0.500 (0.319; 0.681) | MES = 0 |
| Yamaguchi et al., 2016 | [65] | 0.713 (0.610; 0.801) | 0.545 (0.234; 0.833) | MES = 0 |
| Yen et al., 2020 | [66] | 0.867 (0.595; 0.983) | 0.629 (0.449; 0.785) | MES = 0 |
| Zittan et al., 2016 | [67] | 0.705 (0.548; 0.832) | 0.929 (0.661; 0.998) | MES = 0 |
| Bertani et al., 2020 | [68] | 0.761 (0.612; 0.874) | 0.882 (0.761; 0.956) | MES ≤ 1 |
| Hart et al., 2020 | [69] | 0.648 (0.568; 0.722) | 0.692 (0.482; 0.857) | MES ≤ 1 |
| Jha et al., 2018 | [70] | 1.000 (0.478; 1.000) | 0.845 (0.740; 0.920) | MES ≤ 1 |
| Kim et al., 2020 | [52] | 0.888 (0.808; 0.943) | 0.621 (0.423; 0.793) | MES ≤ 1 |
| Kristensen et al., 2015 | [54] | 0.889 (0.653; 0.986) | 0.841 (0.699; 0.934) | MES ≤ 1 |
| Mak et al., 2018 | [71] | 0.783 (0.563; 0.925) | 0.658 (0.486; 0.804) | MES ≤ 1 |
| Patel et al., 2017 | [72] | 0.871 (0.702; 0.964) | 0.862 (0.683; 0.961) | MES ≤ 1 |
| Stevens et al., 2020 (wk 8) | [62] | 0.770 (0.731; 0.806) | 0.686 (0.577; 0.782) | MES ≤ 1 |
| Stevens et al., 2020 (wk 52) | [62] | 0.632 (0.575; 0.686) | 0.809 (0.667; 0.909) | MES ≤ 1 |
| Takashima et al., 2015 | [73] | 0.766 (0.656; 0.855) | 0.733 (0.449; 0.922) | MES ≤ 1 |
| Yamaguchi et al., 2016 | [65] | 0.670 (0.566; 0.764) | 0.909 (0.587; 0.998) | MES ≤ 1 |
| Yen et al., 2020 | [66] | 0.742 (0.554; 0.881) | 0.842 (0.604; 0.966) | MES ≤ 1 |
| Chen et al., 2017 | [46] | 0.833 (0.516; 0.979) | 1.000 (0.891; 1.000) | MES ≤ 2 |
| Cannatelli et al., 2020 | [42] | 0.879 (0.718; 0.966) | 0.767 (0.614; 0.882) | modPICaSSO ≤ 3 |
| Langhorst et al., 2016 | [74] | 0.108 (0.055; 0.185) | 0.986 (0.925; 1.000) | RI ≤ 1 |
| Nancey et al., 2013 | [44] | 0.850 (0.621; 0.968) | 0.914 (0.769; 0.982) | RI ≤ 2 |
| Önal et al., 2012 | [75] | 0.767 (0.577; 0.901) | 0.800 (0.614; 0.923) | RI ≤ 4 |
| Voiosu et al., 2014 | [64] | 0.938 (0.698; 0.998) | 0.500 (0.319; 0.681) | SES-UC ≤ 3 |
| Theede et al., 2015 | [63] | 0.781 (0.600; 0.907) | 0.875 (0.787; 0.936) | UCEIS = 0 |
| Cannatelli et al., 2020 | [42] | 0.939 (0.798; 0.993) | 0.814 (0.666; 0.916) | UCEIS ≤ 1 |
| Ryu et al., 2019 | [60] | 0.746 (0.616; 0.850) | 0.765 (0.677; 0.839) | UCEIS ≤ 1 |
| Walsh et al., 2019 | [76] | 1.000 (0.839; 1.000) | 0.667 (0.510; 0.800) | UCEIS ≤ 1 |
| Lin et al., 2015 | [33] | 0.875 (0.676; 0.973) | 0.750 (0.551; 0.893) | UCEIS ≤ 3 |
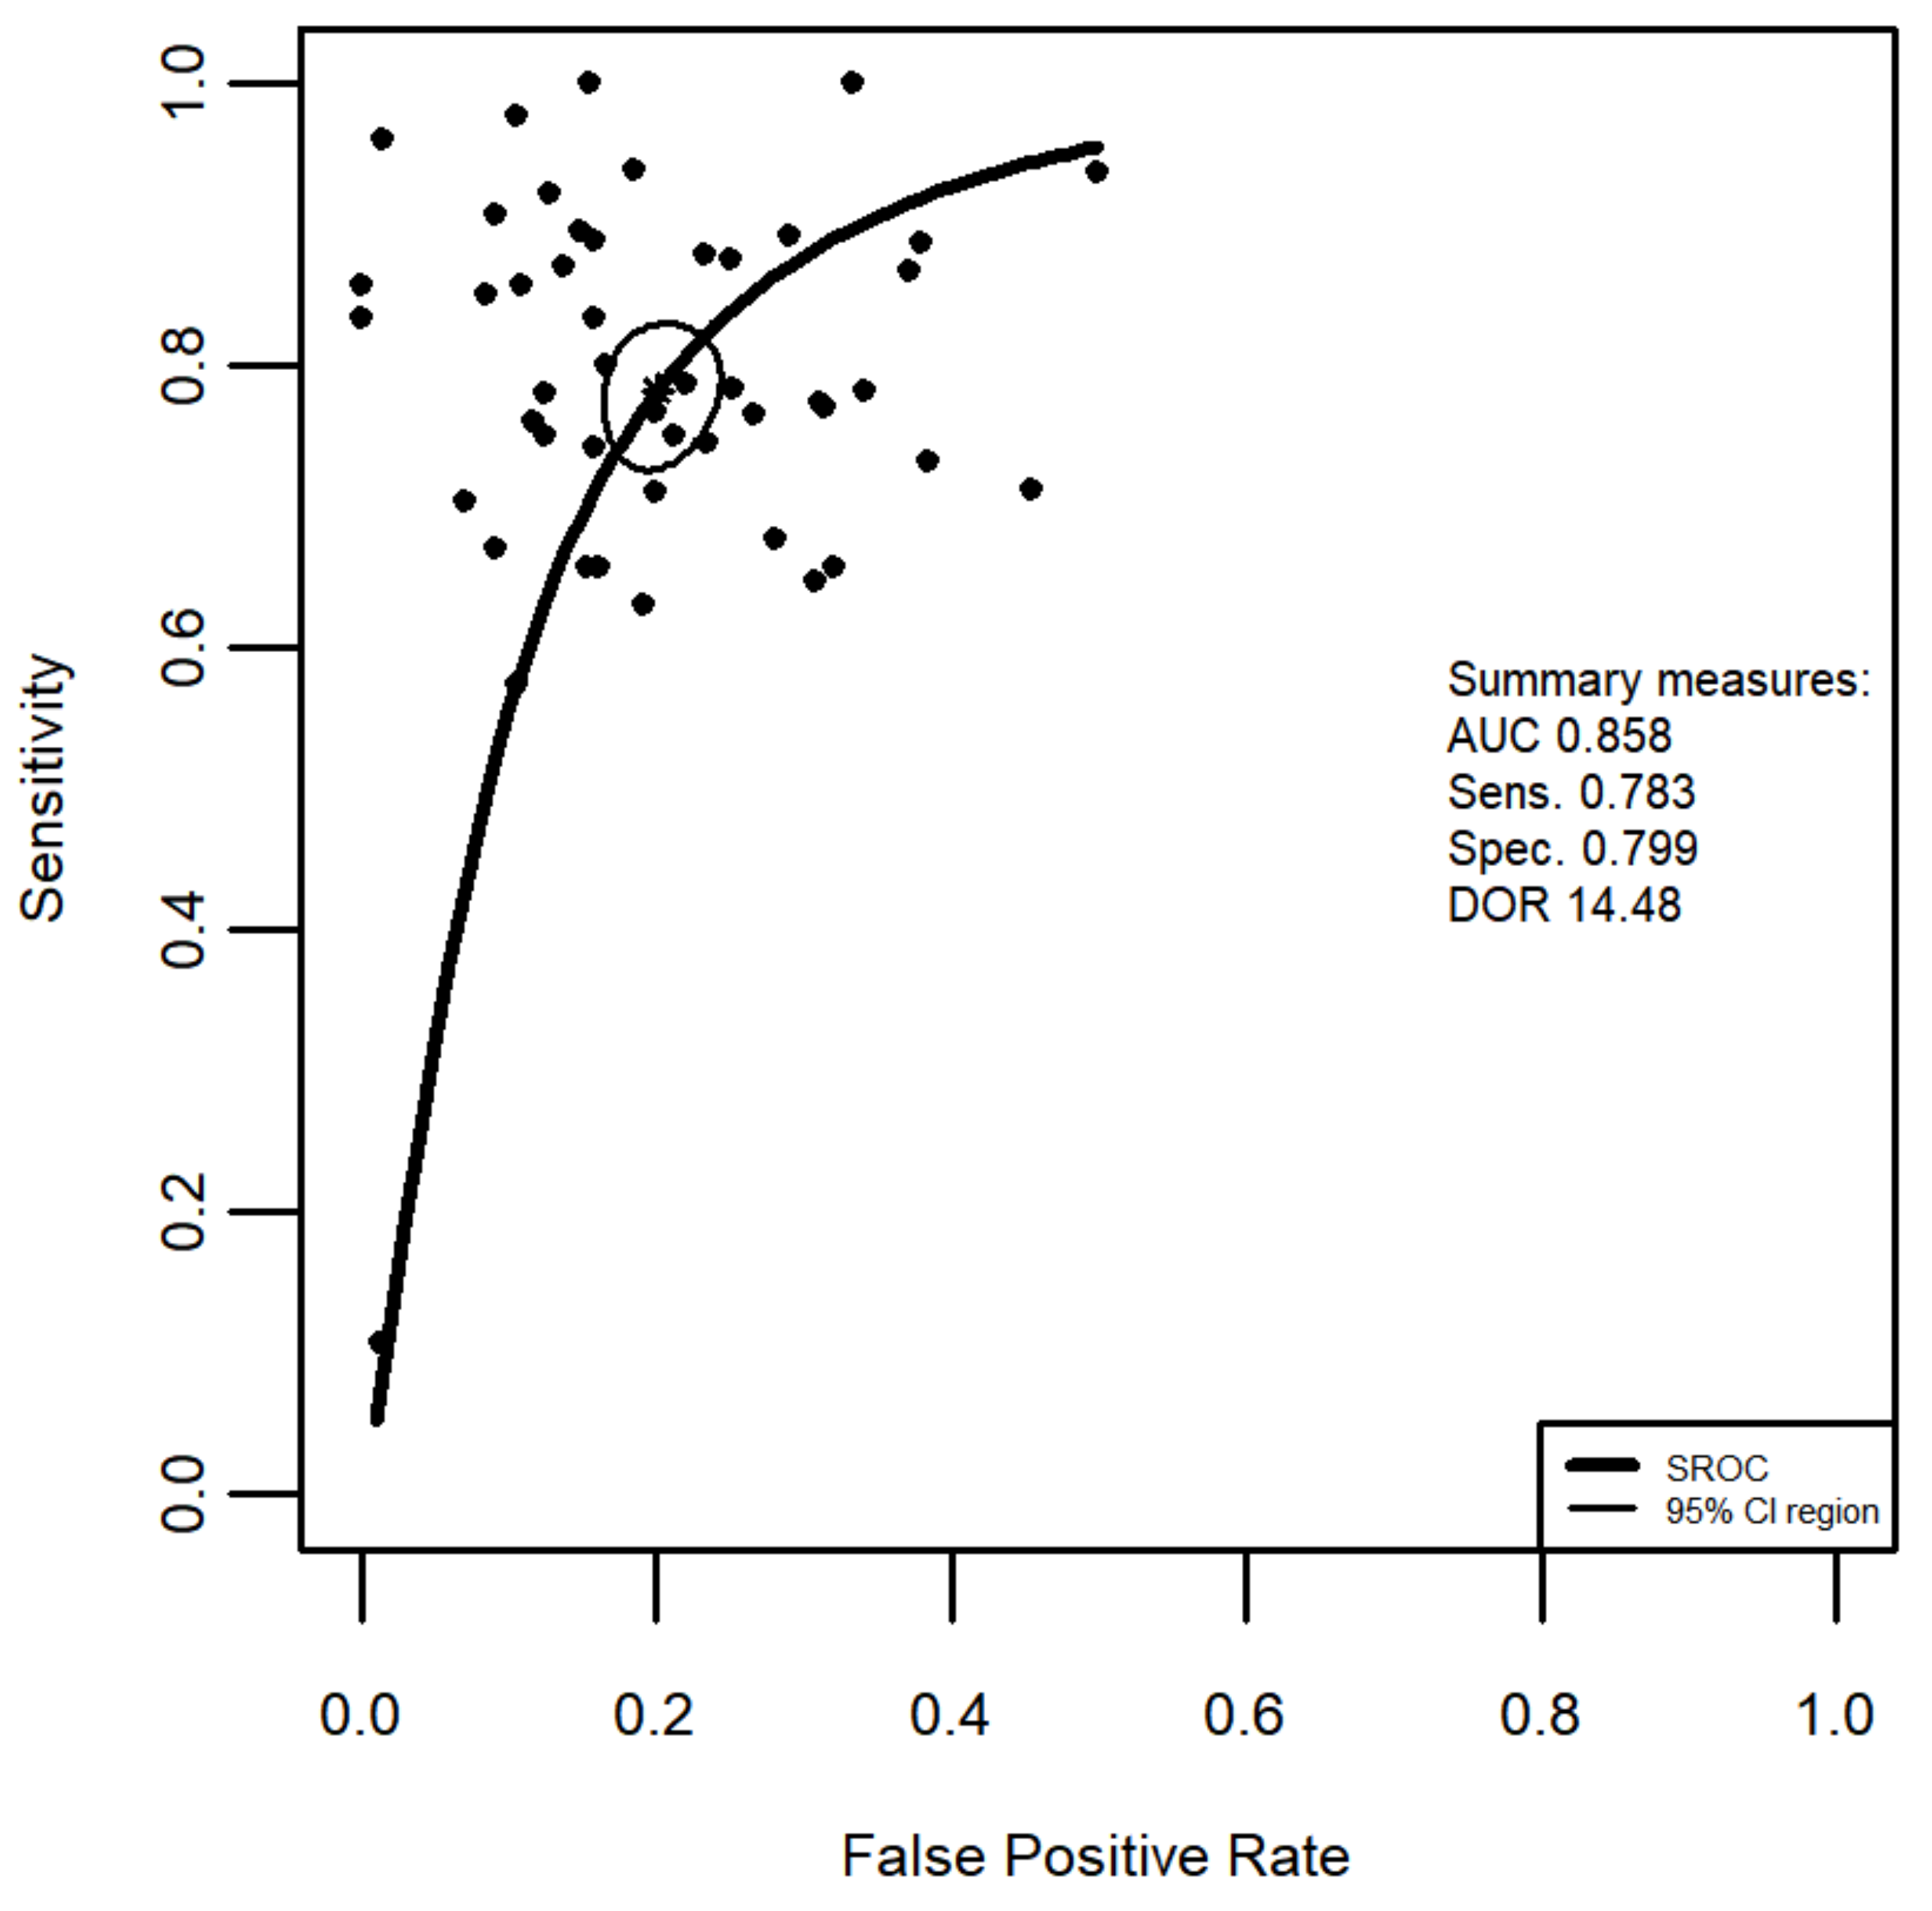
| Random effects model: | 0.804 (0.757; 0.843) | 0.817 (0.780; 0.848) | ||
| Quantifying heterogeneity: | ||||
| tau2 = 0.6772 | tau2 = 0.4718 | |||
| I2 = 87.5% | I2 = 78.6% | |||
| Q = 363.28 (<0.0001) | Q = 209.42 (<0.0001) |
Publisher’s Note: MDPI stays neutral with regard to jurisdictional claims in published maps and institutional affiliations. |
© 2021 by the authors. Licensee MDPI, Basel, Switzerland. This article is an open access article distributed under the terms and conditions of the Creative Commons Attribution (CC BY) license (https://creativecommons.org/licenses/by/4.0/).
Share and Cite
Bromke, M.A.; Neubauer, K.; Kempiński, R.; Krzystek-Korpacka, M. Faecal Calprotectin in Assessment of Mucosal Healing in Adults with Inflammatory Bowel Disease: A Meta-Analysis. J. Clin. Med. 2021, 10, 2203. https://doi.org/10.3390/jcm10102203
Bromke MA, Neubauer K, Kempiński R, Krzystek-Korpacka M. Faecal Calprotectin in Assessment of Mucosal Healing in Adults with Inflammatory Bowel Disease: A Meta-Analysis. Journal of Clinical Medicine. 2021; 10(10):2203. https://doi.org/10.3390/jcm10102203
Chicago/Turabian StyleBromke, Mariusz A., Katarzyna Neubauer, Radosław Kempiński, and Małgorzata Krzystek-Korpacka. 2021. "Faecal Calprotectin in Assessment of Mucosal Healing in Adults with Inflammatory Bowel Disease: A Meta-Analysis" Journal of Clinical Medicine 10, no. 10: 2203. https://doi.org/10.3390/jcm10102203
APA StyleBromke, M. A., Neubauer, K., Kempiński, R., & Krzystek-Korpacka, M. (2021). Faecal Calprotectin in Assessment of Mucosal Healing in Adults with Inflammatory Bowel Disease: A Meta-Analysis. Journal of Clinical Medicine, 10(10), 2203. https://doi.org/10.3390/jcm10102203