
Inpatient Rehabilitation: Prediction of Changes in Sensorimotor Performance in Multiple Sclerosis: A Pilot Study


Abstract
:1. Introduction
2. Materials and Methods
2.1. Sample
2.2. Procedure
2.3. Parameters
2.4. Statistical Analysis
3. Results
3.1. Descriptives
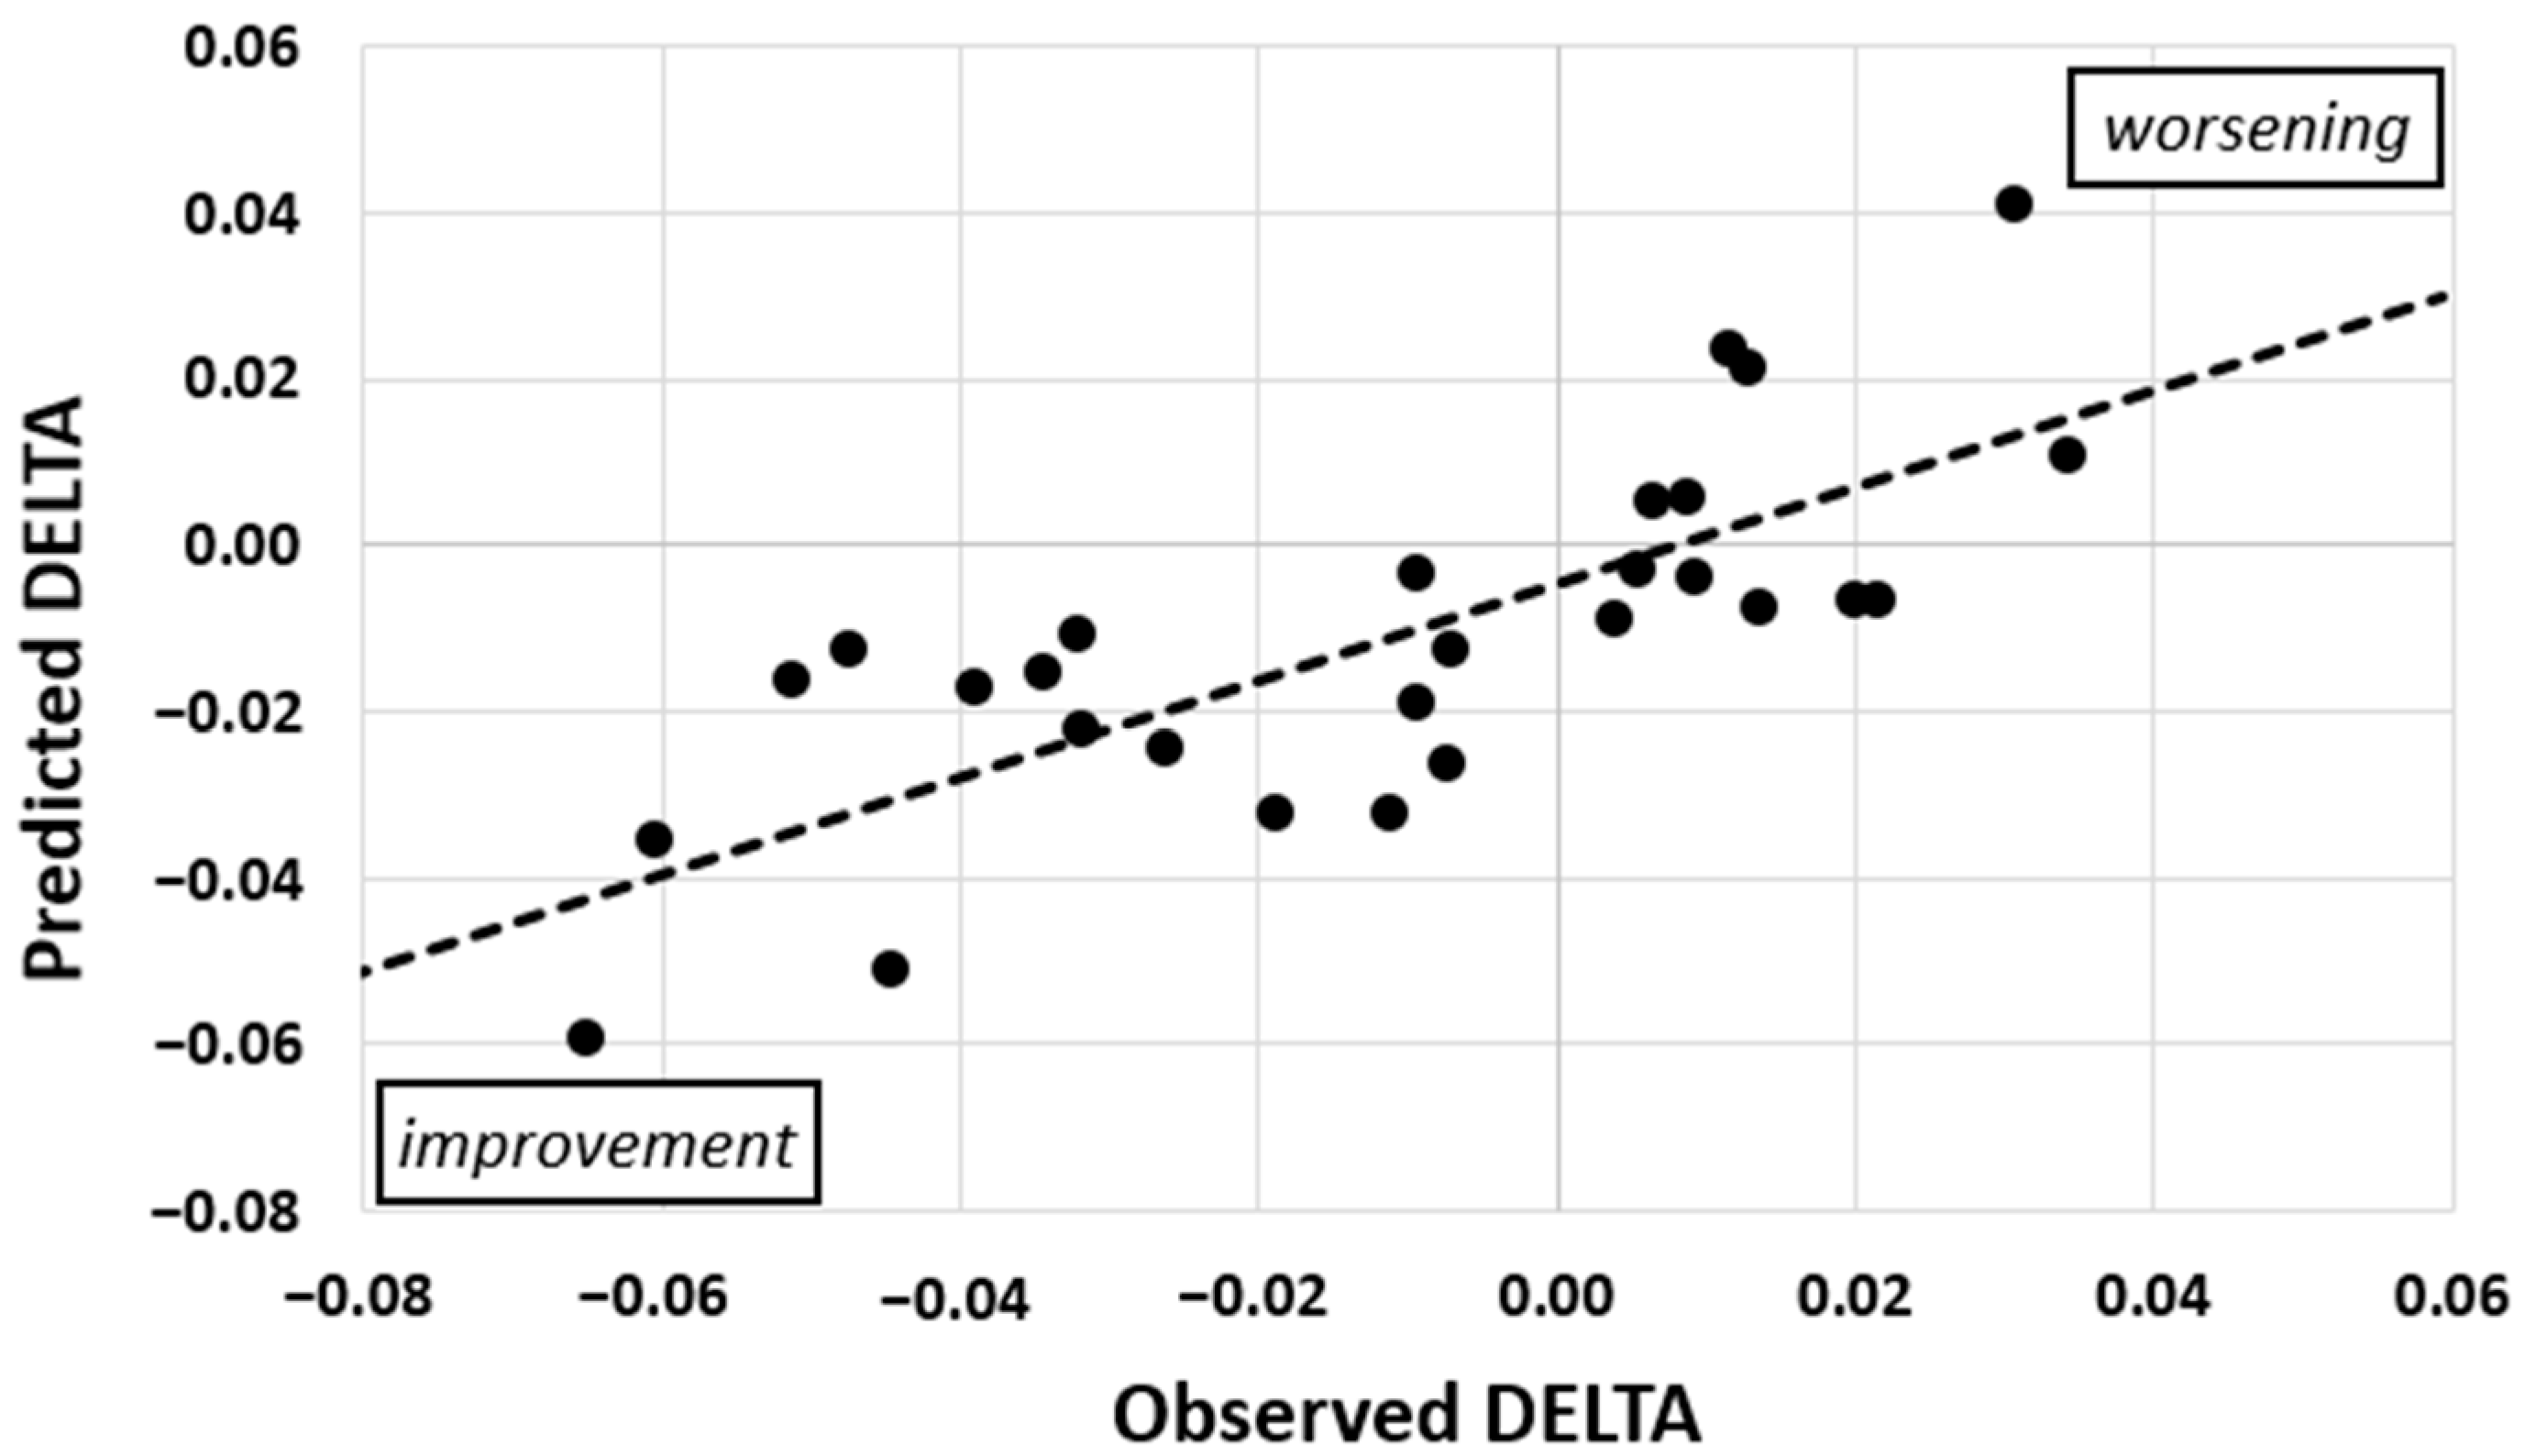
3.2. Prediction of DELTA
4. Discussion
5. Conclusions
Author Contributions
Funding
Institutional Review Board Statement
Informed Consent Statement
Data Availability Statement
Conflicts of Interest
References
- Gulde, P.; Hermsdörfer, J.; Rieckmann, P. Introduction of the Watzmann Severity Scale: A sensorimotor approach to estimate the course of inpatient rehabilitation in multiple sclerosis. Mult. Scler. Relat. Disord. 2021, 48, 102674. [Google Scholar] [CrossRef] [PubMed]
- Kurtzke, J.F. Rating neurologic impairment in multiple sclerosis: An expanded disability status scale (EDSS). Neurology 1983, 33, 1444–1452. [Google Scholar] [CrossRef] [PubMed] [Green Version]
- Cutter, G.R.; Baier, M.L.; Rudick, R.A.; Cookfair, D.L.; Fischer, J.S.; Petkau, J.; Syndulko, K.; Weinshenker, B.G.; Antel, J.P.; Confavreux, C.; et al. Development of a multiple sclerosis functional composite as a clinical trial outcome measure. Brain 1999, 122, 871–882. [Google Scholar] [CrossRef] [PubMed]
- Hervault, M.; Balto, J.M.; Hubbard, E.A.; Motl, R.W. Reliability, precision, and clinically important change of the nine-hole peg test in individuals with multiple sclerosis. Int. J. Rehabil. Res. 2017, 40, 91–93. [Google Scholar] [CrossRef] [PubMed]
- Langdorn, D.W.; Thompson, A.J. Multiple sclerosis: A preliminary study of selected variables affecting rehabilitation outcome. Mult. Scler. 1999, 5, 94–100. [Google Scholar] [CrossRef]
- Granger, C.V.; Brownscheidle, C.M. Outcome measurement in medical rehabilitation. Int. J. Technol. Assess. Health Care 1995, 11, 262–268. [Google Scholar] [CrossRef]
- Wechsler, D. Wechsler Adult Intelligence Scale-Revised; Psychological Cooperation: San Antonio, TX, USA, 1981. [Google Scholar]
- Cattaneo, D.; Coote, S.; Rasova, K.; Gervasoni, E.; Groppo, E.; Prokopiusova, T.; Reznickova, J.; Montesano, A.; Jonsdottir, J. Factors influencing balance improvement in multiple sclerosis rehabilitation: A pragmatic multicentric trial. Ann. Phys. Rehabil. Med. 2020, 63, 93–98. [Google Scholar] [CrossRef]
- Berg, K.O.; Wood-Dauphinee, S.L.; Williams, J.I.; Gayton, D. Measuring balance in the elderly: Preliminary development of an instrument. Physiother. Can. 1989, 4, 304–311. [Google Scholar] [CrossRef]
- Grasso, M.G.; Pace, L.; Troisi, E.; Tonini, A.; Paolucci, S. Prognostic factors in multiple sclerosis rehabilitation. Eur. J. Phys. Rehabil. Med. 2009, 45, 47–51. [Google Scholar]
- Mahoney, F.; Barthel, D.W. Functional evaluation: The Barthel index. Md. State Med. J. 1965, 14, 61–65. [Google Scholar] [PubMed]
- Collen, F.M.; Wade, D.T.; Robb, G.F.; Bradshaw, C.M. The rivermead mobility index: A further development of the rivermead motor assessment. Int. Disabil. Stud. 1991, 13, 50–54. [Google Scholar] [CrossRef] [PubMed]
- Freedson, P.; Melanson, E.; Sirard, J. Calibration of the computer science and applications, Inc. accelerometer. Med. Sci. Sports Exerc. 1998, 30, 777–781. [Google Scholar] [CrossRef] [PubMed]
- Koeneke, S.; Lutz, K.; Herwig, U.; Ziemann, U.; Jäncke, L. Extensive training of elementary finger tapping mvoements changes the pattern of motor cortex excitability. Exp. Brain Res. 2006, 174, 199–209. [Google Scholar] [CrossRef] [Green Version]
- Palmberg, L.; Rantalainen, T.; Rantakokko, M.; Karavirta, L.; Siltanen, S.; Skantz, H.; Saajanaho, M.; Portegijs, E.; Rantanen, T. The associations of activity fragmentation with physical and mental fatigability among community-dwelling 75-, 80-, and 85-year-old people. J. Gerontol. Ser. A 2020, 75, e103–e110. [Google Scholar] [CrossRef]
- Faul, F.; Erdfelder, E.; Lang, A.-G.; Buchner, A. G*Power 3: A flexible statistical power analysis program for the social, behavioral, and biomedical sciences. Behav. Res. Methods 2007, 39, 175–191. [Google Scholar] [CrossRef]
- Jelinek, G.A.; de Livera, A.M.; Marck, C.H.; Brown, C.R.; Neate, S.L.; Tayler, K.L.; Weiland, T.J. Lifestyle, medication and socio-demographic determinants of mental and physical health-related quality of life in people with multiple sclerosis. BMC Neurol. 2016, 16, 235. [Google Scholar] [CrossRef] [PubMed] [Green Version]
- Fitzgerald, K.C.; Tyry, T.; Salter, A.; Cofield, S.S.; Cutter, G.; Fox, R.; Marrie, R.A. Diet quality is associated with disability and symptom severity in multiple sclerosis. Neurology 2018, 90, e1–e11. [Google Scholar] [CrossRef]
- Karnoe, A.; Pedersen, L.M.; Karlsen, S.; Boesen, F.; Skovgaard, L.; Kayser, L. How people with multiple sclerosis experience the influence of nutrition and lifestyle factors on the disease. Disabil. Rehabil. 2020, 42, 3504–3515. [Google Scholar] [CrossRef]
- Varì, R.; Scazzocchio, B.; D’Amore, A.; Giovannini, C.; Gessani, S.; Masella, R. Gender-related differences in lifestyle may affect health status. Annali dell’Istituto Superiore di Sanità 2016, 52, 158–166. [Google Scholar]
- Trost, S.G.; Pate, R.R.; Sallis, J.F.; Freedson, P.S.; Taylor, W.C.; Dowda, M.; Sirard, J. Age and gender differences in objectively measured physical activity in youth. Med. Sci. Sports Exerc. 2002, 34, 350–355. [Google Scholar] [CrossRef]
- Bove, R.M. Why monkeys do not get multiple sclerosis (spontaneously). Evol. Med. Public Health 2018, 2018, 43–59. [Google Scholar] [CrossRef] [PubMed] [Green Version]
- Rudick, R.A.; Cutter, G.; Reingold, S. The multiple sclerosis functional composite: A new clinical outcome measure for multiple sclerosis trials. Mult. Scler. 2002, 8, 359–365. [Google Scholar] [CrossRef]
- Armutlu, K.; Karabudak, R.; Nurlu, G. Physiotherapy approaches in the treatment of ataxic multiple sclerosis: A pilot study. Neurorehabilit. Neural Repair 2001, 15, 203–211. [Google Scholar] [CrossRef] [PubMed]
- Feter, N.; Freitas, M.; Gonzales, N.; Umpierre, D.; Cardoso, R.; Rombaldi, A. Effects of physical exercise on myelin sheath regeneration: A systematic review and meta-analysis. Sci. Sports 2018, 33, 8–21. [Google Scholar] [CrossRef]
- Kallmann, B.A.; Fackelmann, S.; Toyka, K.V.; Rieckmann, P.; Reiners, K. Early abnormalities of evoked potentials and future disability in patients with multiple sclerosis. Mult. Scler. 2006, 12, 58–65. [Google Scholar] [CrossRef] [PubMed]


| Parameter | Mean, STD, and Range | Parameter | Mean, STD, and Range | Parameter | Mean, STD, and Range |
|---|---|---|---|---|---|
| Age in a | 46.3 ± 11.2 23–73 | Grip in kg | 68.0 ± 19.2 33.3–97.2 | Steps | 93.4k ± 31.4k 44.6k–183.5k |
| EDSS | 3.3 ± 1.4 1.0–6.5 | Tap in Hz | 12.1 ± 1.9 7.4–16.0 | Met | 1.42 ± 0.10 1.26–1.61 |
| Manifest in a | 13.9 ± 11.7 0–46 | Sway in s2/m | 11.5 ± 3.9 0.9–18.9 | Ratio | 6.5 ± 3.7 2.4–15.0 |
| Sex | 46% male 54% female | RT in ms | 479 ± 50 387–583 | Rest in h | 7.4 ± 1.0 5.2–9.4 |
| Type | 68% rel. rem. 32% progr. | Pursuit in mm | 13.7 ± 2.3 10.1–20.1 | DMT | 68% yes 32% no |
| BMI in kg/m2 | 25.9 ± 4.5 18.2–35.1 | Complexity | 62 ± 20% 29–92% | COM | 1.2 ± 1.3 0–5 |
| Day in d | 19.3 ± 4.5 10–29 | Walk in s | 7.9 ± 3.9 4.4–24.1 | ||
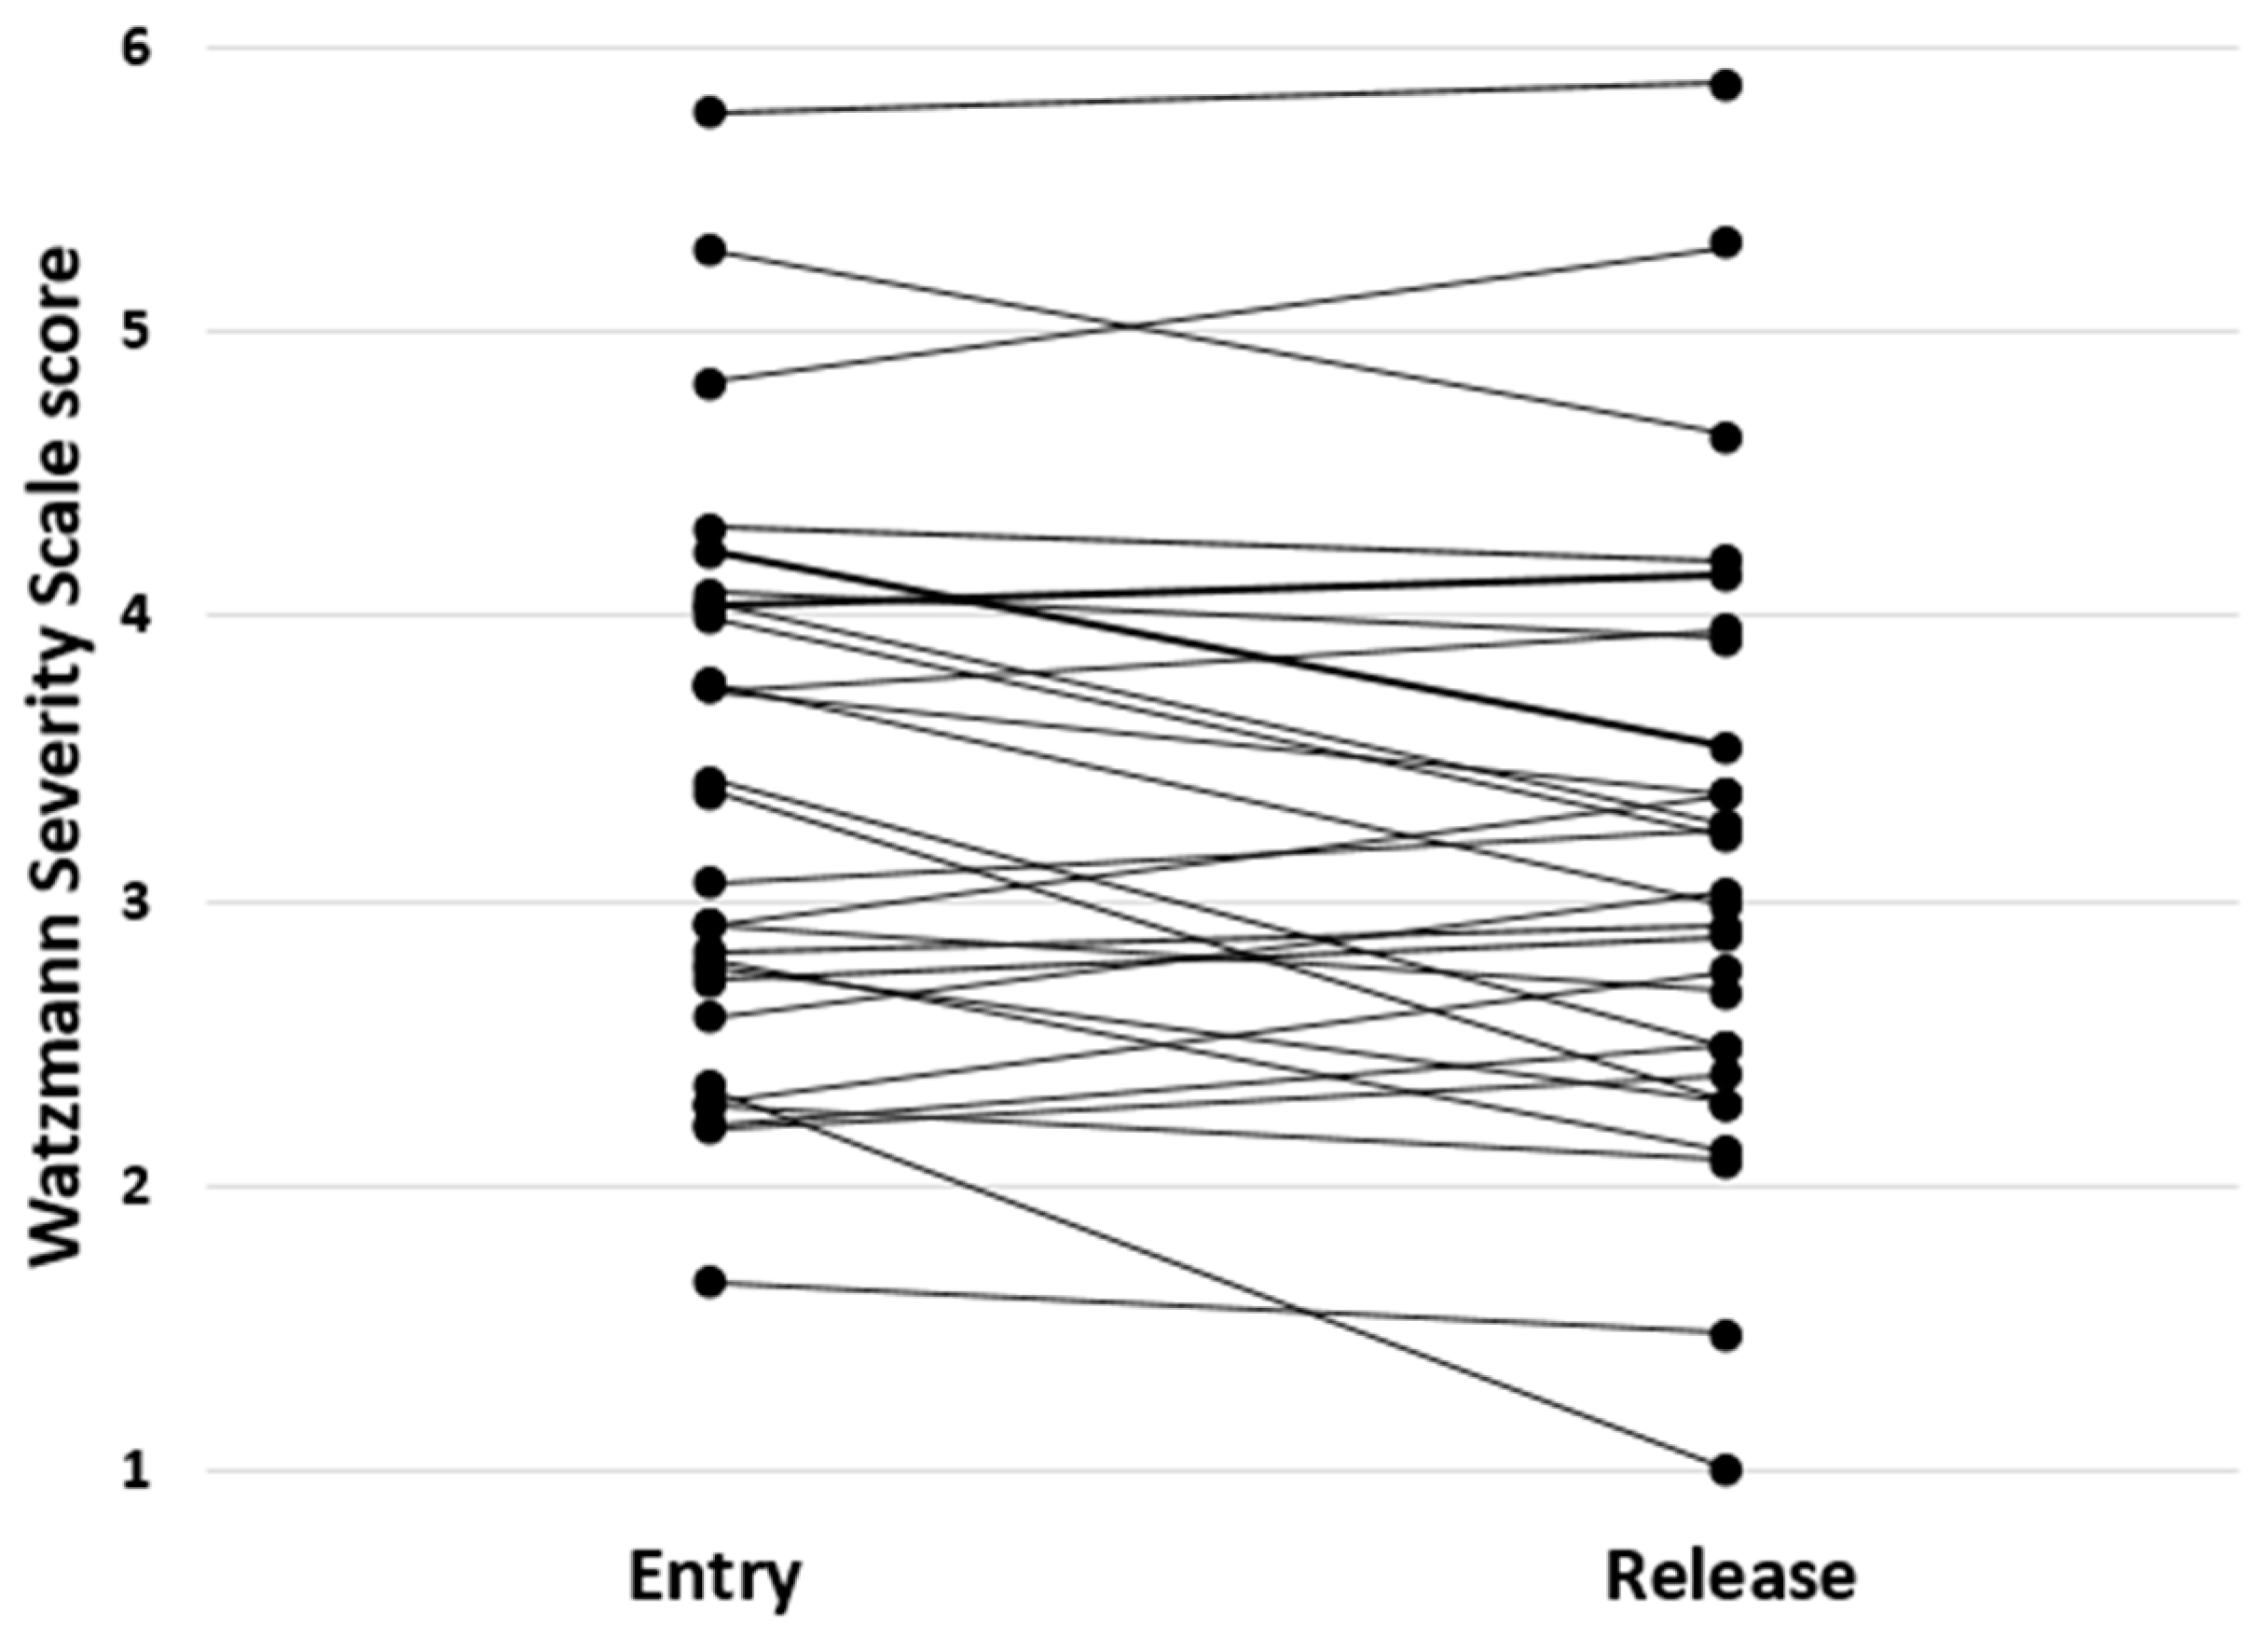
| WSSentry | 3.4 ± 1.0 1.7–5.8 | PEG in s | 49.9 ± 13.9 33.2–92.0 | ||
| WSSrelease | 3.1 ± 1.1 1.0–5.9 | ||||
| DELTA | −0.011 ± 0.028 −0.065–0.034 |
| STEPS | REST | EDSS | TYPE | PURSUIT | |
|---|---|---|---|---|---|
| β-weight | 0.52 | 0.46 | 0.38 | 0.37 | −0.35 |
| VIF | 1.27 | 1.50 | 1.32 | 1.28 | 1.33 |
| p | <0.01 | 0.01 | 0.03 | 0.03 | 0.04 |
Publisher’s Note: MDPI stays neutral with regard to jurisdictional claims in published maps and institutional affiliations. |
© 2021 by the authors. Licensee MDPI, Basel, Switzerland. This article is an open access article distributed under the terms and conditions of the Creative Commons Attribution (CC BY) license (https://creativecommons.org/licenses/by/4.0/).
Share and Cite
Gulde, P.; Hermsdörfer, J.; Rieckmann, P. Inpatient Rehabilitation: Prediction of Changes in Sensorimotor Performance in Multiple Sclerosis: A Pilot Study. J. Clin. Med. 2021, 10, 2177. https://doi.org/10.3390/jcm10102177
Gulde P, Hermsdörfer J, Rieckmann P. Inpatient Rehabilitation: Prediction of Changes in Sensorimotor Performance in Multiple Sclerosis: A Pilot Study. Journal of Clinical Medicine. 2021; 10(10):2177. https://doi.org/10.3390/jcm10102177
Chicago/Turabian StyleGulde, Philipp, Joachim Hermsdörfer, and Peter Rieckmann. 2021. "Inpatient Rehabilitation: Prediction of Changes in Sensorimotor Performance in Multiple Sclerosis: A Pilot Study" Journal of Clinical Medicine 10, no. 10: 2177. https://doi.org/10.3390/jcm10102177
APA StyleGulde, P., Hermsdörfer, J., & Rieckmann, P. (2021). Inpatient Rehabilitation: Prediction of Changes in Sensorimotor Performance in Multiple Sclerosis: A Pilot Study. Journal of Clinical Medicine, 10(10), 2177. https://doi.org/10.3390/jcm10102177