
Prevalence of Use of Preventive Services in Poland: Result from a Population-Based Nationwide Study


Abstract
1. Introduction
2. Materials and Methods
2.1. Database
2.2. Study Population
2.3. Variables
2.4. Statistical Analysis
3. Results
4. Discussion
Author Contributions
Funding
Institutional Review Board Statement
Informed Consent Statement
Data Availability Statement
Conflicts of Interest
Appendix A

| Preventive Services | Reference Period | Target Group | Strength of Recommendation |
|---|---|---|---|
| Blood pressure | annual | all | High |
| Blood sugar | every three years | adults aged 45 to 69 | High |
| Lipid profile | every five years | females aged 45 to 69 men aged 35 to 69 | High |
| Flu vaccination | annual | all | Low |
| Colonoscopy | every ten years | adults aged 55 to 64 | High |
| GP visit | annual | all | High |
| Obesity counselling | annual | adults with a BMI of 25 kg/m2 or more | Low |
| Alcohol consumption counselling | annual | for alcohol abusers | Low |
| Tobacco use counseling | annual | for smokers | Low |
| Depression counselling | annual | all | Low |
| PSA measurement | annual | males aged 50 to 69 | Low |
| Mammography | every two years | females aged 50 to 69 | High |
| Cervical smear | every three years | females aged 25 to 39 | High |
| Percentage of Utilization | All Percentage of Participants (n) | Quartiles | All Percentage of Participants (n) | ||||
|---|---|---|---|---|---|---|---|
| PScrU | PCnsU | PSrvU | PScrU | PCnsU | PSrvU | ||
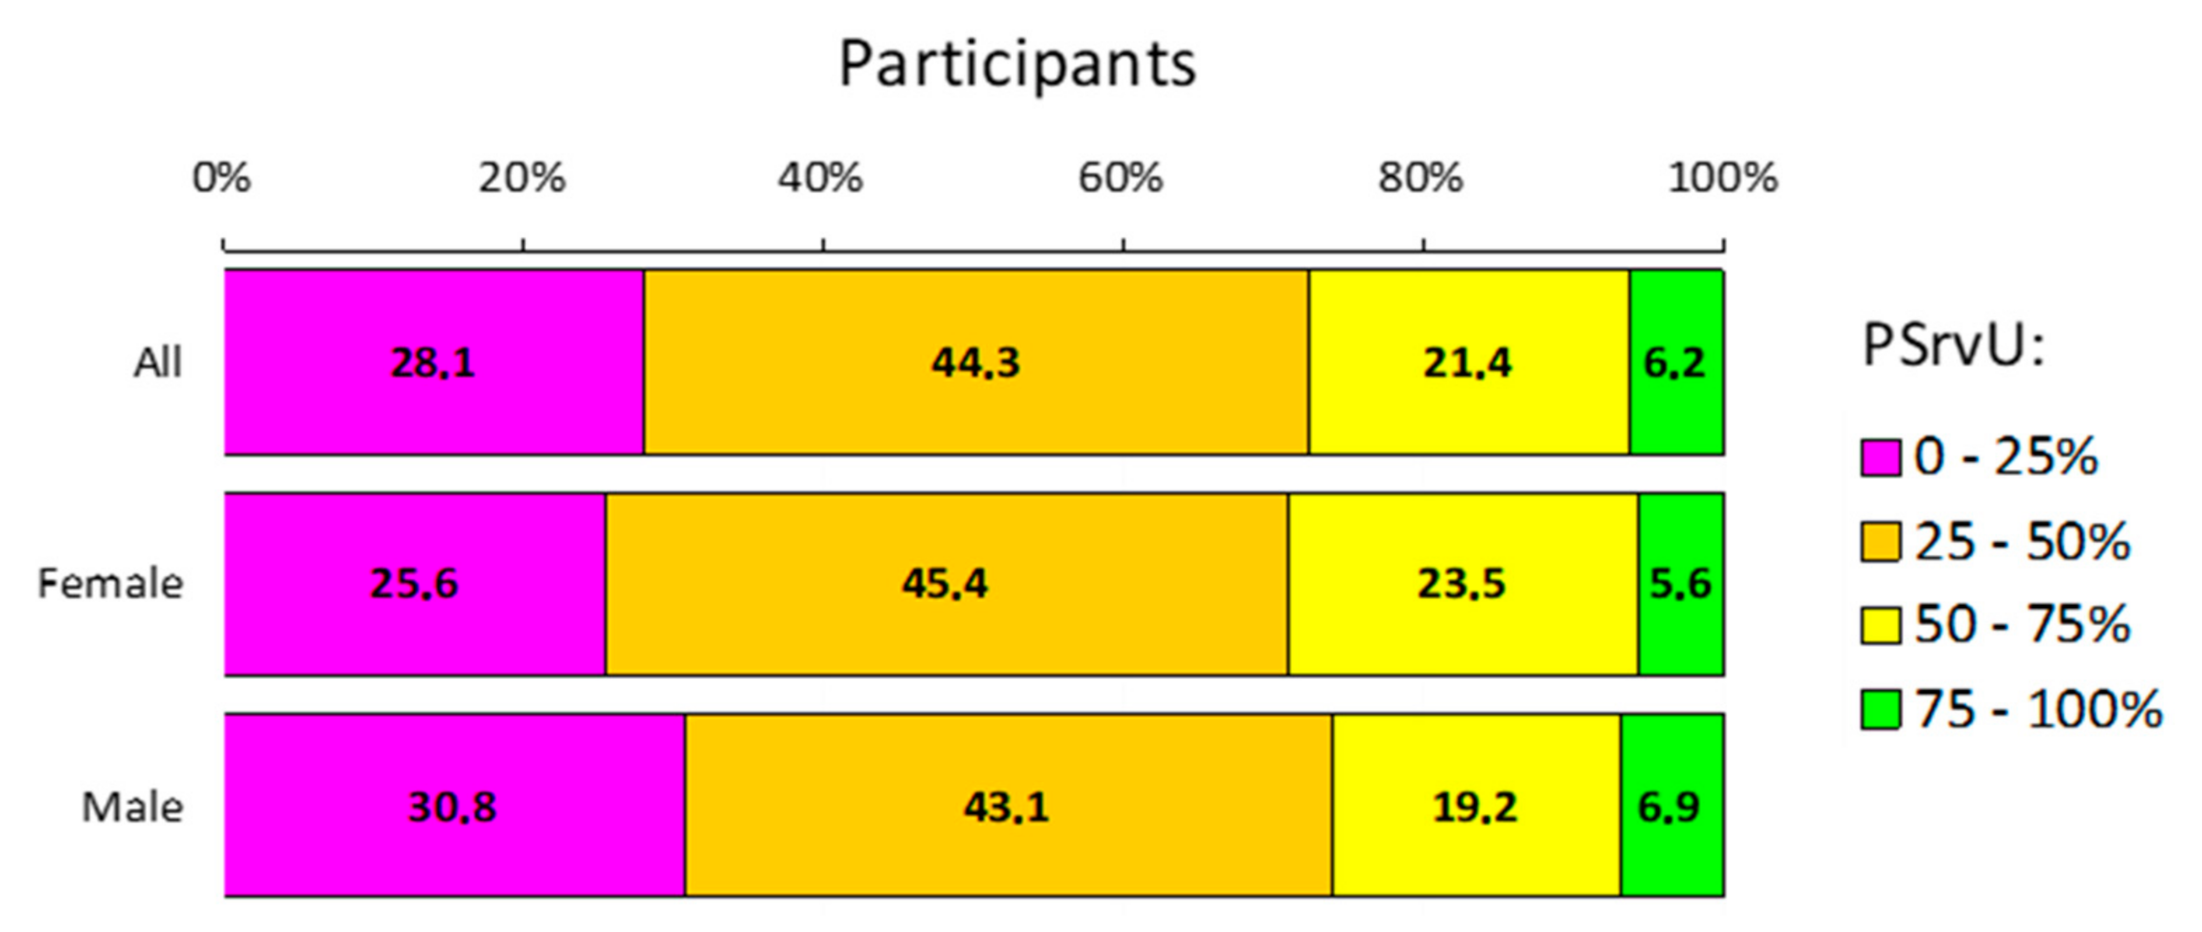
| 0% | 0.7 (7) | 61.8 (618) | 0.7 (7) | 0–25 | 15.0 (150) | 72.4 (724) | 28.1 (281) |
| >0%, ≤25% | 14.3 (143) | 10.6 (106) | 27.4 (274) | ||||
| >25%, ≤50% | 25.4 (254) | 15.2 (152) | 44.3 (443) | >25–50 | 25.4 (254) | 15.2 (152) | 44.3 (443) |
| >50%, ≤75% | 43.3 (433) | 7.4 (74) | 21.4 (214) | >50–75 | 43.3 (433) | 7.4 (74) | 21.4 (214) |
| >75%, <100% | 9.9% (99) | 0.7 (7) | 4.7 (47) | >75–100 | 16.3 (163) | 5.0 (50) | 6.2 (62) |
| 100% | 6.4% (64) | 4.3 (43) | 1.5 (15) | ||||
| Percentage of Utilization | Females Percentage of participants (n) | Quartiles | Females Percentage of participants (n) | ||||
| PScrU | PCnsU | PSrvU | PScrU | PCnsU | PSrvU | ||
| 0% | 0.2 (1) | 64.8 (337) | 0.2 (1) | 0–25 | 12.9 (67) | 74.2 (386) | 25.6 (133) |
| >0%, ≤25% | 12.7 (66) | 9.4 (49) | 25.4 (132) | ||||
| >25%, ≤50% | 24.4 (127) | 16.5 (86) | 45.4 (236) | >25–50 | 24.4 (127) | 16.5 (86) | 45.4 (236) |
| >50%, ≤75% | 46.2 (240) | 5.2 (27) | 23.5 (122) | >50–75 | 46.2 (240) | 5.2 (27) | 23.5 (122) |
| >75%, <100% | 10.6 (55) | 1.0 (5) | 5.0 (26) | >75–100 | 16.5 (86) | 4.0 (21) | 5.6 (29) |
| 100% | 6.0 (31) | 3.1 (16) | 0.6 (3) | ||||
| Percentage of Utilization | Males Percentage of Participants (n) | Quartiles | Males Percentage of Participants (n) | ||||
| PScrU | PCnsU | PSrvU | PScrU | PCnsU | PSrvU | ||
| 0% | 1.3 (6) | 58.5 (281) | 1.3 (6) | 0–25 | 17.3 (67) | 70.4 (338) | 30.8 (148) |
| >0%, ≤25% | 16.0 (77) | 11.9 (57) | 29.6 (142) | ||||
| >25%, ≤50% | 26.5 (127) | 13.8 (66) | 43.1 (207) | >25–50 | 26.5 (127) | 13.8 (66) | 43.1 (207) |
| >50%, ≤75% | 40.2 (193) | 9.8 (47) | 19.2 (92) | >50–75 | 40.2 (193) | 9.8 (47) | 19.2 (92) |
| >75%, <100% | 9.2 (44) | 0.4 (2) | 4.4 (21) | >75–100 | 16.0 (77) | 6.0 (29) | 6.9 (33) |
| 100% | 6.9 (33) | 5.6 (27) | 2.5 (12) | ||||


Appendix B. Study Survey (Translated From Polish)
- What is your weight (in kilograms)?
- What is your height (in centimeters)?
- When was the last time you visited a doctor for a health assessment, follow-up care for an ongoing problem, or a concern that you have about your health? Do not include emergency visits or hospitalizations.
- within the past 12 months
- within the past 1 to 2 years
- within the past 2 to 5 years
- more than five years ago
- never
- Have you been vaccinated against the flu within the previous 12 months?
- Yes
- No
- During the past 12 months, has doctor or other healthcare professional given you advice about how to manage your weight, discussed weight loss goals with you, or referred you to a weight loss program to help with your diet and exercise?
- Yes
- No
- Within the past 12 months, has doctor or other healthcare professional asked you how much and how often you drink alcohol? You may have answered in person, on paper, or on a computer.
- Yes
- No
- Within the past 12 months, have you had 4 or more standard portions of alcohol? (A standard portion refers to 250 mL glass of 5% beer, 100 mL glass of 12% wine or 30mL glass of 40% vodka)
- Yes
- No
- Within the past 12 months, has doctor or other healthcare professional advised you to cut back or stop drinking alcohol?
- Yes
- No
- Within the past 12 months, on average, would you say you smoked cigarettes or used tobacco every day, some days, or not at all?
- Every day
- Occasionally
- Not at all
- Within the past 12 months, has doctor or other healthcare professional advised you to quit smoking or quit using tobacco?
- Yes
- No
- Within the past 12 months, has doctor or other healthcare professional asked you about your mood, such as whether you are anxious or depressed? You may have answered in person, on paper, or on a computer.
- Yes
- No
- Within the past 12 months, have you had your blood pressure checked by a doctor, nurse, or other health care professional?
- Yes
- No
- Do you expect public health system to give you access to preventive services and provide all necessary information?
- Yes
- No
- Would you be interested in telehealth solutions to access preventive services remotely (e.g., via telemedicine platforms, e-consultations, etc.)
- Yes
- No
- 15.
- Within the past five years, have you had your blood lipid profile tested?
- Yes
- No
- 16.
- Have you had a hysterectomy or have you ever had cervical cancer?
- Yes
- No
- 17.
- Within the last three years, have you had a cervical smear test?
- Yes
- No
- 18.
- Have you had both breasts removed or have you ever had breast cancer?
- Yes
- No
- 19.
- Within the last two years, have you had a mammography? A mammography is an x-ray taken only of the breast by a machine that presses against the breast?
- Yes
- No
- 20.
- Have you had colon cancer or your entire colon removed (colectomy)?
- Yes
- No
- 21.
- Within the past ten years, have you had a colonoscopy?
- Yes
- No
- 22.
- Do you have diabetes?
- Yes
- No
- 23.
- Within the last three years, have you had a blood glucose test?
- Yes
- No
- 24.
- Within the past five years, have you had your blood lipid profile tested?
- Yes
- No
- 25.
- Have you had colon cancer or your entire colon removed (colectomy)?
- Yes
- No
- 26.
- Within the past ten years, have you had a colonoscopy?
- Yes
- No
- 27.
- Do you have diabetes?
- Yes
- No
- 28.
- Within the last three years, have you had a blood glucose test?
- Yes
- No
- 29.
- Have you ever had prostate cancer?
- Yes
- No
- 30.
- During the past 12 months, have you had a PSA test?
- Yes
- No
References
- Wändell, P.E.; De Waard, A.K.M.; Holzmann, M.J.; Gornitzki, C.; Lionis, C.; De Wit, N.; Søndergaard, J.; Sønderlund, A.L.; Kral, N.; Seifert, B.; et al. Barriers and facilitators among health professionals in primary care to prevention of cardiometabolic diseases: A systematic review. Fam. Pract. 2018, 35, 383–398. [Google Scholar] [CrossRef] [PubMed]
- de Waard, A.K.M.; Wändell, P.E.; Holzmann, M.J.; Korevaar, J.C.; Hollander, M.; Gornitzki, C.; de Wit, N.J.; Schellevis, F.G.; Lionis, C.; Søndergaard, J.; et al. Barriers and facilitators to participation in a health check for cardiometabolic diseases in primary care: A systematic review. Eur. J. Prev. Cardiol. 2018, 25, 1326–1340. [Google Scholar] [CrossRef] [PubMed]
- Masters, R.; Anwar, E.; Collins, B.; Cookson, R.; Capewell, S. Return on investment of public health interventions: A systematic review. J. Epidemiol. Community Health 2017, 71, 827–834. [Google Scholar] [CrossRef] [PubMed]
- Willems, B.; Bracke, P. Erratum: Correction to: The education gradient in cancer screening participation: A consistent phenomenon across Europe? (International journal of public health (2018) 63 1 (93-103)). Int. J. Public Health 2019, 64, 813–818. [Google Scholar] [CrossRef] [PubMed]
- Jusot, F.; Or, Z.; Sirven, N. Variations in preventive care utilisation in Europe. Eur. J. Ageing 2012, 9, 15–25. [Google Scholar] [CrossRef] [PubMed]
- Borsky, A.; Zhan, C.; Miller, T.; Ngo-Metzger, Q.; Bierman, A.S.; Meyers, D. Few Americans receive all high-priority, appropriate clinical preventive services. Health Aff. 2018, 37, 925–928. [Google Scholar] [CrossRef] [PubMed]
- Eurostat. Healthcare Activities Statistics—Preventive Services; Preventive Services: 2015. Available online: https://ec.europa.eu/eurostat/statistics-explained/index.php?title=Healthcare_expenditure_statistics_-_methodology (accessed on 6 May 2021).
- Russo, C.A.; Elixhauser, A. Hospitalizations in the Elderly Population, 2003: Statistical Brief #6. Healthc. Cost Util. Proj. Stat. Briefs 2006, 6. [Google Scholar]
- Frank, C.C.; Feldman, S.; Wyman, R. Caring for older patients in primary care: Wisdom and innovation from Canadian family physicians. Can. Fam. Physician 2018, 64, 416–418. [Google Scholar] [PubMed]
- Maciosek, M.V.; LaFrance, A.B.; Dehmer, S.P.; McGree, D.A.; Flottemesch, T.J.; Xu, Z.; Solberg, L.I. Updated priorities among effective clinical preventive services. Ann. Fam. Med. 2017, 15, 14–22. [Google Scholar] [CrossRef] [PubMed]
- Maciosek, M.V.; Coffield, A.B.; Flottemesch, T.J.; Edwards, N.M.; Solberg, L.I. Greater use of preventive services in U.S. health care could save lives at little or no cost. Health Aff. 2010, 29, 1656–1660. [Google Scholar] [CrossRef] [PubMed]
- Bertakis, K.D.; Azari, R.; Helms, L.J.; Callahan, E.J.; Robbins, J.A. Gender Differences in the Utilization of Health Care Services. J. Fam. Pract. 2000, 49, 147–152. [Google Scholar] [PubMed]
- McGovern, P.G.; Lurie, N.; Margolis, K.L.; Slater, J.S. Accuracy of self-report of mammography and Pap smear in a low-income urban population. Am. J. Prev. Med. 1998, 14, 201–208. [Google Scholar] [CrossRef]
- Busse, R.; Scheller-kreinsen, D.; Zentner, A. Tackling Chronic Disease in Europe; World Health Organization: Geneva, Switzerland, 2010; Volume 127. [Google Scholar]
- Brennan, P.; Perola, M.; van Ommen, G.J.; Riboli, E. Chronic disease research in Europe and the need for integrated population cohorts. Eur. J. Epidemiol. 2017, 32, 741–749. [Google Scholar] [CrossRef] [PubMed]
- Smith, S.M. Caring for people with multiple chronic conditions. Prev. Chronic Dis. 2015, 12, 35–40. [Google Scholar] [CrossRef] [PubMed][Green Version]
- Agrawal, S.; Gołębiowska, J.; Bartoszewicz, B.; Makuch, S.; Mazur, G. Clinical preventive services to reduce pandemic deaths. Prev. Med. Rep. 2020, 20. [Google Scholar] [CrossRef]
- 3% of Healthcare Expenditure Spent on Preventive Care—Products Eurostat News—Eurostat. Available online: https://ec.europa.eu/eurostat/web/products-eurostat-news/-/ddn-20210118-1 (accessed on 6 May 2021).
- Levine, S.; Malone, E.; Lekiachvili, A.; Briss, P. Health care industry insights: Why the use of preventive services is still low. Prev. Chronic Dis. 2019, 16. [Google Scholar] [CrossRef] [PubMed]


| Preventive Services | All | Females | Males |
|---|---|---|---|
| Screening | |||
| GP visit | 73.3 | 75.6 | 70.8 |
| Blood pressure | 67.8 | 67.7 | 67.9 |
| Flu vaccination | 12.8 | 10.8 | 15 * |
| Lipid profile | 59.1 | 64.9 | 52.9 *** |
| Colonoscopy | 19.1 | 22.7 | 15.2 ** |
| Blood glucose | 65.8 | 71.3 | 59.9 |
| Cervical smear | 67 | 67 | - |
| Mammography | 51 | 51 | - |
| PSA | 26.2 | - | 26.2 |
| Counselling | |||
| Obesity | 20.3 | 19 | 21.7 |
| Alcohol consumption | 8.9 | 6.2 | 11.9 ** |
| Tobacco use | 17.4 | 13.7 | 21.5 ** |
| Depression | 19.8 | 19.8 | 19.8 |
| All | Females | Males | |
|---|---|---|---|
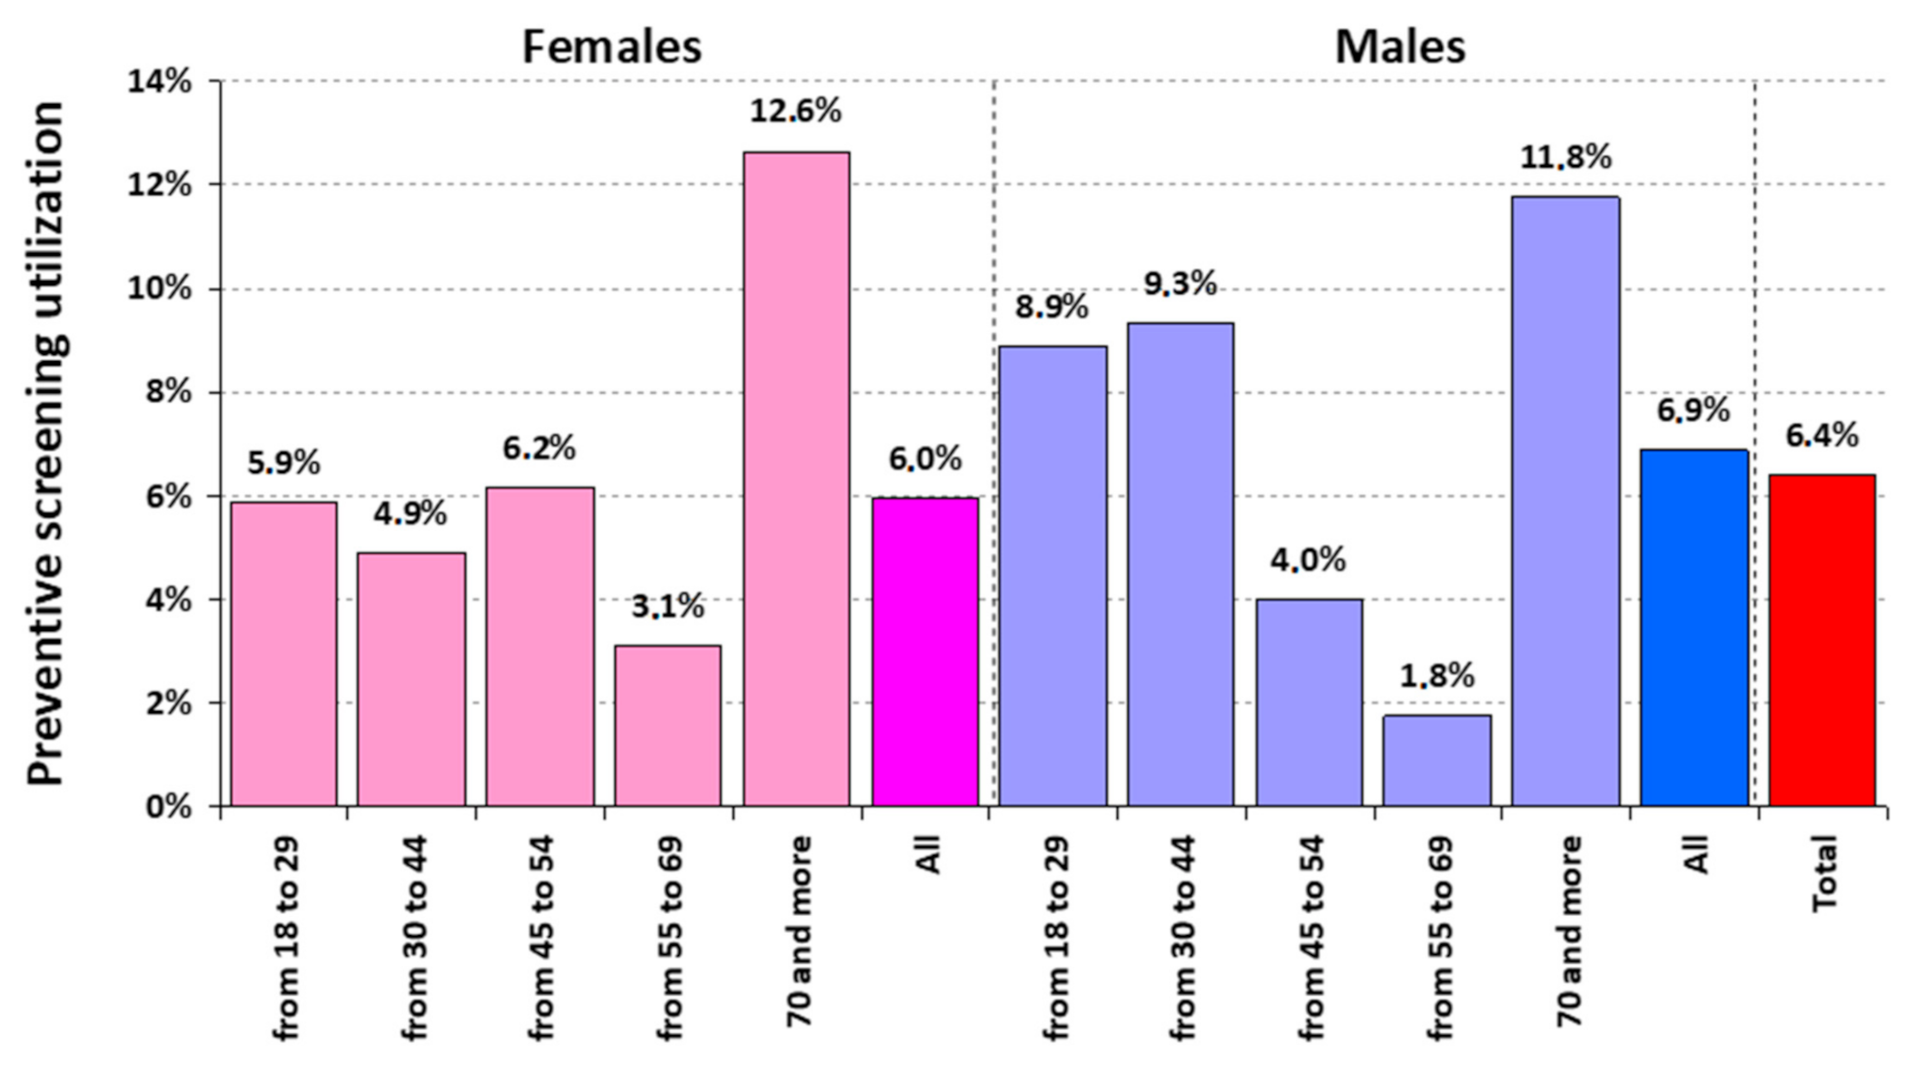
| Preventive screening utilization = 100% | 6.40 [4.88, 7.92] | 5.96 [3.92, 8.00] | 6.88 [4.60, 9.15] |
| Preventive counselling utilization = 100% | 4.30 [3.04, 5.56] | 3.08 [1.59, 4.57] | 5.62 [3.56, 7.69] |
| Preventive service utilization = 100% | 1.50 [0.75, 2.25] | 0.58 [0.00, 1.23] | 2.50 [1.10, 3.90] |
| Female N = 520 | Male N = 480 | All N = 1000 | p-Value | ||||
|---|---|---|---|---|---|---|---|
| N | % | N | % | N | % | ||
| Do you expect the public health system to give you access to preventive services and provide all necessary information? | 0.005 | ||||||
| Yes | 398 | 76.5% | 328 | 68.3% | 726 | 72.6% | |
| No | 122 | 23.5% | 152 | 31.7% | 274 | 27.4% | |
| Would you be interested in telehealth solutions to access preventive services remotely (e.g., via telemedicine platforms, e-consultations, etc.) | 0.426 | ||||||
| Yes | 398 | 72.6% | 356 | 74.2% | 754 | 75.4% | |
| No | 122 | 23.5% | 124 | 25.8% | 246 | 24.6% | |
Publisher’s Note: MDPI stays neutral with regard to jurisdictional claims in published maps and institutional affiliations. |
© 2021 by the authors. Licensee MDPI, Basel, Switzerland. This article is an open access article distributed under the terms and conditions of the Creative Commons Attribution (CC BY) license (https://creativecommons.org/licenses/by/4.0/).
Share and Cite
Agrawal, S.; Gołębiowska, J.; Makuch, S.; Mazur, G. Prevalence of Use of Preventive Services in Poland: Result from a Population-Based Nationwide Study. J. Clin. Med. 2021, 10, 2084. https://doi.org/10.3390/jcm10102084
Agrawal S, Gołębiowska J, Makuch S, Mazur G. Prevalence of Use of Preventive Services in Poland: Result from a Population-Based Nationwide Study. Journal of Clinical Medicine. 2021; 10(10):2084. https://doi.org/10.3390/jcm10102084
Chicago/Turabian StyleAgrawal, Siddarth, Justyna Gołębiowska, Sebastian Makuch, and Grzegorz Mazur. 2021. "Prevalence of Use of Preventive Services in Poland: Result from a Population-Based Nationwide Study" Journal of Clinical Medicine 10, no. 10: 2084. https://doi.org/10.3390/jcm10102084
APA StyleAgrawal, S., Gołębiowska, J., Makuch, S., & Mazur, G. (2021). Prevalence of Use of Preventive Services in Poland: Result from a Population-Based Nationwide Study. Journal of Clinical Medicine, 10(10), 2084. https://doi.org/10.3390/jcm10102084