Rates and Patterns of First-Time Admissions for Acute Coronary Syndromes across Western Australia Using Linked Administrative Health Data 2007–2015


Abstract
1. Introduction
2. Methods
2.1. Data Sources
2.2. Population and Ascertainment of ACS Events
2.3. Patient Characteristics
2.4. Statistical Analysis
3. Results
4. Discussion
5. Conclusions
Author Contributions
Funding
Institutional Review Board Statement
Informed Consent Statement
Data Availability Statement
Conflicts of Interest
Appendix A
| International Classification of Diseases, Australian Modification 10th Edition | |
| Acute MI 1 | I21, I22 |
| Unstable Angina | I20.0 |
| Australian Classification of Health Interventions, 10th Edition | |
| CABG 2 | 38497-00, 38497-01, 38497-02, 38497-03, 38497-04, 38497-05, 38497-06, 38497-07, 38500-00, 38503-00, 38500-01, 38503-01, 38500-02, 38503-03, 38500-04, 38503-04, 38500-05, 38503-05, 90201-00, 90201-01, 90201-02, 90201-03 |
| PCI 3 without stenting | 38300-00, 38303-00, 38300-01, 38303-01 |
| PCI 3 with stenting | 38306-00, 38306-01, 38306-02, 38306-03, 38306-04, 38306-05 |
| Cardiac Catheterisation | 38200-00, 38203-00, 38206-00 |
| Cardiac Angiography | 38215-00, 38218-00, 38218-01, 38218-02 |
| Other Coronary Procedures | 38241-00, 38309-00, 38312-00, 38312-01, 38315-00, 38318-00 38318-01, 90218-00, 90218-01, 90218-02, 90218-03, 38505-00 38637-00, 38456-19, 38653-08 |
| 1 myocardial infarction; 2 coronary artery bypass graft; 3 percutaneous coronary intervention. | |
Appendix B
| Comorbid Conditions | ICD-10-AM Codes |
| Any Infectious or Parasitic Disease | A00.X-B99.X Z86.1 |
| Any Neoplasms | C00.X-D29.0; D29.2-D48. Z85.X, Z86.0, Z51.0, Z51.1, Z51.2 |
| Any Endocrine, Metabolic or Immune Disease | E00.X-E90.X, Z86.3 |
| Any Blood Disease | D50.X-D99.X, R23.3, Z86.2 |
| Any Mental Disorder | F00.X-F99.X, R44.X, R15.X, R32.X, Z86.5 |
| Any Disease of the Nervous System or Sense Organs | B91, B94.X, E14.3X, E14.4X, G00.X-G80.X, G83.X-G99.X, H00.X-H95.X, R56.X, T85.0, T85.1, Z86.12, Z86.6, Z94.7, Z96.1, Z97.0, Z97.4, Z46.1 |
| Any Diseases of the Circulatory System | I39.8, G81.X, I00.X-I84.9, I86.X-I99.X, K55.1, K55.9, Q22.X-Q23.X, R60.X, R47.X, R02, R45.7, R57.X, T82.X, T85.0, T85.1, G97.8, G97.9, Z86.7, Z94.1, Z94.3, Z95.X, Z45.0. |
| Any Diseases of the Respiratory System | J00.X-J99.X, Z87.0, Z94.2, Z94.3. |
| Any Diseases of the Digestive System | K00.X-K55.0, K55.2-K55.8, K56.0-K93.X, R17.X, R13, Z87.1X, Z94.4. |
| Any Diseases of the Genitourinary System | D29.1, E11.2X, I12.0, I13.1, I13.2, I13.9, I15.0, I15.1, N00.X-N99.X, R33, T83.X, Z87.4, Z94.0, Z96.0, Z99.2, Z46.6, Z49.X. |
| All Pregnancy, Childbirth and the Puerperium | O00.X-O99.X, Z87.5, Z32.X, Z33.X, Z34.X, Z35.X |
| Any Diseases of Skin or Subcutaneous Tissue | L00.X-L99.X, R21, Z87.2. |
| Any Diseases of the Musculoskeletal System and Connective Tissue | M00.X-M99.X, T84.X, Z87.3, Z96.XX. |
| Congenital Anomalies | Q00.X-Q99.X, Z87.7, |
| Any Symptoms, Signs and Ill-Defined Conditions | E03.5, G43.X, G44.X, G47.X, G93.3, L57.9, L85.8, L85.9, O28.X, R00.X, R01.X, R03.X-R07.X, R09.X-R12.X, R14, R16.X, R18.X-R20.X, R22.X-R23.X, R25.X-R27.X, R29.X-R30.X, R34-R36, R39.X, R40.X-R43.X, R45.X, R48.X-R55.X, R59.X, R61.X-R63.X, R68.X, R70.X-R99.X, Z87.8. |
| Any Injury or Poisoning | S00.X-T98.X, Z91.6, Z91.5. |
| Any Factor Influencing Health Status and Contact with Health Services | Z00.X-Z01.X, Z03.X-Z13.X, Z20.X-Z29.X, Z39.X, Z40.X-Z76.X, Z80.X-Z99.X |
Appendix C
| 2007 | 2008 | 2009 | 2010 | 2011 | 2012 | 2013 | 2014 | 2015 | |||
| Person–Years | * n (†Popn) (‡Rate) | * n (†Popn) (‡Rate) | * n (†Popn) (‡Rate) | * n (†Popn) (‡Rate) | * n (†Popn) (‡Rate) | * n (†Popn) (‡Rate) | * n (†Popn) (‡Rate) | * n (†Popn) (‡Rate) | * n (†Popn) (‡Rate) | ||
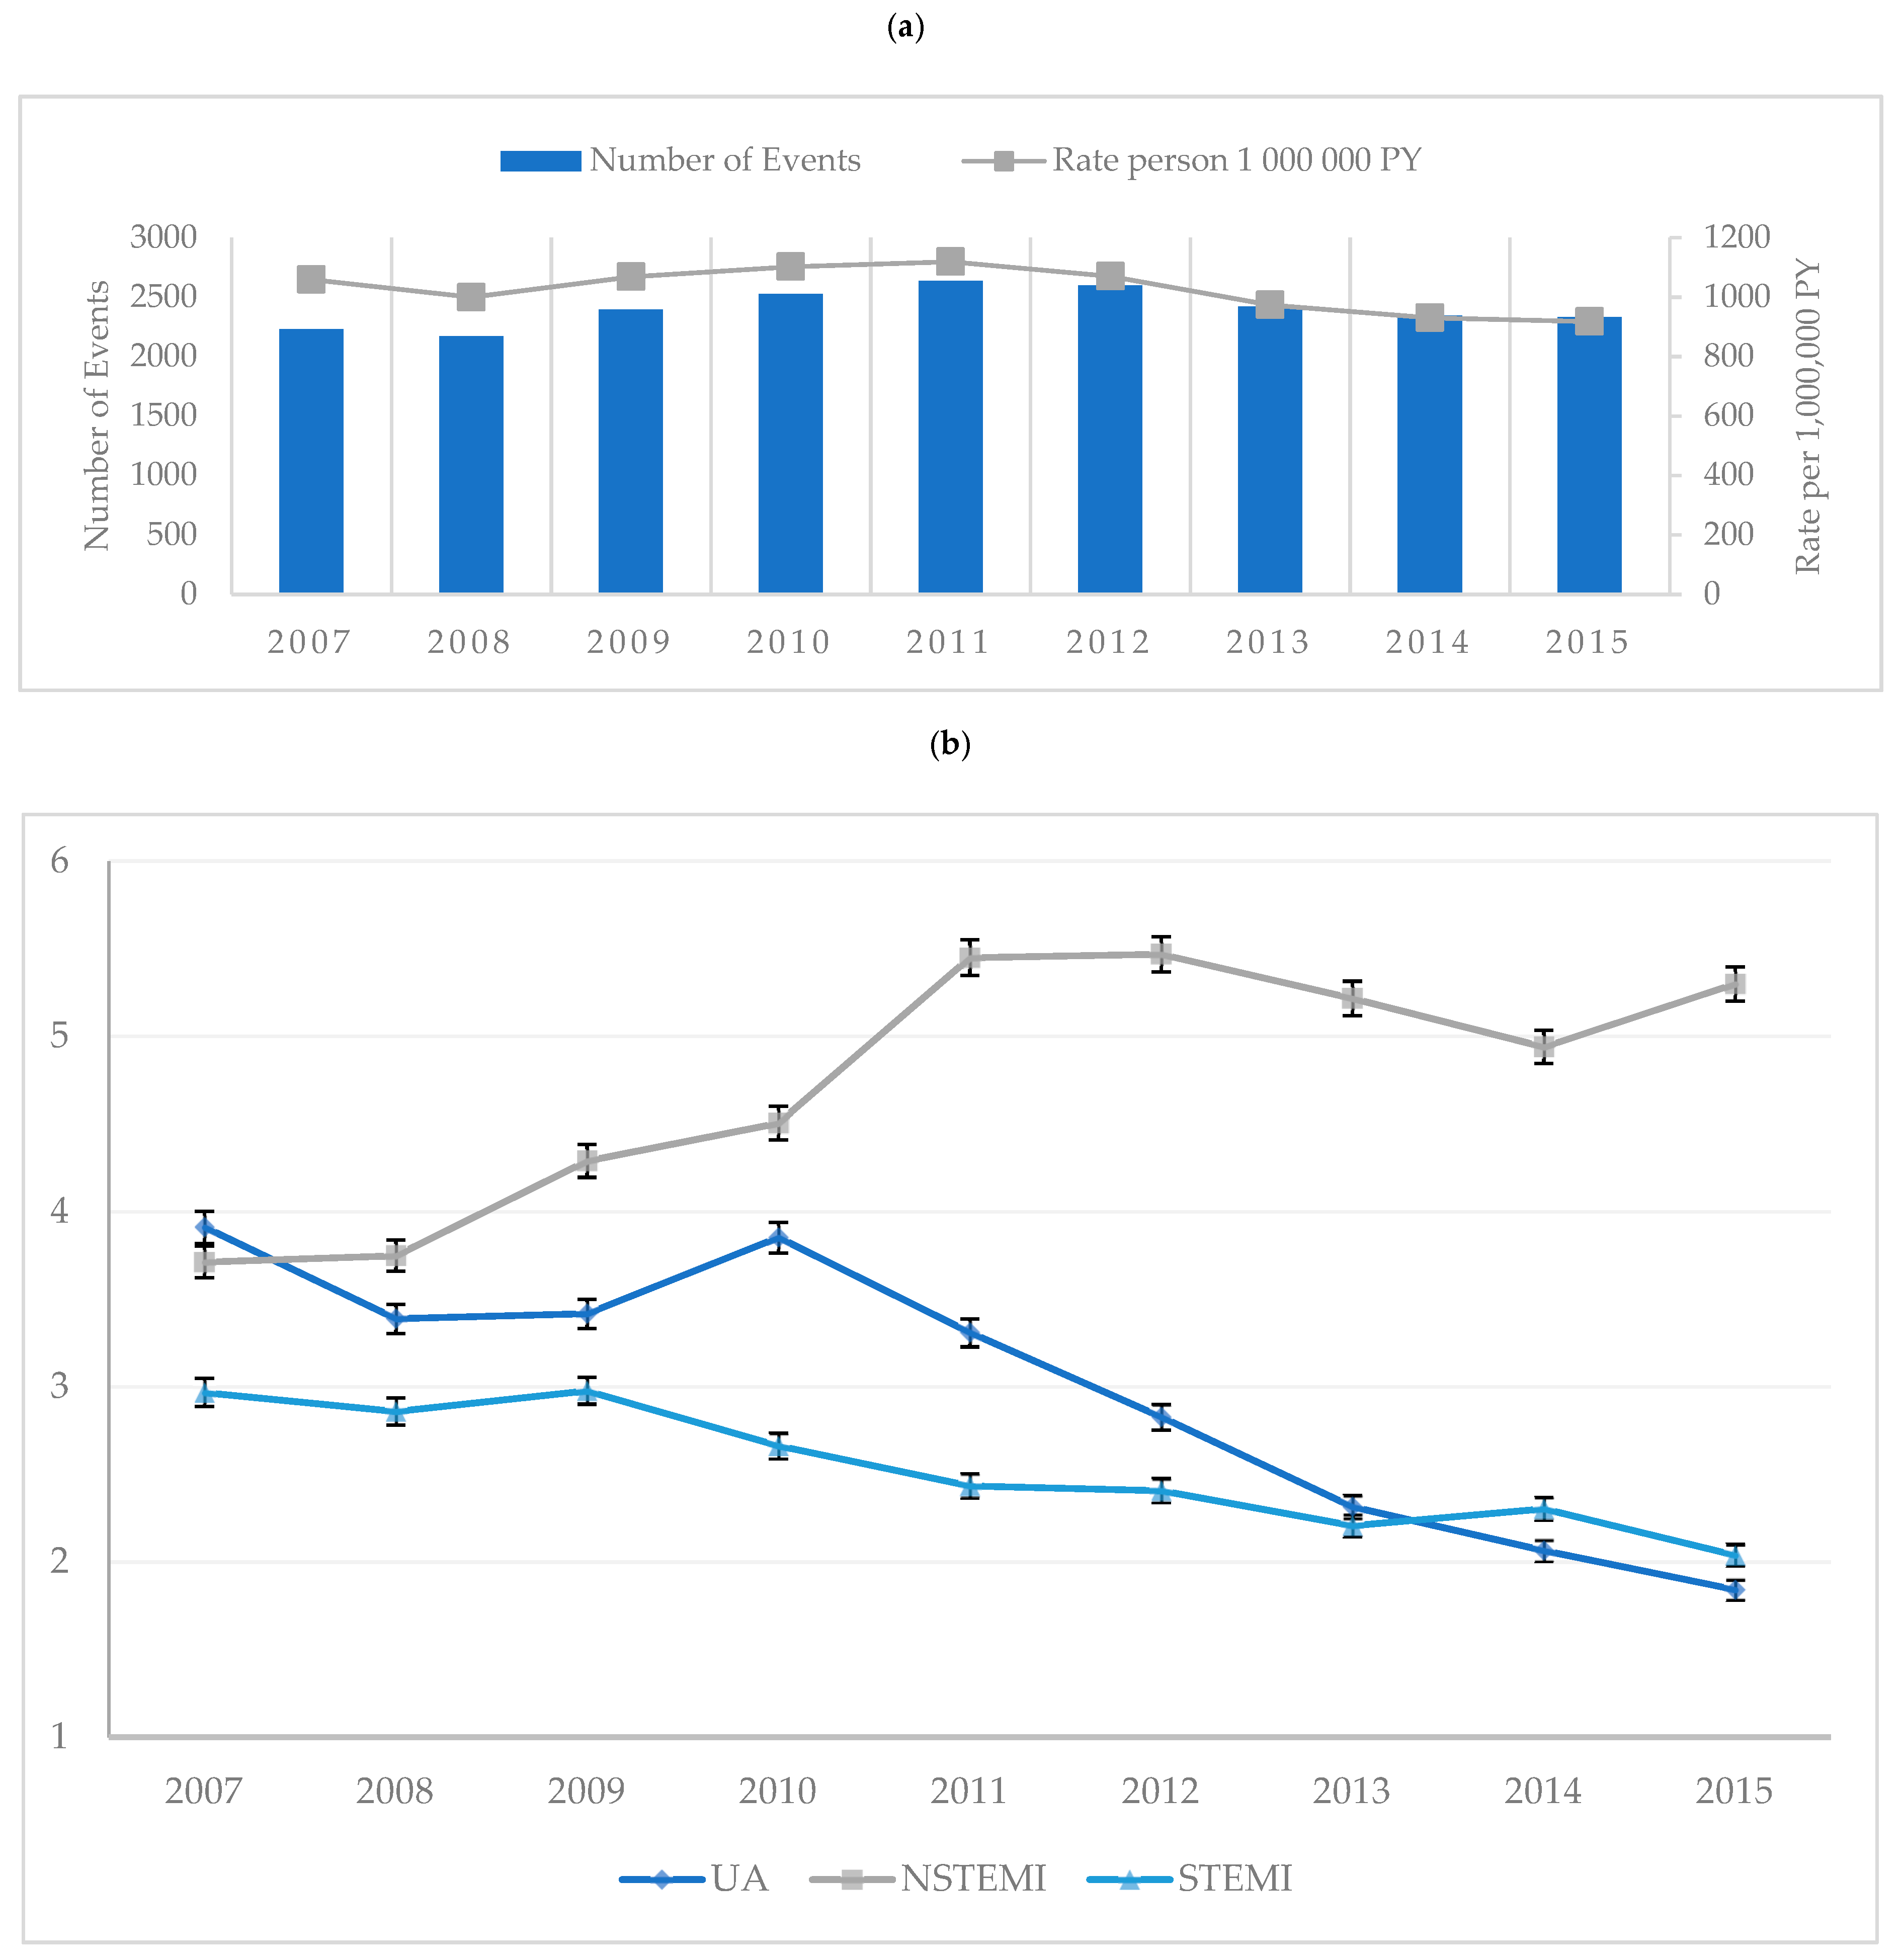
| All First-Time Admissions for ACS | 10,000 PY | 2231 (2,106,139) (10.59) | 2171 (2,171,700) (10.00) | 2394 (2,240,250) (10.69) | 2525 (2,290,845) (11.02) | 2634 (2,353,409) (11.19) | 2596 (2,425,507) (10.70) | 2422 (2,486,944) (9.74) | 2343 (2,517,608) (9.31) | 2332 (2,540,672) (9.18) | |
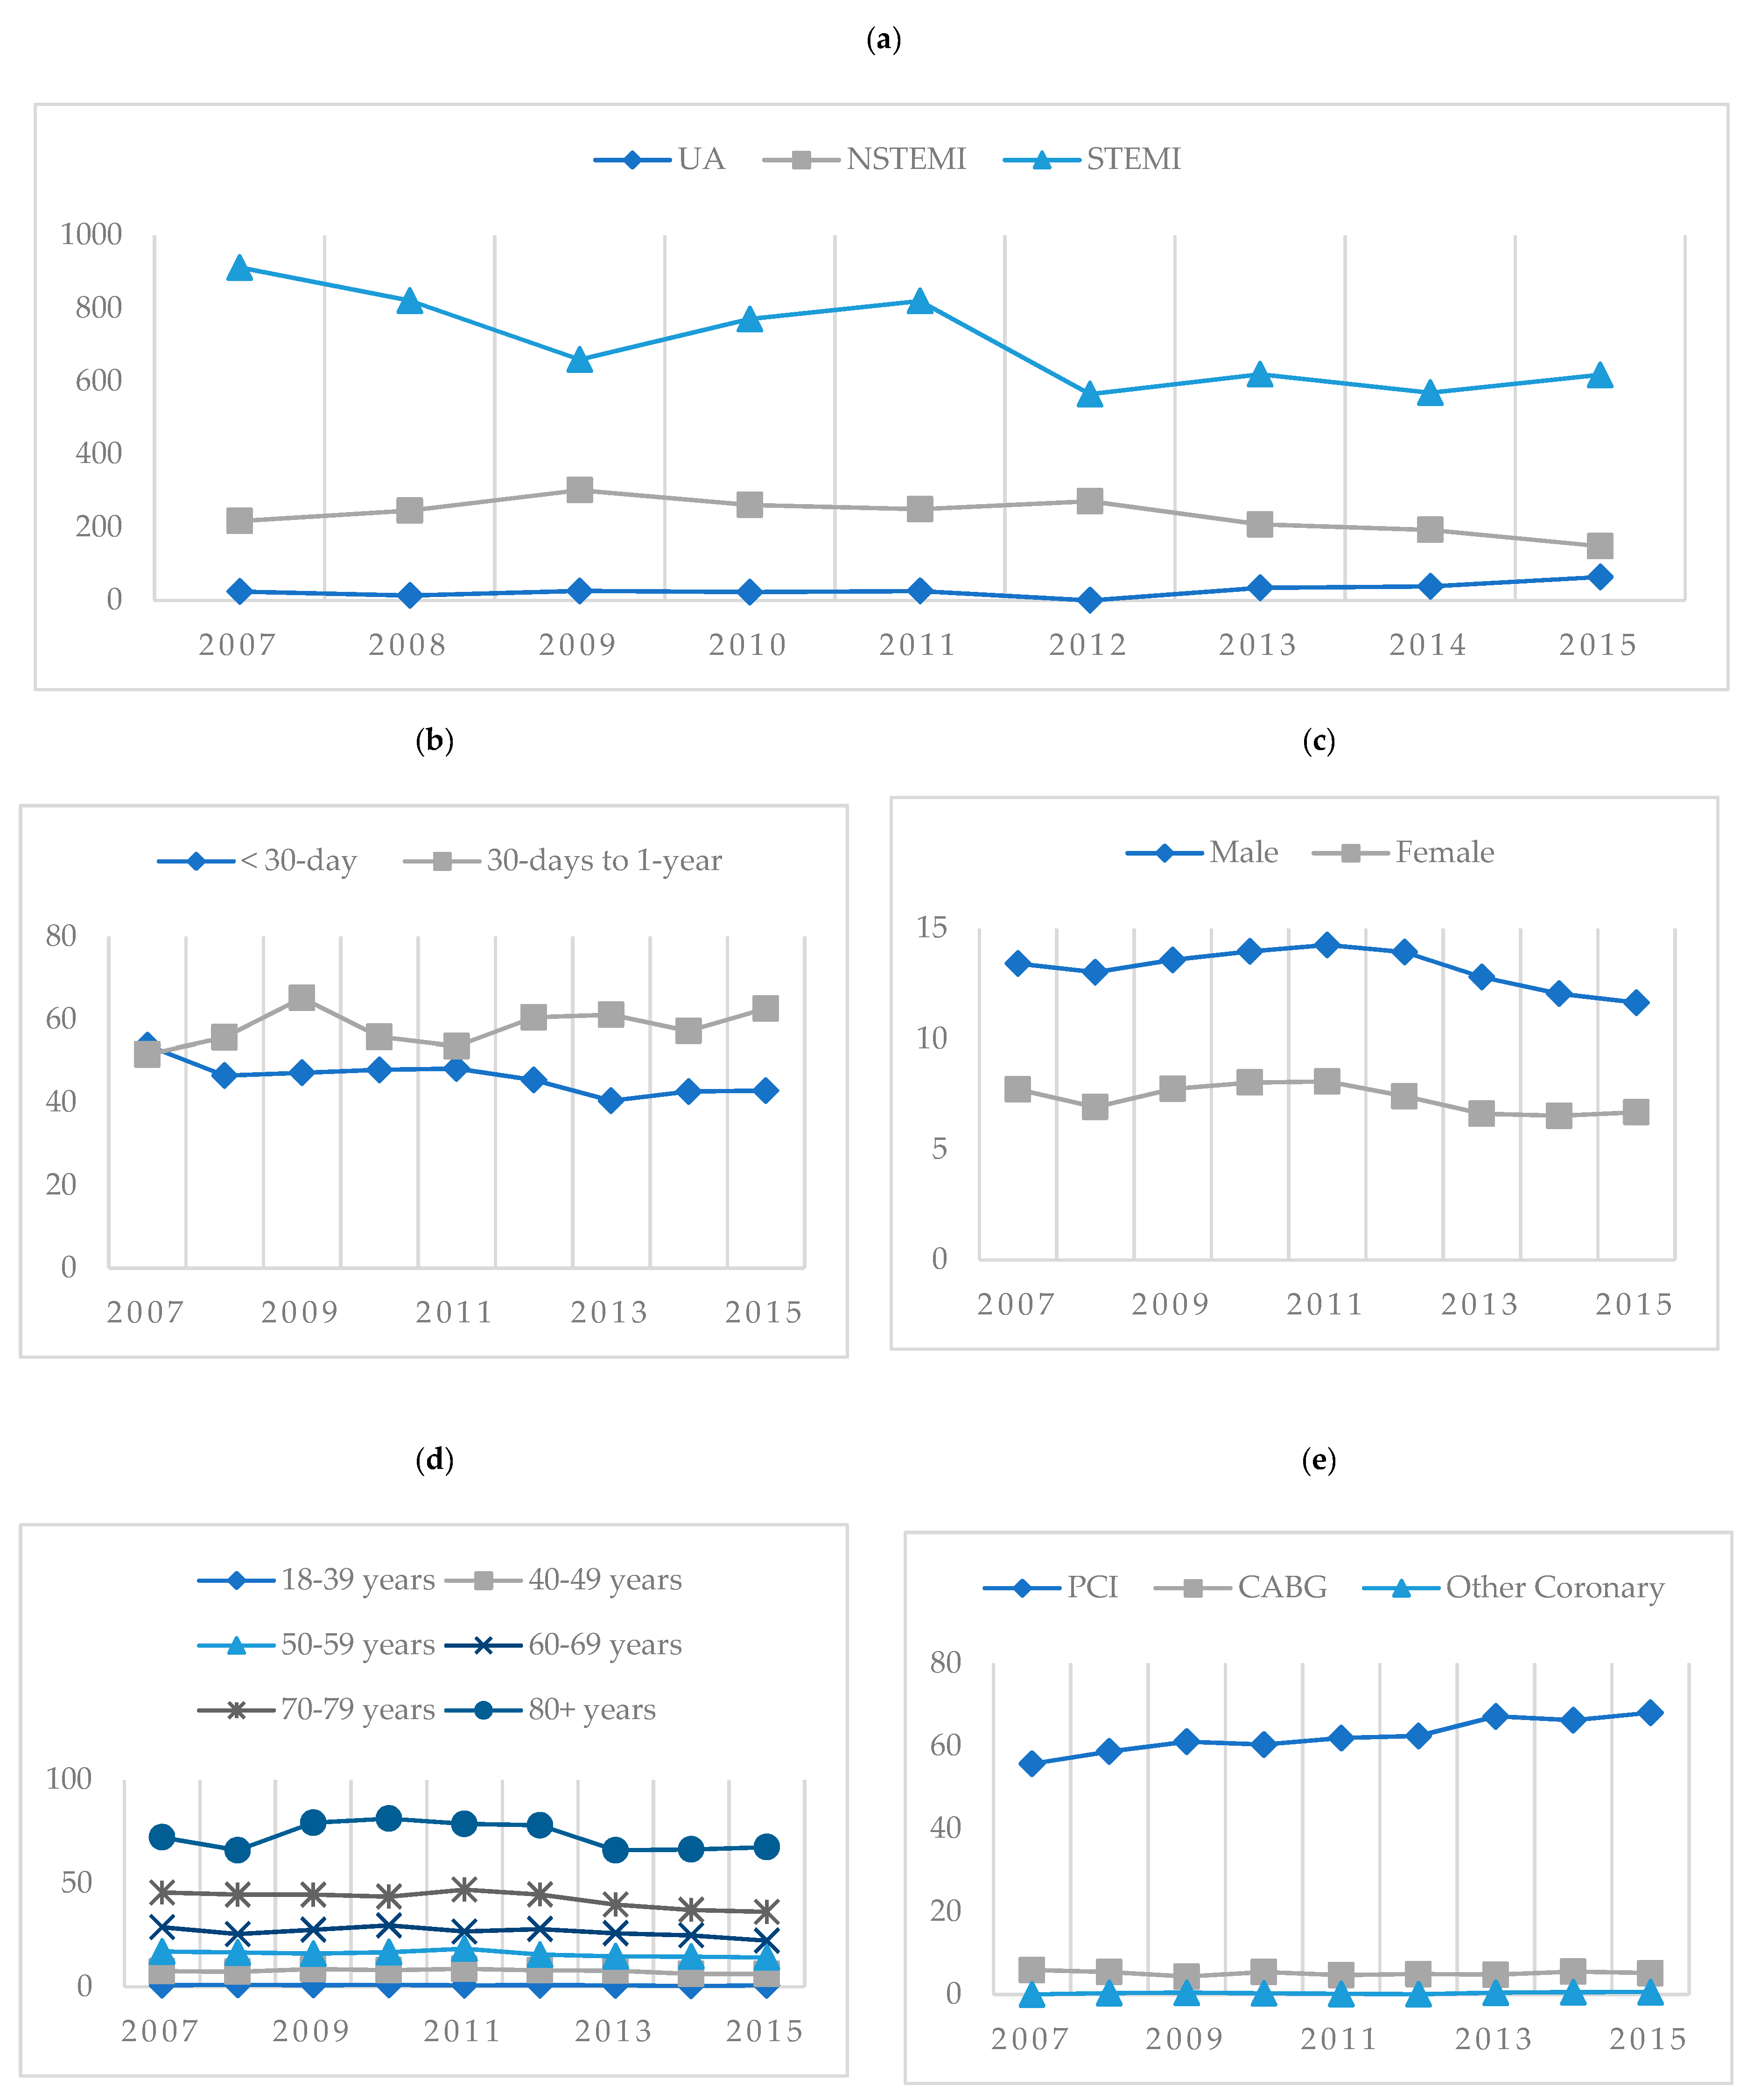
| Sex | Male | 10,000 PY | 1424 (1,061,703) (13.41) | 1425 (1,094,894) (13.01) | 1533 (1,129,438) (13.57) | 1611 (1,154,064) (13.96) | 1689 (1,185,050) (14.25) | 1704 (1,223,614) (13.93) | 1605 (1,254,322) (12.80) | 1526 (1,266,894) (12.05) | 1486 (1,276,698) (11.64) |
| Female | 10,000 PY | 807 (1,044,436) (7.73) | 746 (1,076,806) (6.93) | 861 (1,110,812) (7.75) | 914 (1,136,781) (8.04) | 945 (1,168,359) (8.09) | 892 (1,201,893) (7.42) | 817 (1,232,622) (6.63) | 817 (1,250,714) (6.53) | 846 (1,263,974) (6.69) | |
| Age Categories | 18–39 years | 10,000 PY | 56 (664,579.8) (0.84) | 65 (692,108) (0.94) | 63 (721,124.2) (0.87) | 69 (737,877.8) (0.94) | 61 (759,428.8) (0.80) | 67 (788,406.8) (0.85) | 60 (812,349) (0.74) | 39 (818,460.2) (0.48) | 57 (820,681.6) (0.69) |
| 40–49 years | 10,000 PY | 238 (312,936) (7.61) | 233 (319,462) (7.29) | 280 (326,291) (8.58) | 268 (331,769) (8.08) | 297 (339,664) (8.74) | 279 (348,097) (8.02) | 275 (352,279) (7.81) | 223 (352,549) (6.33) | 222 (352,321) (6.30) | |
| 50–59 years | 10,000 PY | 463 (271,099) (17.08) | 459 (276,577) (16.60) | 454 (283,168) (16.03) | 487 (290,113) (16.79) | 550 (298,183) (18.45) | 475 (304,940) (15.58) | 459 (311,027) (14.76) | 460 (314,838) (14.61) | 450 (317,069) (14.19) | |
| 60–69 years | 10,000 PY | 518 (179,683) (28.83) | 482 (188,757) (25.54) | 545 (197,668) (27.57) | 613 (206,391) (29.70) | 577 (215,720) (26.75) | 624 (223,304) (27.94) | 600 (231,497) (25.92) | 591 (237,551) (24.88) | 545 (244,020) (22.33) | |
| 70–79 years | 10,000 PY | 494 (108,340) (45.60) | 494 (110,836) (44.57) | 508 (113,943) (44.58) | 510 (116,996) (43.59) | 567 (120,746) (46.96) | 558 (125,149) (44.59) | 514 (129,259) (39.77) | 501 (134,777) (37.17) | 506 (139,722) (36.21) | |
| 80+ years | 10,000 PY | 462 (63,991) (72.20) | 438 (66,373) (65.99) | 544 (68,650) (79.24) | 578 (71,126) (81.26) | 582 (73,962) (78.69) | 593 (75,999) (78.03) | 514 (77,914) (65.97) | 529 (79,686) (66.39) | 552 (81,786) (67.49) | |
| Residential Region | North Metro | 10,000 PY | 529 (521,904) (10.14) | 527 (538,186) (9.79) | 583 (555,044) (10.50) | 602 (566,661) (10.62) | 657 (581,869) (11.29) | 674 (598,095) (11.27) | 547 (611,518) (8.94) | 528 (618,424) (8.54) | 545 (624,063) (8.73) |
| East Metro | 10,000 PY | 331 (646,837) (5.12) | 272 (668,176) (4.07) | 338 (690,254) (4.90) | 411 (708,164) (5.80) | 387 (728,104) (5.32) | 400 (751,439) (5.32) | 354 (771,803) (4.59) | 328 (783,807) (4.18) | 349 (793,760) (4.40) | |
| South Metro | 10,000 PY | 814 (459,726) (17.71) | 830 (476,498) (17.42) | 888 (494,044) (17.97) | 913 (506,307) (18.03) | 980 (523,594) (18.72) | 918 (543,328) (16.90) | 897 (560,534) (16.00) | 904 (571,692) (15.81) | 851 (581,114) (14.64) | |
| South West | 10,000 PY | 195 (147,093) (13.26) | 175 (151,495) (11.55) | 172 (156,220) (11.01) | 175 (159,873) (10.95) | 188 (163,450) (11.50) | 200 (168,774) (11.85) | 194 (173,435) (11.19) | 195 (176,511) (11.05) | 197 (178,703) (11.02) | |
| Great Southern | 10,000 PY | 70 (55,271) (12.66) | 78 (55,748) (13.99) | 68 (56,411) (12.05) | 68 (56,711) (11.99) | 88 (57,237) (15.37) | 81 (58,444) (13.86) | 85 (59,445) (14.30) | 78 (60,060) (12.99) | 92 (60,290) (15.26) | |
| Wheatbelt | 10,000 PY | 96 (73,347) (13.09) | 94 (73,935) (12.71) | 98 (74,899) (13.08) | 91 (75,540) (12.05) | 86 (76,177) (11.29) | 88 (77,469) (11.36) | 80 (78,477) (10.19) | 73 (78,506) (9.30) | 84 (78,134) (10.75) | |
| Goldfields | 10,000 PY | 63 (55,407) (11.37) | 55 (56,576) (9.72) | 69 (57,636) (11.97) | 92 (58,470) (15.73) | 77 (59,425) (12.96) | 62 (60,481) (10.25) | 73 (61,096) (11.95) | 58 (59,878) (9.69) | 50 (58,521) (8.54) | |
| Midwest | 10,000 PY | 52 (60,885) (8.54) | 60 (62,159) (9.65) | 85 (63,361) (13.42) | 90 (63,980) (14.07) | 77 (64,985) (11.85) | 90 (66,068) (13.62) | 98 (66,929) (14.64) | 84 (66,715) (12.59) | 83 (66,000) (12.58) | |
| Pilbara | 10,000 PY | 49 (51,165) (9.58) | 41 (53,670) (7.64) | 49 (56,578) (8.66) | 44 (58,912) (7.47) | 46 (61,777) (7.45) | 33 (63,606) (5.19) | 44 (64,978) (6.77) | 39 (64,297) (6.07) | 35 (63,021) (5.55) | |
| Kimberley | 10,000 PY | 32 (34,504) (9.27) | 38 (35,257) (10.78) | 44 (35,803) (12.29) | 38 (36,227) (10.49) | 46 (36,791) (12.50) | 48 (37,803) (12.70) | 49 (38,729) (12.65) | 53 (37,718) (14.05) | 46 (37,066) (12.41) | |
| * Unplaced | 0 (-) (-) | 1 (-) (-) | 0 (-) (-) | 1 (-) (-) | 2 (-) (-) | 1 (-) (-) | 1 (-) (-) | 3 (-) (-) | 0 (-) (-) | ||
| Primary Diagnosis | UA | 10,000 PY | 824 (2,106,139) (3.91) | 736 (2,171,700) (3.39) | 766 (2,240,250) (3.42) | 883 (2,290,845) (3.85) | 779 (2,353,409) (3.31) | 686 (2,425,507) (2.83) | 576 (2,486,944) (2.32) | 520 (2,517,608) (2.07) | 468 (2,540,672) (1.84) |
| NSTEMI | 10,000 PY | 782 (2,106,139) (3.71) | 814 (2,171,700) (3.75) | 961 (2,240,250) (4.29) | 1032 (2,290,845) (4.50) | 1282 (2,353,409) (5.45) | 1326 (2,425,507) (5.47) | 1297 (2,486,944) (5.22) | 1243 (2,517,608) (4.94) | 1346 (2,540,672) (5.30) | |
| STEMI | 10,000 PY | 625 (2,106,139) (2.97) | 621 (2,171,700) (2.86) | 667 (2,240,250) (2.98) | 610 (2,290,845) (2.66) | 573 (2,353,409) (2.43) | 584 (2,425,507) (2.41) | 549 (2,486,944) (2.21) | 580 (2,517,608) (2.30) | 518 (2,540,672) (2.04) | |
| In Hospital Mortality | UA | 10,000 PY | 2 (824) (24.27) | 1 (736) (13.59) | 2 (766) (26.11) | 2 (883) (22.65) | 2 (779) (25.67) | 0 (686) (0.00) | 2 (576) (34.72) | 2 (520) (38.46) | 3 (468) (64.10) |
| NSTEMI | 10,000 PY | 17 (782) (217.39) | 20 (814) (245.70) | 29 (961) (301.77) | 27 (1032) (261.63) | 32 (1282) (249.61) | 36 (1326) (271.49) | 27 (1297) (208.17) | 24 (1243) (193.08) | 20 (1346) (148.59) | |
| STEMI | 10,000 PY | 57 (625) (912.00) | 51 (621) (821.26) | 44 (667) (659.67) | 47 (610) (770.49) | 47 (573) (820.24) | 33 (584) (565.07) | 34 (549) (619.31) | 33 (580) (568.97) | 32 (518) (617.76) | |
| Mortality | 30-day | 1000 PY | 120 (2231) (53.79) | 101 (2171) (46.52) | 113 (2394) (47.20) | 121 (2525) (47.92) | 127 (2634) (48.22) | 118 (2596) (45.45) | 98 (2422) (40.46) | 100 (2343) (42.68) | 100 (2332) (42.88) |
| 30-days to 1-year | 1000 PY | 115 (2231) (51.55) | 121 (2171) (55.73) | 156 (2394) (65.16) | 141 (2525) (55.84) | 141 (2634) (53.53) | 157 (2596) (60.48) | 148 (2422) (61.11) | 134 (2343) (57.19) | 146 (2332) (62.61) | |
| More than 1-year | 1000 PY | 555 (2231) (248.77) | 489 (2171) (225.24) | 481 (2394) (200.92) | 442 (2525) (175.05) | 368 (2634) (139.71) | 316 (2596) (121.73) | 208 (2422) (85.88) | 130 (2343) (55.48) | 32 (2332) (13.72) | |
| Primary Treatment | PCI ± Stent | 100 PY | 1244 (2231) (55.76) | 1275 (2171) (58.73) | 1463 (2394) (61.11) | 1525 (2525) (60.40) | 1632 (2634) (61.96) | 1622 (2596) (62.48) | 1628 (2422) (67.22) | 1553 (2343) (66.28) | 1588 (2332) (68.10) |
| CABG | 100 PY | 132 (2231) (5.92) | 118 (2171) (5.44) | 104 (2394) (4.34) | 137 (2525) (5.43) | 124 (2634) (4.71) | 129 (2596) (4.97) | 116 (2422) (4.79) | 130 (2343) (5.55) | 121 (2332) (5.19) | |
| Other Coronary | 100 PY | 1 (2231) (0.04) | 8 (2171) (0.37) | 11 (2394) (0.46) | 8 (2525) (0.32) | 4 (2634) (0.15) | 2 (2596) (0.08) | 11 (2422) (0.45) | 14 (2343) (0.60) | 14 (2332) (0.60) | |
| Transfer Status | Direct Admission | 100 PY | 1266 (2231) (56.75) | 1167 (2171) (53.75) | 1313 (2394) (54.85) | 1359 (2525) (53.82) | 1286 (2634) (48.82) | 1186 (2596) (45.69) | 1147 (2422) (47.36) | 1228 (2343) (52.41) | 1247 (2332) (53.47) |
| Interhospital Transfer | 100 PY | 965 (2231) (43.25) | 1004 (2171) (46.25) | 1081 (2394) (45.15) | 1166 (2525) (46.18) | 1348 (2634) (51.18) | 1410 (2596) (54.31) | 1275 (2422) (52.64) | 1115 (2343) (47.59) | 1085 (2332) (46.53) | |
| Admission Status | Emergency Admission | 100 PY | 1944 (2231) (87.14) | 1901 (2171) (87.56) | 2148 (2394) (89.72) | 2239 (2525) (88.67) | 2448 (2634) (92.94) | 2402 (2596) (92.53) | 2244 (2422) (92.65) | 2130 (2343) (90.91) | 2063 (2332) (88.46) |
| Elective Admission | 100 PY | 287 (2231) (12.86) | 270 (2171) (12.44) | 246 (2394) (10.28) | 286 (2525) (11.33) | 186 (2634) (7.06) | 194 (2596) (7.47) | 178 (2422) (7.35) | 213 (2343) (9.09) | 269 (2332) (11.54) | |
| MACSS 1 Year | 0 MACSS | 100 PY | 33 (2231) (1.48) | 29 (2171) (1.34) | 45 (2394) (1.88) | 47 (2525) (1.86) | 61 (2634) (2.32) | 30 (2596) (1.16) | 26 (2422) (1.07) | 20 (2343) (0.85) | 19 (2332) (0.81) |
| 1 MACSS | 100 PY | 140 (2231) (6.28) | 197 (2171) (9.07) | 216 (2394) (9.02) | 248 (2525) (9.82) | 274 (2634) (10.40) | 224 (2596) (8.63) | 165 (2422) (6.81) | 157 (2343) (6.70) | 146 (2332) (6.26) | |
| 2 MACSS | 100 PY | 269 (2231) (12.06) | 327 (2171) (15.06) | 320 (2394) (13.37) | 347 (2525) (13.74) | 389 (2634) (14.77) | 352 (2596) (13.56) | 280 (2422) (11.56) | 263 (2343) (11.22) | 255 (2332) (10.93) | |
| 3+ MACSS | 100 PY | 1789 (2231) (80.19) | 1618 (2171) (74.53) | 1813 (2394) (75.73) | 1883 (2525) (74.57) | 1910 (2634) (72.51) | 1990 (2596) (76.66) | 1951 (2422) (80.55) | 1903 (2343) (81.22) | 1912 (2332) (81.99) | |
| MACSS 5 Year | 0 MACSS | 100 PY | 14 (2231) (0.63) | 9 (2171) (0.41) | 21 (2394) (0.88) | 21 (2525) (0.83) | 25 (2634) (0.95) | 11 (2596) (0.42) | 11 (2422) (0.45) | 6 (2343) (0.26) | 8 (2332) (0.34) |
| 1 MACSS | 100 PY | 70 (2231) (3.14) | 86 (2171) (3.96) | 115 (2394) (4.80) | 108 (2525) (4.28) | 128 (2634) (4.86) | 100 (2596) (3.85) | 87 (2422) (3.59) | 72 (2343) (3.07) | 66 (2332) (2.83) | |
| 2 MACSS | 100 PY | 141 (2231) (6.32) | 177 (2171) (8.15) | 172 (2394) (7.18) | 196 (2525) (7.76) | 212 (2634) (8.05) | 188 (2596) (7.24) | 146 (2422) (6.03) | 154 (2343) (6.57) | 143 (2332) (6.13) | |
| 3+ MACSS | 100 PY | 2006 (2231) (89.91) | 1899 (2171) (87.47) | 2086 (2394) (87.13) | 2200 (2525) (87.13) | 2269 (2634) (86.14) | 2297 (2596) (88.48) | 2178 (2422) (89.93) | 2111 (2343) (90.10) | 2115 (2332) (90.69) | |
| * n: number of patients; †Popn: population for that year and demographic factor; ‡Rate: rate per X person–years, as per the person–years column UA: unstable angina; NSTEMI: non-ST-segment elevation AMI; STEMI: ST-segment elevation AMI; AMI: acute myocardial infarction; PCI +/− Stent: percutaneous coronary intervention, with or without stent insertion.; CABG: coronary artery bypass graft; MACSS: multipurpose Australian comorbidity scoring system. | |||||||||||
References
- World Health Organization. Cardiovascular Disease (CVD). Available online: https://www.who.int/news-room/fact-sheets/detail/cardiovascular-diseases-(cvds) (accessed on 30 July 2020).
- Australian Institute of Health and Welfare. Cardiovascular Disease. Available online: https://www.aihw.gov.au/reports/heart-stroke-vascular-diseases/cardiovascular-health-compendium/contents/how-many-australians-have-cardiovascular-disease (accessed on 30 July 2020).
- Australian Bureau of Statistics. 3101.0-Australian Demographic Statistics, June 2017. Available online: https://www.abs.gov.au/ausstats/abs@.nsf/lookup/3101.0main+features1jun%202017 (accessed on 8 November 2020).
- Aliprandi-Costa, B.; Ranasinghe, I.; Turnbull, F.; Brown, A.; Kritharides, L.; Patel, A.; Chew, D.; Walters, D.; Rankin, J.; Ilton, M.; et al. The Design and Rationale of the Australian Cooperative National Registry of Acute Coronary care, Guideline Adherence and Clinical Events (CONCORDANCE). Heart Lung Circ. 2013, 22, 533–541. [Google Scholar] [CrossRef] [PubMed]
- Chew, D.P.; French, J.; Briffa, T.G.; Hammett, C.J.; Ellis, C.J.; Ranasinghe, I.; Aliprandi-Costa, B.J.; Astley, C.M.; Turnbull, F.M.; Lefkovits, J.; et al. Acute coronary syndrome care across Australia and New Zealand: The Snapshot ACS study. Med. J. Aust. 2013, 199, 185–191. [Google Scholar] [CrossRef] [PubMed]
- Kerr, A.J.; Williams, M.J.A.; Harding, S.; White, H.; Doughty, R.N.; Nunn, C.; Devlin, G.; Grey, C.; Lee, M.; Flynn, C.; et al. The All New Zealand Acute Coronary Syndrome Quality Improvement Programme: Implementation, Methodology and Cohorts (ANZACS-QI 9). New Zealand Med. J. 2016, 129, 23–36. [Google Scholar] [PubMed]
- American College of Cardiology Foundation. National Cardiovascular Data Registry: About the NCDR. Available online: https://www.ncdr.com/WebNCDR/home/aboutthencdr (accessed on 5 November 2020).
- Lefkovits, J.; Brennan, A.; Dinh, D.; Stub, D.; Carruthers, H.; Doyle, J.; Lucas, M.; Reid, C.; on behalf of the VCOR. The Victorian Cardiac Outcomes Registry Annual Report; Report No 6; Monash University, SPHPM: Melbourne, Australia, 2018. [Google Scholar]
- Chew, D.P.; MacIsaac, A.I.; Lefkovits, J.; Harper, R.W.; Slawomirski, L.; Braddock, D.; Horsfall, M.J.; Buchan, H.A.; Ellis, C.J.; Brieger, D.B.; et al. Variation in coronary angiography rates in Australia: Correlations with socio-demographic, health service and disease burden indices. Med. J. Aust. 2016, 205, 114–120. [Google Scholar] [CrossRef] [PubMed]
- Data Linkage Western Australia. Available online: https://www.datalinkage-wa.org.au/dlb-services/linkage/ (accessed on 28 July 2020).
- Chew, D.P.; Scott, I.A.; Cullen, L.; French, J.K.; Briffa, T.K.; Tideman, P.A.; Woodruffe, S.; Kerr, A.; Branagan, M.; Aylward, P.E. National Heart Foundation of Australia & Cardiac Society of Australia and New Zealand: Australian Clinical Guidelines for the Management of Acute Coronary Syndromes 2016. Heart. Lung. Circ. 2016, 25, 895–951. [Google Scholar]
- Brieger, D.; Kelly, A.M.; Aroney, C.; Tideman, P.; Freedman, S.B.; Chew, D.; Ilton, M.; Carroll, G.; Jacobs, I.; Huang, N.P. Acute coronary syndromes: Consensus recommendations for translating knowledge into action. Med. J. Aust. 2009, 191, 334–338. [Google Scholar] [CrossRef]
- O’Connor, R.E.; Brady, W.; Brooks, S.C.; Diercks, D.; Egan, J.; Ghaemmaghami, C.; Menon, V.; O’Neil, B.J.; Travers, A.H.; Yannopoulos, D. Part 10: Acute Coronary Syndromes: 2010 American Heart Association Guidelines for Cardiopulmonary Resuscitation and Emergency Cardiovascular Care. Circulation 2010, 122 (Suppl. 3), S787–S817. [Google Scholar]
- Nikolaou, N.I.; Arntz, H.R.; Bellou, A.; Beygui, F.; Bossaert, L.L.; Cariou, A. European Resuscitation Council Guidelines for Resuscitation 2015 Section 8. Initial management of acute coronary syndromes. Resuscitation 2015, 95, 264–277. [Google Scholar] [CrossRef]
- Australian Bureau of Statistics. 3218.0-Regional Population Growth, Australia, 2016–2017. Available online: https://www.abs.gov.au/ (accessed on 23 August 2020).
- Department of Health Western Australia. The Model of Care for Acute Coronary Syndromes in Western Australia; Department of Health Western Australia: Perth, Australia, 2009.
- Clemmensen, P.; Schoos, M.M.; Lindholm, M.G.; Rasmussen, L.S.; Steinmetz, J.; Hesselfeldt, R.; Pedersen, F.; Jørgensen, E.; Holmvang, L.; Sejersten, M. Pre-hospital diagnosis and transfer of patients with acute myocardial infarction—A decade long experience from one of Europe’s largest STEMI networks. J. Electrocardiol. 2013, 46, 546–552. [Google Scholar] [CrossRef]
- Forsyth, R.; Sun, Z.-H.; Reid, C.; Moorin, R. Inter-hospital transfers and door-to-balloon times for STEMI: A single centre cohort study. J. Geriatr. Cardiol. 2020, 17, 321–329. [Google Scholar]
- Australian Bureau of Statistics. Australian Bureau of Statistics Estimated Resident Population (ERP) by SA2 (Australian Statistical Geography Standard ASGS 2016), Age and Sex, 2001 Onwards. 2018. Available online: http://stat.data.abs.gov.au/# (accessed on 27 July 2020).
- Benchimol, E.I.; Smeeth, L.; Guttmann, A.; Harron, K.; Moher, D.; Petersen, I.; Sørensen, H.T.; von Elm, E.; Langan, S.M. The REporting of studies Conducted using Observational Routinely-collected health Data (RECORD) statement. PLoS Med. 2015, 12, e1001885. [Google Scholar] [CrossRef] [PubMed]
- Socio-Economic Indexes for Areas SEIFA 2011. Available online: https://www.abs.gov.au/websitedbs/censushome.nsf/home/seifa2011?opendocument&navpos=260 (accessed on 23 May 2020).
- Australian Institute of Health and Welfare. Australian Hospital Statistics 2010–2011; Australian Institute of Health and Welfare: Canberra, Australia, 2012.
- Australian Institute of Health and Welfare. Admitted Patient Care 2015–2016: Australian Hospital Statistics; Australian Institute of Health and Welfare: Canberra, Australia, 2017.
- National Centre for Classification in Health. The International Statistical Classification of Diseases and Related Health Problems, Tenth Revision, Australian Modification (ICD-10-AM), 7th ed.; National Centre for Classification in Health: Lidcombe, Australia, 2010.
- Holman, C.D.; Preen, D.B.; Baynham, N.J.; Finn, J.C.; Semmens, J.B. A multipurpose comorbidity scoring system performed better than the Charlson index. J. Clin. Epidemiol. 2005, 58, 1006–1014. [Google Scholar] [CrossRef] [PubMed]
- Sanfilippo, F.M.; Hobbs, M.S.; Knuiman, M.W.; Ridout, S.C.; Bradshaw, P.J.; Finn, J.C.; Rankin, J.M.; Sprivulis, P.C.; Hung, J. Can we monitor heart attack in the troponin era? Evidence from a population-based cohort study. BMC Cardiovasc. Disord. 2011, 11, 35. [Google Scholar] [CrossRef] [PubMed]
- Lopez, D.; Nedkoff, L.; Knuiman, M.; Hobbs, M.S.T.; Briffa, T.G.; Preen, D.B.; Hung, J.; Beilby, J.; Mathur, S.; Reynolds, A.; et al. Exploring the effects of transfers and readmissions on trends in population counts of hospital admissions for coronary heart disease: A Western Australian data linkage study. BMJ Open 2017, 7, e019226. [Google Scholar] [CrossRef]
- National Centre for Classification in Health. The Australian Classification of Health Interventions, Tenth Revision, (ACHI), 7th ed.; National Centre for Classification in Health: Lidcombe, Australia, 2010.
- C.I. Calculator: Single Incidence Rate. Available online: https://www2.ccrb.cuhk.edu.hk/stat/confidence%20interval/CI%20for%20single%20rate.htm (accessed on 23 November 2020).
- IBM Corp. IBM SPSS Statistics for Windows, Version 25.0; IBM Corp.: Armonk, NY, USA, 2017. [Google Scholar]
- StataCorp. Stata Statistical Software: Release 16; StataCorp LLC: College Station, TX, USA, 2019. [Google Scholar]
- Solarsh, G.; Humphreys, J. Populations at Special Health Risk: Rural Populations. Int. Encycl. Public Health 2016, 5, 242–253. [Google Scholar]
- Carroll, G.E.; Thompson, P.L. Cardiology networks: Improving the management of acute coronary syndromes. Med. J. Aust. 2014, 200, 131–132. [Google Scholar] [CrossRef]
- Kawecki, D.; Gierlotka, M.; Morawiec, B.; Hawranek, M.; Tajstra, M.; Skrzypek, M.; Wojakowski, W.; Polonski, L.; Nowalany-Kozielska, E.; Gasior, M. Direct Admission Versus Interhospital Transfer for Primary Percutaneous Coronary Intervention in ST-Segment Elevation Myocardial Infarction. JACC Cardiovasc. Interv. 2017, 10, 438–447. [Google Scholar] [CrossRef]
- Fiorilli, P.N.; Kolansky, D.M. Getting to the Right Place at the Right Time: Another Piece of the STEMI Puzzle. Circ. Cardiovasc. Interv. 2018, 11, e006700. [Google Scholar] [CrossRef]
- Brieger, D.B.; Chew, D.P.; Redfern, J.; Ellis, C.; Briffa, T.G.; Howell, T.E.; Aliprandi-Costa, B.; Astley, C.M.; Gamble, G.; Carr, B.; et al. Survival after an acute coronary syndrome: 18-month outcomes from the Australian and New Zealand Snapshot Acs study. Med. J. Aust. 2015, 203, 368. [Google Scholar] [CrossRef]
- Hoedemaker, N.P.G.; Damman, P.; Bosker, H.A.; Danse, P.W.; Liem, A.H.; Geerdes, B.; van Laarhoven, H.; de Winter, R.J. Treatment patterns of non-ST-elevation acute coronary syndrome patients presenting at non-PCI centres in the Netherlands and possible logistical consequences of adopting same-day transfer to PCI centres: A registry-based evaluation. Neth. Heart J. 2019, 27, 191–199. [Google Scholar] [CrossRef]
- Hoedemaker, N.P.G.; Damman, P.; Woudstra, P.; Hirsch, A.; Windhausen, F.; Tijssen, J.G.P.; de Winter, R.J.; Peters, R.J.G.; Dunselman, P.H.J.M.; Verheugt, F.W.A.; et al. Early Invasive Versus Selective Strategy for Non-ST-Segment Elevation Acute Coronary Syndrome: The ICTUS Trial. J. Am. Coll. Cardiol. 2017, 69, 1883–1893. [Google Scholar] [CrossRef] [PubMed]
- Wöhrle, J.; Desaga, M.; Metzger, C.; Huber, K.; Suryapranata, H.; Guetta, V.; Guagliumi, G.; Witzenbichler, B.; Parise, H.; Mehran, R.; et al. Impact of Transfer for Primary Percutaneous Coronary Intervention on Survival and Clinical Outcomes (from the HORIZONS-AMI Trial). Am. J. Cardiol. 2010, 106, 1218–1224. [Google Scholar] [CrossRef] [PubMed]
- Stone, G.W. Angioplasty strategies in ST-segment elevation myocardial infarction. Circulation 2008, 118, 538–551. [Google Scholar] [CrossRef] [PubMed]
- Manari, A.; Ortolani, P.; Guastaroba, P.; Casella, G.; Vignali, L.; Varani, E.; Piovaccari, G.; Guiducci, V.; Percoco, G.; Tondi, S.; et al. Clinical impact of an inter-hospital transfer strategy in patients with ST-elevation myocardial infarction undergoing primary angioplasty: The Emilia-Romagna ST-segment elevation acute myocardial infarction network. Eur. Heart J. 2008, 29, 1834–1842. [Google Scholar] [CrossRef] [PubMed]
- Lévesque, L.E.; Hanley, J.A.; Kezouh, A.; Suissa, S. Problem of immortal time bias in cohort studies: Example using statins for preventing progression of diabetes. BMJ 2010, 340, b5087. [Google Scholar] [CrossRef]


| Variables | Metro | Rural | Total | Sig * |
|---|---|---|---|---|
| n (% *) | n (% *) | n (% *) | p < 0.05 | |
| 16,357 (75.6) | 5290 (24.4) | 21,647 | ||
| Demographics | ||||
| Male Age, Mean (std dev) (range) | 65.05 (13.698) (18–101) | 62.54 (14.065) (18–99) | 64.43 (13.832) (18–101) | 0.056 |
| Female Age, Mean (std dev) (range) | 72.37 (14.149) (18–103) | 65.58 (15.137) (22–101) | 70.77 (14.673) (18–103) | <0.001 |
| Male | 10,519 (64.3) | 3484 (65.9) | 14,003 (64.7) | 0.040 |
| Indigenous Australian | 310 (1.9) | 713 (13.5) | 1023 (4.7) | <0.001 |
| Socio-Economic Indexes for Areas (SEIFA) | ||||
| Highest Disadvantage | 1737 (10.6) | 1476 (27.9) | 3213 (14.8) | <0.001 |
| High Disadvantage | 3951 (24.2) | 2169 (41.0) | 6120 (28.3) | |
| Moderate Disadvantage | 2841 (17.4) | 940 (17.8) | 3781 (17.5) | |
| Less Disadvantage | 2679 (16.4) | 549 (10.4) | 3228 (14.9) | |
| Least Disadvantage | 5149 (31.5) | 156 (2.9) | 5305 (24.5) | |
| Comorbidities during the Same Admission | ||||
| Diabetes | 3043 (18.6) | 1064 (20.1) | 4107 (9.0) | 0.015 |
| Cardiac Arrest | 238 (1.5) | 65 (1.2) | 303 (1.4) | 0.223 |
| Heart Failure | 1832 (11.2) | 445 (8.4) | 2277 (10.5) | <0.001 |
| Chronic Pulmonary Disease | 112 (0.7) | 37 (0.7) | 149 (0.7) | 0.910 |
| Renal Insufficiency < 29 mL/min | 412 (2.5) | 127 (2.4) | 539 (2.5) | 0.632 |
| Obese | 344 (2.1) | 132 (2.5) | 476 (2.2) | 0.091 |
| Mode of Arrival to 1st Hospital or ED | ||||
| Ambulance/Royal Flying Doctor Service | 8133 (49.7) | 1848 (34.9) | 9981 (46.1) | <0.001 |
| Private/Public Transport | 7575 (46.3) | 3242 (61.3) | 10,817 (50.0) | |
| Other | 448 (2.7) | 79 (1.5) | 527 (2.4) | |
| Unknown | 201 (1.2) | 121 (2.3) | 322 (1.5) | |
| Region of 1st Hospital of Admission | ||||
| North Metro | 6012 (36.8) | 496 (9.4) | 6508 (30.1) | <0.001 |
| East Metro | 5248 (32.1) | 738 (14.0) | 5986 (27.7) | |
| South Metro | 4880 (29.8) | 270 (5.1) | 5150 (23.8) | |
| South West | 48 (0.3) | 1321 (25.0) | 1369 (6.3) | |
| Great Southern | 16 (0.1) | 540 (10.2) | 556 (2.6) | |
| Wheatbelt | 7 (0.0) | 239 (4.5) | 246 (1.1) | |
| Goldfields | 17 (0.1) | 485 (9.2) | 502 (2.3) | |
| Midwest | 27 (0.2) | 532 (10.1) | 559 (2.6) | |
| Pilbara | 78 (0.5) | 328 (6.2) | 406 (1.9) | |
| Kimberley | 24 (0.1) | 341 (6.4) | 365 (1.7) | |
| Transfer Status by Primary Diagnosis | ||||
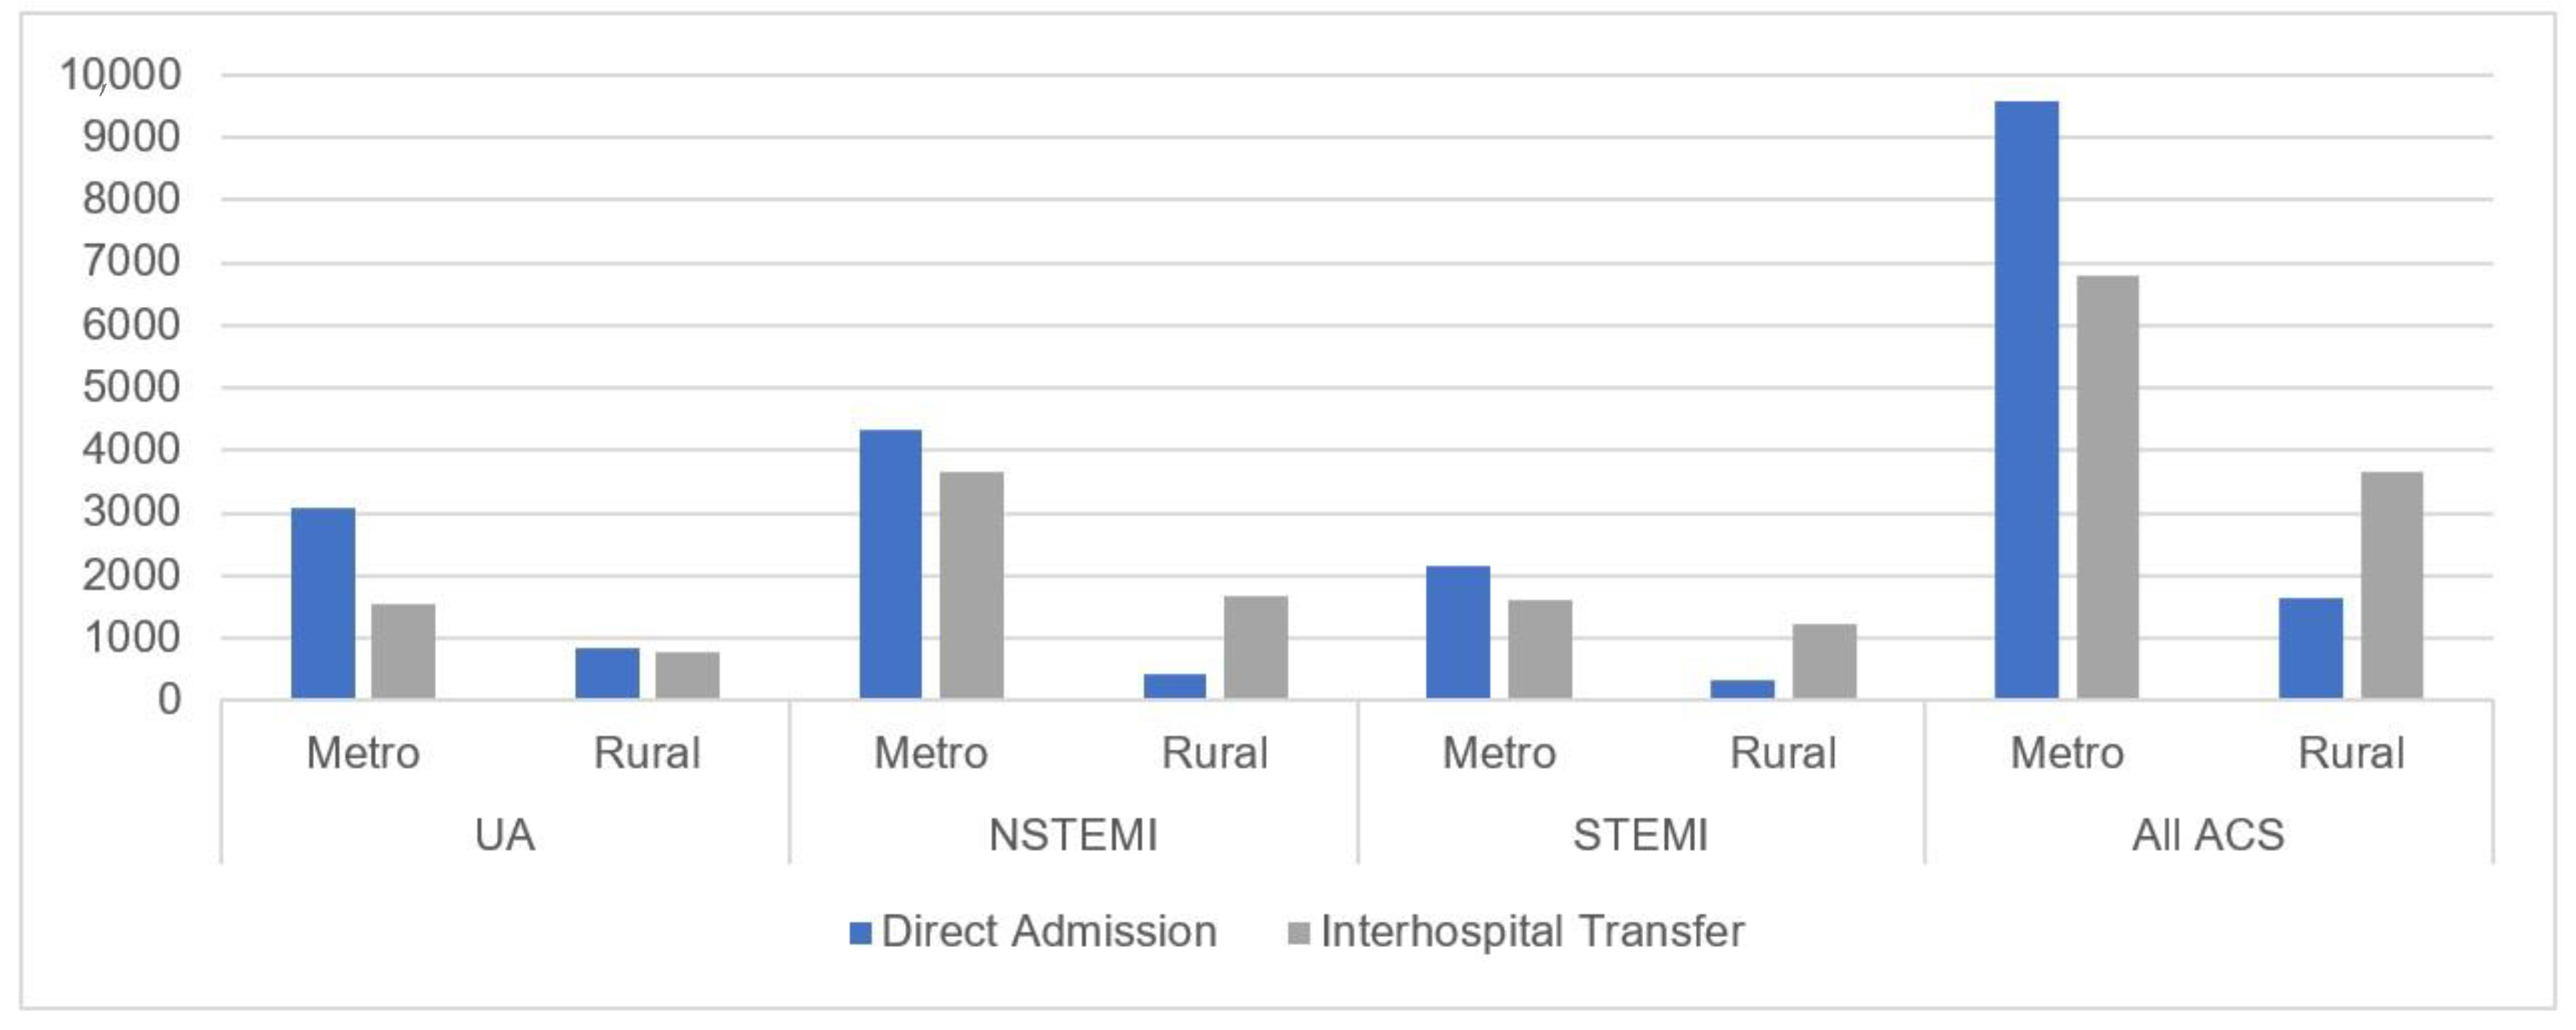
| Transfer for UA | 1532 (33.3) | 780 (47.7) | 2312 (37.1) | <0.001 |
| Transfer for NSTEMI | 3645 (45.7) | 1670 (79.3) | 5315 (52.7) | |
| Transfer for STEMI | 1610 (42.6) | 1212 (78.1) | 2822 (53.0) | |
| Variables | Metro | Rural | Total | Sig * |
|---|---|---|---|---|
| n (R *) | n (R *) | n (R *) | p < 0.05 | |
| Primary Diagnosis (Total Events) | (n = 16,357) | (n = 5290) | (n = 21,647) | |
| UA | 4603 (28.1) | 1634 (30.9) | 6237 (28.8) | <0.001 |
| NSTEMI | 7978 (48.8) | 2105 (39.8) | 10,083 (46.6) | |
| STEMI | 3776 (23.1) | 1551 (29.3) | 5327 (24.6) | |
| Percutaneous Coronary Interventions (PCI) (Total Events) | (n = 16,357) | (n = 5290) | (n = 21,647) | |
| Other Coronary Procedures | 48 (0.3) | 11 (0.2) | 59 (0.3) | <0.001 |
| PCI +/− Stent | 10,394 (63.5) | 3150 (59.5) | 13,544 (62.6) | |
| Coronary Artery Bypass Grafting | 819 (5.0) | 292 (5.5) | 1111 (5.1) | |
| Inter-Hospital Transfer Status (Total Events) | (n = 16,357) | (n = 5290) | (n = 21,647) | |
| Direct/No IHT | 9570 (58.5) | 1628 (30.8) | 11,198 (51.7) | <0.001 |
| Yes, IHT | 6787 (41.5) | 3662 (69.2) | 10,449 (48.3) | |
| In-Hospital Mortality—All Cause (Total Events) | (n = 16,357) | (n = 5290) | (n = 21,647) | |
| Yes, Died in Hospital | 509 (3.1) | 117 (0.7) | 626 (3.8) | 0.001 |
| Mortality—Non-IHD COD (Total Events) | (n = 2848) | (n = 806) | (n = 3654) | |
| 30-Day Mortality | 326 (11.4) | 97 (12.0) | 423 (11.6) | 0.804 |
| 30-Day to 1-Year Mortality | 650 (22.8) | 189 (23.4) | 839 (23.0) | |
| More than 1-Year Mortality | 1872 (65.7) | 520 (64.5) | 2392 (65.5) | |
| Mortality—AMI COD (Total Events) | (n = 854) | (n = 240) | (n = 1094) | |
| 30-Day Mortality | 387 (45.3) | 122 (50.8) | 509 (46.5) | 0.301 |
| 30-Day to 1-Year Mortality | 194 (22.7) | 47 (19.6) | 241 (22.0) | |
| More than 1-Year Mortality | 273 (32.0) | 71 (29.6) | 344 (31.4) | |
| Mortality—IHD COD, Excluding AMI (Total Events) | (n = 408) | (n = 122) | (n = 530) | |
| 30-day mortality | 51 (12.5) | 15 (12.3) | 66 (12.5) | 0.624 |
| 30-Day to 1-Year Mortality | 142 (34.8) | 37 (30.3) | 179 (33.8) | |
| More than 1-Year Mortality | 215 (52.7) | 70 (57.4) | 285 (53.8) |
| Variables | Direct/No IHT | IHT | Total | Sig * |
|---|---|---|---|---|
| n (R *) | n (R *) | n (R *) | p < 0.05 | |
| Primary Diagnosis (Total Events) | (n = 9570) | (n = 6787) | (n = 16357) | |
| UA | 3071 (32.1) | 1532 (22.6) | 4603 (28.1) | <0.001 |
| NSTEMI | 4333 (45.3) | 3645 (53.7) | 7978 (48.8) | |
| STEMI | 2166 (22.6) | 1610 (23.7) | 3776 (23.1) | |
| Percutaneous Coronary Interventions (PCI) (Total Events) | (n = 9570) | (n = 6787) | (n = 16357) | |
| Other Coronary Procedures | 28 (0.3) | 20 (0.3) | 48 (0.3) | <0.001 |
| PCI +/− Stent | 5479 (57.3) | 4916 (72.4) | 10395 (63.6) | |
| Coronary Artery Bypass Grafting | 347 (3.6) | 473 (7.0) | 820 (5.0) | |
| Comorbidities during the Same Admission (Total Events) | (n = 9570) | (n = 6787) | (n = 16357) | |
| Diabetes | 1880 (19.6) | 1163 (17.1) | 3043 (18.6) | <0.001 |
| Cardiac Arrest | 163 (1.7) | 75 (1.1) | 238 (1.5) | 0.002 |
| Heart Failure | 1180 (12.3) | 652 (9.6) | 1832 (11.2) | <0.001 |
| Chronic Pulmonary Disease | 79 (0.8) | 33 (0.5) | 112 (0.7) | 0.010 |
| Renal Insufficiency < 29 mL/min | 275 (2.9) | 137 (2.0) | 412 (2.5) | 0.001 |
| Obese | 211 (2.2) | 133 (2.0) | 344 (2.1) | 0.282 |
| In-Hospital Mortality (Total Events) | (n = 9570) | (n = 6787) | (n = 16357) | |
| Yes, Died in Hospital | 418 (4.4) | 91 (1.3) | 509 (3.1) | <0.001 |
| Post-Discharge Mortality by COD (Total Events) | (n = 2718) | (n = 1392) | (n = 4110) | |
| Non-IHD COD | 1843 (67.8) | 1005 (72.2) | 2848 (69.3) | <0.001 |
| AMI COD | 608 (22.4) | 246 (17.7) | 854 (20.8) | |
| IHD COD, Excluding AMI | 267 (9.8) | 141 (10.1) | 408 (9.9) | |
| Post-Discharge Mortality by Time Points (Total Events) | (n = 2718) | (n = 1392) | (n = 4110) | |
| 30-Day Mortality | 545 (20.1) | 219 (15.7) | 764 (18.6) | <0.001 |
| 30-Day to 1-Year Mortality | 665 (24.5) | 321 (23.1) | 986 (24.0) | |
| More than 1-Year Mortality | 1508 (55.5) | 852 (61.2) | 2360 (57.4) |
Publisher’s Note: MDPI stays neutral with regard to jurisdictional claims in published maps and institutional affiliations. |
© 2020 by the authors. Licensee MDPI, Basel, Switzerland. This article is an open access article distributed under the terms and conditions of the Creative Commons Attribution (CC BY) license (http://creativecommons.org/licenses/by/4.0/).
Share and Cite
Forsyth, R.; Sun, Z.; Reid, C.; Moorin, R. Rates and Patterns of First-Time Admissions for Acute Coronary Syndromes across Western Australia Using Linked Administrative Health Data 2007–2015. J. Clin. Med. 2021, 10, 49. https://doi.org/10.3390/jcm10010049
Forsyth R, Sun Z, Reid C, Moorin R. Rates and Patterns of First-Time Admissions for Acute Coronary Syndromes across Western Australia Using Linked Administrative Health Data 2007–2015. Journal of Clinical Medicine. 2021; 10(1):49. https://doi.org/10.3390/jcm10010049
Chicago/Turabian StyleForsyth, René, Zhonghua Sun, Christopher Reid, and Rachael Moorin. 2021. "Rates and Patterns of First-Time Admissions for Acute Coronary Syndromes across Western Australia Using Linked Administrative Health Data 2007–2015" Journal of Clinical Medicine 10, no. 1: 49. https://doi.org/10.3390/jcm10010049
APA StyleForsyth, R., Sun, Z., Reid, C., & Moorin, R. (2021). Rates and Patterns of First-Time Admissions for Acute Coronary Syndromes across Western Australia Using Linked Administrative Health Data 2007–2015. Journal of Clinical Medicine, 10(1), 49. https://doi.org/10.3390/jcm10010049