
The Position of Aβ22-40 and Aβ1-42 in Anionic Lipid Membranes Containing Cholesterol


Abstract
:1. Introduction
2. Experimental Section
2.1. Membrane Samples Preparation

| DMPC | DMPS | Chol | A | A | d * | * | * | |
|---|---|---|---|---|---|---|---|---|
| (mol %) | (mol %) | (mol %) | (mol %) | (mol %) | (Å) | (Å) | (Å) | (Å) |
| Without peptide | ||||||||
| 92.0 | 8.0 | 0 | - | - | 50.3 | 35.2 | 15.1 | 46.0 ± 0.2 |
| 82.8 | 7.2 | 10 | - | - | 52.7 | - | - | 46.4 ± 0.4 |
| 64.4 | 5.6 | 30 | - | - | 54.3 | 39.7 | 14.6 | 46.7 ± 0. 1 |
| 59.8 | 5.2 | 35 | - | - | 54.3 | - | - | 47.3 ± 0.2 |
| 55.2 | 4.8 | 40 | - | - | 51.8 | 40.5 | 11.3 | 51.8 ± 0.4 |
| 46.0 | 4.0 | 50 | - | - | 51.4 | - | - | 53.6 ± 0.3 |
| A | ||||||||
| 90.6 | 7.9 | 0 | 1.5 | - | 52.0 | 37.8 | 14.2 | 46.5 ± 0.1 |
| 63.4 | 5.5 | 29.6 | 1.5 | - | 53.2 | 40.0 | 13.2 | 50.2 ± 0.3 |
| 54.4 | 4.7 | 39.4 | 1.5 | - | 54.8 | 41.4 | 13.4 | 47.6 ± 0.1 |
| 45.3 | 3.9 | 49.3 | 1.5 | - | 58.4 | - | - | 50.5 ± 0.3 |
| A | ||||||||
| 63.4 | 5.5 | 29.6 | - | 1.5 | 55.3 | 39.1 | 16.2 | 46.7 ± 0.2 |
| 54.4 | 4.7 | 39.4 | - | 1.5 | 54.6 | 40.4 | 14.2 | 47.6 ± 0.1 |
| 45.3 | 3.9 | 49.3 | - | 1.5 | 52.7 | 39.1 | 13.6 | 50.3 ± 0.3 |
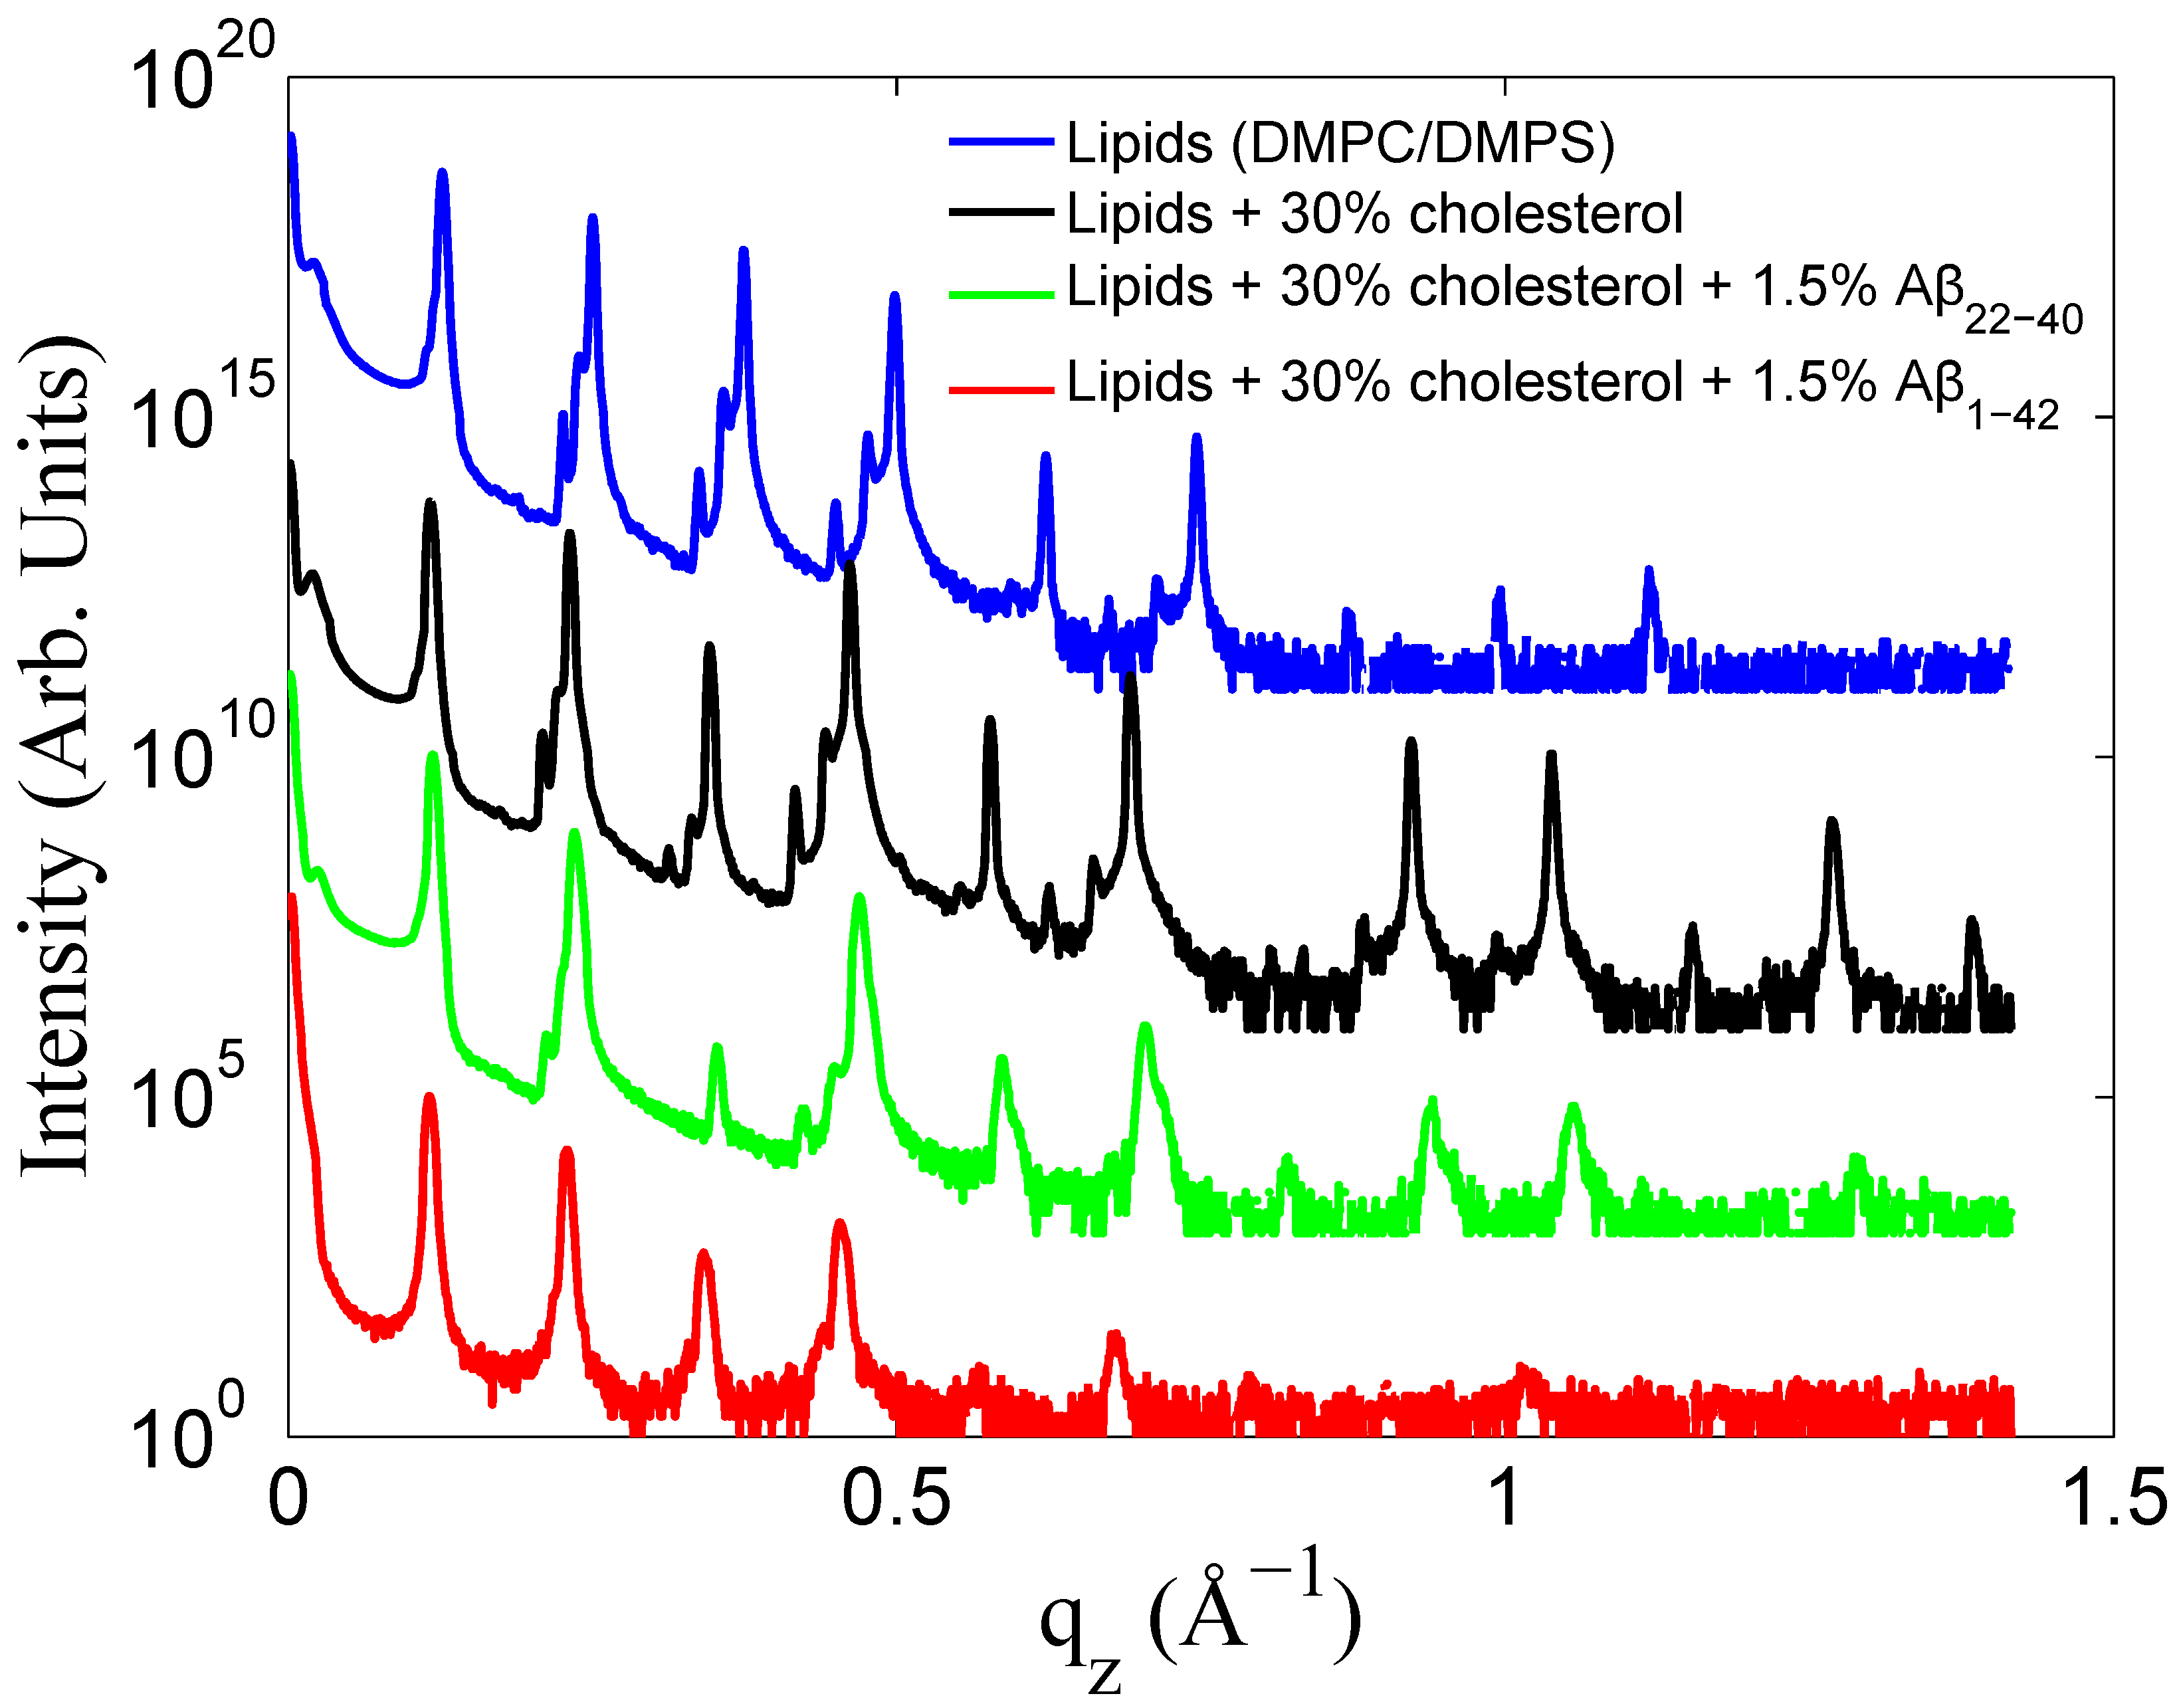
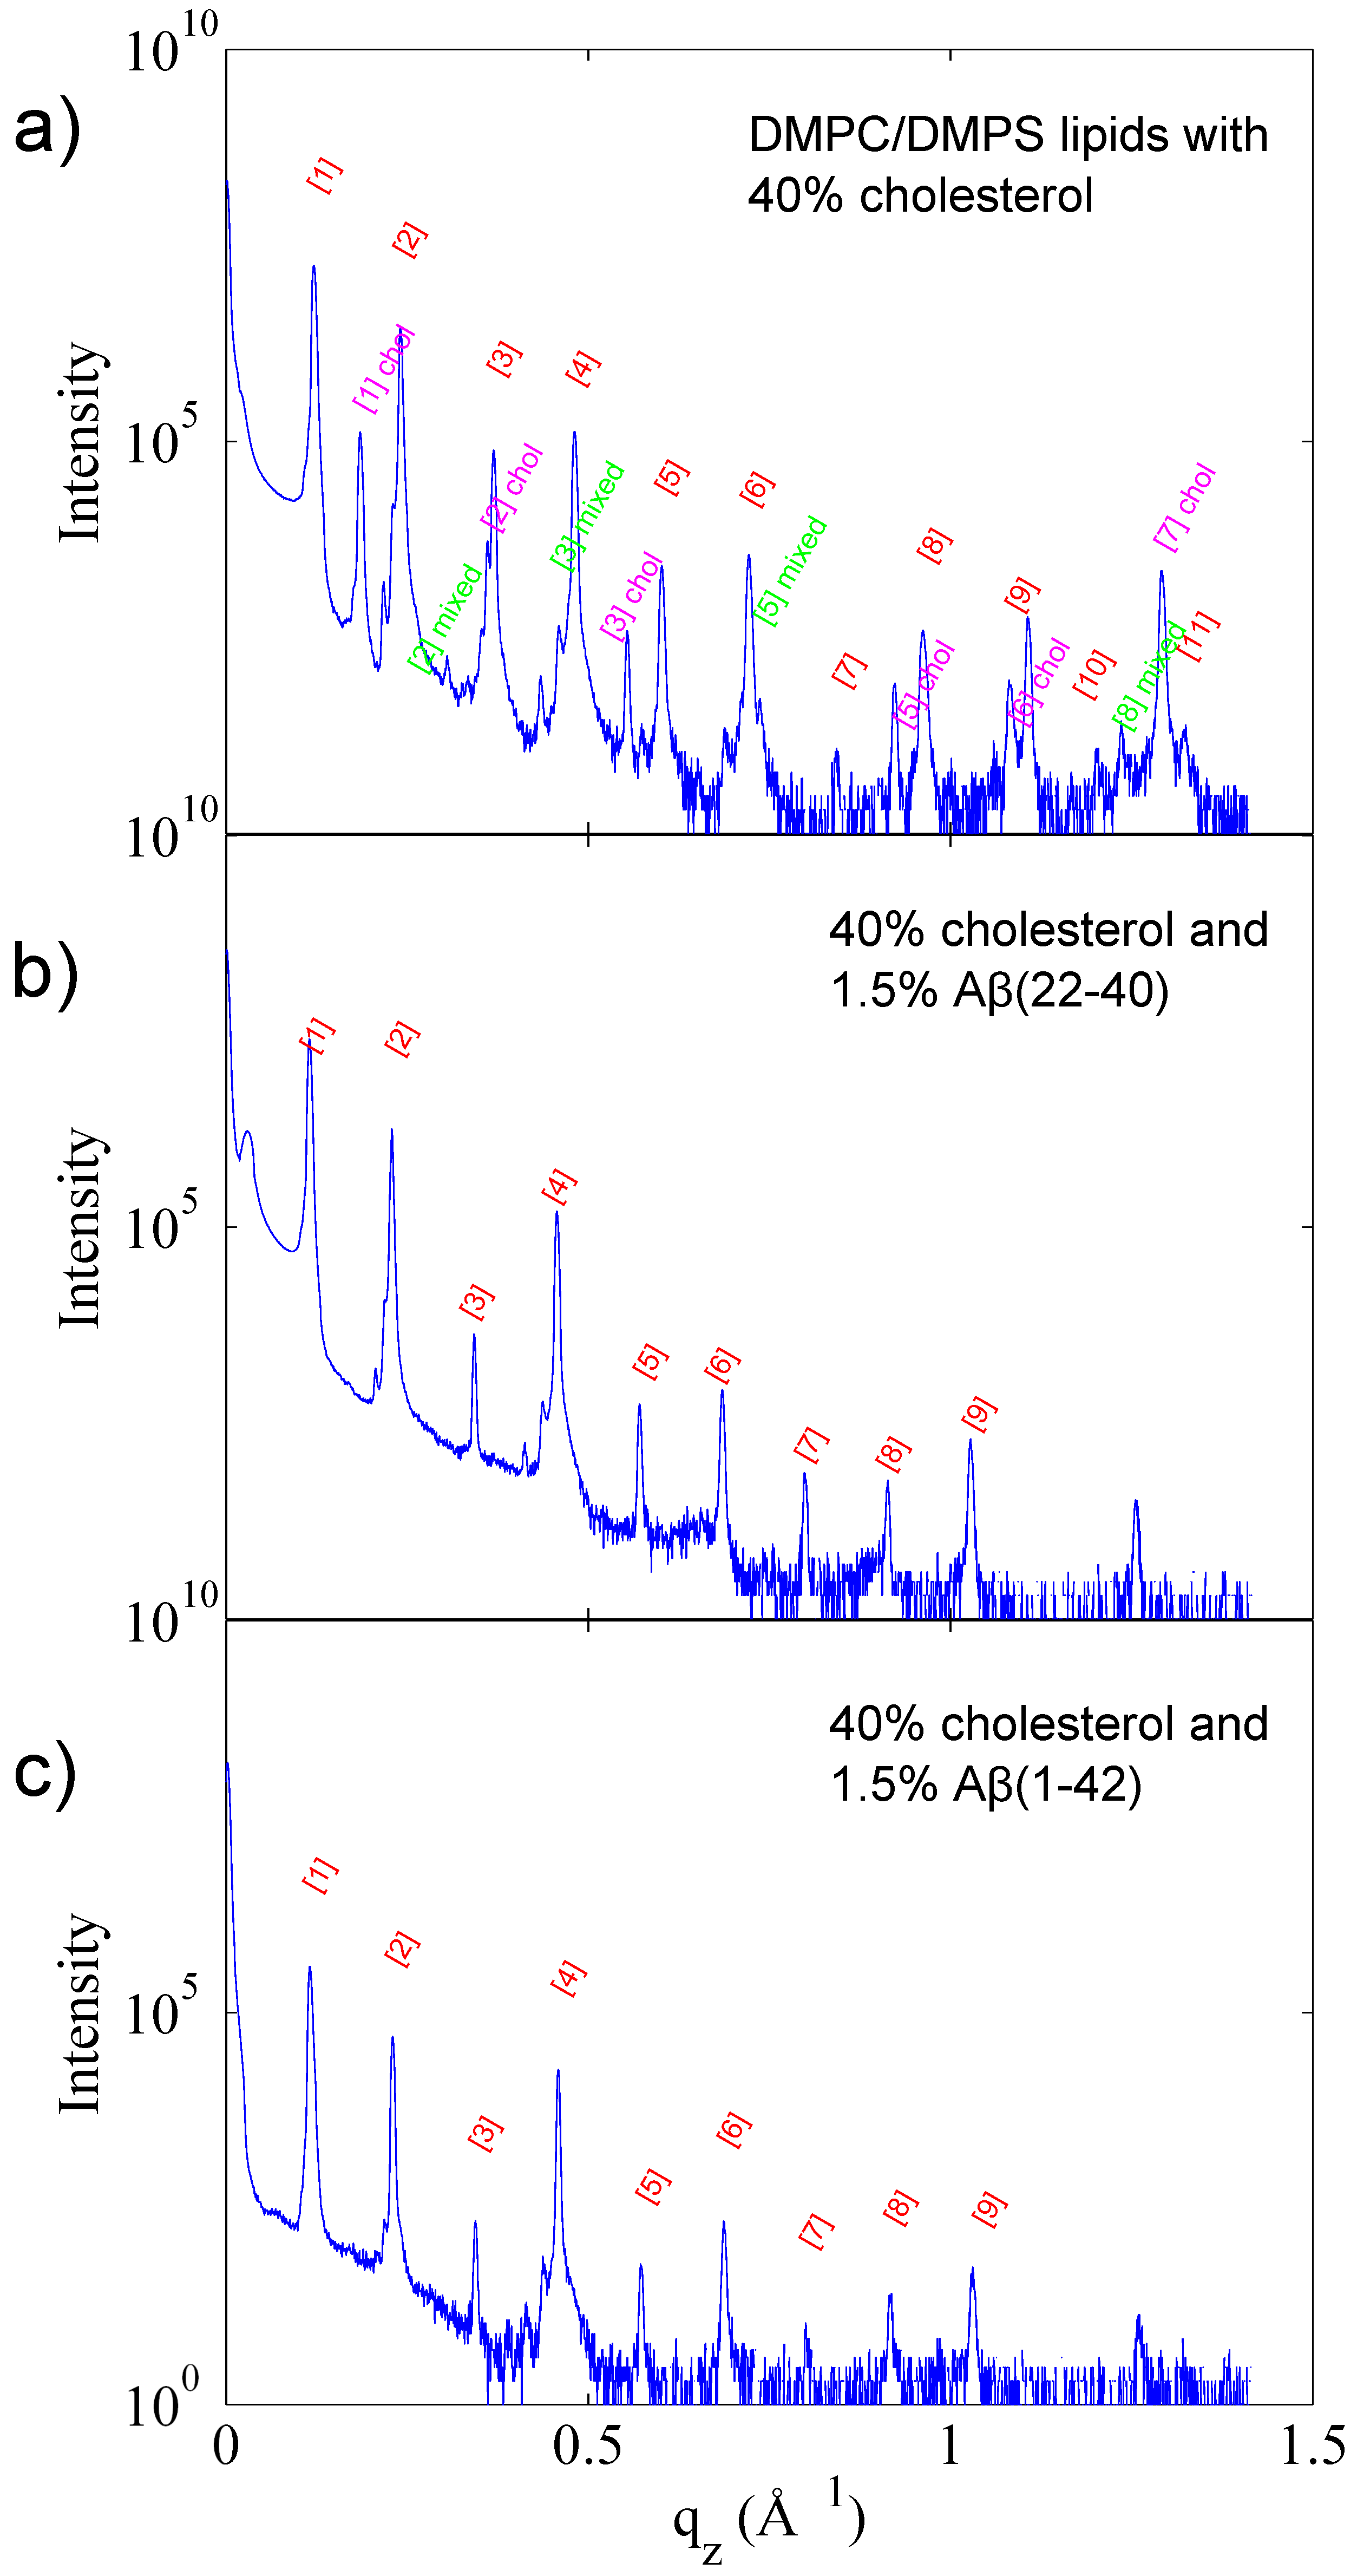
2.2. X-Ray Scattering

3. Results and Discussion
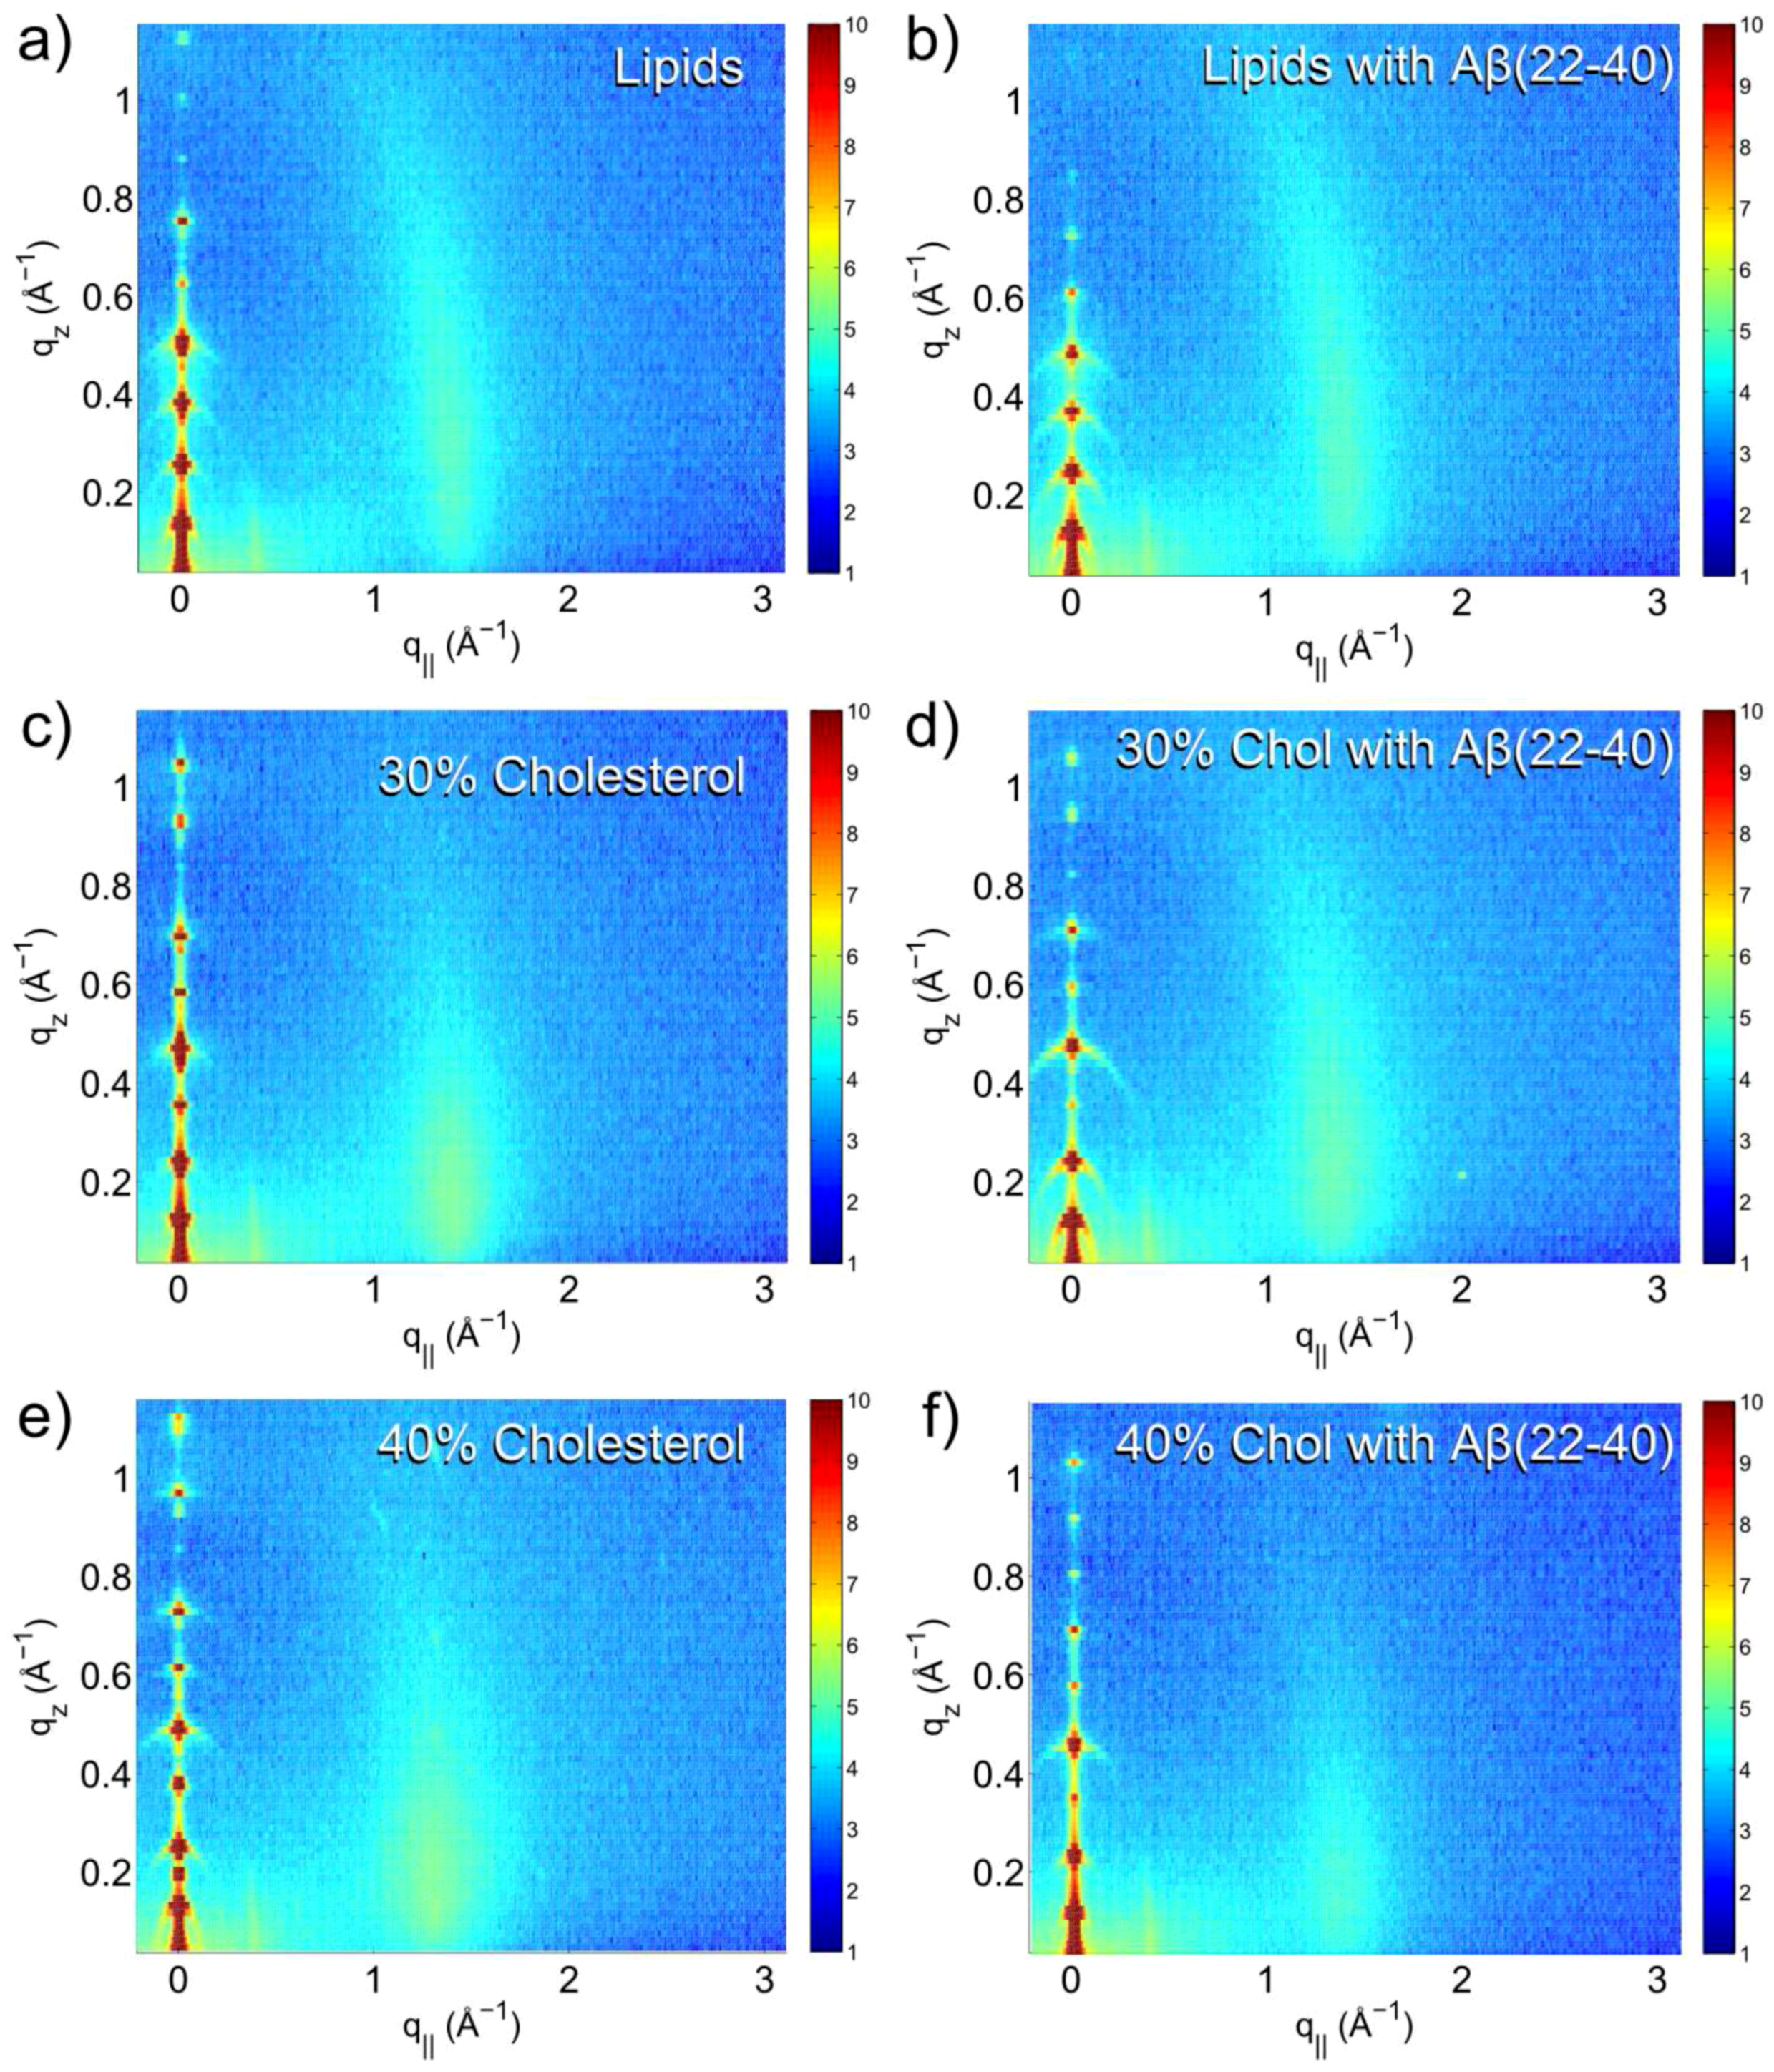
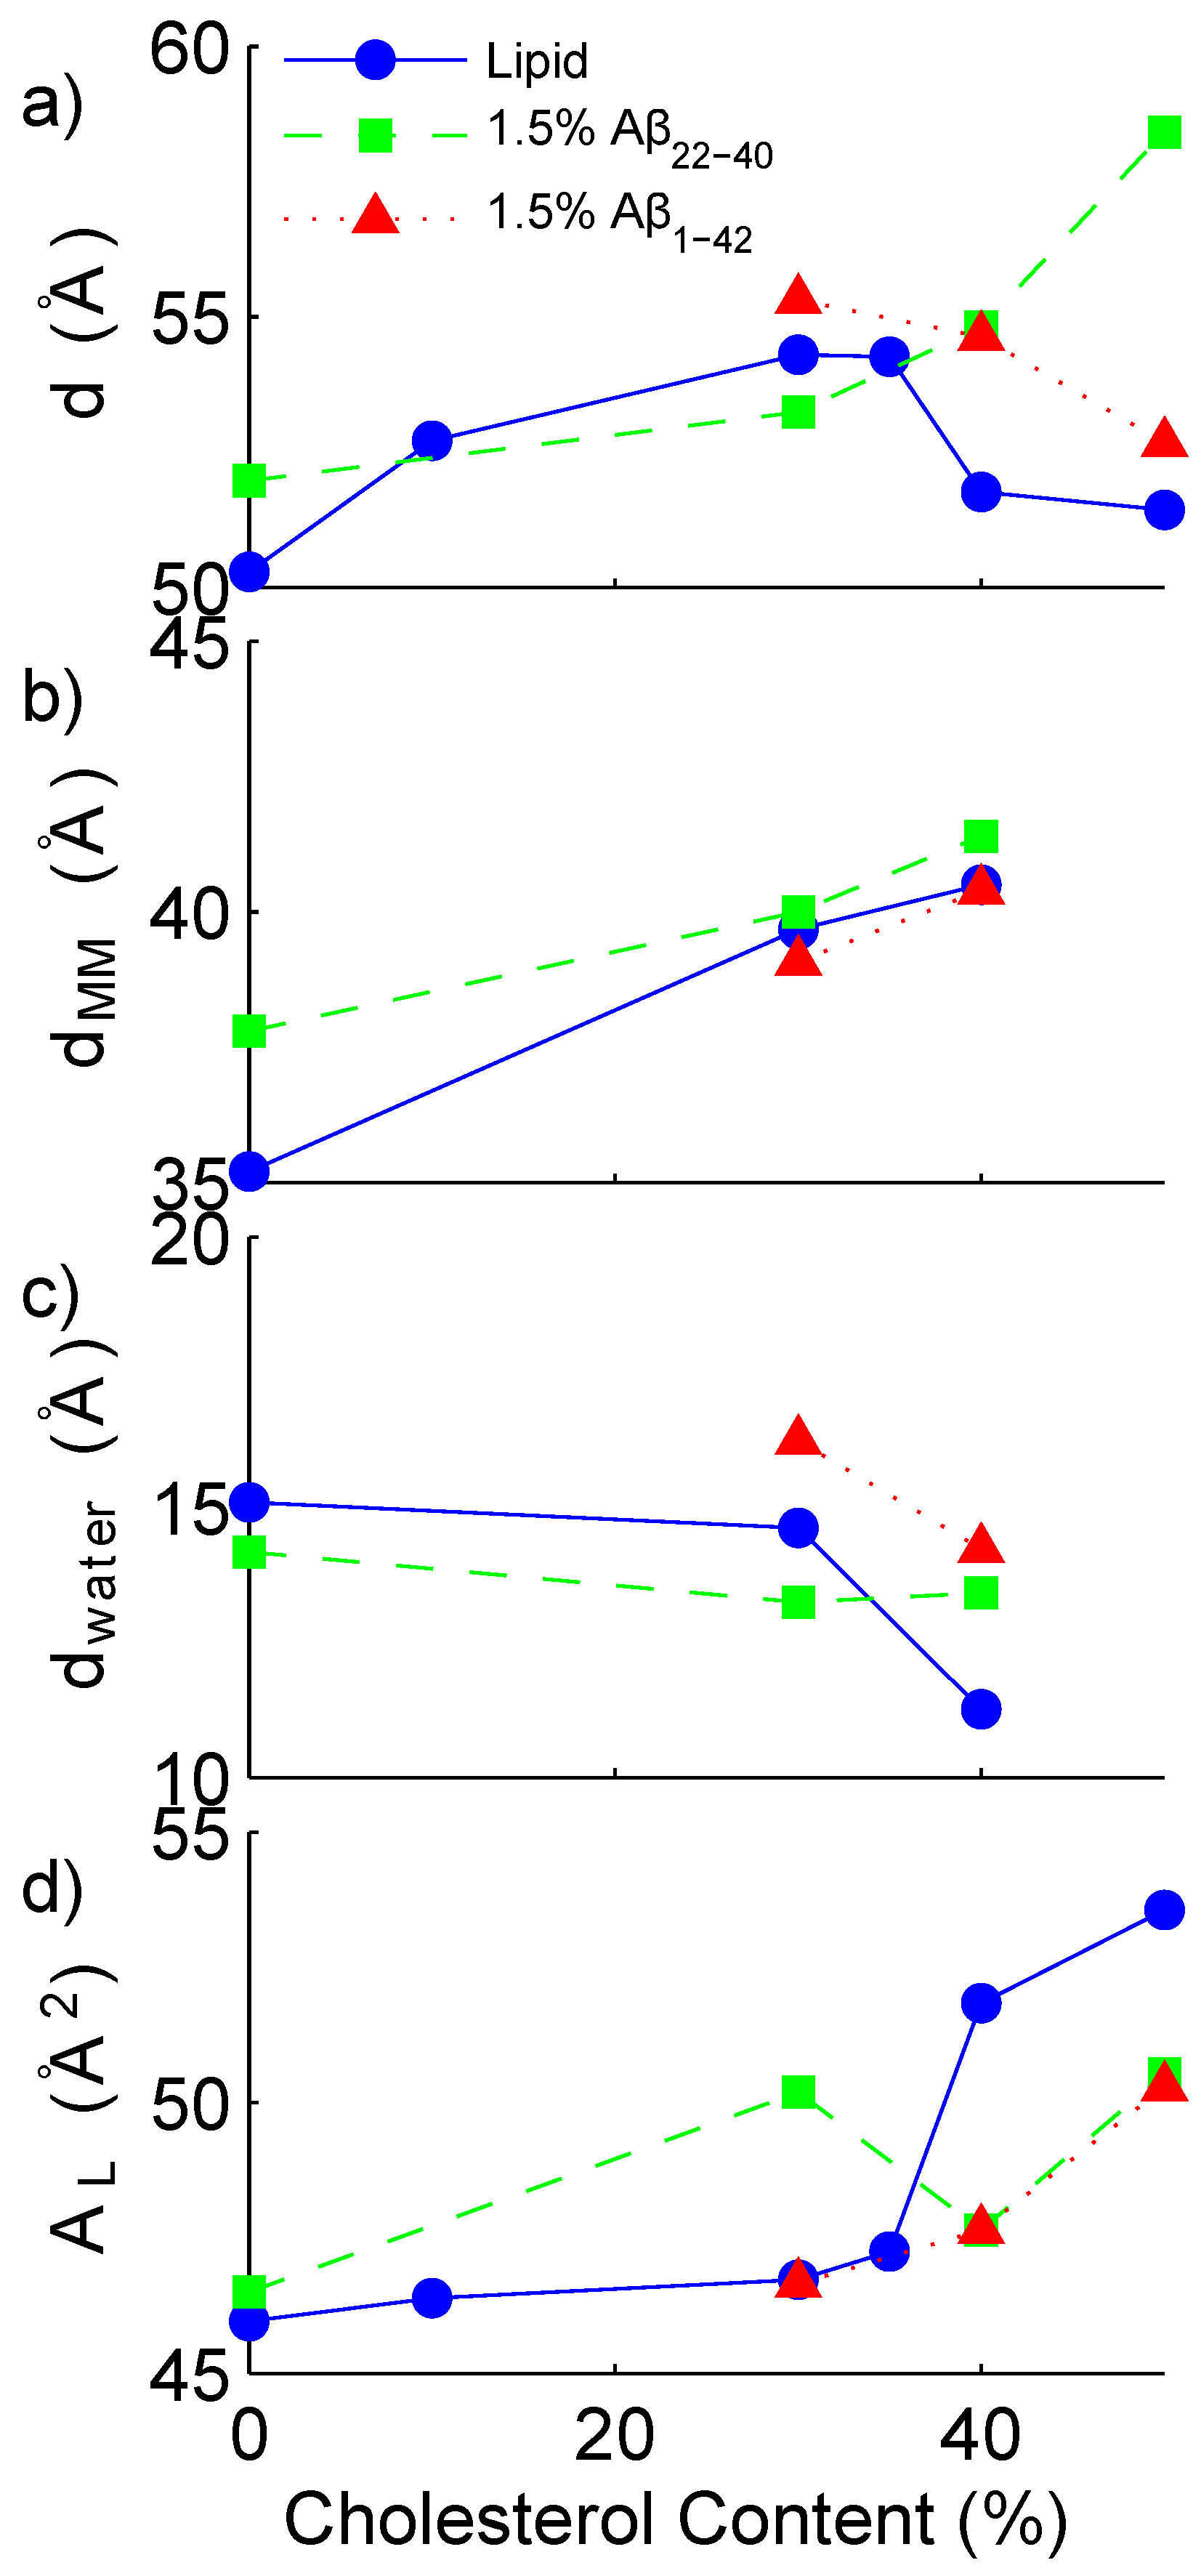
3.1. Solubility Limit of Cholesterol in 92 mol %DMPC:8 mol %DMPS Bilayer
3.2. Increased Cholesterol Solubility Limit in the Presence of Amyloid-β Peptides
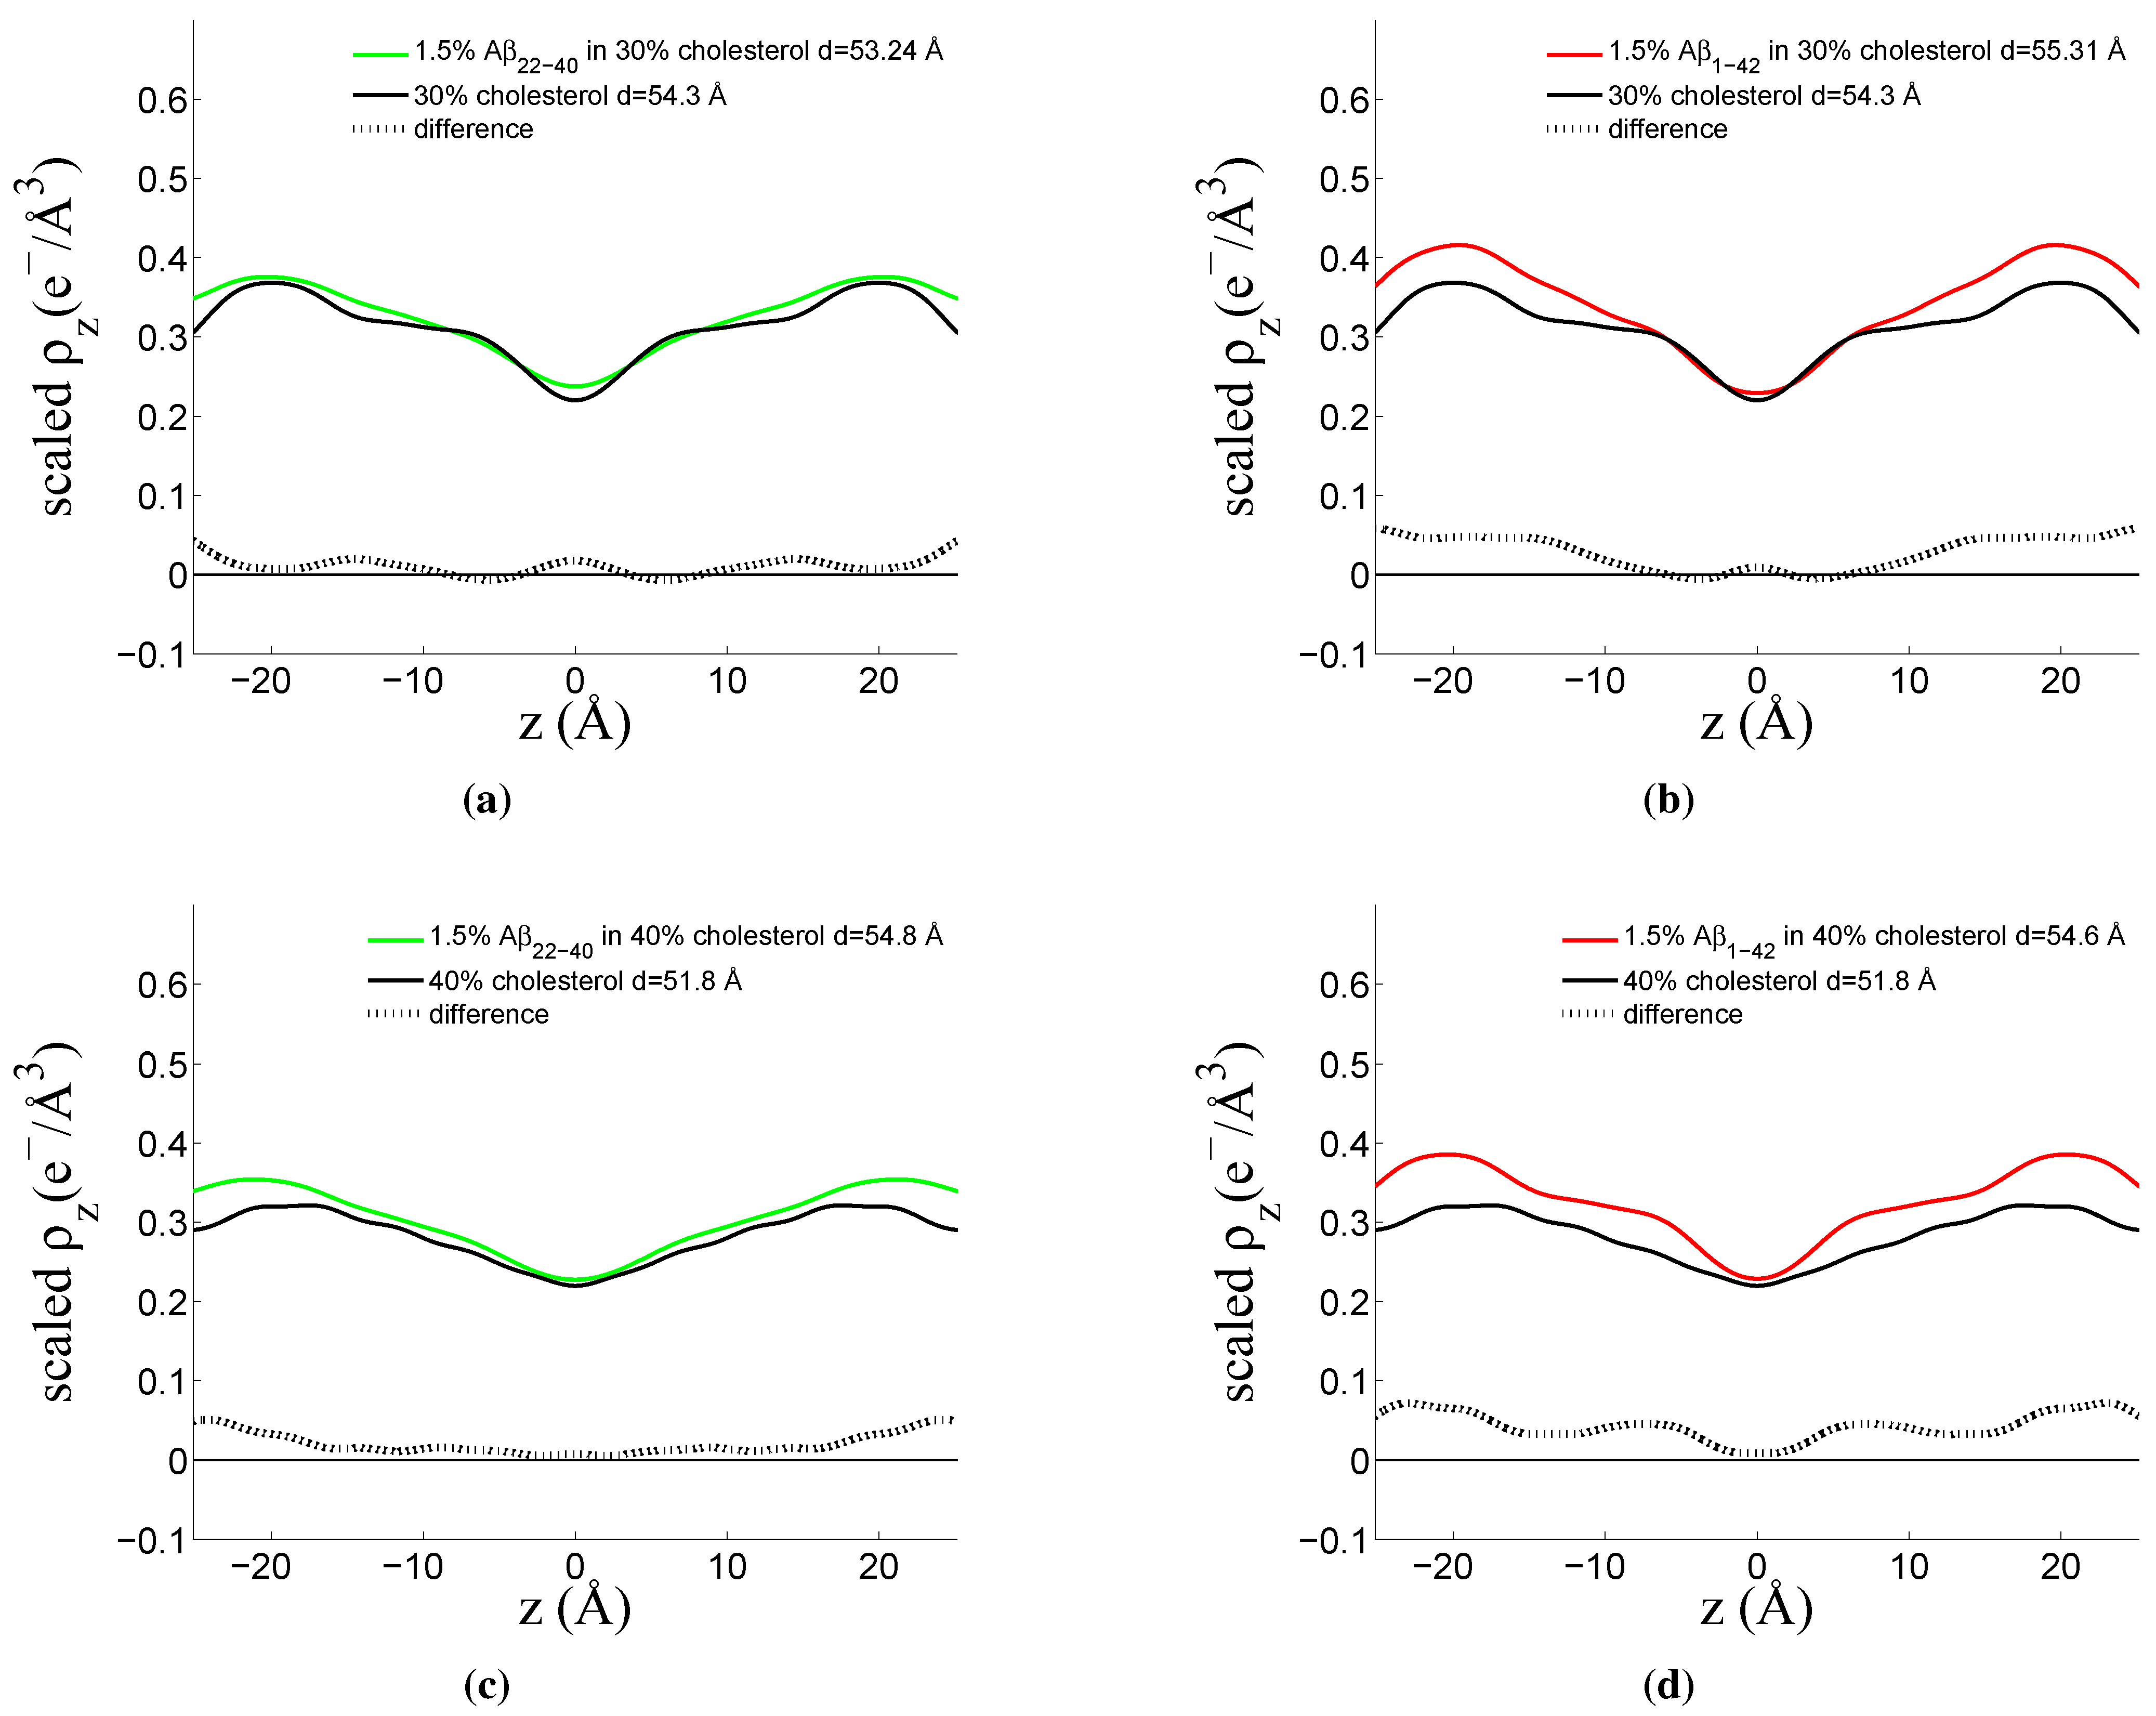
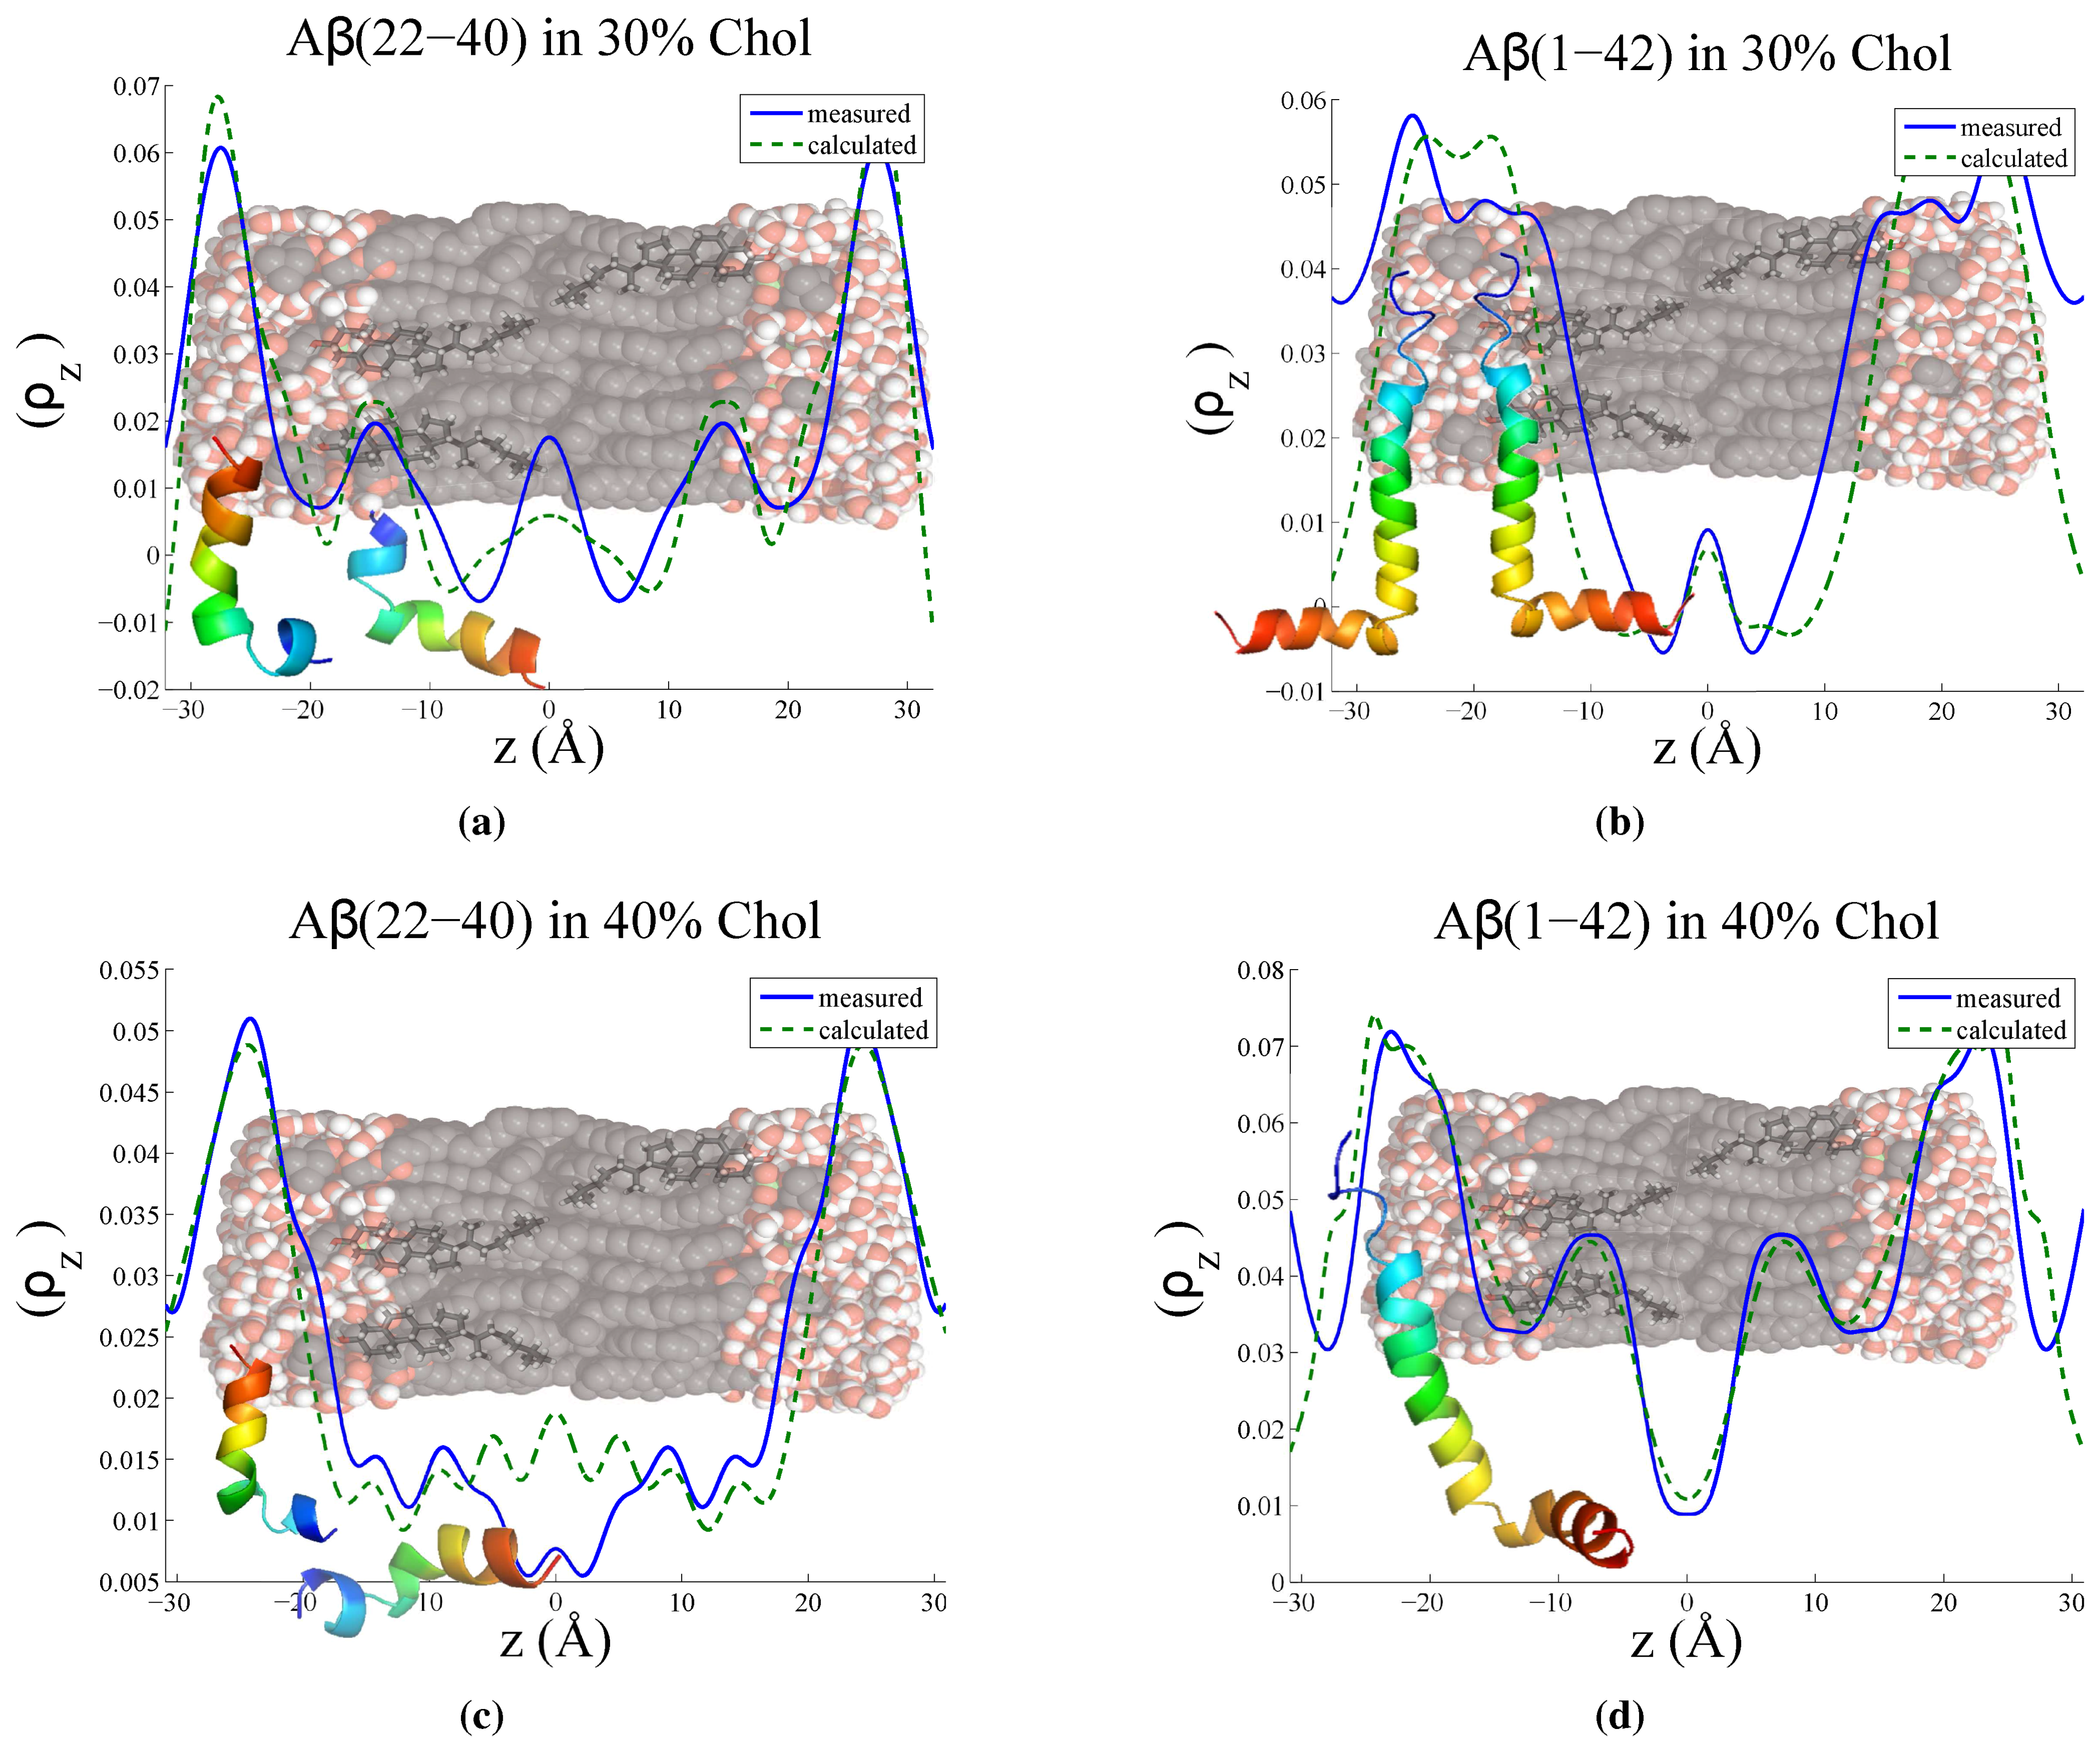
3.3. Position of Amyloid-β Peptide Fragments in the Bilayer
3.3.1. Peptide Fragment: Amyloid-
3.3.2. Full Length Peptide:Amyloid-
4. Conclusions
Acknowledgments
Author Contributions
Conflicts of Interest
References
- Lorenzo, A.; Yankner, B. Amyloid Fibril Toxicity in Alzheimer’s Disease and Diabetesa. Ann. N. Y. Acad. Sci. 1996, 617, 89–95. [Google Scholar] [CrossRef]
- McLean, C.; Cherny, R. Soluble pool of Aβ amyloid as a determinant of severity of neurodegeneration in Alzheimer’s disease. Ann. Neurol. 1999, 46, 860–866. [Google Scholar] [CrossRef]
- Selkoe, D. Alzheimer’s disease: Genes, proteins, and therapy. Physiol. Rev. 2001, 81, 741–766. [Google Scholar] [CrossRef] [PubMed]
- Yang, X.; Sun, G.Y.; Eckert, G.P.; Lee, J.C.M. Cellular Membrane Fluidity in Amyloid Precursor Protein Processing. Mol. Neurobiol. 2014, 50, 119–129. [Google Scholar] [CrossRef] [PubMed]
- Ono, K.; Condron, M.M.; Teplow, D.B. Structure-neurotoxicity relationships of amyloid β-protein oligomers. Proc. Natl. Acad. Sci. USA 2009, 106, 14745–14750. [Google Scholar] [CrossRef] [PubMed]
- Drolle, E.; Hane, F.; Lee, B.; Leonenko, Z. Atomic force microscopy to study molecular mechanisms of amyloid fibril formation and toxicity in Alzheimer’s disease. Drug Metab. Rev. 2014, 46, 207–223. [Google Scholar] [CrossRef] [PubMed]
- Vassar, R. BACE1: The β-secretase enzyme in Alzheimer’s disease. J. Mol. Neurosci. 2004, 23, 105–114. [Google Scholar] [CrossRef]
- Haass, C.; Kaether, C.; Thinakaran, G.; Sisodia, S. Trafficking and proteolytic processing of APP. Cold Spring Harb. Perspect. Med. 2012, 2, 1–26. [Google Scholar] [CrossRef] [PubMed]
- Dante, S.; Hauss, T.; Dencher, N.A. β-amyloid 25 to 35 is intercalated in anionic and zwitterionic lipid membranes to different extents. Biophys. J. 2002, 83, 2610–2616. [Google Scholar] [CrossRef]
- Dante, S.; Hauss, T.; Brandt, A.; Dencher, N.A. Membrane fusogenic activity of the Alzheimer’s peptide A β(1-42) demonstrated by small-angle neutron scattering. J. Mol. Biol. 2008, 376, 393–404. [Google Scholar] [CrossRef] [PubMed]
- Buchsteiner, A.; Hauß, T.; Dante, S.; Dencher, N. Alzheimer’s diesease amyloid-β peptide analogue alters the ps-dynamics of phospholipid membranes. Biochim. Biophy. Acta 2010, 1798, 1969–1976. [Google Scholar] [CrossRef] [PubMed]
- Buchsteiner, A.; Hauß, T.; Dencher, N.A. Influence of amyloid-β peptides with different lengths and amino acid sequences on the lateral diffusion of lipids in model membranes. Soft Matter 2012, 8, 424–429. [Google Scholar] [CrossRef]
- Maxfield, F.R.; Tabas, I. Role of cholesterol and lipid organization in disease. Nature 2005, 438, 612–621. [Google Scholar] [CrossRef] [PubMed]
- Abramov, A.Y.; Ionov, M.; Pavlov, E.; Duchen, M.R. Membrane cholesterol content plays a key role in the neurotoxicity of β-amyloid: Implications for Alzheimer’s disease. Aging Cell 2011, 10, 595–603. [Google Scholar] [CrossRef] [PubMed]
- Lashuel, H.A.; Hartley, D.; Petre, B.M.; Walz, T.; Lansbury, P.T.J. Amyloid pores from pathogenic mutations. Nature 2002, 418, 4–5. [Google Scholar] [CrossRef] [PubMed]
- Berthelot, K.; Cullin, C.; Lecomte, S. What does make an amyloid toxic: Morphology, structure or interaction with membrane? Biochimie 2013, 95, 12–19. [Google Scholar] [CrossRef] [PubMed]
- Sparks, D.L.; Hunsaker, J.C.; Scheff, S.; Kryscio, R.; Henson, J.; Markesbery, W. Cortical Senile Plaques in Coronary Artery Disease , Aging and Alzheimer’s Disease. Neurobiol. Aging 1990, 11, 601–607. [Google Scholar] [CrossRef]
- Wood, W.G.; Schroeder, F.; Igbavboa, U.; Avdulov, N.A.; Chochina, S.V. Brain membrane cholesterol domains, aging and amyloid β-peptides. Neurobiol. Aging 2002, 23, 685–694. [Google Scholar] [CrossRef]
- Hartmann, T. Cholesterol, A β and Alzheimer’s disease. TINS 2001, 24, 45–48. [Google Scholar]
- Eckert, A.; Keil, U.; Kressmann, S.; Schindowski, K.; Leutner, S.; Leutz, S.; Müller, W.E. Effects of EGb 761 Ginkgo biloba extract on mitochondrial function and oxidative stress. Pharmacopsychiatry 2003, 36 (Suppl. S1), S15–S23. [Google Scholar] [PubMed]
- Koudinov, A.; Koudinova, N.V. Proteolysis-inducing factor regulates hepatic gene expression via the transcription factors NF-(kappa)B and STAT3. FASEB J. 2001, 15, 562–564. [Google Scholar]
- Casserly, I.; Topol, E. Convergence of atherosclerosis and Alzheimer’s disease: Inflammation, cholesterol, and misfolded proteins. Lancet 2004, 363, 1139–1146. [Google Scholar] [CrossRef]
- Shobab, L.A.; Hsiung, G.Y.R.; Feldman, H.H. Cholesterol in Alzheimer’s disease. Lancet Neurol. 2005, 4, 841–852. [Google Scholar] [CrossRef]
- Simons, M.; Keller, P.; Dichgans, J.; Schultz, J.B. Vitamin D and Alzheimer’s Disease : Is There a Link? Neurology 2010, 57, 1089–1093. [Google Scholar] [CrossRef]
- Svennerholm, L.; Boström, K.; Jungbjer, B. Changes in weight and compositions of major membrane components of human brain during the span of adult human life of Swedes. Acta Neuropathol. 1997, 94, 345–352. [Google Scholar] [CrossRef] [PubMed]
- Puglielli, L.; Tanzi, R.E.; Kovacs, D.M. Alzheimer’s disease: The cholesterol connection. Nat. Neurosci. 2003, 6, 345–351. [Google Scholar] [CrossRef] [PubMed]
- Fonseca, A.C.; Resende, R.; Oliveira, C.R.; Pereira, C.M.F. Cholesterol and statins in Alzheimer’s disease: Current controversies. Exp. Neurol. 2010, 223, 282–293. [Google Scholar] [CrossRef] [PubMed]
- Frears, E.R.; Stephens, D.J.; Walters, C.E.; Davies, H.; Austen, B.M. The role of cholesterol in the biosynthesis of β-amyloid. Neuroreport 1999, 10, 1699–705. [Google Scholar] [CrossRef] [PubMed]
- Mason, R.P.; Shoemaker, W.J.; Shajenko, L.; Chambers, T.E.; Herbette, L.G. Evidence for changes in the Alzheimer’s disease brain cortical membrane structure mediated by cholesterol. Neurobiol. Aging 1992, 13, 413–419. [Google Scholar] [CrossRef]
- Del Mar Martínez-Senac, M.; Villalaín, J.; Gómez-Fernández, J.C. Structure of the Alzheimer β-amyloid peptide (25–35) and its interaction with negatively charged phospholipid vesicles. Eur. J. Biochem. 1999, 265, 744–753. [Google Scholar] [CrossRef] [PubMed]
- Maltseva, E.; Brezesinski, G. Adsorption of Amyloid β (1–40) Peptide to Phosphatidylethanolamine Monolayers. ChemPhysChem 2004, 5, 1185–1190. [Google Scholar] [CrossRef] [PubMed]
- Thakur, G.; Micic, M.; Leblanc, R.M. Surface chemistry of Alzheimer’s disease: A Langmuir monolayer approach. Colloids Surf. B Biointerfaces 2009, 74, 436–456. [Google Scholar] [CrossRef] [PubMed]
- Tsai, H.H.G.; Lee, J.B.; Tseng, S.S.; Pan, X.A.; Shih, Y.C. Folding and membrane insertion of amyloid-β (25–35) peptide and its mutants: Implications for aggregation and neurotoxicity. Proteins Struct. Funct. Bioinform. 2010, 78, 1909–1925. [Google Scholar] [CrossRef] [PubMed]
- Sani, M.A.; Gehman, J.D.; Separovic, F. Lipid matrix plays a role in A β fibril kinetics and morphology. FEBS Lett. 2011, 585, 749–754. [Google Scholar] [CrossRef] [PubMed]
- Hane, F.; Drolle, E.; Gaikwad, R.; Faught, E.; Leonenko, Z. Amyloid-β Aggregation on Model Lipid Membranes: An Atomic Force Microscopy Study. J. Alzheimer’s Dis. 2011, 26, 485–494. [Google Scholar]
- Ding, H.; Schauerte, J.A.; Steel, D.G.; Gafni, A. β-Amyloid (1–40) Peptide Interactions with Supported Phospholipid Membranes: A Single-Molecule Study. Biophys. J. 2012, 103, 1500–1509. [Google Scholar] [CrossRef] [PubMed]
- Ahyayauch, H.; Raab, M.; Busto, J.V.; Andraka, N.; Arrondo, J.L.R.; Masserini, M.; Tvaroska, I.; Goñi, F.M. Binding of β-amyloid (1–42) peptide to negatively charged phospholipid membranes in the liquid-ordered state: Modeling and experimental studies. Biophys. J. 2012, 103, 453–463. [Google Scholar] [CrossRef] [PubMed]
- Mason, R.P.; Estermyer, J.D.; Kelly, J.F.; Mason, P.E. Alzheimer’s disease amyloid β peptide 25-35 is localized in the membrane hydrocarbon core: X-ray diffraction analysis. Biochem. Biophys. Res. Commun. 1996, 222, 78–82. [Google Scholar] [CrossRef] [PubMed]
- Dante, S.; Hauss, T.; Dencher, N.A. β-Amyloid 25 to 35 Is Intercalated in Anionic and Zwitterionic Lipid Membranes to Different Extents. Biophys. J. 2002, 83, 2610–2616. [Google Scholar] [CrossRef]
- Dante, S.; Hauß, T.; Dencher, N.A. Cholesterol inhibits the insertion of the Alzheimer’s peptide Aβ (25–35) in lipid bilayers. Eur. Biophys. J. 2006, 35, 523–531. [Google Scholar] [CrossRef] [PubMed]
- Dante, S.; Hauss, T.; Steitz, R.; Canale, C.; Dencher, N.A. Nanoscale structural and mechanical effects of β-amyloid (1-42) on polymer cushioned membranes: A combined study by neutron reflectometry and {AFM} Force Spectroscopy. Biochim. Biophys. Acta 2011, 1808, 2646–2655. [Google Scholar] [CrossRef] [PubMed]
- Dies, H.; Toppozini, L.; Rheinstädter, M.C. The Interaction between Amyloid-β Peptides and Anionic Lipid Membranes Containing Cholesterol and Melatonin. PLoS ONE 2014, 9, e99124. [Google Scholar] [CrossRef] [PubMed]
- Silvius, J.R. Thermotropic Phase Transitions of Pure Lipids in Model Membranes and Their Modifications by Membrane Proteins. In Lipid-Protein Interactions; John Wiley & Sons, Inc.: New York, NY, USA, 1982. [Google Scholar]
- Jao, S.; Ma, K.; Talafous, J.; Orlando, R.; Zagorski, M. Trifluoroacetic acid pretreatment reproducibly disaggregates the amyloid β-peptide. Amyloid Int. J. Exp. Clin. Investig. 1997, 4, 240–252. [Google Scholar] [CrossRef]
- Greenspan, L. Humidity fixed points of binary saturated aqueous solutions. J. Res. Natl. Bur. Stand. Sect. A Phys. Chem. 1977, 81, 89–96. [Google Scholar] [CrossRef]
- Barrett, M.; Zheng, S.; Toppozini, L.; Alsop, R.J.; Dies, H.; Wang, A.; Jago, N.; Moore, M.; Rheinstädter, M.C. Solubility of cholesterol in lipid membranes and the formation of immiscible cholesterol plaques at high cholesterol concentrations. Soft Matter 2013, 9, 9342. [Google Scholar] [CrossRef]
- Mills, T.T.; Toombes, G.E.S.; Tristram-Nagle, S.; Smilgies, D.M.; Feigenson, G.W.; Nagle, J.F. Order parameters and areas in fluid-phase oriented lipid membranes using wide angle X-ray scattering. Biophys. J. 2008, 95, 669–681. [Google Scholar] [CrossRef] [PubMed]
- Barrett, M.A. Structure and Dynamics of Model Systems: From Ferrofluids to Brain Membranes. Ph.D. Thesis, McMaster University, Hamilton, ON, Canada, October 2012. [Google Scholar]
- Tristram-Nagle, S.; Liu, Y.; Legleiter, J.; Nagle, J.F. Structure of gel phase DMPC determined by X-ray diffraction. Biophys. J. 2002, 83, 3324–3335. [Google Scholar] [CrossRef]
- Kučerka, N.; Kiselev, M.A.; Balgavý, P. Determination of bilayer thickness and lipid surface area in unilamellar dimyristoylphosphatidylcholine vesicles from small-angle neutron scattering curves: A comparison of evaluation methods. Eur. Biophys. J. 2004, 33, 328–334. [Google Scholar] [CrossRef] [PubMed]
- Alsop, R.; Armstrong, C.; Maqbool, A.; Toppozini, L.; Rheinstädter, M. Cholesterol expels ibuprofen from the hydrophobic membrane core and stabilizes lamellar phases in lipid membranes containing ibuprofen. Soft Matter 2015, 11, 4756–4767. [Google Scholar] [CrossRef] [PubMed]
- Crescenzi, O.; Tomaselli, S.; Guerrini, R.; Salvadori, S.; D’Ursi, A.M.; Temussi, P.A.; Picone, D. Solution structure of the Alzheimer amyloid β-peptide (1–42) in an apolar microenvironment. Eur. J. Biochem. 2002, 269, 5642–5648. [Google Scholar] [CrossRef] [PubMed]
- De Meyer, F.J.M.; Benjamini, A.; Rodgers, J.M.; Misteli, Y.; Smit, B. Molecular simulation of the DMPC-cholesterol phase diagram. J. Phys. Chem. B 2010, 114, 10451–10461. [Google Scholar] [CrossRef] [PubMed]
- Dante, S.; Hauss, T.; Dencher, N.A. Cholesterol inhibits the insertion of the Alzheimer’s peptide A β (25–35) in lipid bilayers. Eur. Biophys. J. 2006, 35, 523–531. [Google Scholar] [CrossRef] [PubMed]
- Huang, H.W. Action of Antimicrobial Pepties: Two State Model. Biochemistry 2000, 39, 25–30. [Google Scholar] [CrossRef]
- Engelman, D.M.; Chen, Y.; Chin, C.N.; Curran, A.R.; Dixon, A.M.; Dupuy, A.D.; Lee, A.S.; Lehnert, U.; Matthews, E.E.; Reshetnyak, Y.K.; et al. Membrane protein folding: Beyond the two stage model. FEBS Lett. 2003, 555, 122–125. [Google Scholar] [CrossRef]
- Heyden, M.; Freites, J.A.; Ulmschneider, M.B.; White, S.H.; Tobias, D.J. Assembly and stability of α-helical membrane proteins. Soft Matter 2012, 8, 7742–7752. [Google Scholar] [CrossRef] [PubMed]
- Ulmschneider, J.P.; Smith, J.C.; White, S.H.; Ulmschneider, M.B. In silico partitioning and transmembrane insertion of hydrophobic peptides under equilibrium conditions. J. Am. Chem. Soc. 2011, 133, 15487–15495. [Google Scholar] [CrossRef] [PubMed]
- Dante, S.; Hauß, T.; Steitz, R.; Canale, C.; Dencher, N.A. Nanoscale structural and mechanical effects of β-amyloid (1–42) on polymer cushioned membranes: A combined study by neutron reflectometry and AFM Force Spectroscopy. Biochim. Biophys. Acta 2011, 1808, 2646–2655. [Google Scholar] [CrossRef] [PubMed]
© 2015 by the authors; licensee MDPI, Basel, Switzerland. This article is an open access article distributed under the terms and conditions of the Creative Commons Attribution license (http://creativecommons.org/licenses/by/4.0/).
Share and Cite
Barrett, M.A.; Alsop, R.J.; Hauß, T.; Rheinstädter, M.C. The Position of Aβ22-40 and Aβ1-42 in Anionic Lipid Membranes Containing Cholesterol. Membranes 2015, 5, 824-843. https://doi.org/10.3390/membranes5040824
Barrett MA, Alsop RJ, Hauß T, Rheinstädter MC. The Position of Aβ22-40 and Aβ1-42 in Anionic Lipid Membranes Containing Cholesterol. Membranes. 2015; 5(4):824-843. https://doi.org/10.3390/membranes5040824
Chicago/Turabian StyleBarrett, Matthew A., Richard J. Alsop, Thomas Hauß, and Maikel C. Rheinstädter. 2015. "The Position of Aβ22-40 and Aβ1-42 in Anionic Lipid Membranes Containing Cholesterol" Membranes 5, no. 4: 824-843. https://doi.org/10.3390/membranes5040824
APA StyleBarrett, M. A., Alsop, R. J., Hauß, T., & Rheinstädter, M. C. (2015). The Position of Aβ22-40 and Aβ1-42 in Anionic Lipid Membranes Containing Cholesterol. Membranes, 5(4), 824-843. https://doi.org/10.3390/membranes5040824