
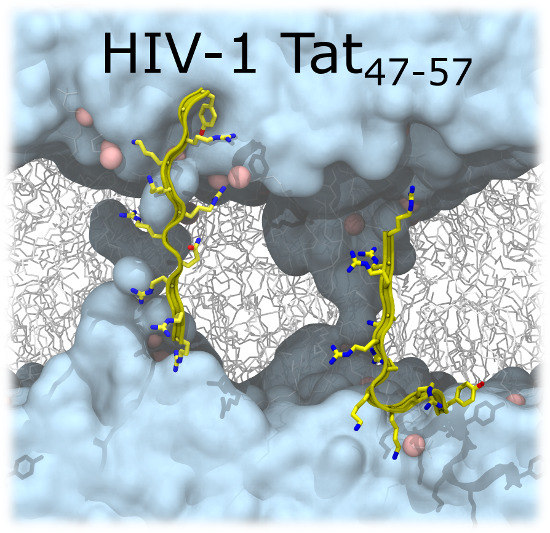
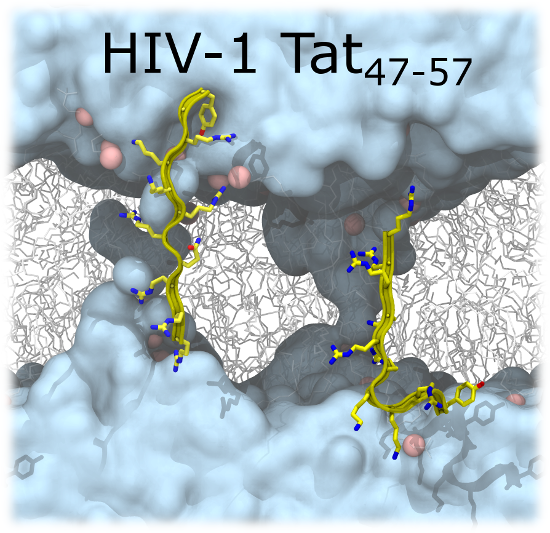
Penetration of HIV-1 Tat47–57 into PC/PE Bilayers Assessed by MD Simulation and X-ray Scattering

Abstract
:
1. Introduction
2. Results
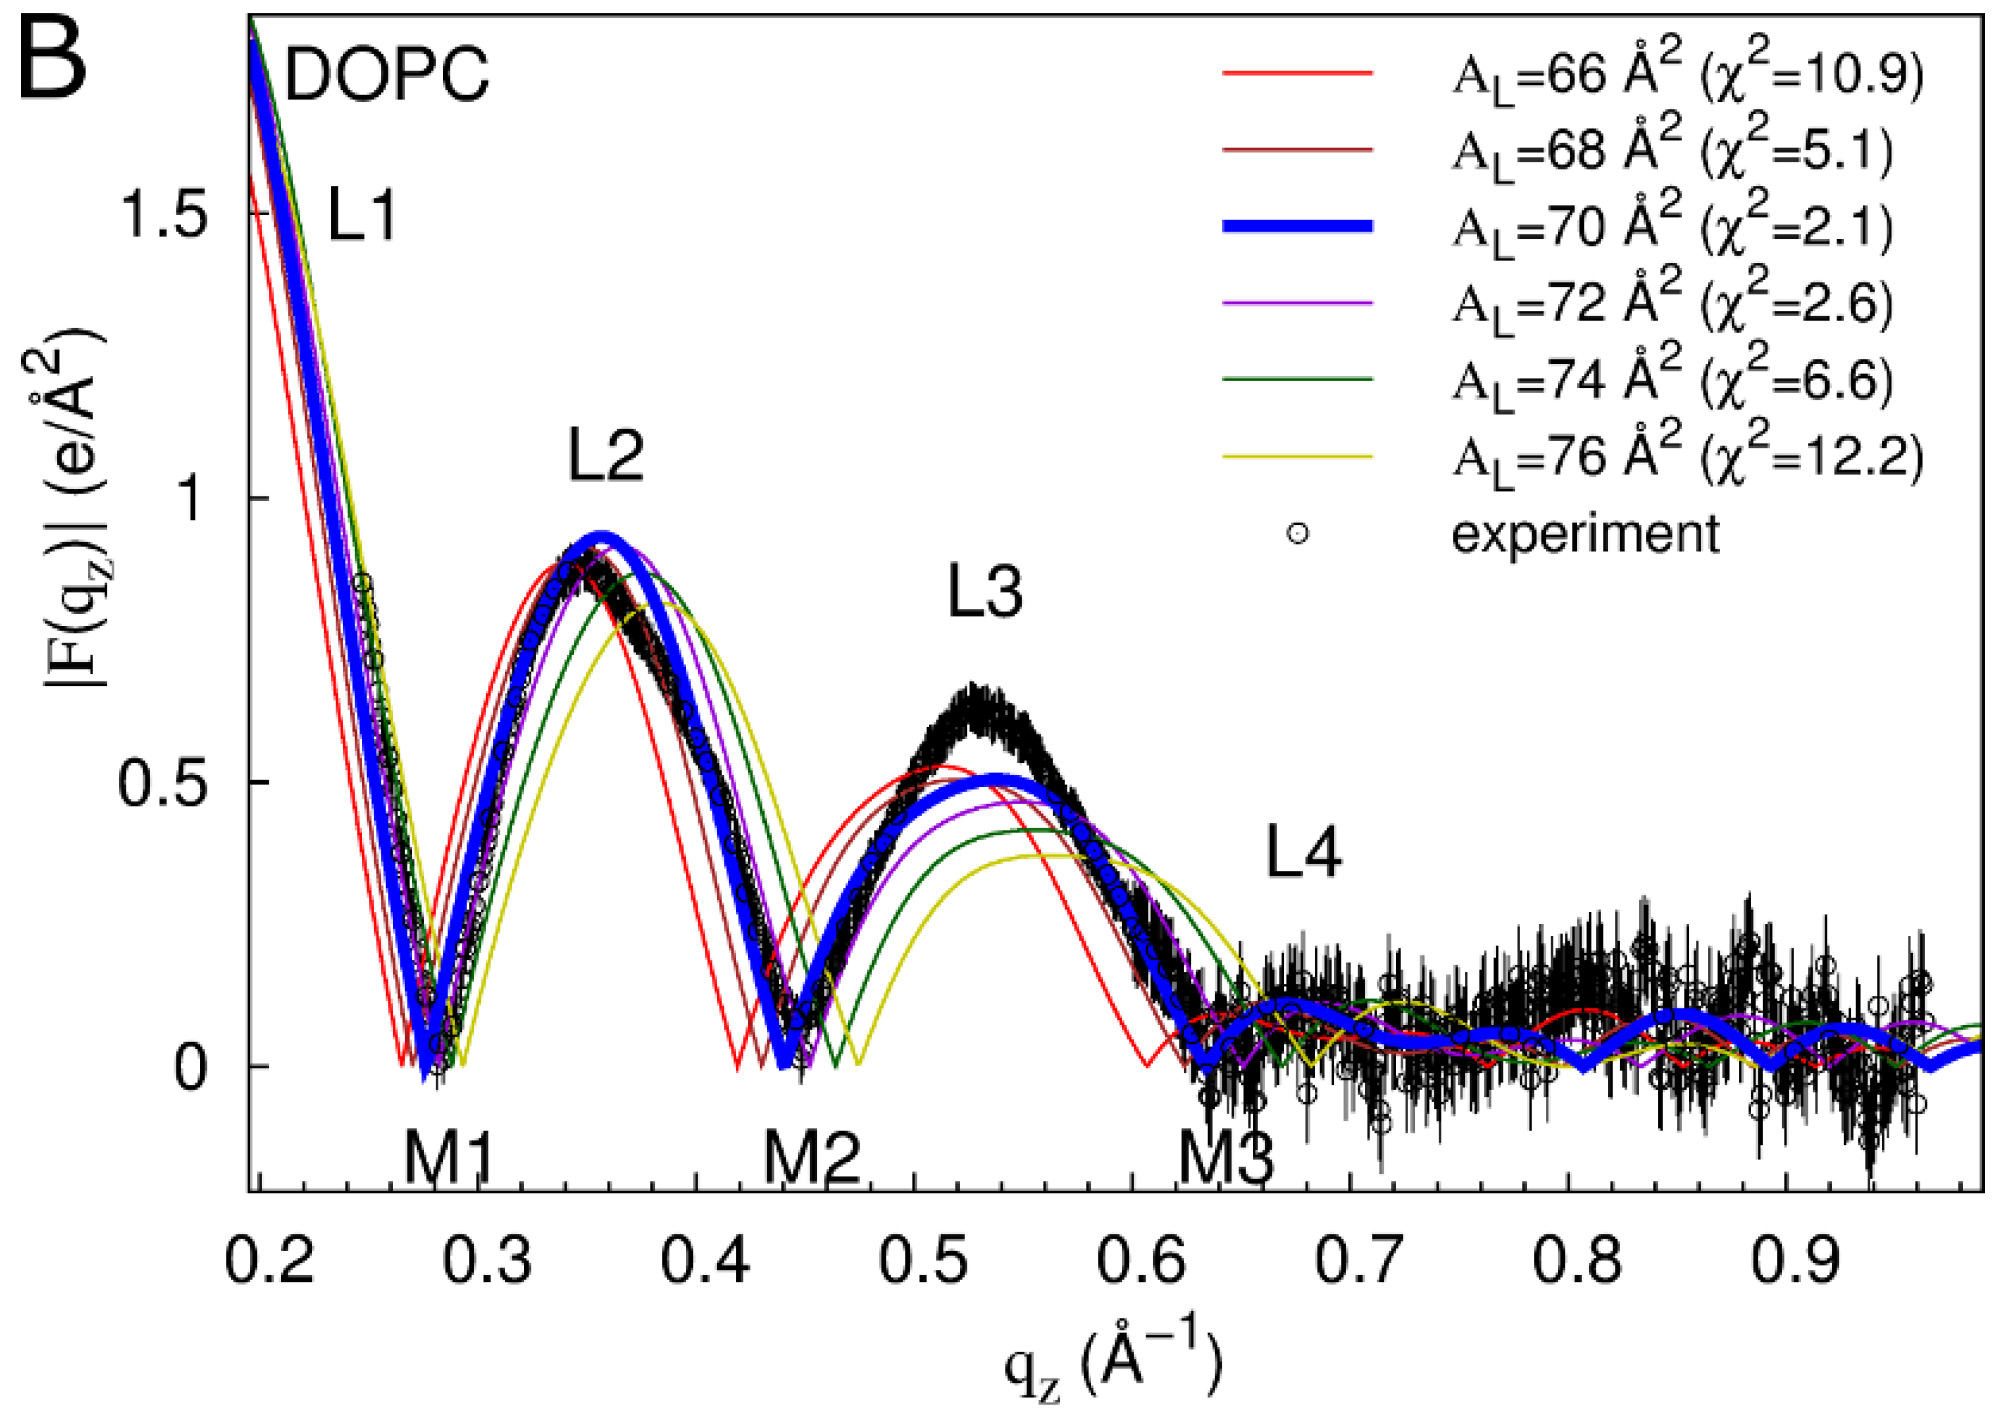
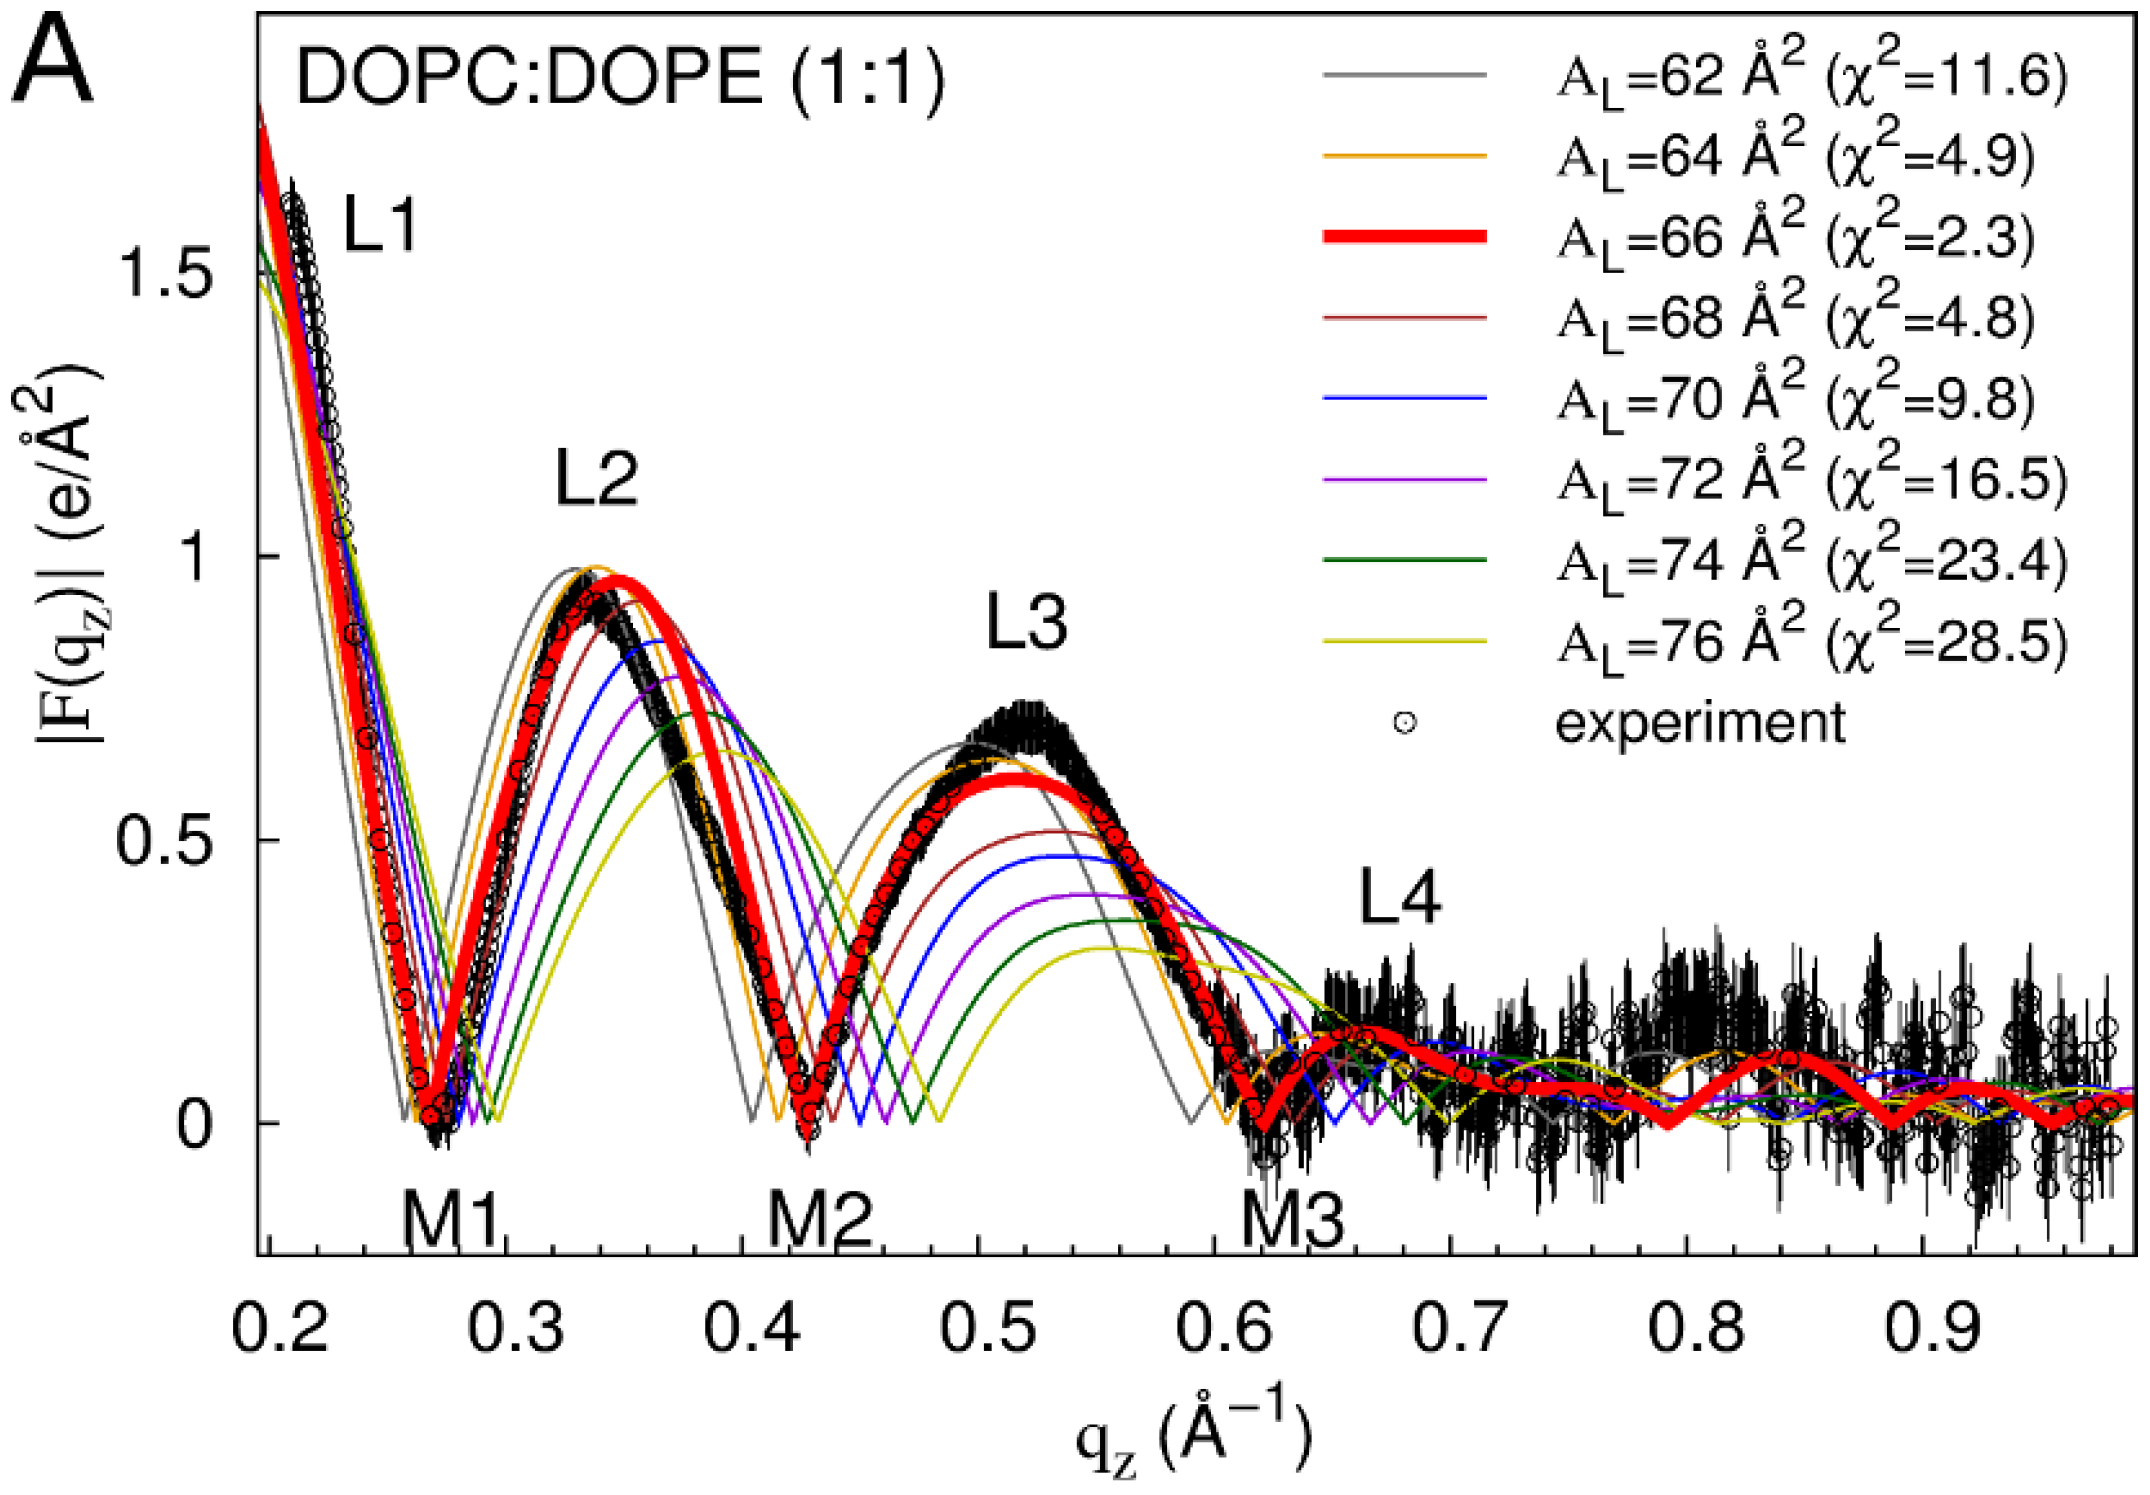
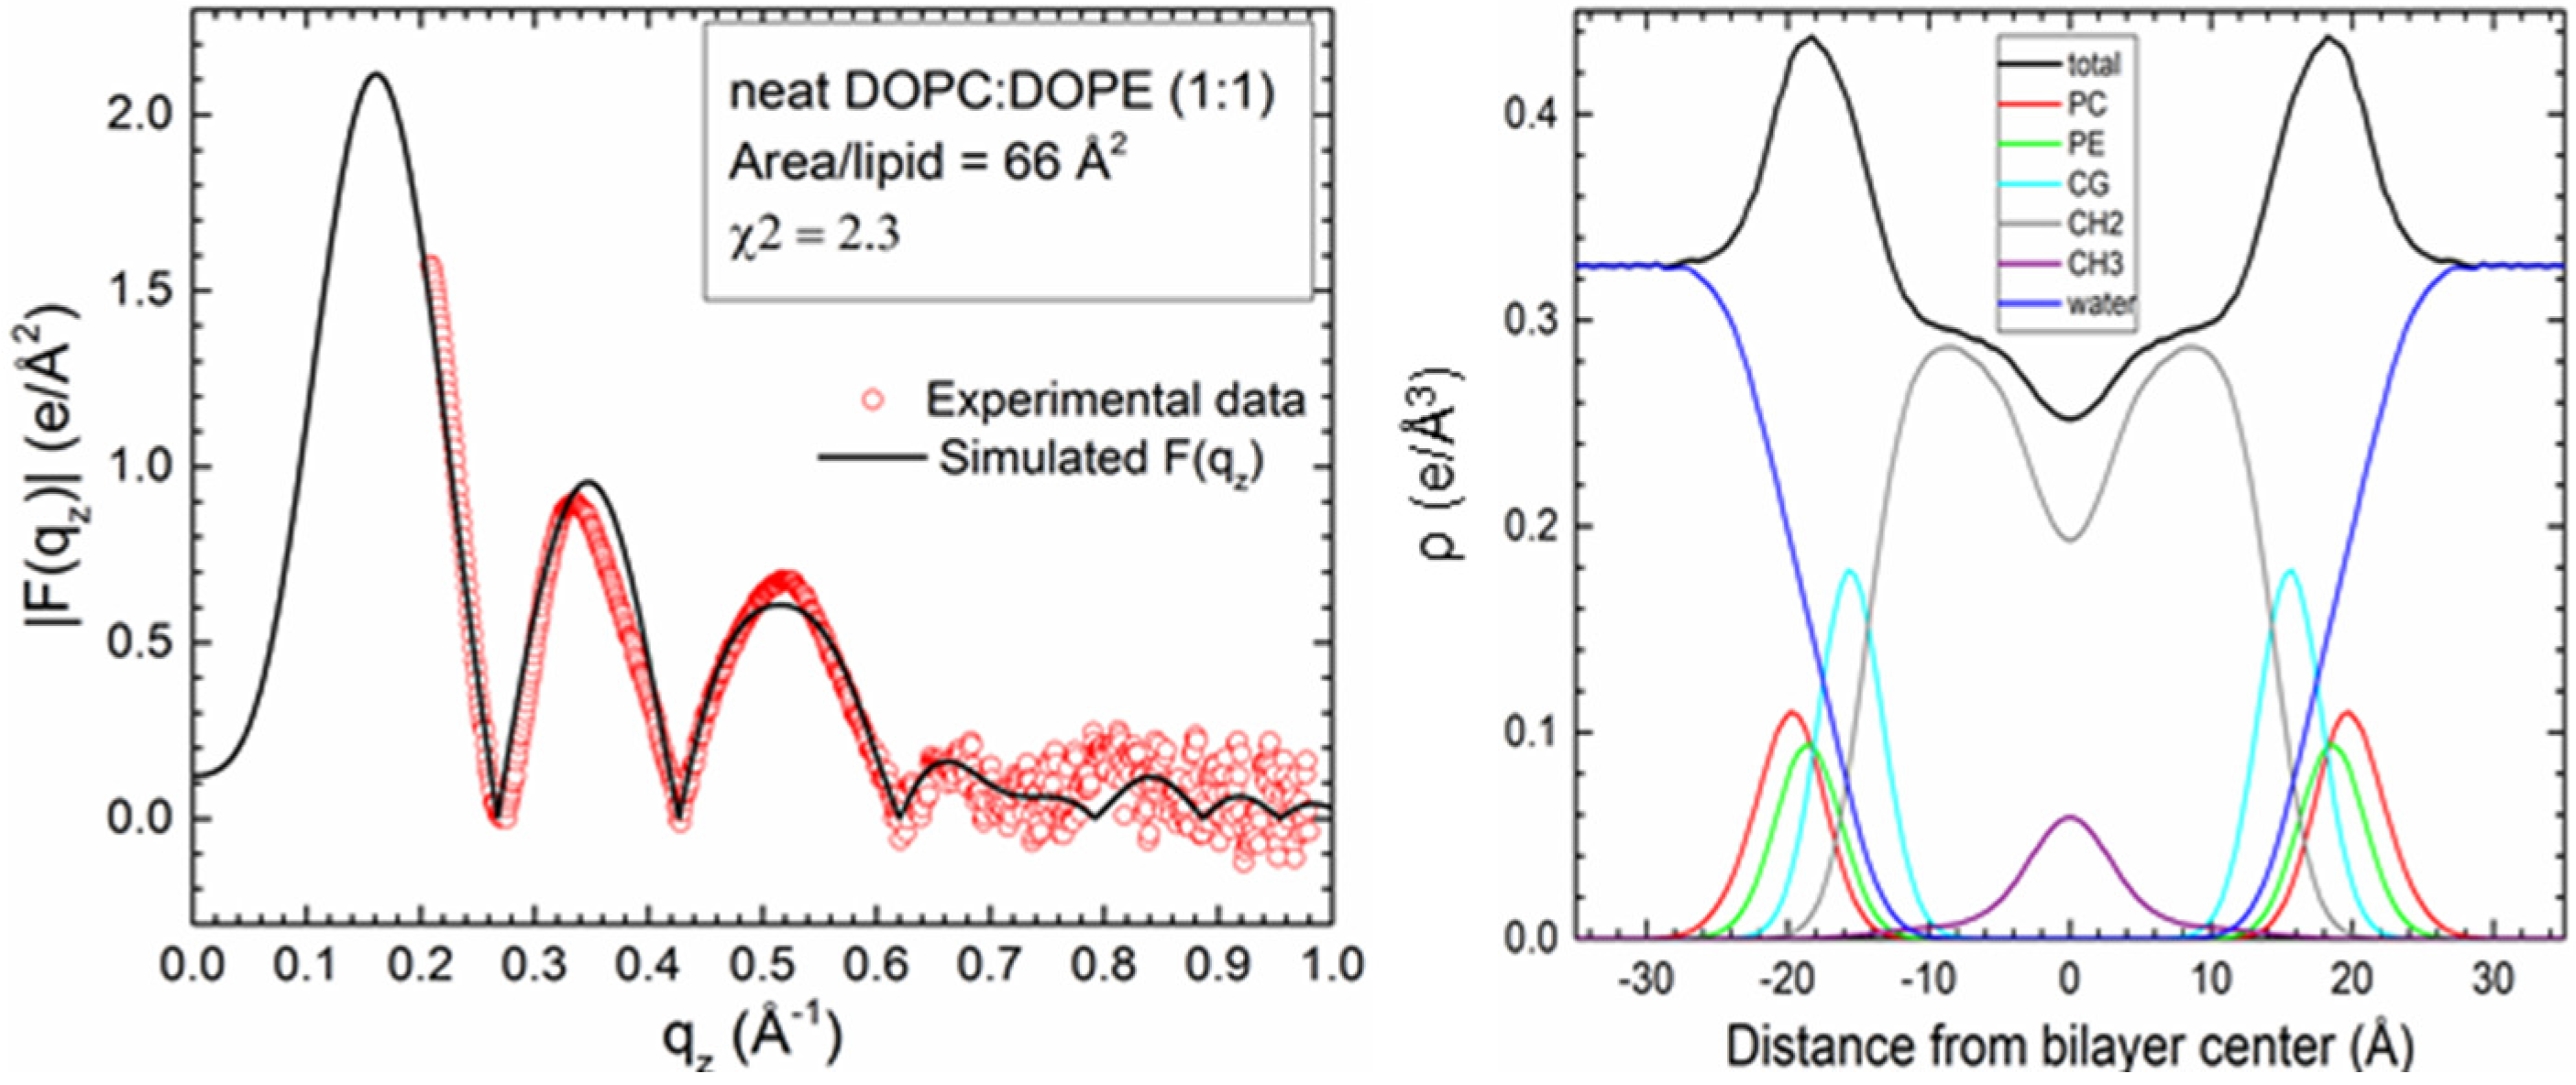
2.1. Neat Bilayers

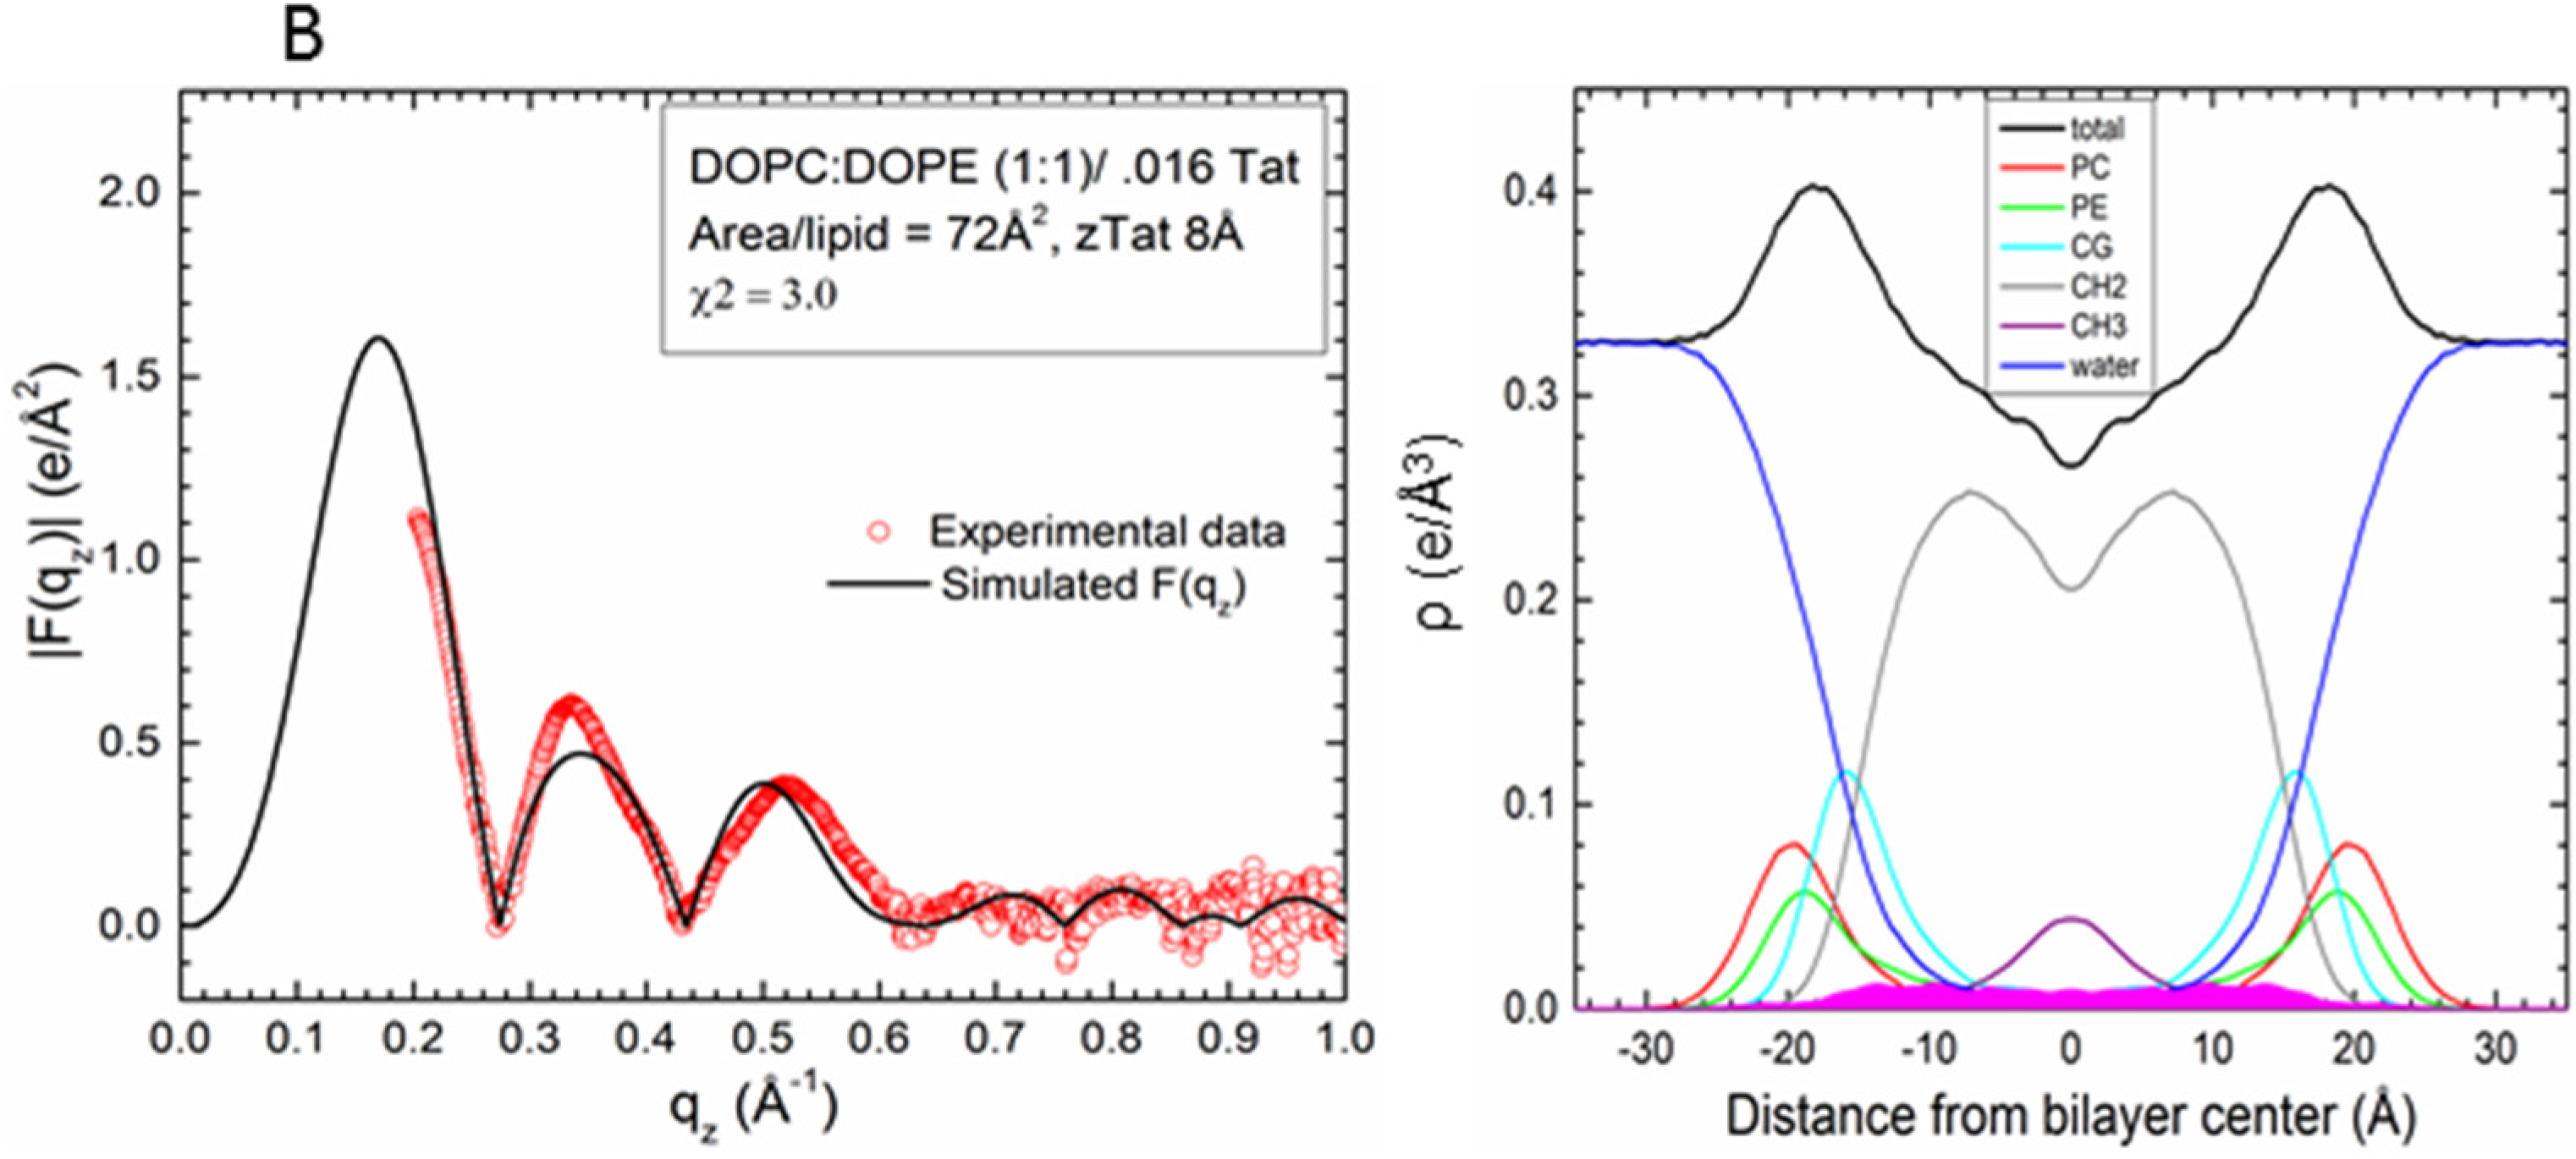
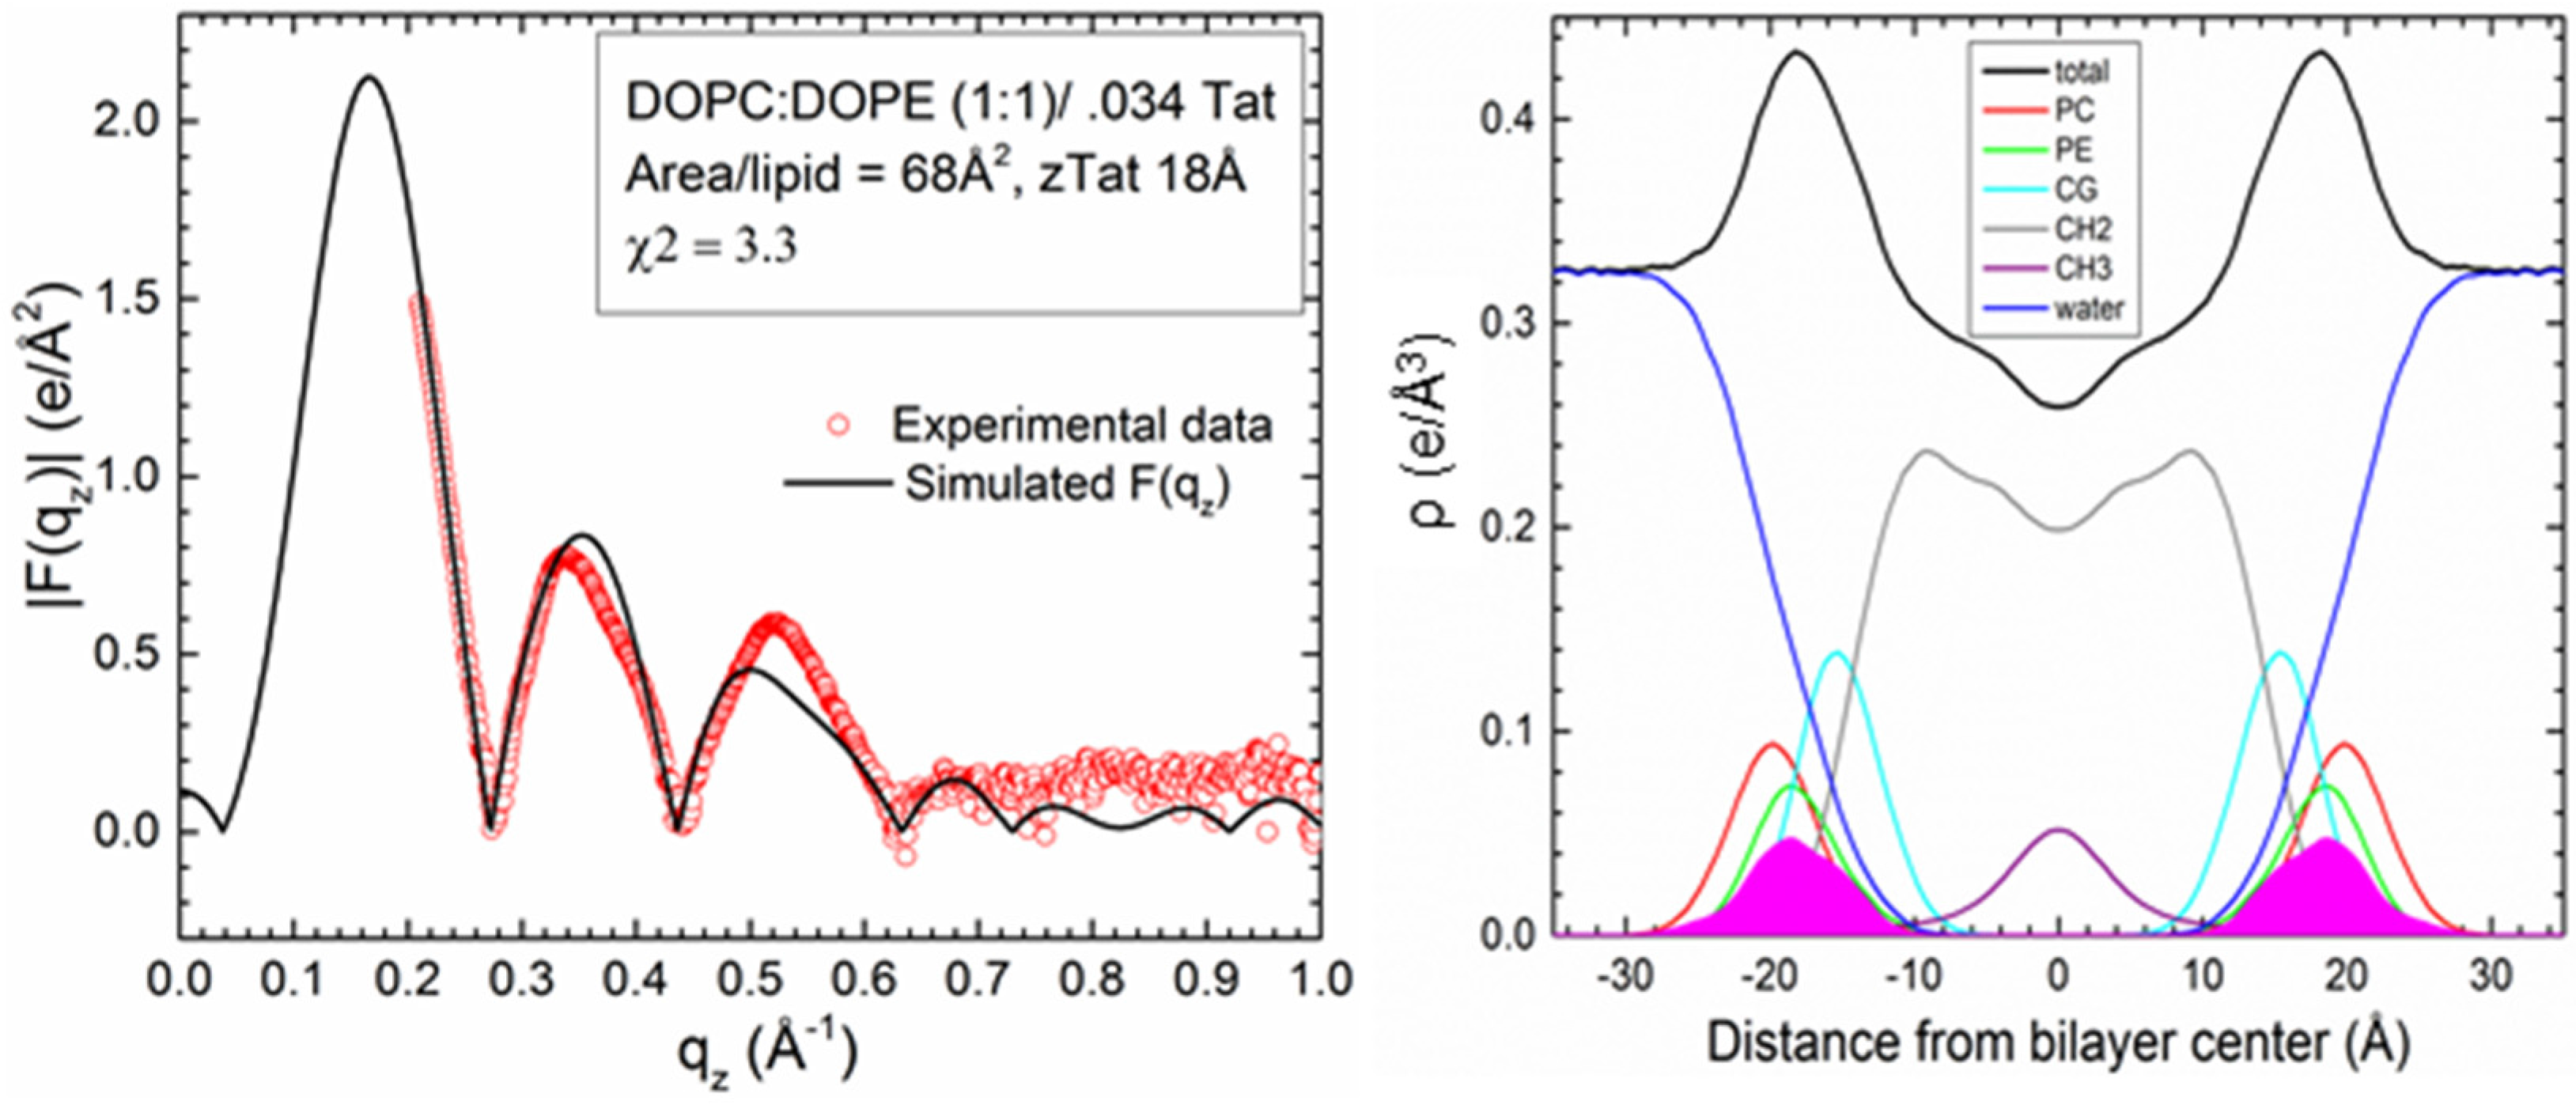
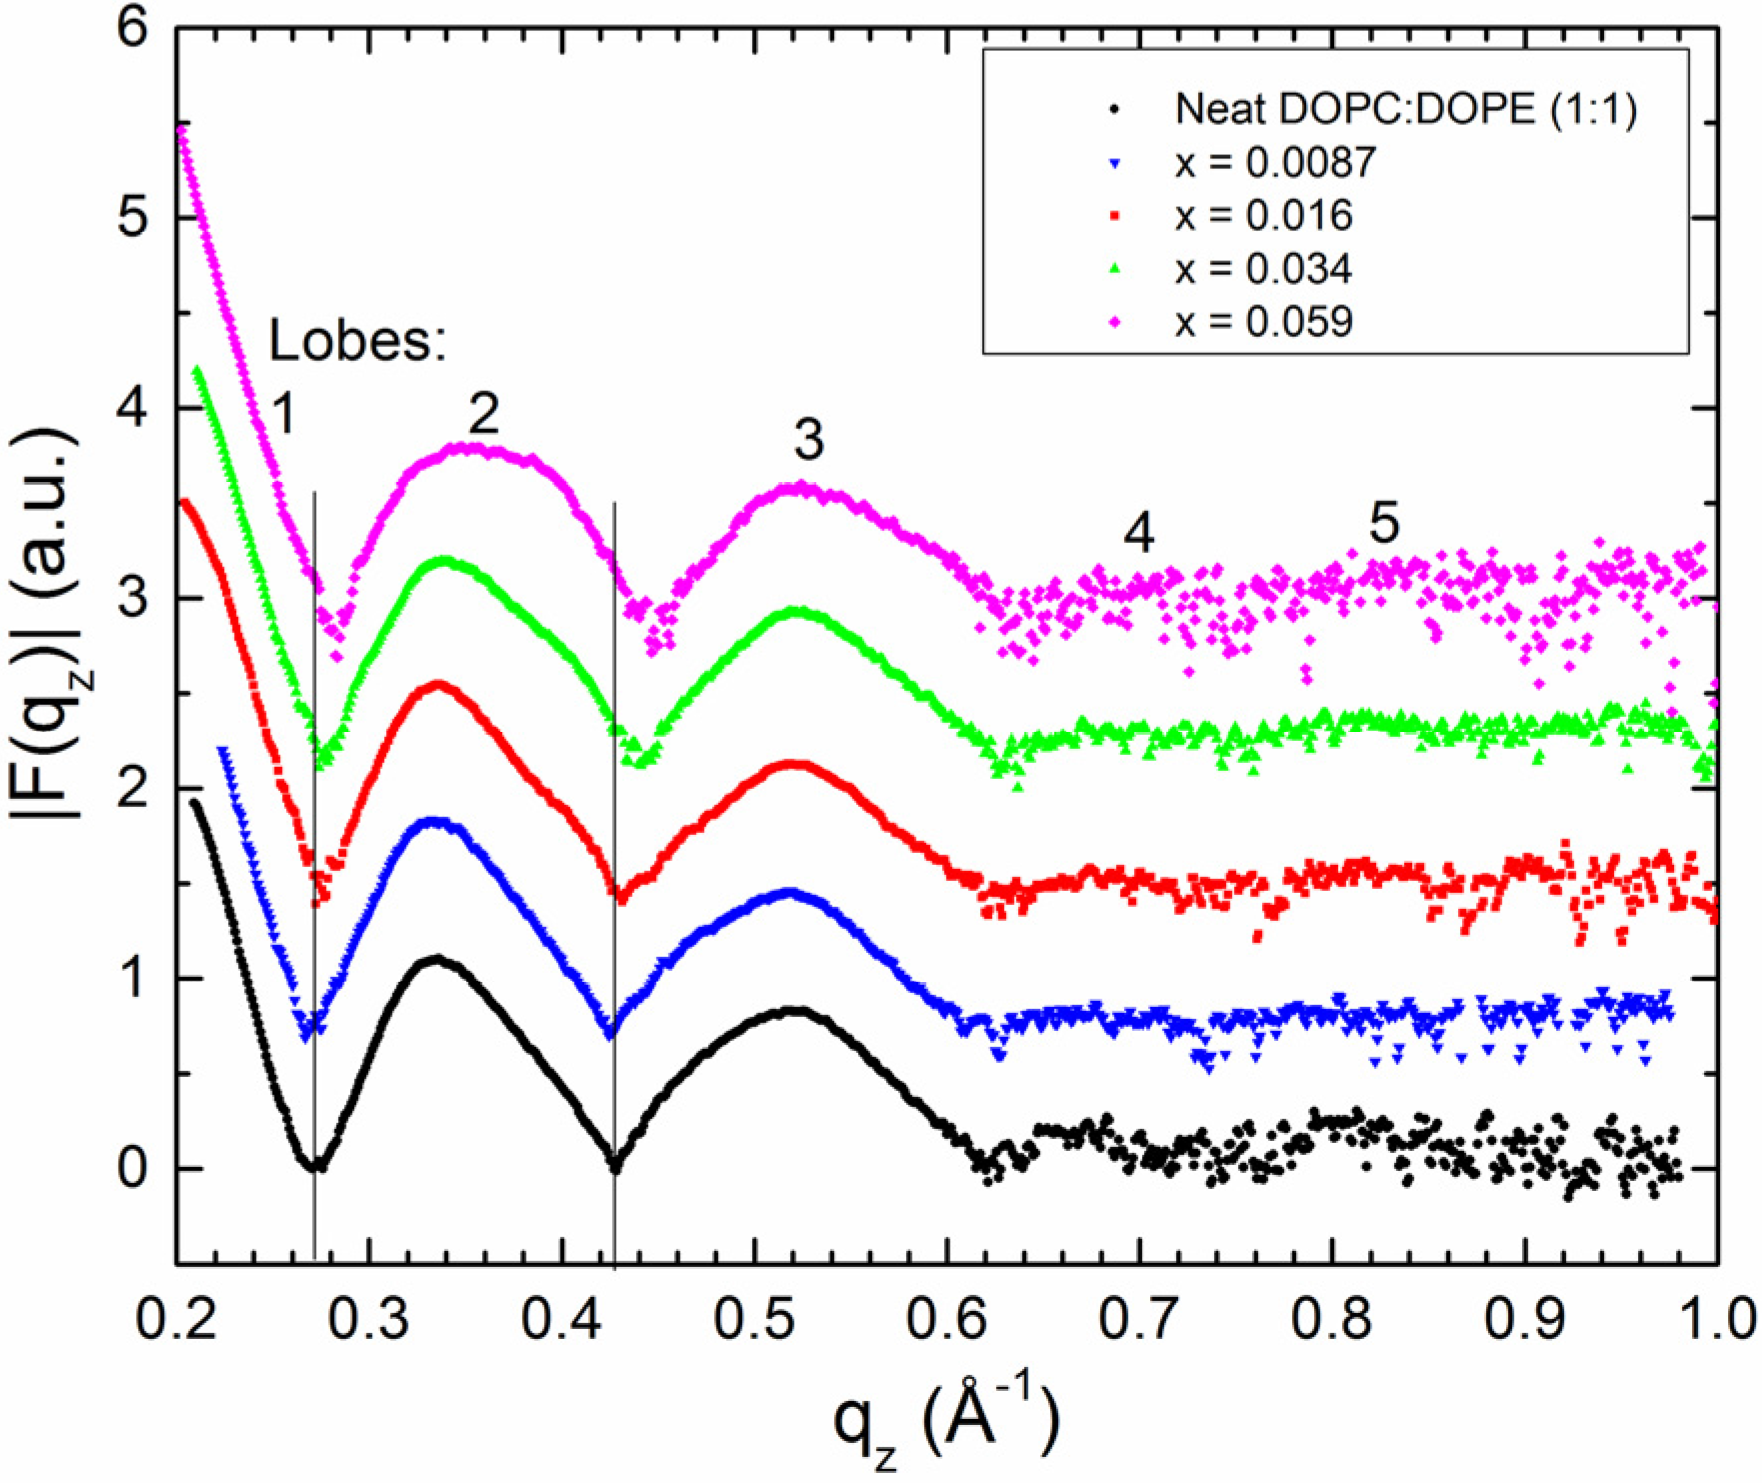
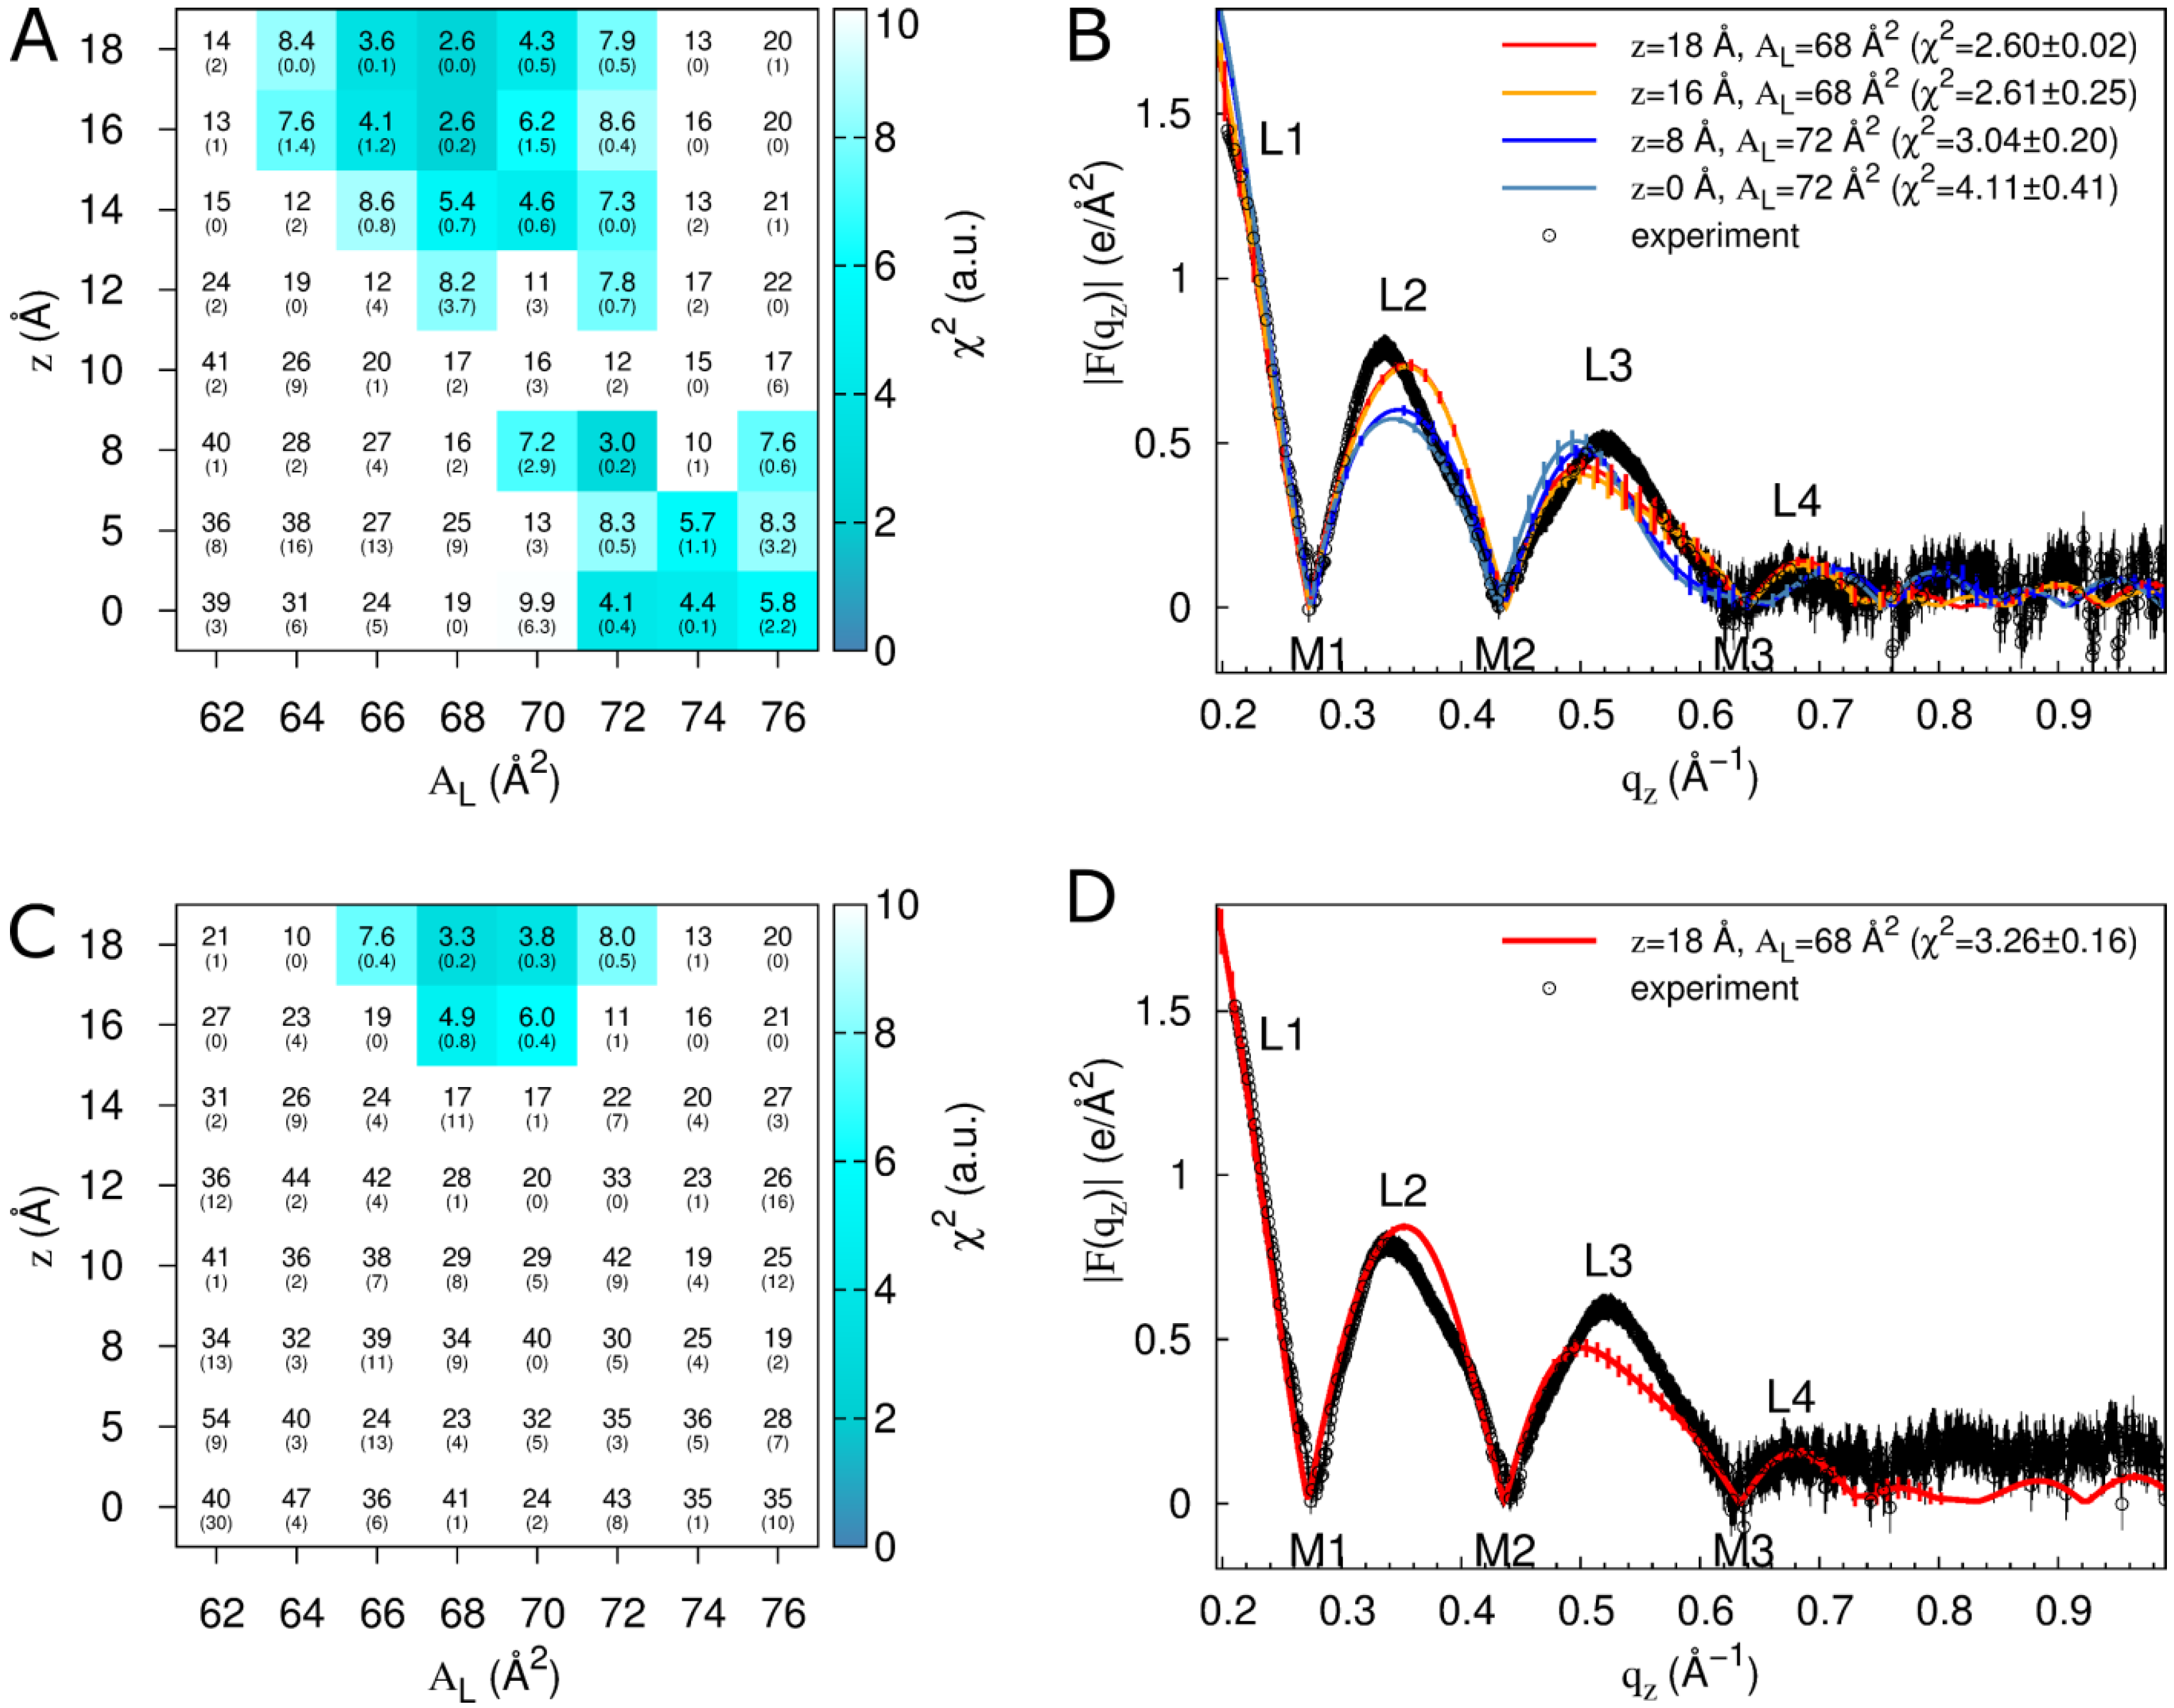
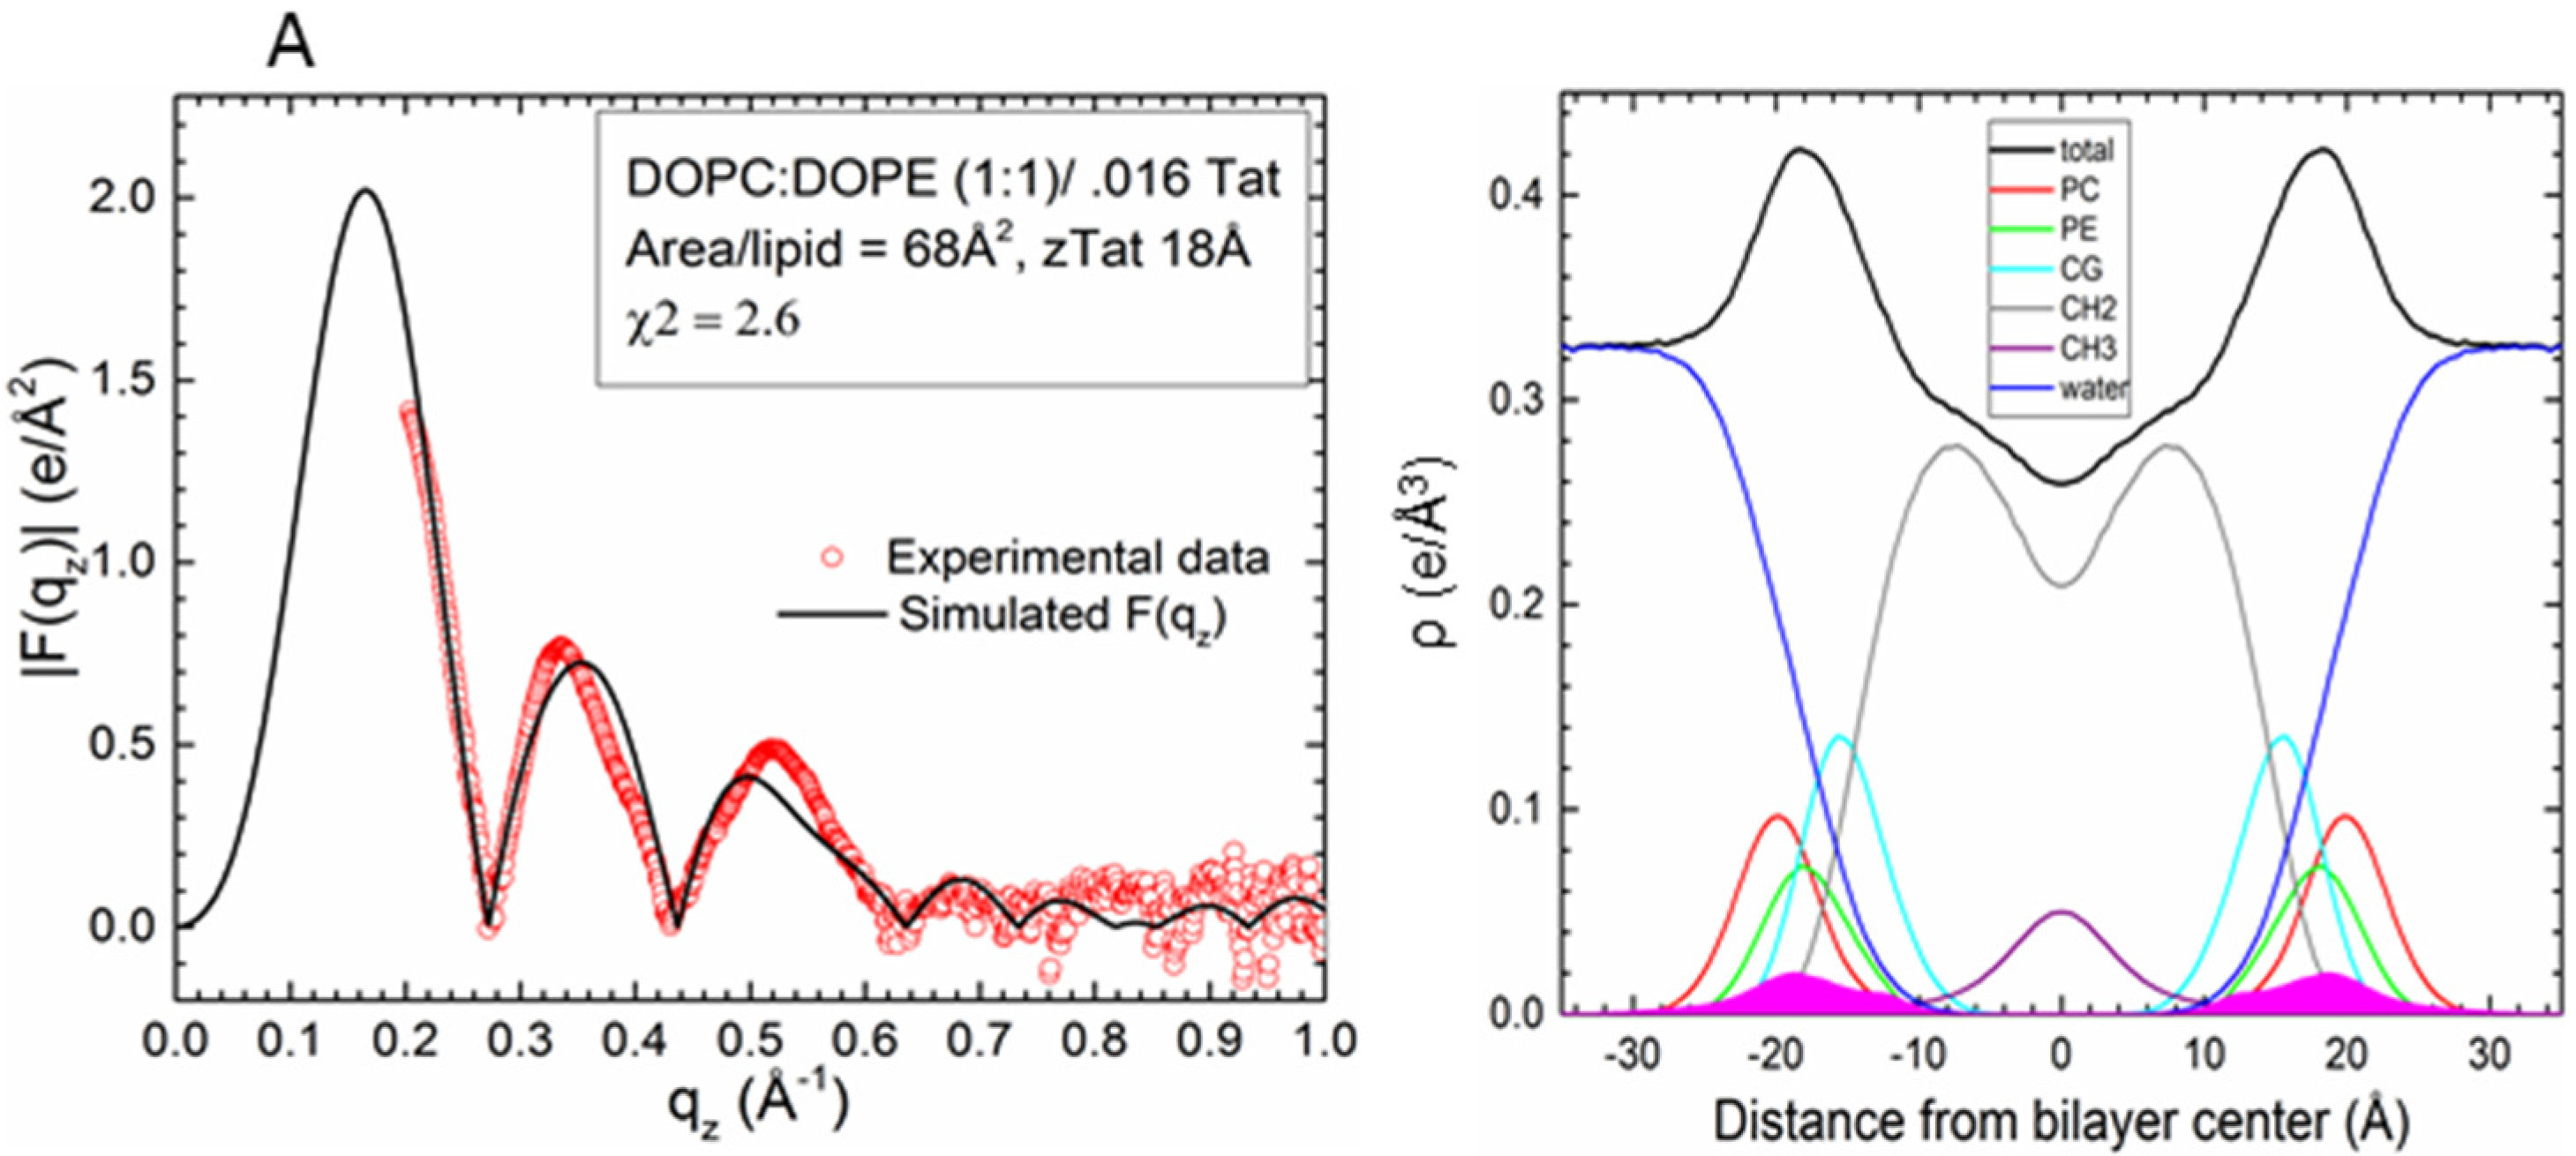
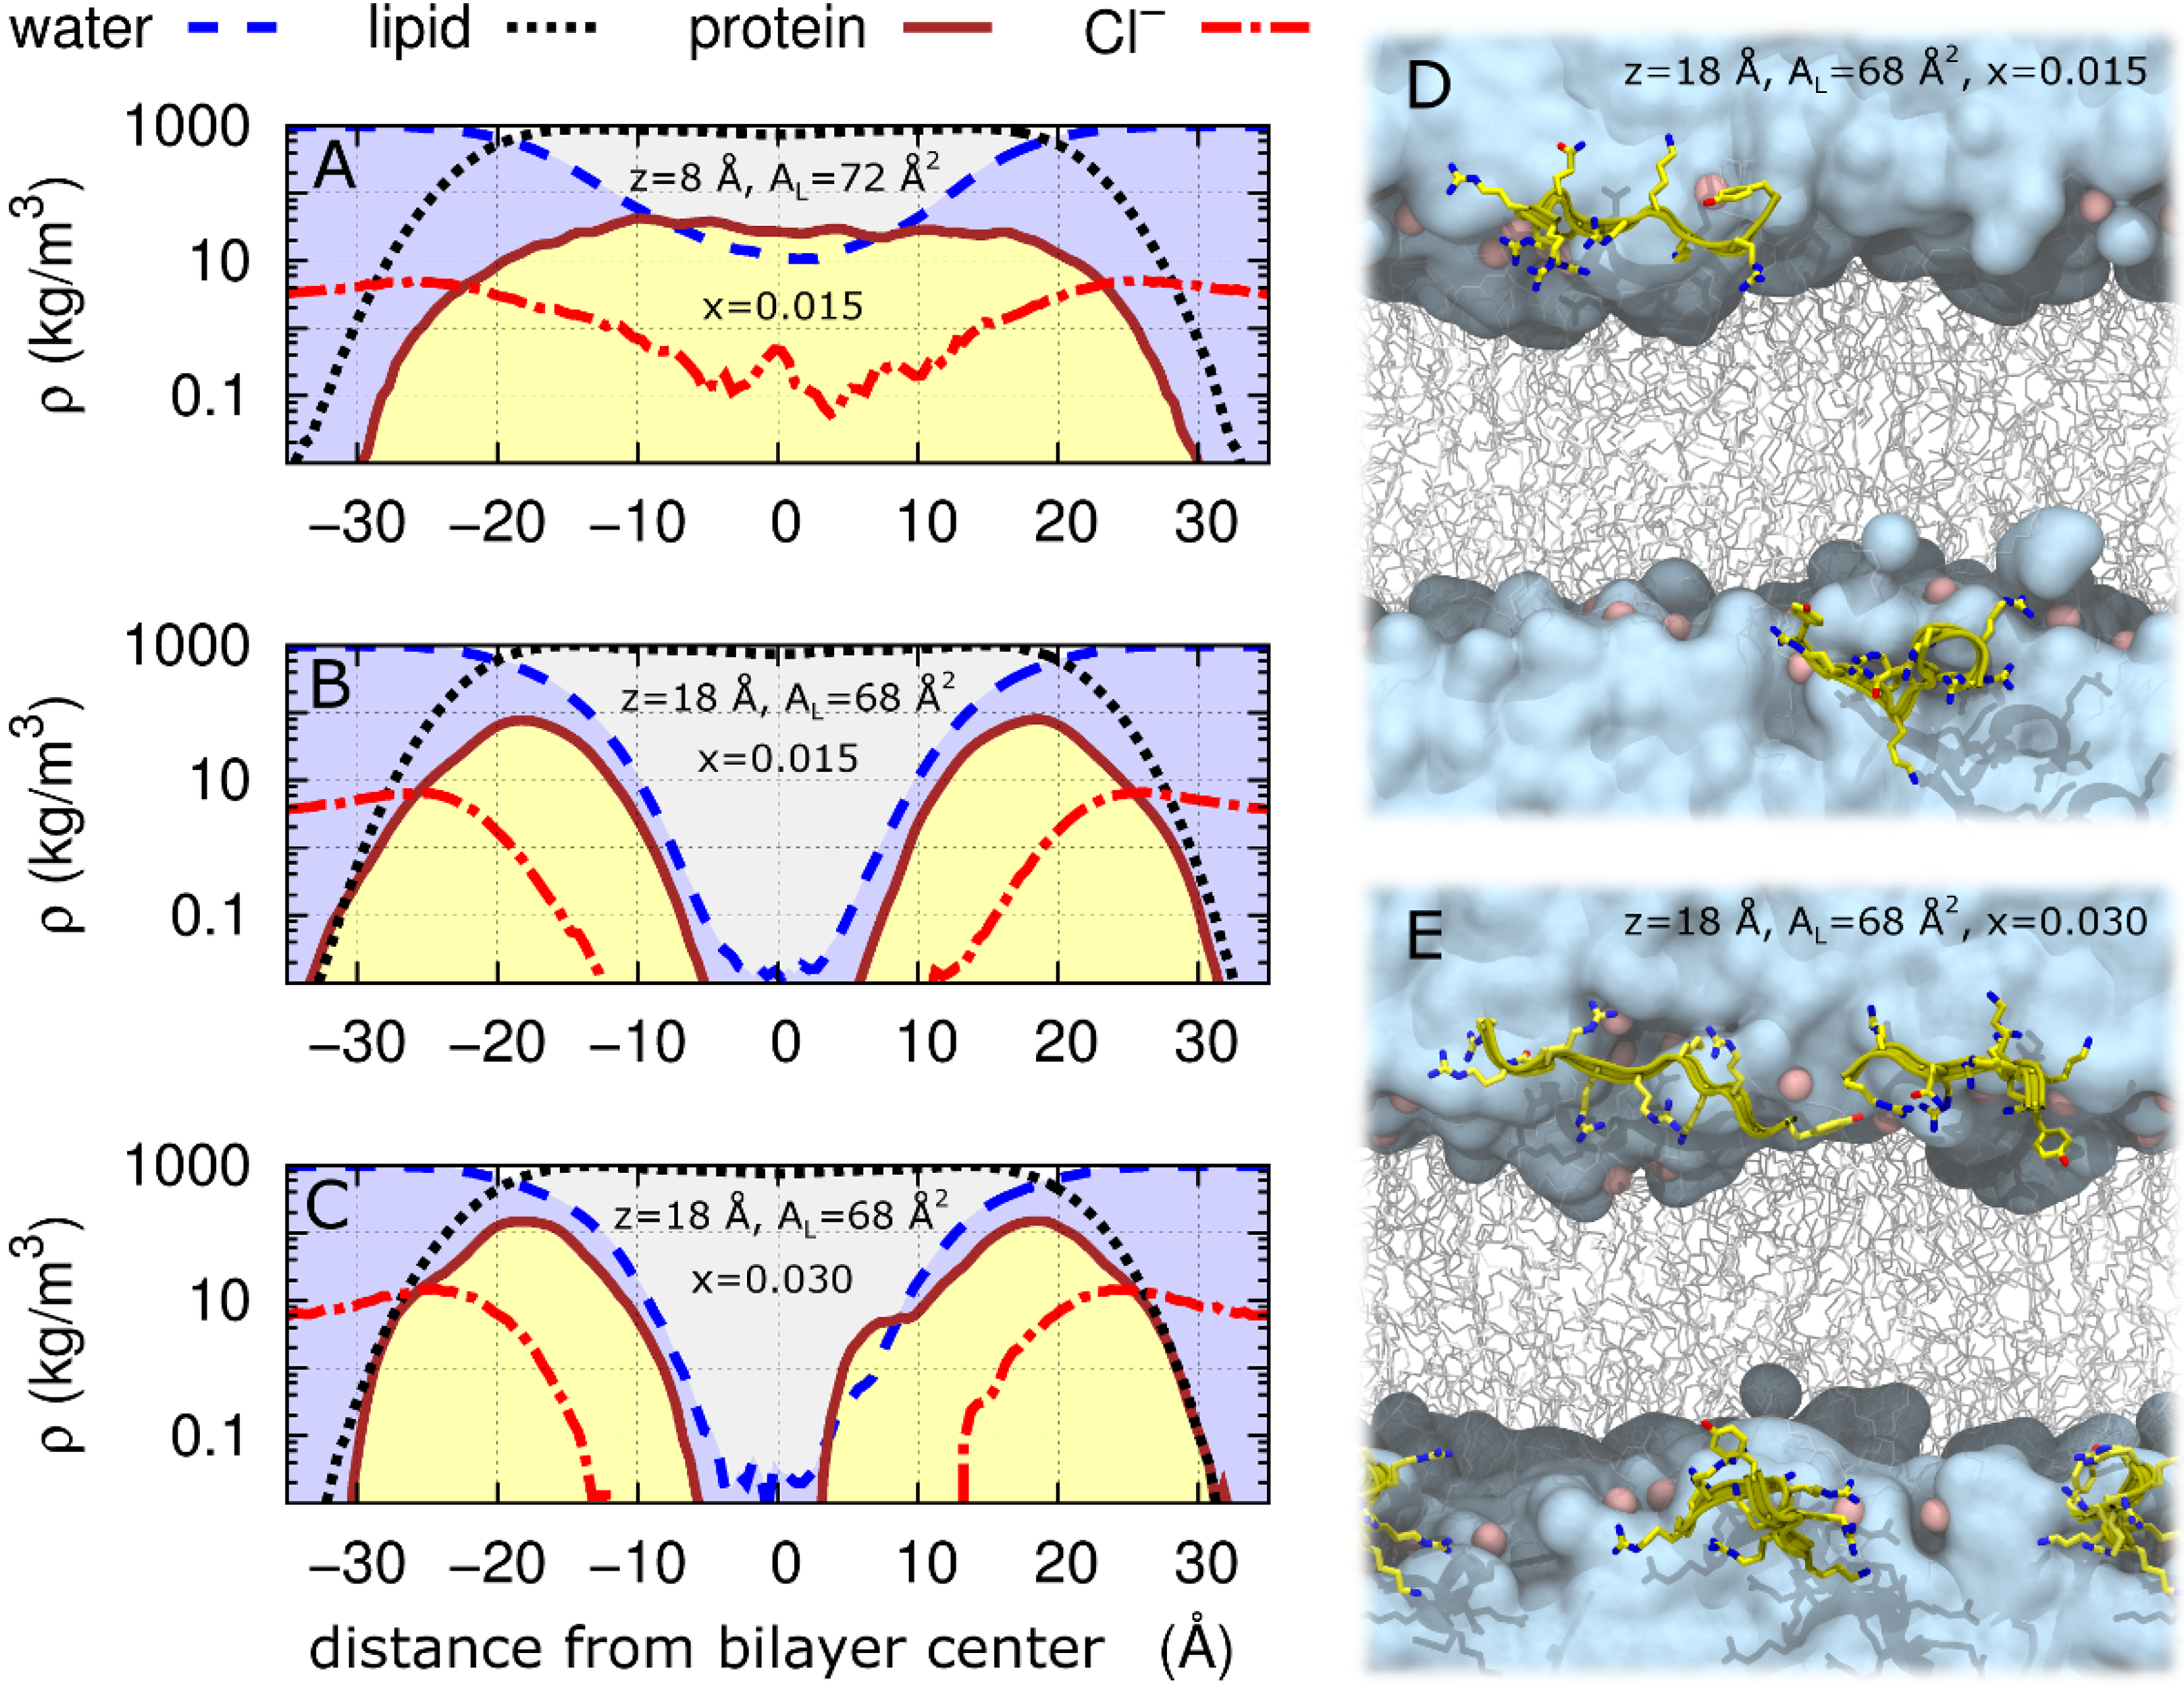
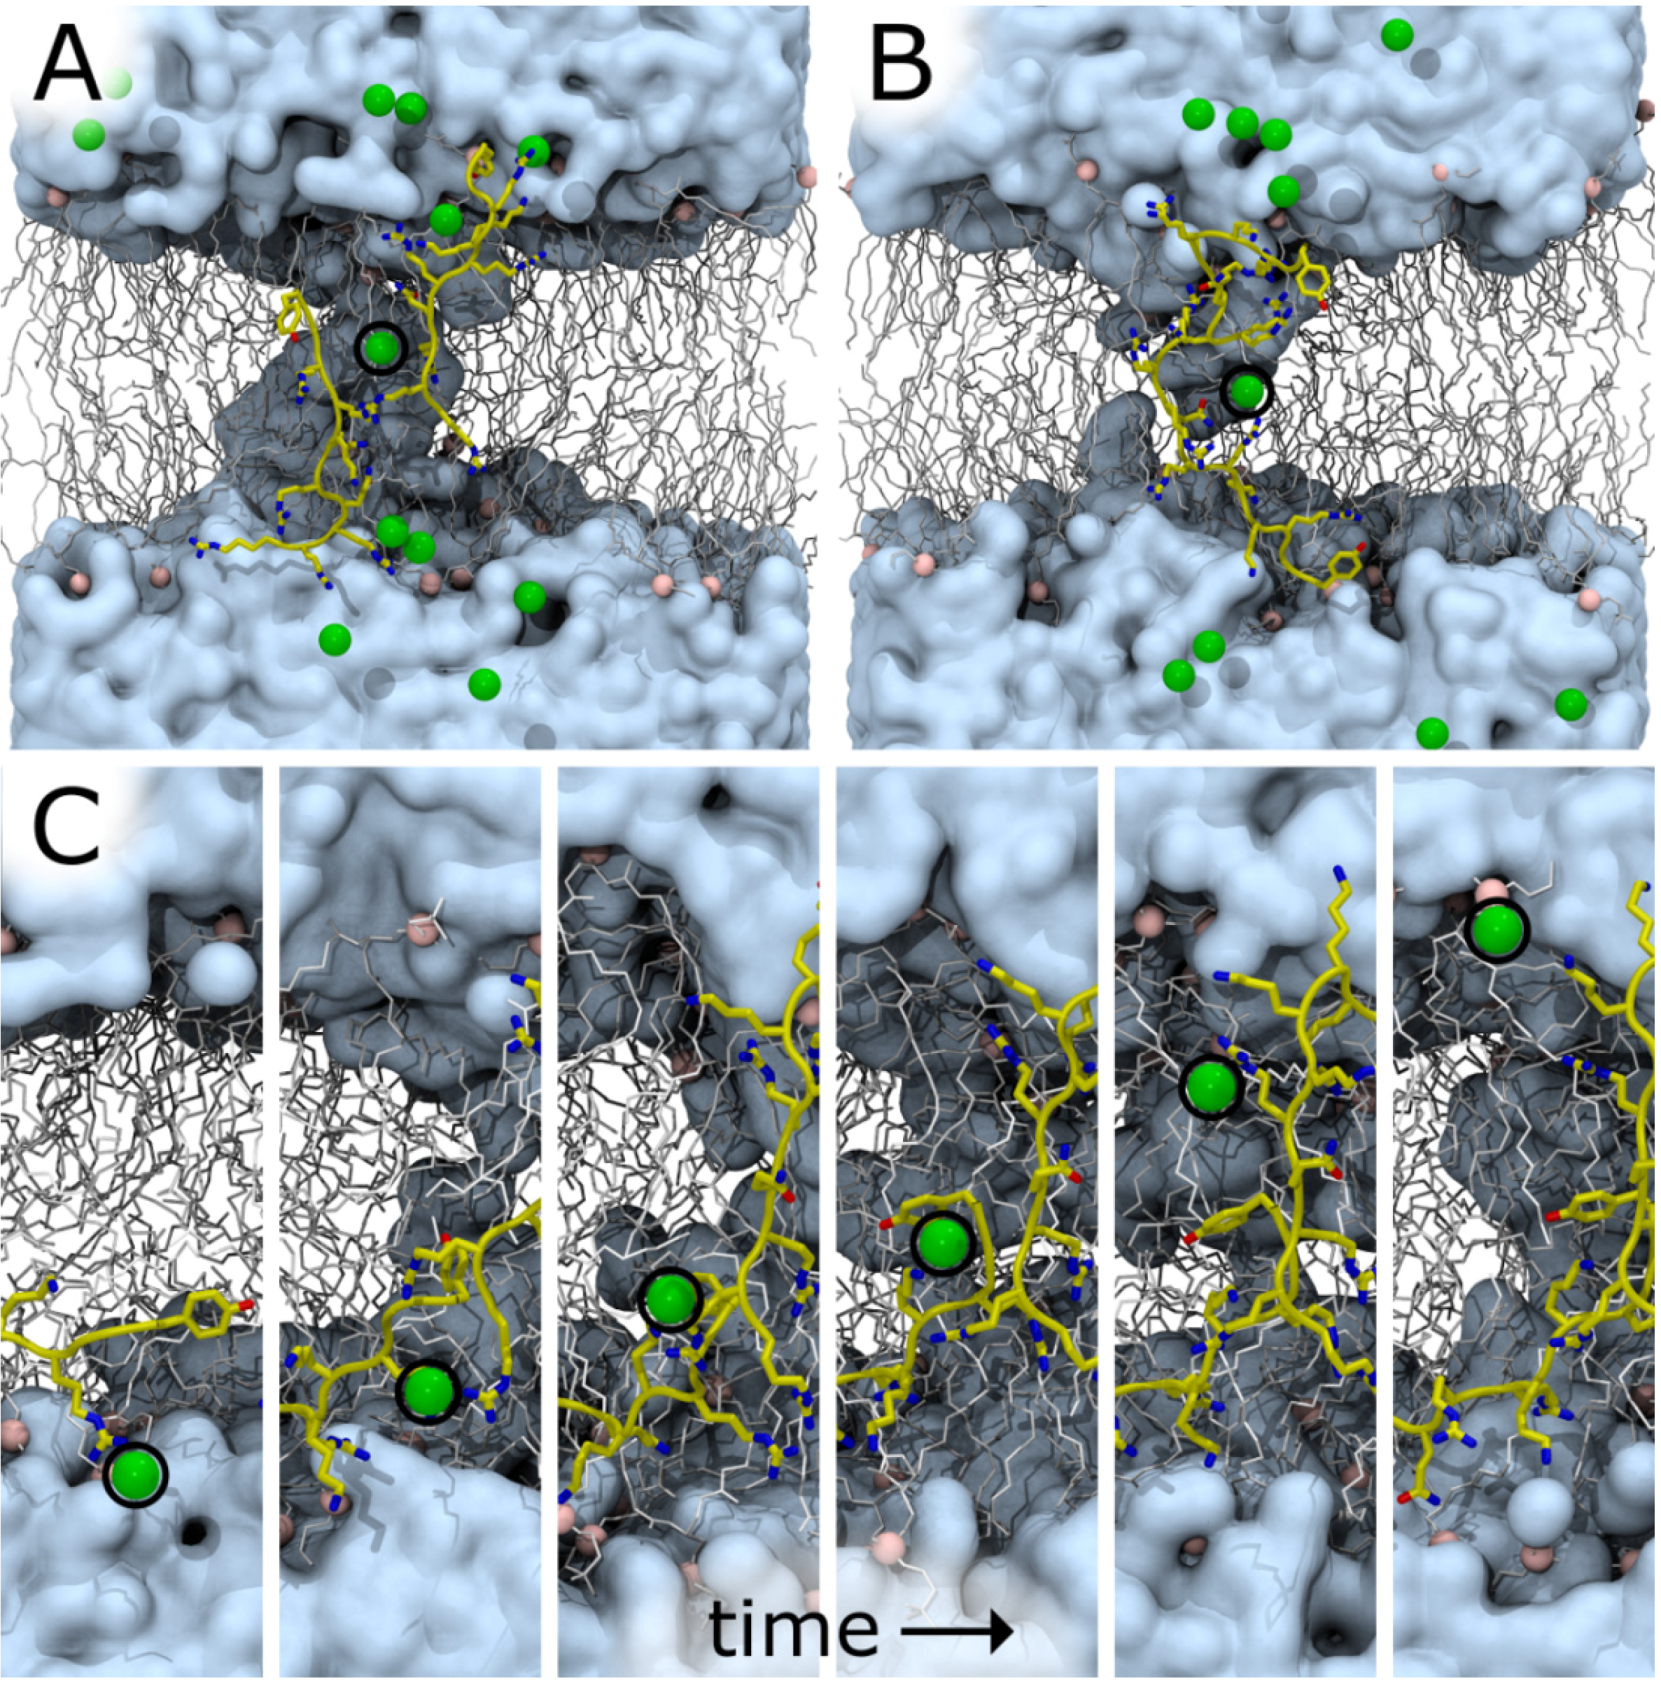
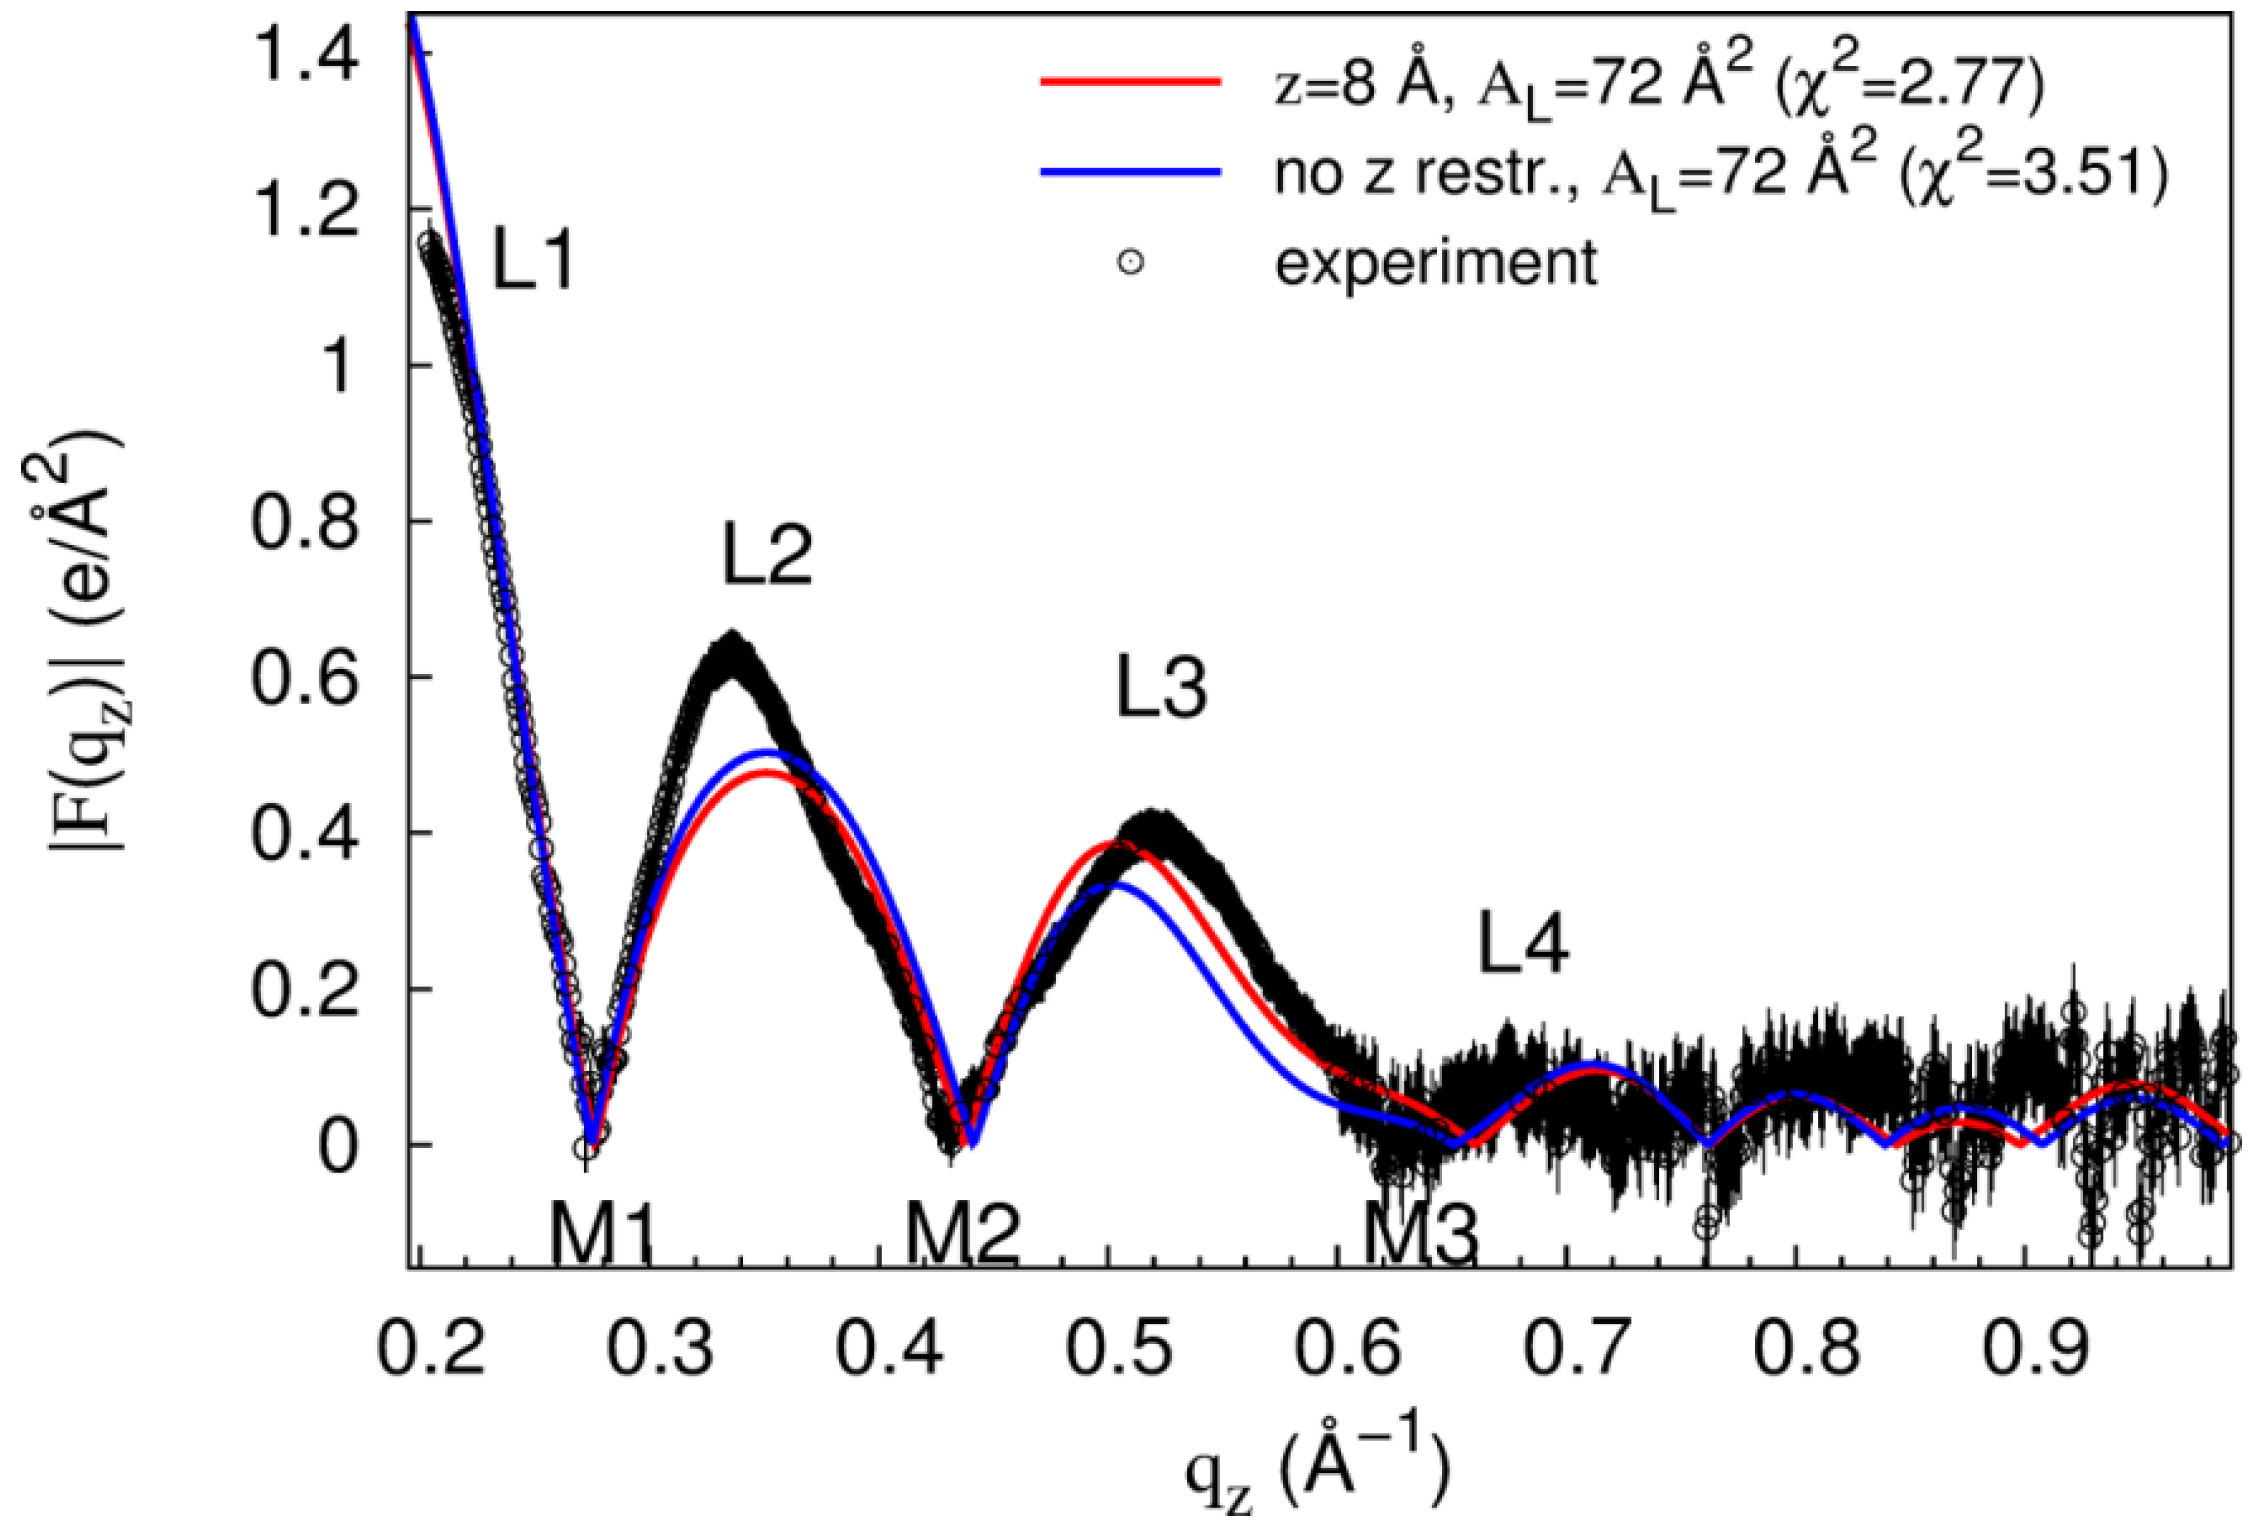
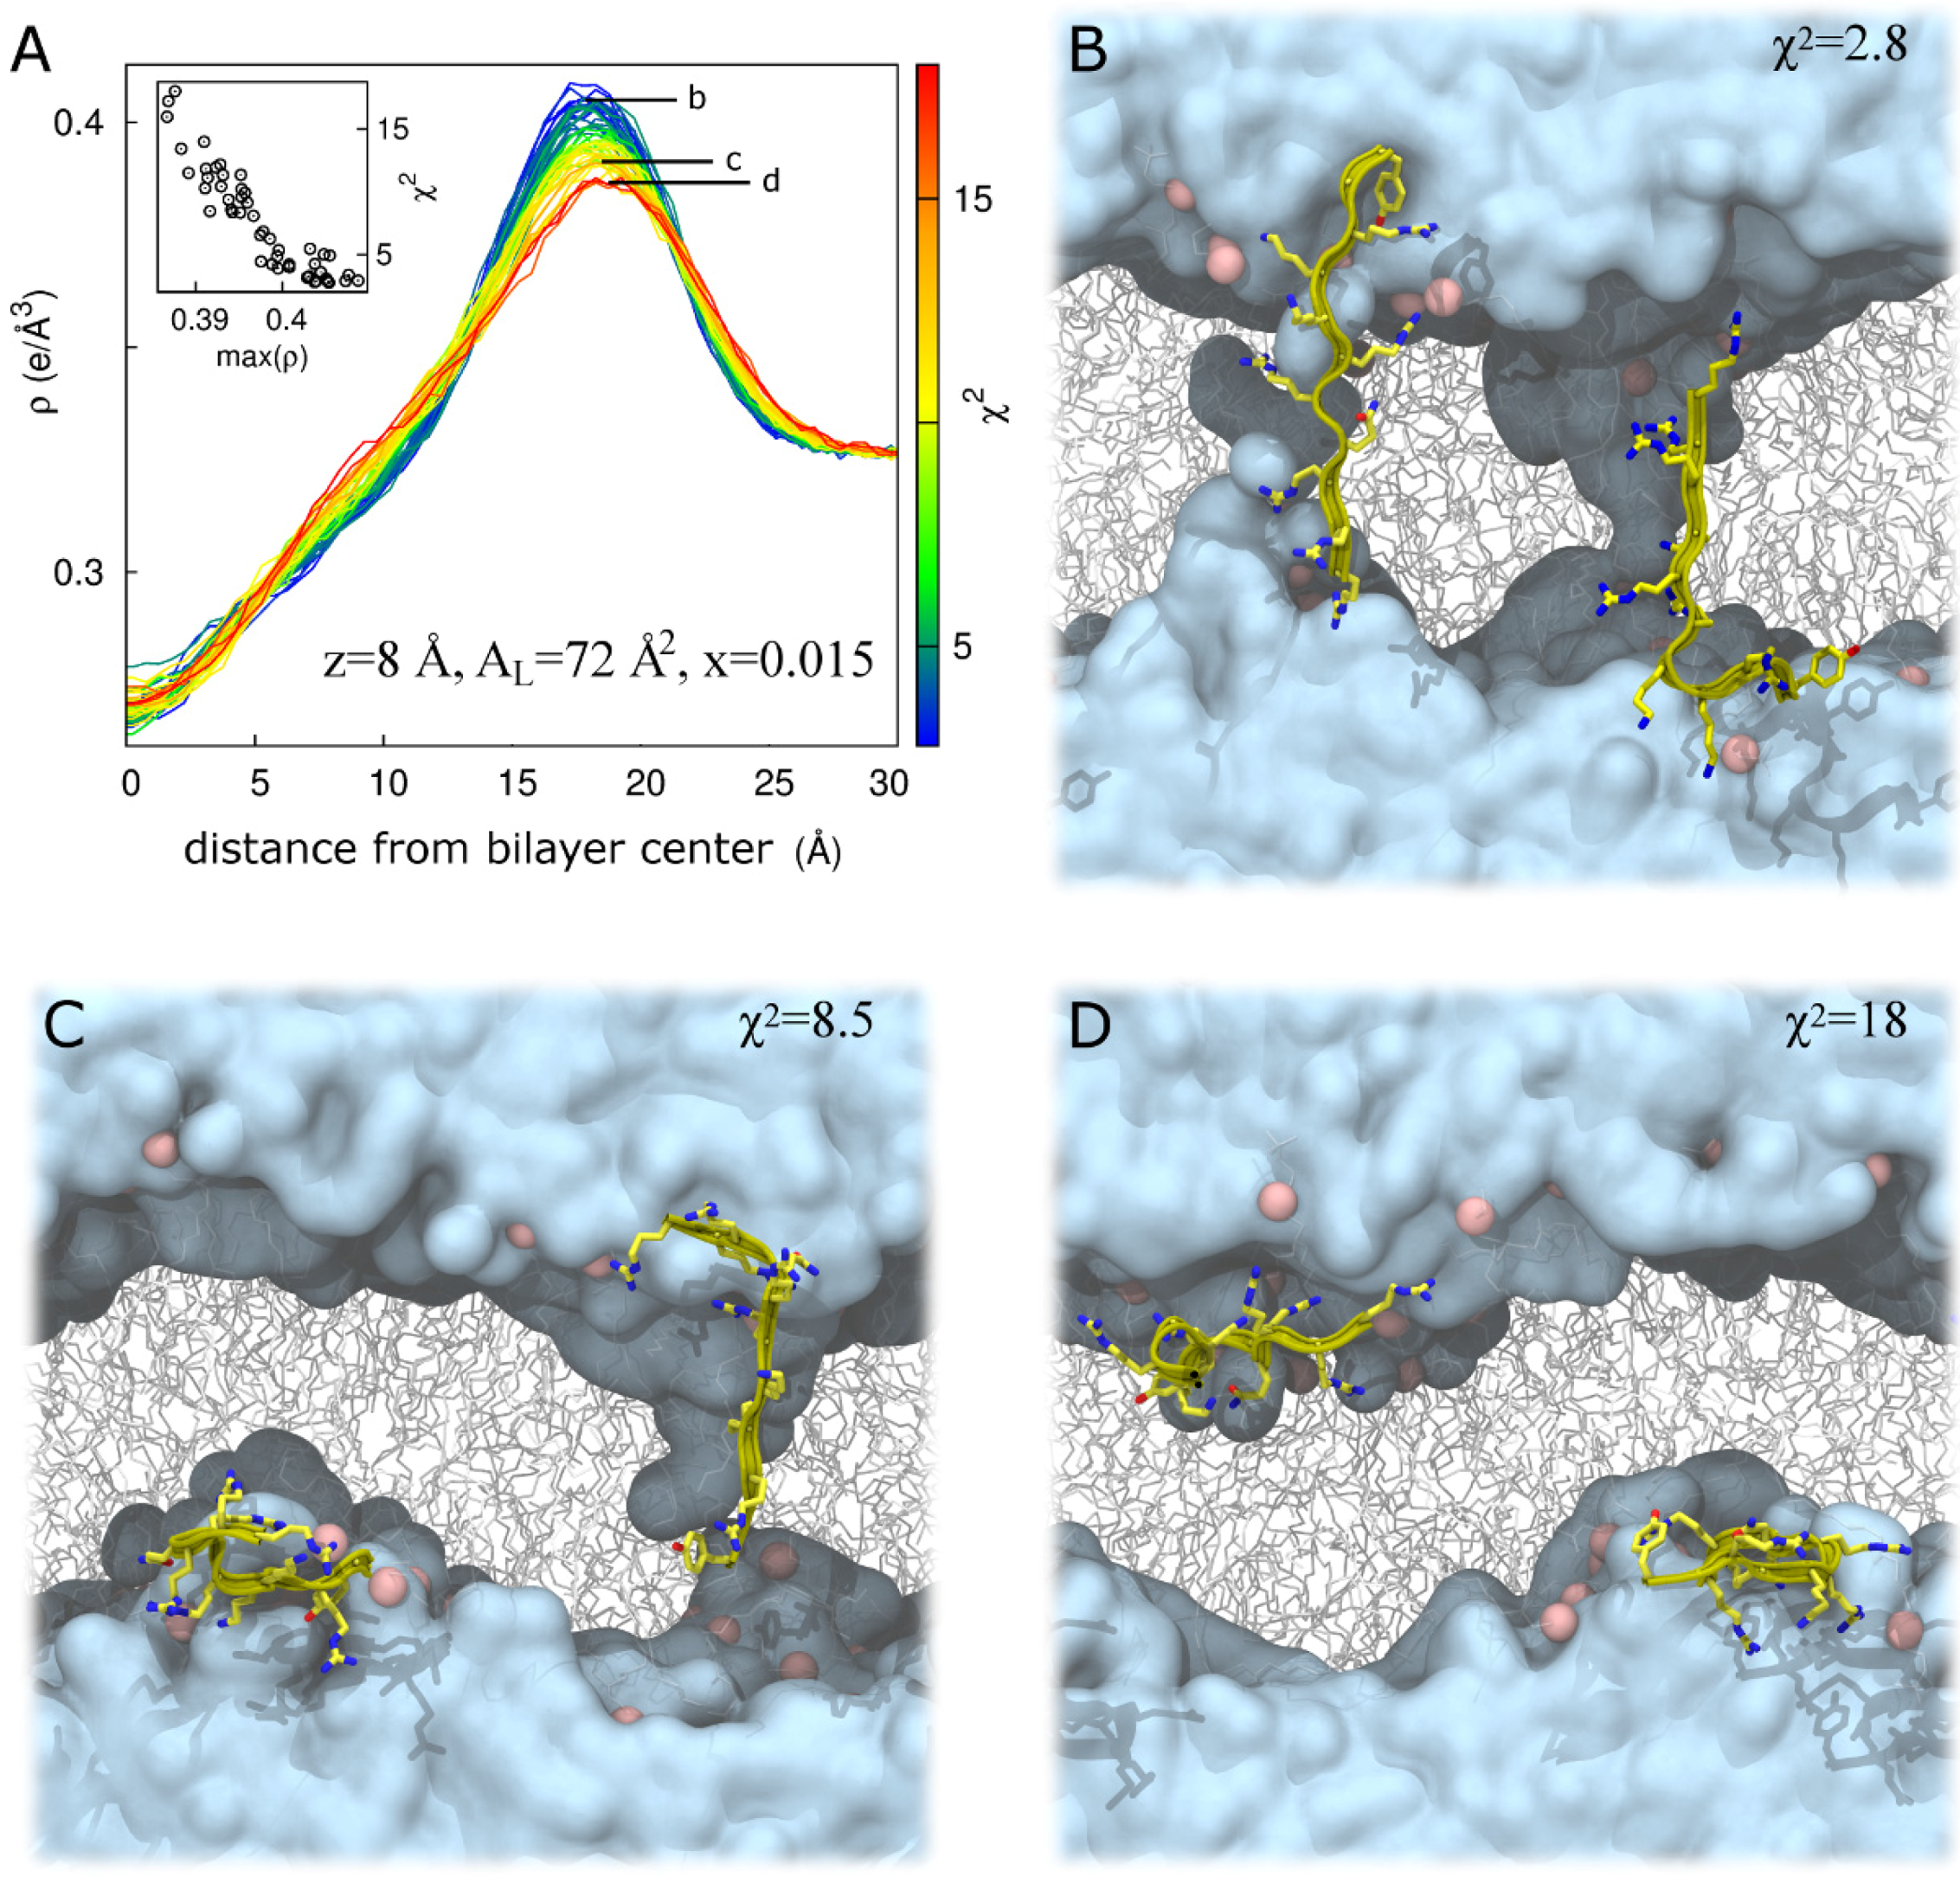
2.2. Tat47–57 in DOPC:DOPE (1:1) Bilayers


| Sample | 2Dc (Å) | DHH (Å) | AL(Å2) | zTat (Å) |
|---|---|---|---|---|
| DOPC/DOPE(1:1) Control(x = 0) | 29.5 | 36.7 | 66 | – |
| DOPC/DOPE(1:1)/2Tats(x = 0.015) | 28.5 | 36.4 | 68 | 18 |
| DOPC/DOPE(1:1)/2Tats(x = 0.015) | 27.0 | 36.2 | 72 | 8 |
| DOPC/DOPE(1:1)/4Tats(x = 0.030) | 28.5 | 36.1 | 68 | 18 |
| z (Å) | AL (Å2) | χ2 | ||
|---|---|---|---|---|
| Mean ± Std. Dev. | Min. | Max. | ||
| 18 | 68 | 2.7 ± 0.2 | 2.3 | 3.4 |
| 8 | 72 | 7.6 ± 4.1 | 2.8 | 18.0 |
| 0 | 72 | 6.4 ± 2.1 | 3.0 | 13.2 |


3. Discussion
| Charged Species | Simulation/Lipid Membrane | Energetics of Insertion (kcal/mol) [Ref.] |
|---|---|---|
| Guanidinium ion | NAMD 2.6/DPPC and CHARMM (continuum) | 23 [28] |
| Protonated Arg on a polyleucine helix | CHARMM27/DPPC | ~17 [29,30,31] |
| Protonated Arg | Gromacs/ DMPCb, DOPC, DOTAPb, POPCb, POPEb, POPGb | 12–26 [25] (lipid dependent) |
| Protonated Arg | Gromacs 3.3.1/DOPC | ~14 [32] |
| Protonated DiArg c | −1.6 [32] | |
| Protonated TriArg c | −1.1 [32] | |
| Tat48–60 | Gromacs 3.3.1/DPPC | ~32 [33] |
| Cyclic Arg9—no water pore | Gromacs/DOPC | 48 [34] |
| Cyclic Arg9—in water pore | 28 [34] |
4. Materials and Methods
4.1. Experimental Section
4.1.1. Lipids and Peptides
4.1.2. Samples for X-ray Scattering
4.1.3. X-ray Scattering Methods
4.2. Theoretical Section
4.2.1. Simulation Parameters
4.2.2. Composite Peptide-Bilayer Systems
4.2.3. Comparing Form Factors from Experiment and Simulation Data
5. Conclusions
Supplementary Materials
Acknowledgments
Author Contributions
Conflicts of Interest
References
- Laspia, M.F.; Rice, A.P.; Mathews, M.B. HIV-1 Tat protein increases transcriptional initiation and stabilizes elongation. Cell 1989, 59, 283–292. [Google Scholar] [CrossRef]
- Ziegler, A.; Nervi, P.; Dürrenberger, M.; Seelig, J. The cationic cell-penetrating peptide cpptat derived from the HIV-1 protein Tat is rapidly transported into living fibroblasts: Optical, biophysical, and metabolic evidence. Biochemistry 2005, 44, 138–148. [Google Scholar] [CrossRef] [PubMed]
- Zhao, M.; Weissleder, R. Intracellular cargo delivery using tat peptide and derivatives. Med. Res. Rev. 2004, 24, 1–12. [Google Scholar] [CrossRef] [PubMed]
- Zorko, M.; Langel, Ü. Cell-penetrating peptides: Mechanism and kinetics of cargo delivery. Adv. Drug Del. Rev. 2005, 57, 529–545. [Google Scholar] [CrossRef] [PubMed]
- Vives, E.; Brodin, P.; Lebleu, B. A truncated HIV-1 Tat protein basic domain rapidly translocates through the plasma membrane and accumulates in the cell nucleus. J. Biol. Chem. 1997, 272, 16010–16017. [Google Scholar] [CrossRef] [PubMed]
- Ter-Avetisyan, G.; Tuennemann, G.; Nowak, D.; Nitschke, M.; Herrmann, A.; Drab, M.; Cardoso, M.C. Cell entry of arginine-rich peptides is independent of endocytosis. J. Biol. Chem. 2009, 284, 3370–3378. [Google Scholar] [CrossRef] [PubMed]
- Kaplan, I.M.; Wadia, J.S.; Dowdy, S.F. Cationic tat peptide transduction domain enters cells by macropinocytosis. J. Control. Release 2005, 107, 571–572. [Google Scholar] [CrossRef]
- Richard, J.P.; Melikov, K.; Brooks, H.; Prevot, P.; Lebleu, B.; Chernomordik, L.V. Cellular uptake of unconjugated Tat peptide involves clathrin-dependent endocytosis and heparan sulfate receptors. J. Biol. Chem. 2005, 280, 15300–15306. [Google Scholar] [CrossRef] [PubMed]
- Herce, H.D.; Garcia, A.E. Molecular dynamics simulations suggest a mechanism for translocation of the HIV-1 tat peptide across lipid membranes. Proc. Natl. Acad. Sci. USA 2007, 104, 20805–20810. [Google Scholar] [CrossRef] [PubMed]
- Herce, H.D.; Garcia, A.E.; Cardoso, M.C. Fundamental molecular mechanism for the cellular uptake of guanidinium-rich molecules. J. Am.Chem. Soc. 2014, 136, 17459–17467. [Google Scholar] [CrossRef] [PubMed]
- Mishra, A.; Gordon, V.D.; Yang, L.H.; Coridan, R.; Wong, G.C.L. HIV Tat forms pores in membranes by inducing saddle-splay curvature: Potential role of bidentate hydrogen bonding. Angew. Chem. Int. Ed. 2008, 47, 2986–2989. [Google Scholar] [CrossRef] [PubMed]
- Ciobanasu, C.; Siebrasse, J.P.; Kubitscheck, U. Cell-penetrating HIV-1 Tat peptides can generate pores in model membranes. Biophys. J. 2010, 99, 153–162. [Google Scholar] [CrossRef] [PubMed]
- Akabori, K.; Huang, K.; Treece, B.W.; Jablin, M.S.; Maranville, B.; Woll, A.; Nagle, J.F.; Garcia, A.E.; Tristram-Nagle, S. HIV-1 Tat membrane interactions probed using X-ray and neutron scattering, cd spectroscopy and md simulations. Biochim. Biophy. Acta (BBA) Biomembr. 2014, 1838, 3078–3087. [Google Scholar] [CrossRef] [PubMed]
- Neale, C.; Bennett, W.F.D.; Tieleman, D.P.; Pomès, R. Statistical convergence of equilibrium properties in simulations of molecular solutes embedded in lipid bilayers. J. Chem. Theory Comput. 2011, 7, 4175–4188. [Google Scholar] [CrossRef]
- Neale, C.; Hsu, J.C.Y.; Yip, C.M.; Pomès, R. Indolicidin binding induces thinning of a lipid bilayer. Biophys. J. 2014, 106, L29–L31. [Google Scholar] [CrossRef] [PubMed]
- Nagle, J.F. Introductory lecture: Basic quantities in model biomembranes. Faraday Discuss. 2013, 161, 11–29. [Google Scholar] [CrossRef] [PubMed]
- Klauda, J.B.; Kucerka, N.; Brooks, B.R.; Pastor, R.W.; Nagle, J.F. Simulation-based methods for interpreting X-ray data from lipid bilayers. Biophys. J. 2006, 90, 2796–2807. [Google Scholar] [CrossRef] [PubMed]
- Kucerka, N.; Nagle, J.F.; Sachs, J.N.; Feller, S.E.; Pencer, J.; Jackson, A.; Katsaras, J. Lipid bilayer structure determined by the simultaneous analysis of neutron and X-ray scattering data. Biophys. J. 2008, 95, 2356–2367. [Google Scholar] [CrossRef] [PubMed]
- Jämbeck, J.P.M.; Lyubartsev, A.P. An extension and further validation of an all-atomistic force field for biological membranes. J. Chem. Theory Comput. 2012, 8, 2938–2948. [Google Scholar] [CrossRef]
- Pandit, S.A.; Scott, H.L. Multiscale simulations of heterogeneous model membranes. Biochim. Biophy. Acta (BBA) Biomembr. 2009, 1788, 136–148. [Google Scholar] [CrossRef] [PubMed]
- Zhuang, X.; Makover, J.R.; Im, W.; Klauda, J.B. A systematic molecular dynamics simulation study of temperature dependent bilayer structural properties. Biochim. Biophy. Acta (BBA) Biomembr. 2014, 1838, 2520–2529. [Google Scholar] [CrossRef] [PubMed]
- Braun, A.R.; Brandt, E.G.; Edholm, O.; Nagle, J.F.; Sachs, J.N. Determination of electron density profiles and area from simulations of undulating membranes. Biophys. J. 2011, 100, 2112–2120. [Google Scholar] [CrossRef] [PubMed]
- Born, M. Volumen und hydratationswarme der ionen. Z. Phys. A 1920, 1, 45–48. [Google Scholar] [CrossRef]
- Roux, B. Lonely arginine seeks friendly environment. J. Gen. Physiol. 2007, 130, 233–236. [Google Scholar] [CrossRef] [PubMed]
- Johansson, A.C.V.; Lindahl, E. The role of lipid composition for insertion and stabilization of amino acids in membranes. J. Chem. Phys. 2009, 130. [Google Scholar] [CrossRef] [PubMed]
- Nagle, J.F.; Tristram-Nagle, S. Structure of lipid bilayers. Biochim. Biophy. Acta (BBA) Biomembr. 2000, 1469, 159–195. [Google Scholar] [CrossRef]
- Li, L.B.; Vorobyov, I.; Allen, T.W. The role of membrane thickness in charged protein-lipid interactions. Biochim. Biophy. Acta (BBA) Biomembr. 2012, 1818, 135–145. [Google Scholar] [CrossRef] [PubMed]
- Schow, E.V.; Freites, J.A.; Cheng, P.; Bernsel, A.; von Heijne, G.; White, S.H.; Tobias, D.J. Arginine in membranes: The connection between molecular dynamics simulations and translocon-mediated insertion experiments. J. Membr. Biol. 2011, 239, 35–48. [Google Scholar] [CrossRef] [PubMed]
- Vorobyov, I.; Li, L.B.; Allen, T.W. Assessing atomistic and coarse-grained force fields for protein-lipid interactions: The formidable challenge of an ionizable side chain in a membrane. J. Phys. Chem. B 2008, 112, 9588–9602. [Google Scholar] [CrossRef] [PubMed]
- Dorairaj, S.; Allen, T.W. On the thermodynamic stability of a charged arginine side chain in a transmembrane helix. P Natl. Acad. Sci. USA 2007, 104, 4943–4948. [Google Scholar] [CrossRef] [PubMed]
- Li, L.B.; Vorobyov, I.; Allen, T.W. Potential of mean force and pk(a) profile calculation for a lipid membrane-exposed arginine side chain. J. Phys. Chem. B 2008, 112, 9574–9587. [Google Scholar] [CrossRef] [PubMed]
- MacCallum, J.L.; Bennett, W.F.D.; Tieleman, D.P. Transfer of arginine into lipid bilayers is nonadditive. Biophy. J. 2011, 101, 110–117. [Google Scholar] [CrossRef] [PubMed]
- Yesylevskyy, S.; Marrink, S.J.; Mark, A.E. Alternative mechanisms for the interaction of the cell-penetrating peptides penetratin and the tat peptide with lipid bilayers. Biophys. J. 2009, 97, 40–49. [Google Scholar] [CrossRef] [PubMed]
- Huang, K.; Garcia, A.E. Free energy of translocating an arginine-rich cell-penetrating peptide across a lipid bilayer suggests pore formation. Biophys. J. 2013, 104, 412–420. [Google Scholar] [CrossRef] [PubMed]
- Chen, X.; Sa'adedin, F.; Deme, B.; Rao, P.; Bradshaw, J. Insertion of tat peptide and perturbation of negatively charged model phospholipid bilayer revealed by neutron diffraction. Biochim. Biophy. Acta (BBA) Biomembr. 2013, 1828, 1982–1988. [Google Scholar] [CrossRef] [PubMed]
- Su, Y.; Waring, A.J.; Ruchala, P.; Hong, M. Membrane-bound dynamic structure of an arginine-rich cell-penetrating peptide, the protein transduction domain of HIV Tat, from solid-state nmr. Biochem. USA 2010, 49, 6009–6020. [Google Scholar] [CrossRef] [PubMed]
- Herce, H.; Garcia, A.; Litt, J.; Kane, R.; Martin, P.; Enrique, N.; Rebolledo, A.; Milesi, V. Arginine-rich peptides destabilize the plasma membrane, consistent with a pore formation translocation mechanism of cell-penetrating peptides. Biophys. J. 2009, 97, 1917–1925. [Google Scholar] [CrossRef] [PubMed]
- Chen, P.C.; Hub, J.S. Interpretation of solution X-ray scattering by explicit-solvent molecular dynamics. Biophys. J. 2015, 108, 2573–2584. [Google Scholar] [CrossRef] [PubMed]
- Tristram-Nagle, S.A. Preparation of oriented, fully hydrated lipid samples for structure determination using X-ray scattering. Methods Mol. Biol. 2007, 400, 63–75. [Google Scholar] [PubMed]
- Liu, Y.; Nagle, J.F. Diffuse scattering provides material parameters and electron density profiles of biomembranes. Phys. Rev. E Stat. Nonlin. Soft Matter. Phys. 2004, 69. [Google Scholar] [CrossRef]
- Lyatskaya, Y.; Liu, Y.; Tristram-Nagle, S.; Katsaras, J.; Nagle, J.F. Method for obtaining structure and interactions from oriented lipid bilayers. Phys. Rev. E Stat. Nonlin. Soft. Matter. Phys. 2001, 63. [Google Scholar] [CrossRef]
- Kucerka, N.; Tristram-Nagle, S.; Nagle, J.F. Structure of fully hydrated fluid phase lipid bilayers with monounsaturated chains. J. Membr. Biol. 2005, 208, 193–202. [Google Scholar] [CrossRef] [PubMed]
- Pronk, S.; Páll, S.; Schulz, R.; Larsson, P.; Bjelkmar, P.; Apostolov, R.; Shirts, M.R.; Smith, J.C.; Kasson, P.M.; van der Spoel, D.; et al. Gromacs 4.5: A high-throughput and highly parallel open source molecular simulation toolkit. Bioinformatics 2013, 29, 845–854. [Google Scholar] [CrossRef] [PubMed]
- Lindorff-Larsen, K.; Piana, S.; Palmo, K.; Maragakis, P.; Klepeis, J.L.; Dror, R.O.; Shaw, D.E. Improved side-chain torsion potentials for the amber ff99sb protein force field. Proteins 2010, 78, 1950–1958. [Google Scholar] [CrossRef] [PubMed]
- Jorgensen, W.L.; Chandrasekhar, J.; Madura, J.D.; Impey, R.W.; Klein, M.L. Comparison of simple potential functions for simulating liquid water. J. Chem. Phys. 1983, 79, 926–935. [Google Scholar] [CrossRef]
- Hess, B. P-lincs: A parallel linear constraint solver for molecular simulation. J. Chem. Theory Comput. 2008, 4, 116–122. [Google Scholar] [CrossRef]
- Miyamoto, S.; Kollman, P.A. Settle: An analytical version of the shake and rattle algorithm for rigid water models. J. Comput. Chem. 1992, 13, 952–962. [Google Scholar] [CrossRef]
- Van Gunsteren, W.F.; Berendsen, H.J.C. Computer simulation of molecular dynamics: Methodology, applications, and perspectives in chemistry. Angew. Chem. Int. Ed. 1990, 29, 992–1023. [Google Scholar] [CrossRef]
- Darden, T.; York, D.; Pedersen, L. Particle mesh ewald: An N•log(N) method for ewald sums in large systems. J. Chem. Phys. 1993, 98, 10089–10092. [Google Scholar] [CrossRef]
- Essmann, U.; Perera, L.; Berkowitz, M.L.; Darden, T.; Lee, H.; Pedersen, L.G. A smooth particle mesh ewald method. J. Chem. Phys. 1995, 103, 8577–8593. [Google Scholar] [CrossRef]
- Shirts, M.R.; Mobley, D.L.; Chodera, J.D.; Pande, V.S. Accurate and efficient corrections for missing dispersion interactions in molecular simulations. J. Phys. Chem. B 2007, 111, 13052–13063. [Google Scholar] [CrossRef] [PubMed]
- Van Gunsteren, W.F.; Berendsen, H.J.C. A leap-frog algorithm for stochastic dynamics. Mol. Sim. 1988, 1, 173–185. [Google Scholar] [CrossRef]
- Parrinello, M.; Rahman, A. Polymorphic transitions in single crystals: A new molecular dynamics method. J. Appl. Phys. 1981, 52, 7182–7190. [Google Scholar] [CrossRef]
- Nosé, S.; Klein, M.L. Constant pressure molecular dynamics for molecular systems. Mol. Phys. 1983, 50, 1055–1076. [Google Scholar] [CrossRef]
- Schmidt, T.H.; Kandt, C. Lambada and inflategro2: Efficient membrane alignment and insertion of membrane proteins for molecular dynamics simulations. J. Chem. Inf. Model. 2012, 52, 2657–2669. [Google Scholar] [CrossRef] [PubMed]
- Kučerka, N.; Katsaras, J.; Nagle, J.F. Comparing membrane simulations to scattering experiments: Introducing the simtoexp software. J. Membr. Biol. 2010, 235, 43–50. [Google Scholar] [CrossRef] [PubMed]
- Jo, S.; Kim, T.; Iyer, V.G.; Im, W. Charmm-gui: A web-based graphical user interface for charmm. J. Comput. Chem. 2008, 29, 1859–1865. [Google Scholar] [CrossRef] [PubMed]
- Jo, S.; Lim, J.B.; Klauda, J.B.; Im, W. Charmm-gui membrane builder for mixed bilayers and its application to yeast membranes. Biophys. J. 2009, 97, 50–58. [Google Scholar] [CrossRef] [PubMed]
- Bussi, G.; Donadio, D.; Parrinello, M. Canonical sampling through velocity rescaling. J. Chem. Phys. 2007, 126. [Google Scholar] [CrossRef] [PubMed]
- Berendsen, H.J.C.; Postma, J.P.M.; van Gunsteren, W.F.; DiNola, A.; Haak, J.R. Molecular dynamics with coupling to an external bath. J. Chem. Phys. 1984, 81, 3684–3690. [Google Scholar] [CrossRef]
- Humphrey, W.; Dalke, A.; Schulten, K. Vmd: Visual molecular dynamics. J. Mol. Graph. 1996, 14, 33–38. [Google Scholar] [CrossRef]
- Kucerka, N.; Liu, Y.; Chu, N.; Petrache, H.I.; Tristram-Nagle, S.; Nagle, J.F. Structure of fully hydrated fluid phase dmpc and dlpc lipid bilayers using X-ray scattering from oriented multilamellar arrays and from unilamellar vesicles. Biophys. J. 2005, 88, 2626–2637. [Google Scholar] [CrossRef] [PubMed]
- Flyvbjerg, H.; Petersen, H.G. Error estimates on averages of correlated data. J. Chem. Phys. 1989, 91, 461–466. [Google Scholar] [CrossRef]
© 2015 by the authors; licensee MDPI, Basel, Switzerland. This article is an open access article distributed under the terms and conditions of the Creative Commons Attribution license (http://creativecommons.org/licenses/by/4.0/).
Share and Cite
Neale, C.; Huang, K.; García, A.E.; Tristram-Nagle, S. Penetration of HIV-1 Tat47–57 into PC/PE Bilayers Assessed by MD Simulation and X-ray Scattering. Membranes 2015, 5, 473-494. https://doi.org/10.3390/membranes5030473
Neale C, Huang K, García AE, Tristram-Nagle S. Penetration of HIV-1 Tat47–57 into PC/PE Bilayers Assessed by MD Simulation and X-ray Scattering. Membranes. 2015; 5(3):473-494. https://doi.org/10.3390/membranes5030473
Chicago/Turabian StyleNeale, Chris, Kun Huang, Angel E. García, and Stephanie Tristram-Nagle. 2015. "Penetration of HIV-1 Tat47–57 into PC/PE Bilayers Assessed by MD Simulation and X-ray Scattering" Membranes 5, no. 3: 473-494. https://doi.org/10.3390/membranes5030473
APA StyleNeale, C., Huang, K., García, A. E., & Tristram-Nagle, S. (2015). Penetration of HIV-1 Tat47–57 into PC/PE Bilayers Assessed by MD Simulation and X-ray Scattering. Membranes, 5(3), 473-494. https://doi.org/10.3390/membranes5030473