3.1. Flux Decline Analysis
Three types of flux measurements were performed: NF of water through clean membrane; NF of lactic acid solutions; NF of water through fouled membrane. The obtained results are presented in
Figure 2,
Figure 3,
Figure 4,
Figure 5 and
Figure 6.
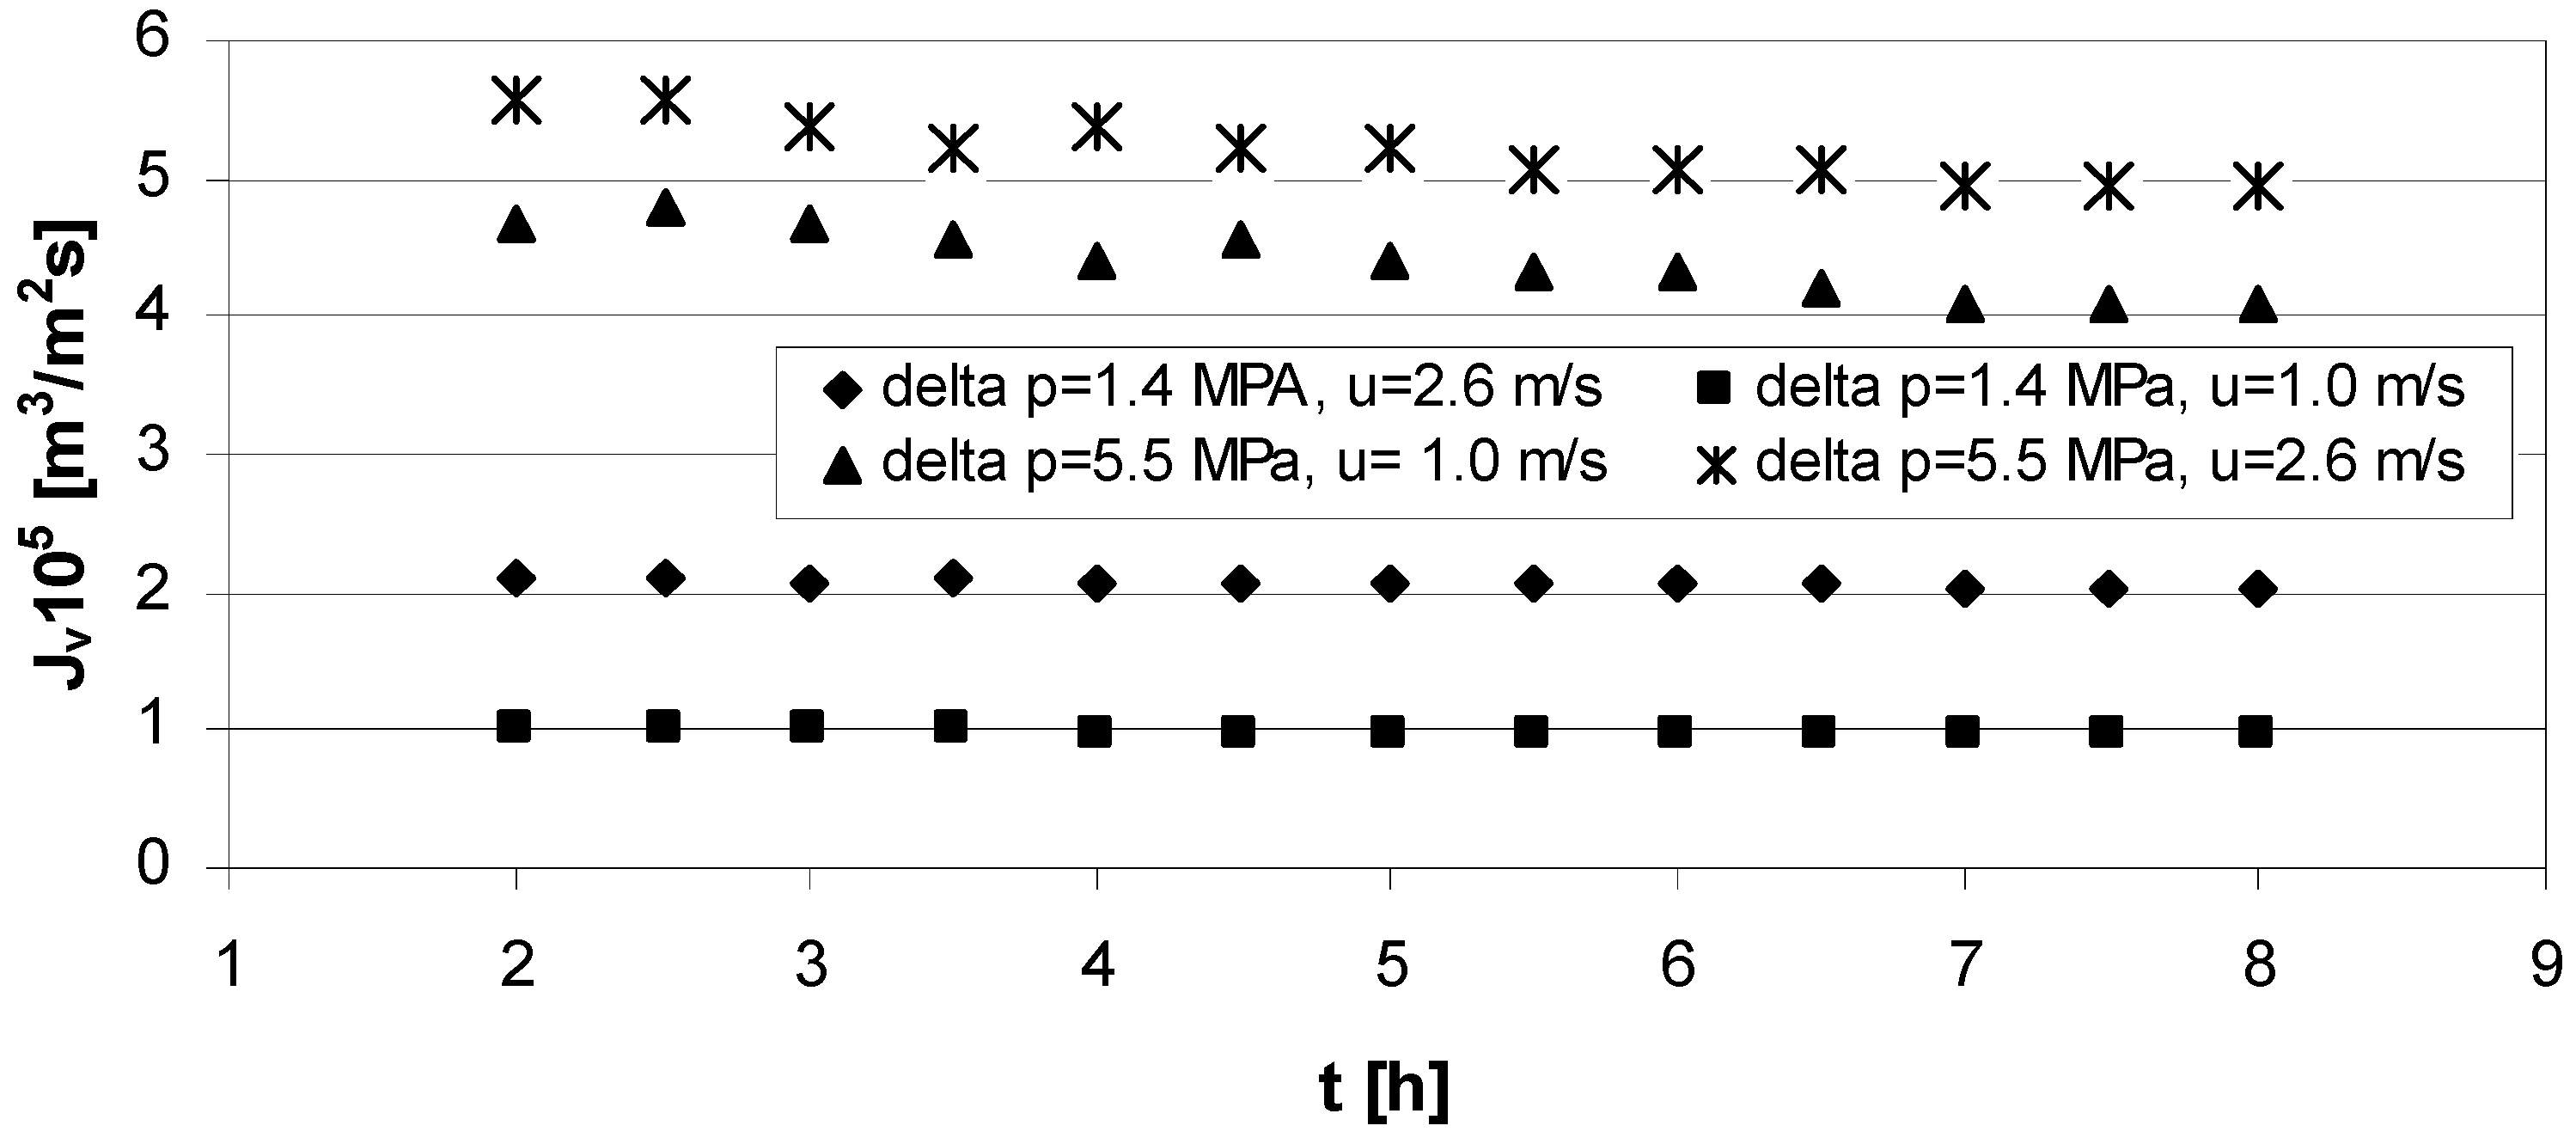
The experimental results of deionized water filtration process at the different transmembrane pressure and cross-flow velocity is presented in
Figure 2 as a function of permeate flux
versus time.
Figure 2.
Permeate flux through clean membrane vs. time for: series 1, 2—transmembrane pressure ∆p = 1.4 MPa, and cross flow velocity u = 2.6 m/s and u = 1.0 m/s respectively and series 3, 4—transmembrane pressure ∆p = 5.5 MPa, cross flow velocity u = 1.0 m/s and u = 2.6 m/s respectively.
Figure 2.
Permeate flux through clean membrane vs. time for: series 1, 2—transmembrane pressure ∆p = 1.4 MPa, and cross flow velocity u = 2.6 m/s and u = 1.0 m/s respectively and series 3, 4—transmembrane pressure ∆p = 5.5 MPa, cross flow velocity u = 1.0 m/s and u = 2.6 m/s respectively.
Characteristic of flux decline during the experiments of nanofiltration of lactic acid solutions changed due to the operating parameters.
The results presented in
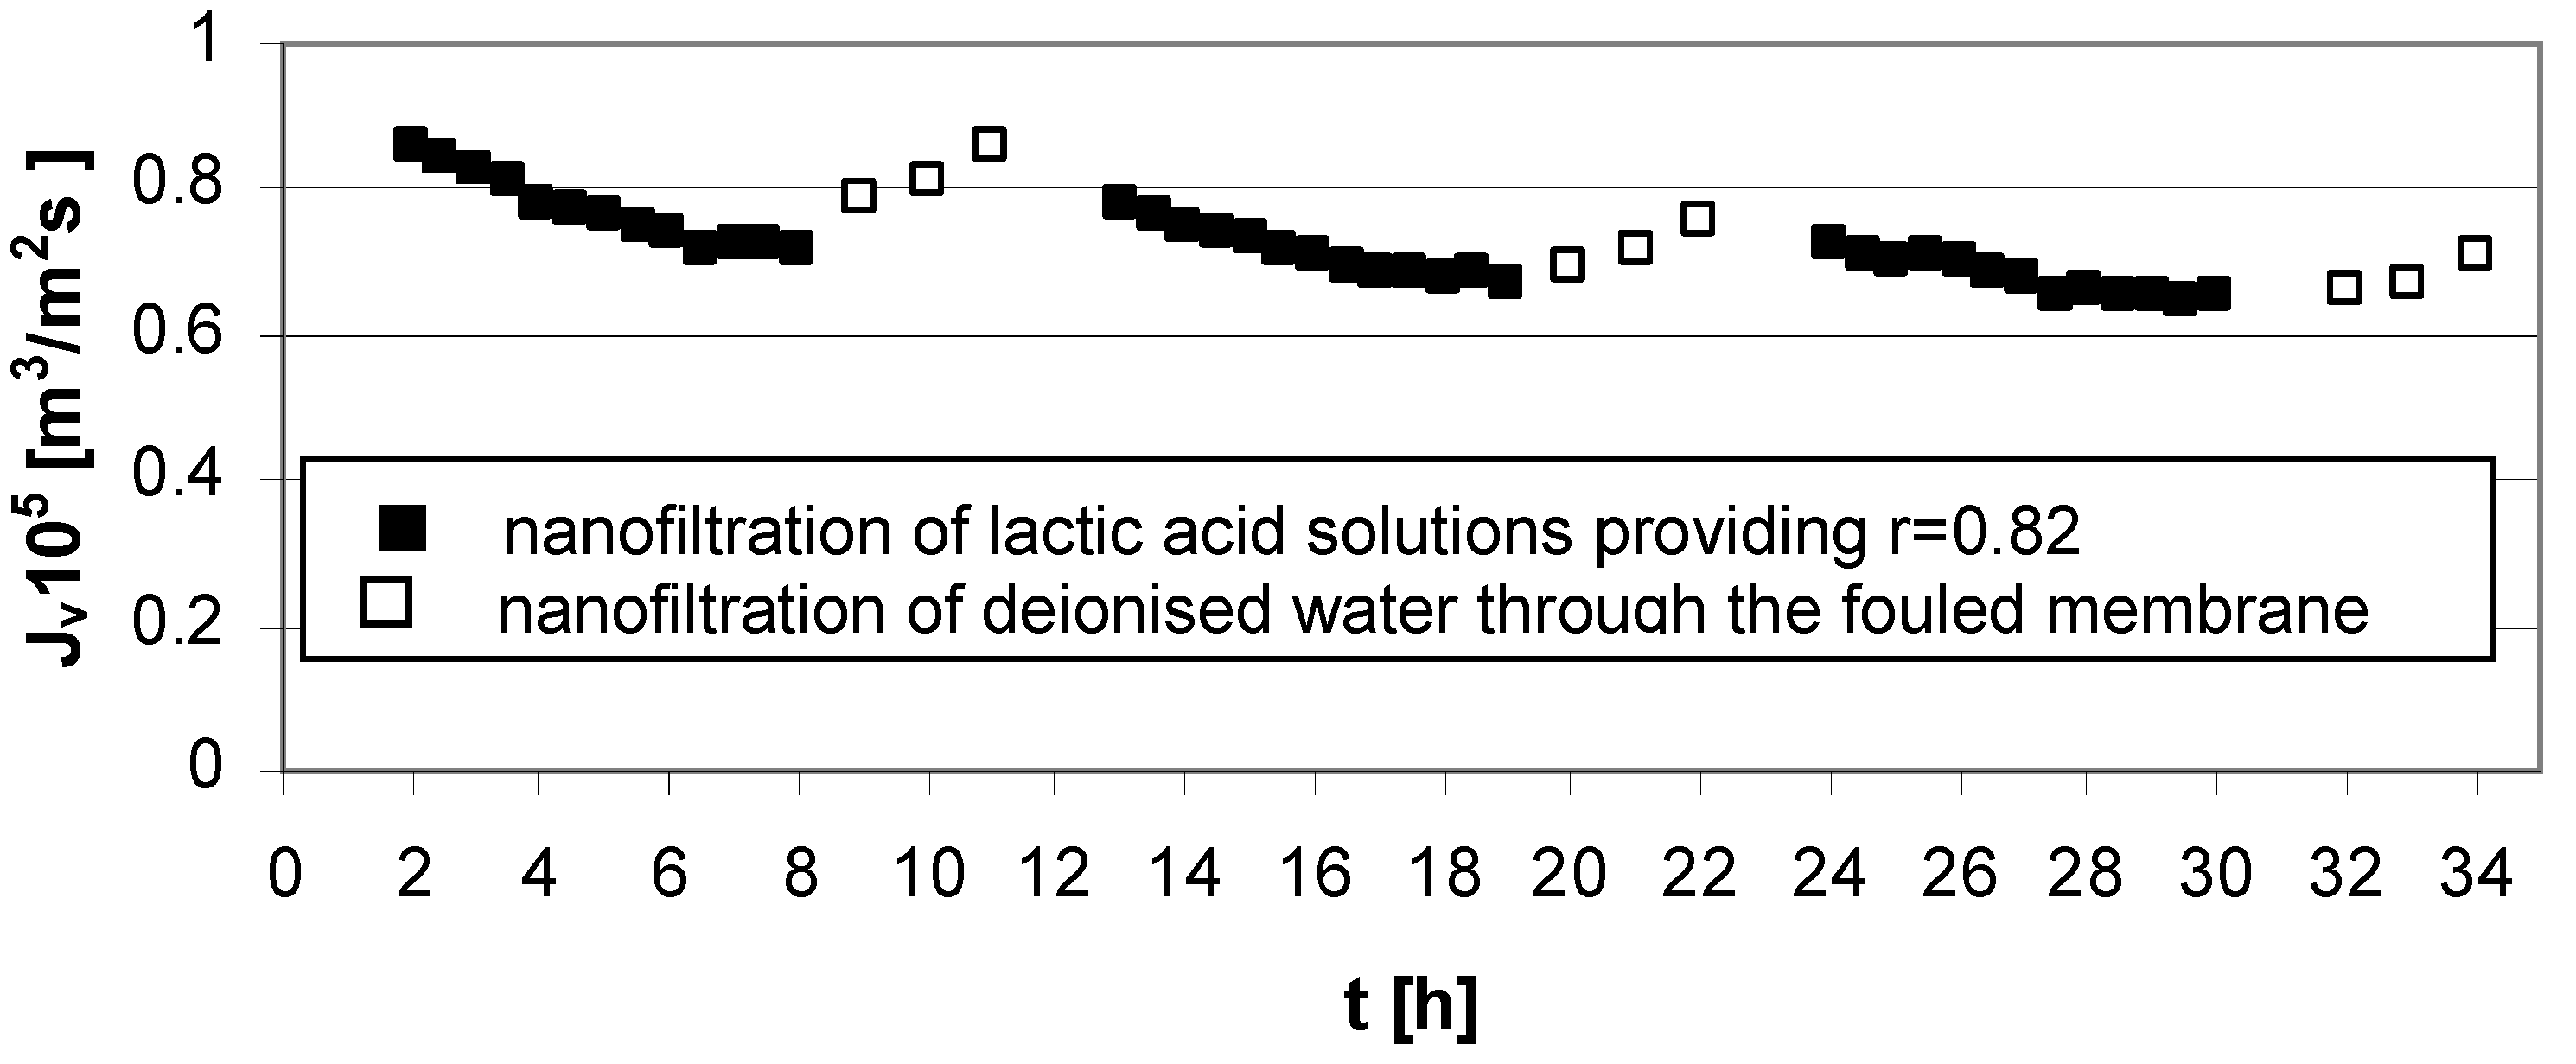
Figure 3 indicate that, after experiments at low acid concentration (
cLA = 0.02 mol/dm
3), high transmembrane pressure (∆
p = 5.5 MPa), and low cross flow velocity (
u = 1.0 m/s) cleaning the Zr(IV)/PAA membrane with deionized water is rather effective.
Figure 3.
Permeate flux decline
vs. time for operating parameters providing high lactic acid rejection,
r = 0.82 (
Table 1); series 1, 2, 3—nanofiltration of lactic acid solutions; series 1w, 2w, 3w—nanofiltration of water (“w” is the DI symbol for each series); concentration of lactic acid
cLA = 0.02 mol/dm
3, pH = 8.0, transmembrane pressure ∆
p = 5.5 MPa, cross flow velocity
u = 1.0 m/s.
The results of the experiment presented in
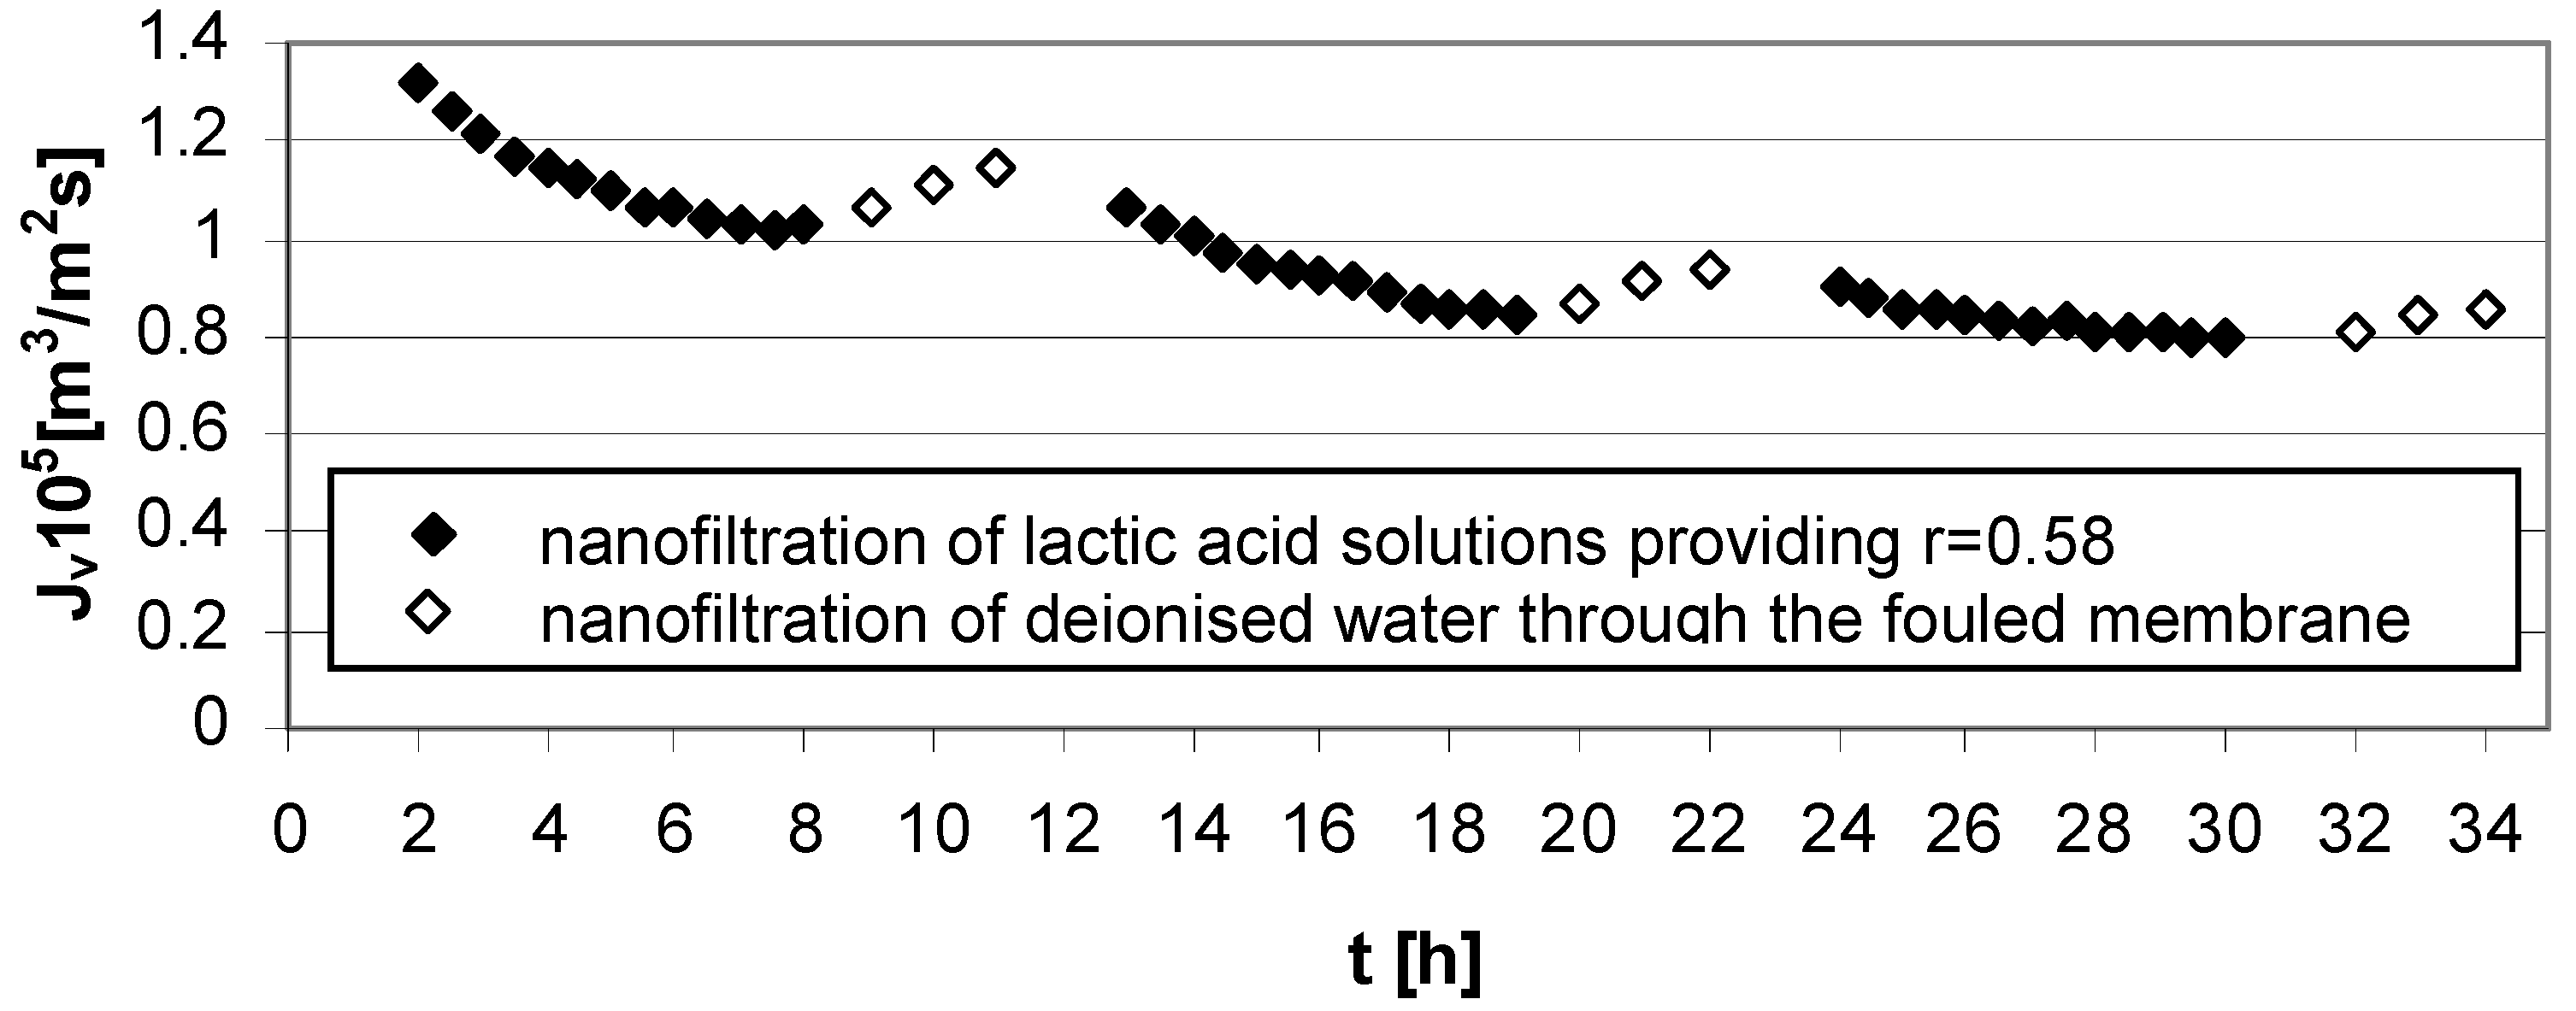
Figure 4 show a connection between high acid concentration (
cLA = 1.0 mol/dm
3), high transmembrane pressure (∆
p = 5.5 MPa) in NF process conditions and Zr(IV)/PAA membrane usage. Strong fouling effects were generated and the implemented method of rinsing with deionized water was not particularly effective.
Figure 4.
Permeate flux decline
vs. time for operating parameters providing high lactic acid rejection,
r = 0.58 (
Table 1); series 1, 2, 3—nanofiltration of lactic acid solutions; series 1w, 2w, 3w—nanofiltration of water; concentration of lactic acid
cLA = 1.0 mol/dm
3, pH = 8.0, transmembrane pressure ∆
p = 5.5 MPa, cross flow velocity
u = 2.6 m/s.
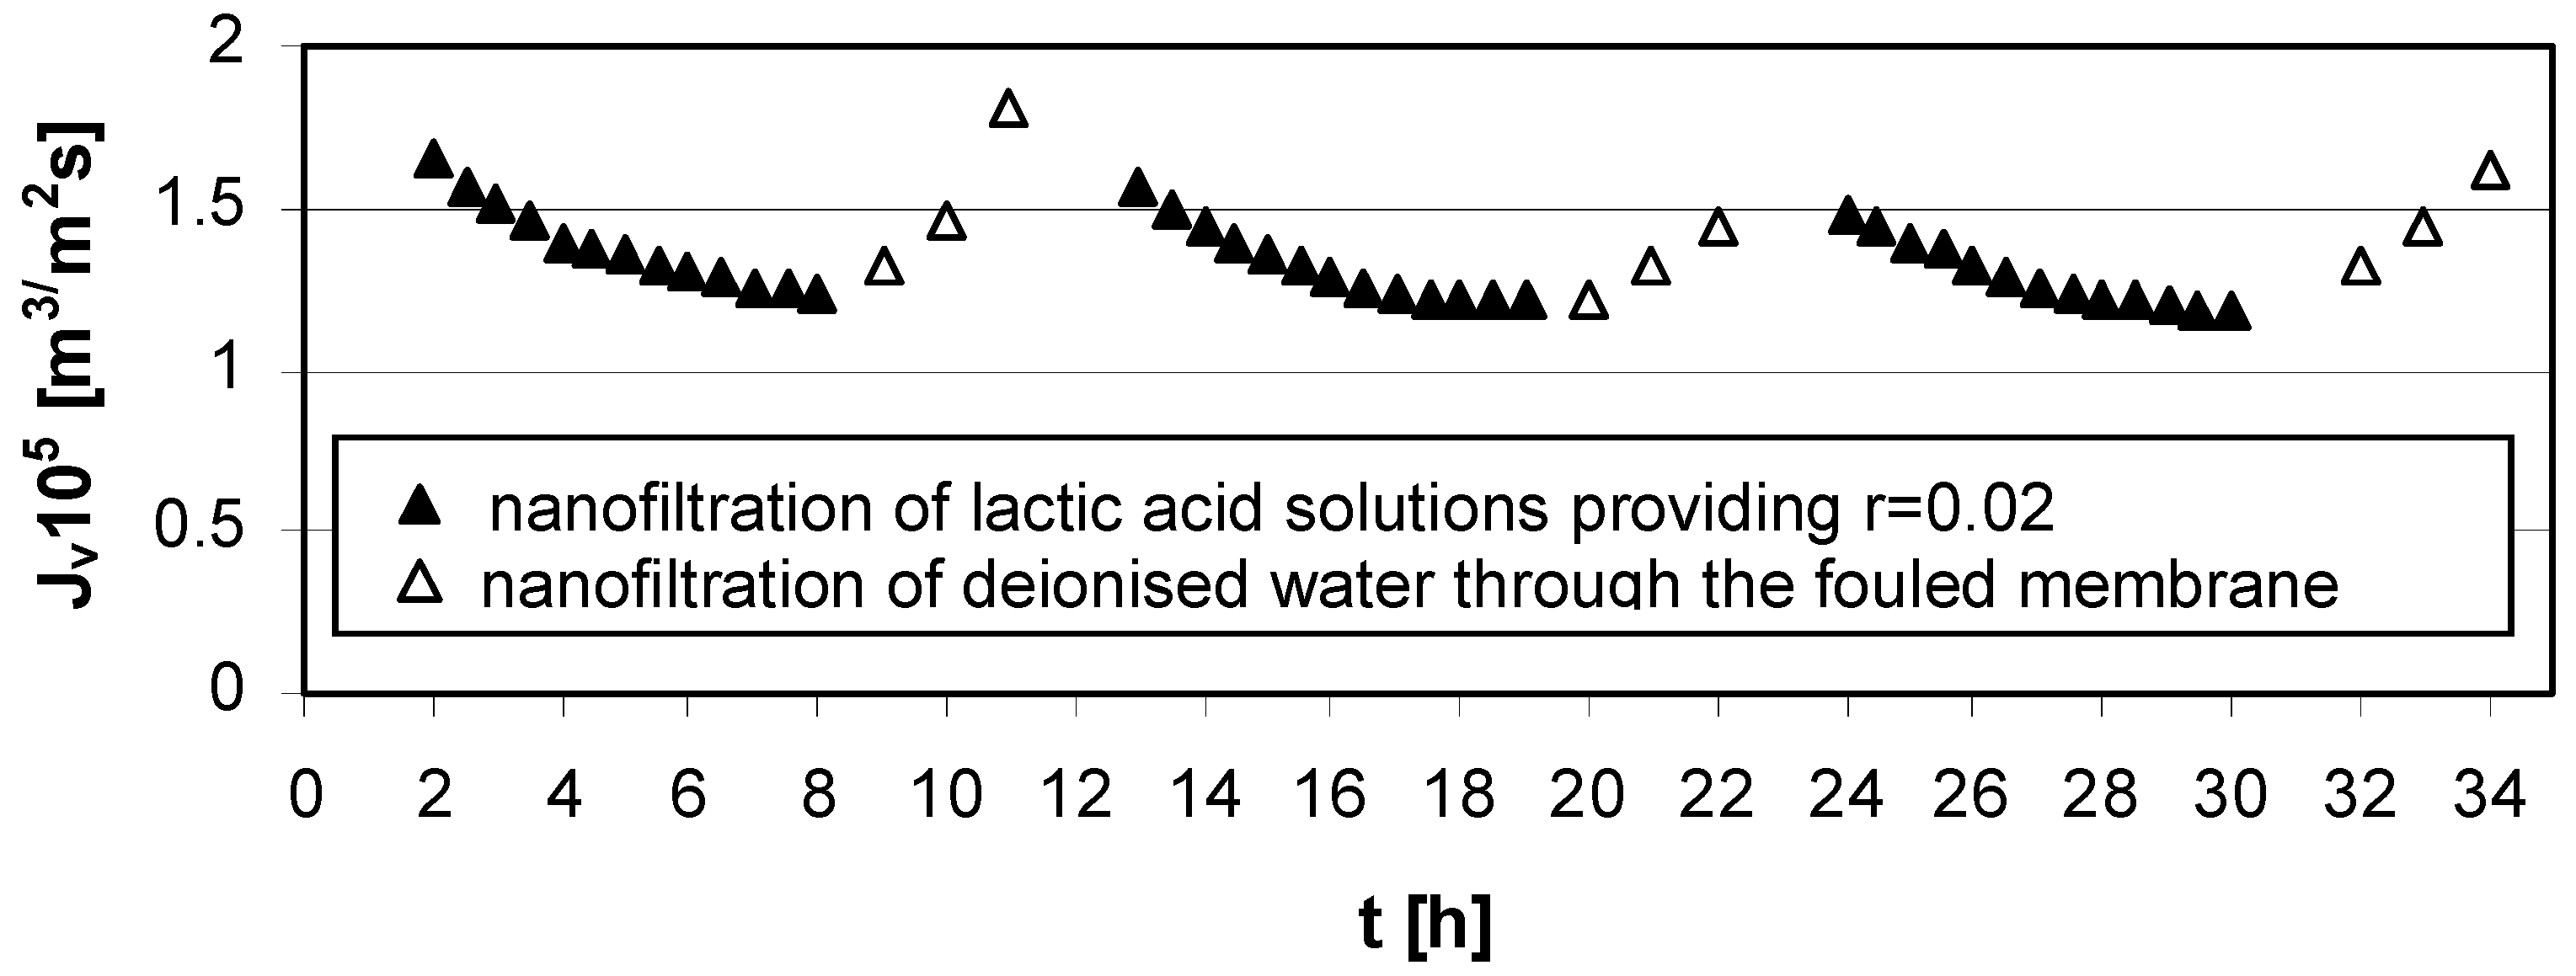
At conditions of low concentration of lactic acid (cLA = 0.02 mol/dm3), low transmembrane pressure (∆p = 1.4 MPa), and high cross flow velocity (u = 2.6 m/s), the method of rinsing nanofiltration Zr(IV)/PAA membrane with deionized water implemented after each experimental series was effective in reducing fouling phenomena.
Figure 5.
Permeate flux decline
vs. time for operating parameters providing low lactic acid rejection,
r = 0.02 (
Table 1); series 1, 2, 3—nanofiltration of lactic acid solutions; series 1w, 2w, 3w—nanofiltration of deionized water; concentration of lactic acid
cLA = 0.02 mol/dm
3, pH = 4.0, transmembrane pressure ∆
p = 1.4 MPa, cross flow velocity
u = 2.6 m/s.
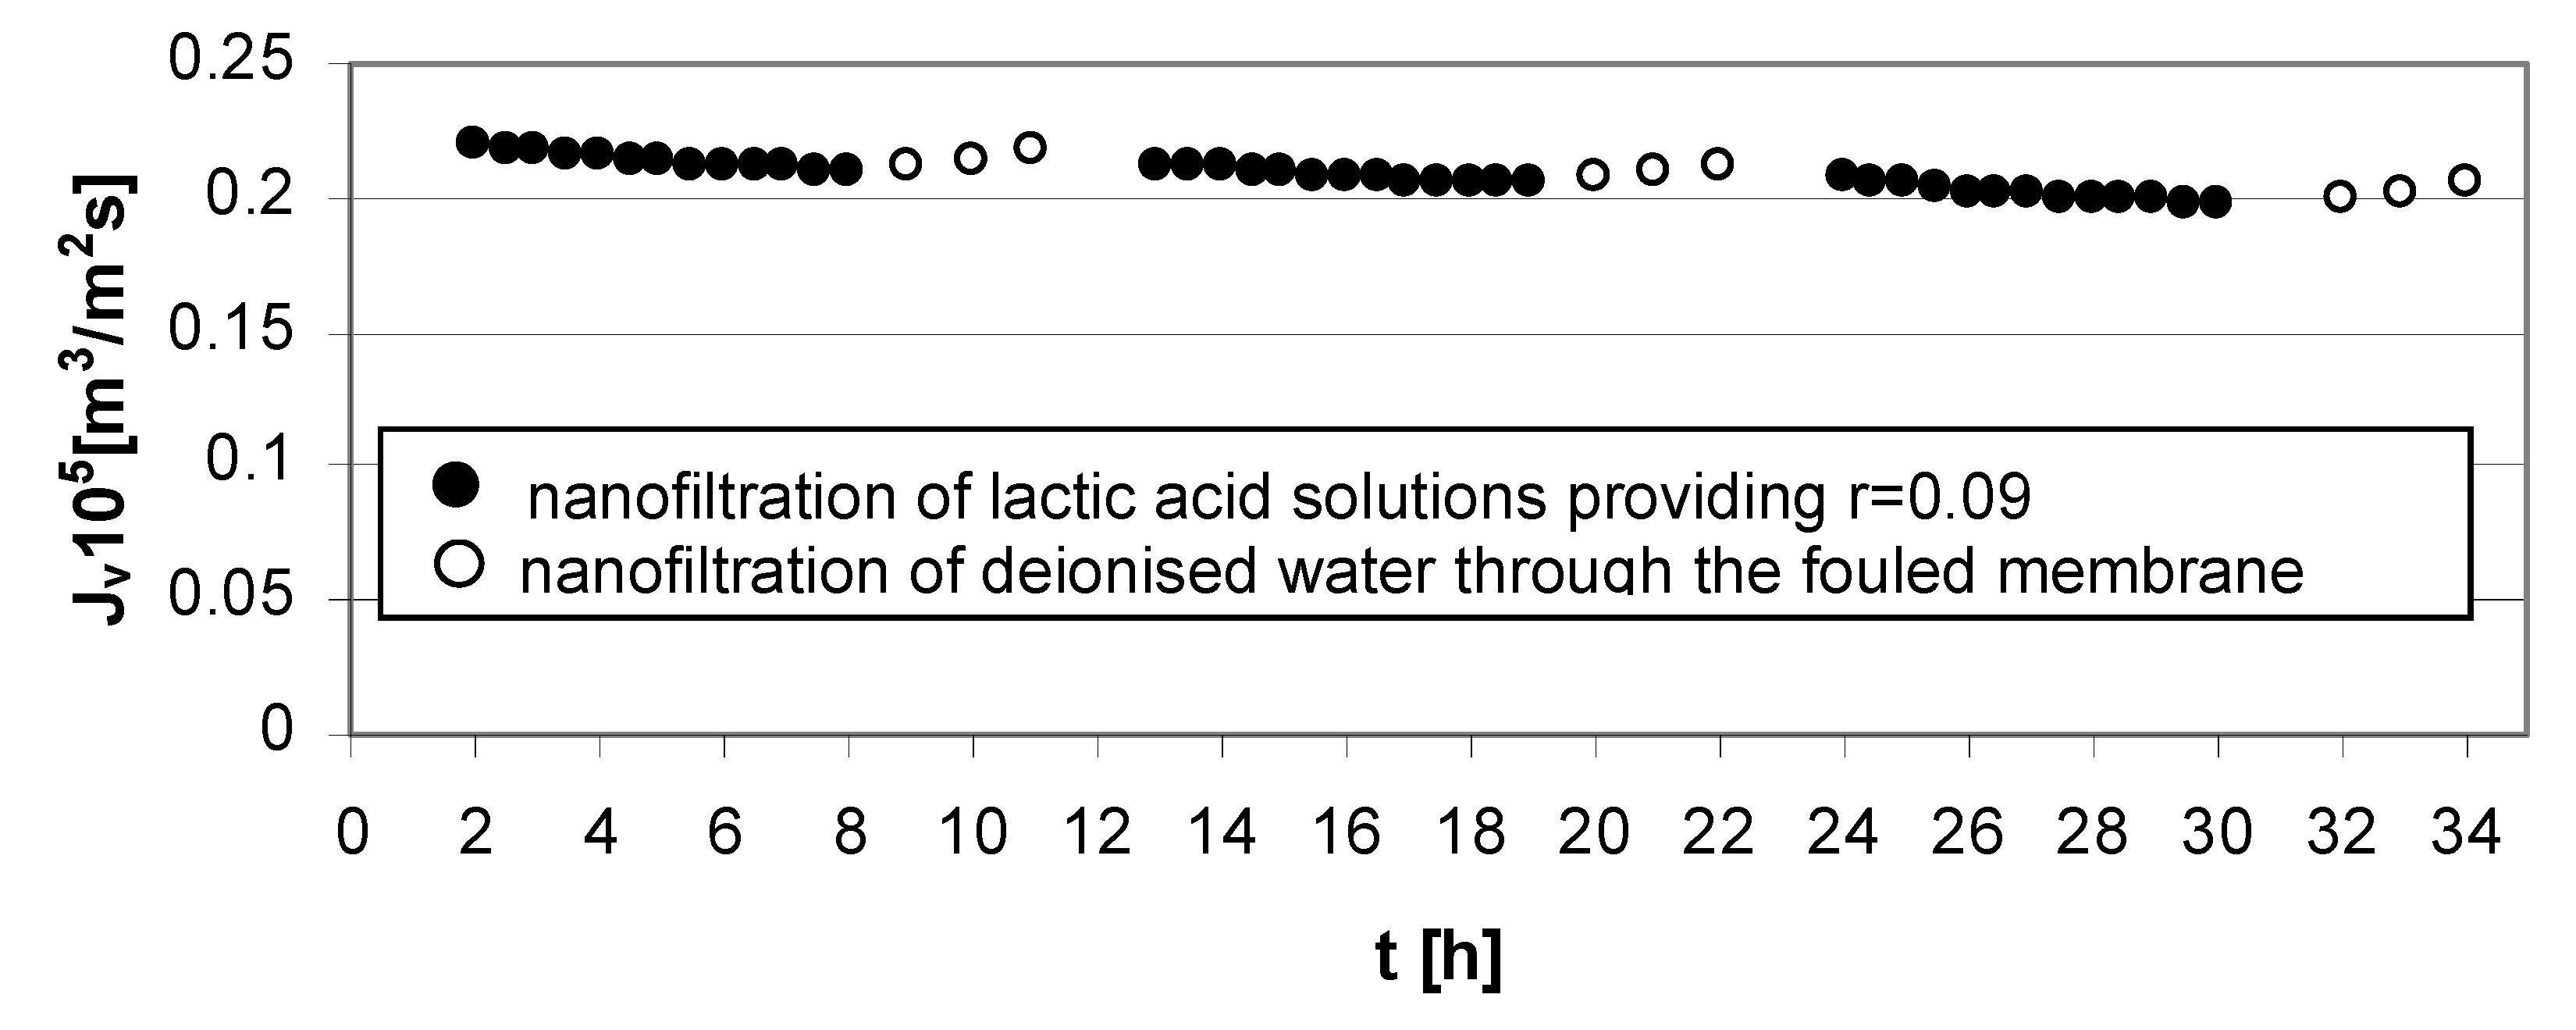
The mass transfer resistance is connected with the solution feed properties. The high lactic acid concentration in the feed solution generates the reduction of permeate flux at high (
Figure 4) and low transmembrane pressures (
Figure 6).
Figure 6.
Permeate flux decline
vs. time for operating parameters providing low lactic acid rejection,
r = 0.09 (
Table 1); series 1, 2, 3—nanofiltration of lactic acid solutions; series 1w, 2w, 3w—nanofiltration of deionized water; concentration of lactic acid
cLA = 1.0 mol/dm
3, pH = 4.0, transmembrane pressure ∆
p = 1.4 MPa, cross flow velocity
u = 1.0 m/s.
The strong impact on efficiency decline of the lactic acid nanofiltration process is observed for process parameters taken from upper limit, such as high value of transmembrane pressure, ∆
p = 5.5 MPa, pH = 8.0 and lactic acid concentration,
cLA = 1.0 mol/dm
3 (
Figure 4). Configured in such conditions, the operational parameters of the experiment cause problems with effectiveness of water cleaning in short 3 h terms.
The effect of pH on both selectivity as well as the effectiveness of the nanofiltration process is connected with characteristic behavior of Zr(IV)/PAA membranes. The electrolyte rejection increases with increasing of pH in the feed solutions due to an increase in membrane charge (
Figure 3 and
Figure 4) [
5].
For the presented results, the impact of both transmembrane pressure and cross-flow velocity could not be ignored. Increasing cross-flow velocity reduces the negative consequences of concentration polarization and fouling (
Figure 5).
3.2. Fouling Resistances
The experimental data concerning flux decline
versus time allow us to estimate the main mass transport resistances caused by fouling phenomena: reversible fouling resistance
Rrf and irreversible fouling resistance
Rif [
6].
According to the resistance in the series model, permeate fluxes during nanofiltration processes of lactic acid solutions,
Jvk and deionized water through fouled membrane,
Jwk can be expressed by Equations (1)–(4):
where:
Rt is the value of total membrane fouling, and;
Rpf is the value of resistance caused by concentration polarization and fouling.
The active membrane layer resistance,
Rm, was determined using experimental data obtained during the nanofiltration of deionized water through clean membrane for investigated values of cross-flow velocity,
u and transmembrane pressure, Δ
p (
Table 1).
The value of
Rm was obtained according to the results presented in
Figure 2 and calculated from Equation (1) where
Rm was
Rt for clean membrane.
The experimental results presented in
Figure 3,
Figure 4,
Figure 5 and
Figure 6 were the data for determined
Rt and
Rpf values with the resistance in series model usage according to Equations (1)–(4). The values of characteristic resistances calculated using Equations (1)–(4) are summarized in
Table 2.
The active membrane layer resistance,
Rm and values of concentration polarization and fouling,
Rpf depends strongly on dynamic process conditions, especially on cross-flow velocity. The results collected in
Table 2 show that the lowest values of active membrane layer resistance,
Rm, were obtained for cross-flow velocity
u = 2.6 m/s as well as values of concentration polarization and fouling. Experimental conditions with low lactic acid concentration in feed solution,
cLA = 0.02 mol/dm
3, low cross-flow velocity
u = 1.0 m/s and high trans membrane pressure, ∆
p = 5.5. MPa with pH = 8.0 generate the highest value of fouling in range of 5.06 × 10
5–6.40 × 10
5.
The lowest value of irreversible fouling resistance was obtained for low lactic acid concentration in feed solution, cLA = 0.02 mol/dm3, pH = 4.0, low transmembrane pressure, ∆p = 1.4 MPa and high cross-flow velocity, u = 2.6 m/s.
Table 2.
Experimental results of permeate fluxes and calculated values of fouling resistances for nanofiltration process of lactic acid solutions with Zr(IV)/PAA dynamically formed membranes.
Table 2.
Experimental results of permeate fluxes and calculated values of fouling resistances for nanofiltration process of lactic acid solutions with Zr(IV)/PAA dynamically formed membranes.
| Rejection of lactic acid | r = 0.02 | r = 0.09 | r = 0.58 | r = 0.82 |
|---|
| Series number | 1 | 2 | 3 | 1 | 2 | 3 | 1 | 2 | 3 | 1 | 2 | 3 |
|---|
| t, h | 8.0 | 8.0 | 8.0 | 8.0 | 8.0 | 8.0 | 8.0 | 8.0 | 8.0 | 8.0 | 8.0 | 8.0 |
|---|
| Jvk × 105, m3/m2 s | 1.24 | 1.21 | 1.19 | 0.21 | 0.20 | 0.19 | 1.03 | 0.86 | 0.80 | 0.72 | 0.67 | 0.65 |
| Rt × 10−5, MPa m2 s/m3 | 1.13 | 1.16 | 1.18 | 6.67 | 6.83 | 7.07 | 5.34 | 6.40 | 6.88 | 7.64 | 8.20 | 8.45 |
| Rm × 10−5, MPa m2 s/m3 | 0.69 | 0.69 | 0.69 | 1.43 | 1.43 | 1.43 | 1.12 | 1.12 | 1.12 | 1.34 | 1.34 | 1.34 |
| Rpf × 10−5, MPa m2 s/m3 | 0.44 | 0.47 | 0.49 | 5.24 | 5.40 | 5.64 | 4.22 | 5.28 | 5.76 | 6.30 | 6.86 | 7.11 |
| Jwk × 105, m3/m2 s | 1.81 | 1.44 | 1.61 | 0.22 | 0.21 | 0.20 | 1.15 | 0.94 | 0.86 | 0.86 | 0.75 | 0.71 |
| Rif × 10−5, MPa m2 s/m3 | 0.08 | 0.28 | 0.18 | 4.99 | 5.17 | 5.40 | 3.66 | 4.74 | 5.28 | 5.06 | 5.99 | 6.40 |
| Rrf × 10−5, MPa m2 s/m3 | 0.36 | 0.19 | 0.31 | 0.25 | 0.23 | 0.24 | 0.56 | 0.54 | 0.48 | 1.24 | 0.87 | 0.71 |
| Rif, % Rt | 7 | 24 | 15 | 75 | 76 | 77 | 69 | 74 | 77 | 66 | 73 | 76 |
| Rrf, % Rt | 32 | 16 | 26 | 4 | 3 | 3 | 10 | 8 | 7 | 16 | 11 | 8 |
| Rm, % Rt | 61 | 60 | 59 | 21 | 21 | 20 | 21 | 18 | 16 | 18 | 16 | 16 |
The analysis of experimental results of lactic acid solutions during nanofiltration process with Zr(IV)/PAA membranes usage confirm that the hydrodynamic conditions of experiments and properties of feed solution have the strong impact on flux decline and fouling of tested membranes.
The method of cleaning the membrane with deionized water is the effective in case of removing fouling generated in low pressure and high velocity experimental conditions.
