2. Experimental
A Thermo Scientific Orion Lab Star EC112 (Waltham, MA, USA) Conductivity Bench Meter was used and connected to the Thermo Orion 011050MD 2-electrode conductivity cell. The conductivity probe was used to measure the conductivity of the feed solution and the final concentrated solution to determine the change in concentration based on conductivity. An Oakton Instruments Acorn pH 6 Meter was used to measure the pH of the feed solution before and after the tests. Power for the cell was provided by a Tek Power TP3005T (West Palm Beach, FL, USA) Regulated DC Variable Power Supply 0–30 V, 0–5 A. It was used under controlled voltage, where the voltage was set to a specified value. Dilute feed stock was an equimolar (0.1 M) solution of monopotassium phosphate (KH2PO4) and dipotassium phosphate (K2HPO4) (Sigma Aldrich) (St. Louis, MO, USA).
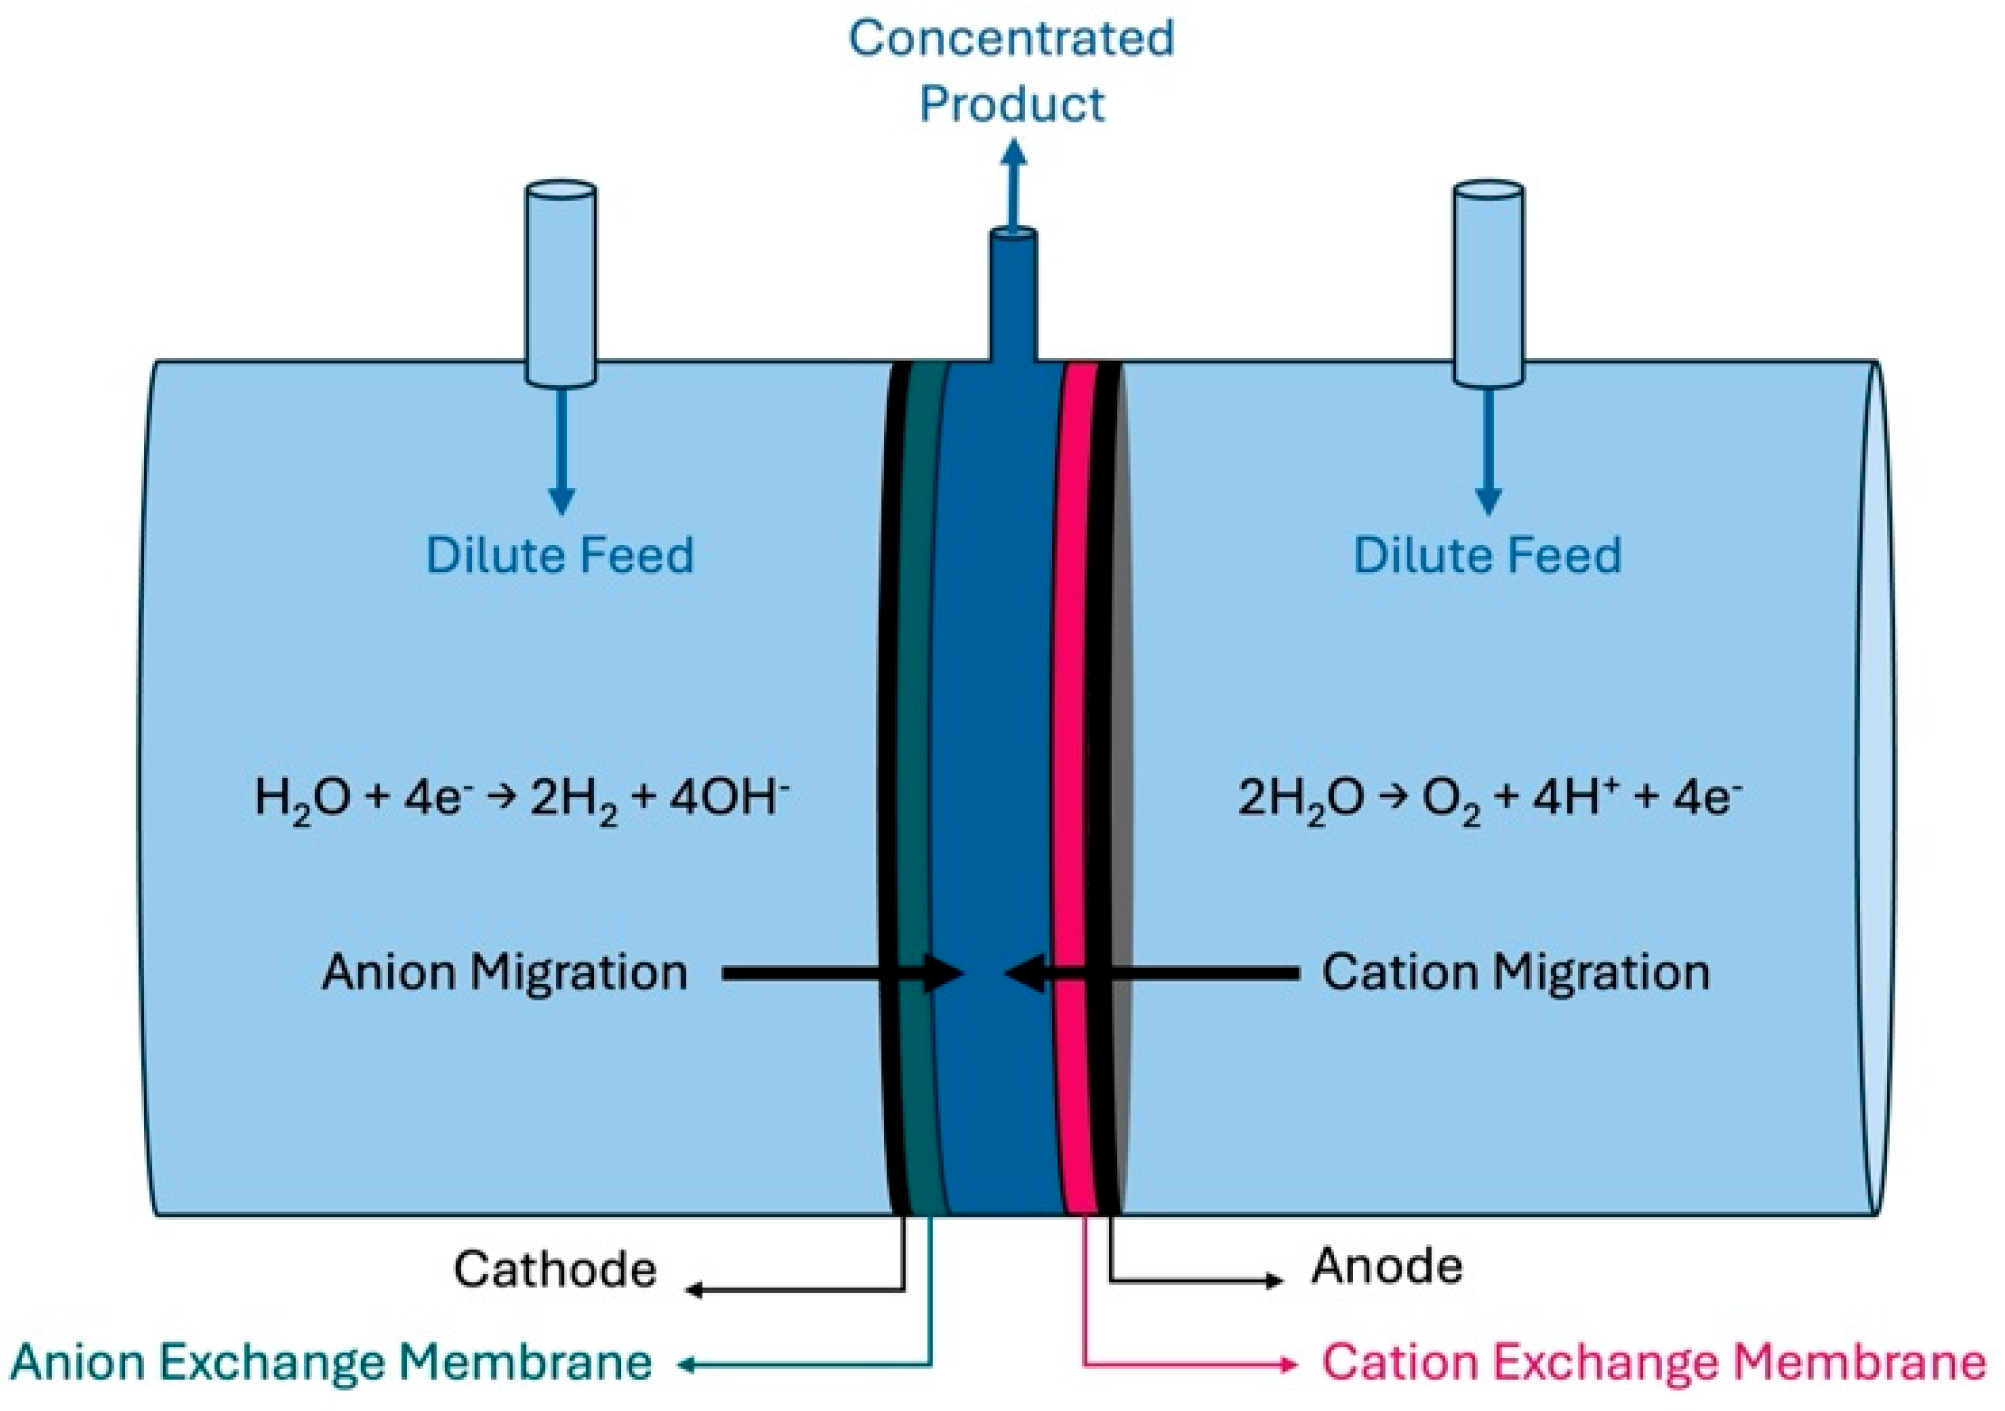
A three-compartment cell was used, as shown in
Figure 1. The outside chambers, which were much larger than the inside chamber, received the dilute feedstock at a designated flow rate. The middle compartment was 0.5 cm in width and 5 cm in diameter. Current was applied to the cell producing hydrogen and hydroxide on the left side and producing oxygen and protons on the right side. The hydrogen-producing cathode was in contact with an anion exchange membrane (AEM) and the oxygen-producing anode was in contact with a proton exchange membrane (PEM). Charge balance between the two electrodes requires the net movement of negative ions to the right or positive ions to the left (or a combination of both). Since an AEM was used at the cathode, only negative ions will flow to the right from the outer feed compartment into the center product compartment. The PEM on the anode allows only positive ions to migrate, which causes a net flux to the left from the feed solution to the center product chamber. Thus, ions migrate into the center compartment (i.e., anions migrate from the cathode, and cations from the anode) to balance the charge in each compartment during electrolysis. The overall effect is for the product to accumulate in the center compartment during electrolysis. Water enters the center compartment due to an ion hydration shell from both sides: anions from the left and cations from the right side.
The feed stock was an equimolar (0.1 M each) solution of K
2HPO
4 and KH
2PO
4 because both molecules will dissociate in water to create a solution with available ions for migration into the center compartment while also acting as a buffer to maintain a relatively neutral pH. Using the Henderson–Hasselbach equation, Equation (1), the pH of this equimolar K
2HPO
4 and KH
2PO
4 solution was 7.2 [
11].
Calculating the expected flux of ions into the center of the cell involved converting the operating current to equivalents of electrons causing an equal number of equivalents of charge to migrate into the center compartment (Equation (2)). The flux of potassium and phosphate ions transported into the center compartment was calculated from the measured change in conductivity in the center compartment, as shown in Equation (3).
In Equations (2) and (3), I is the current, t is time, F is Faraday’s constant, Δσ is the total change in conductivity, x is the cell gap, ∧ is the total equivalent conductance, and γ is the activity coefficient. The activity coefficient (γ) was obtained by dividing the measured conductivity by the theoretical conductivity (
Table 1) [
12].
The zero-gap electrodes with a concentrated salt solution in the center chamber provided low ionic resistance because ionic current passed only through the concentrated product stream in the center compartment and not the feed solutions. However, the transport of ions from the feed solutions to the zero-gap electrodes occurred only by diffusion and convection, not migration.
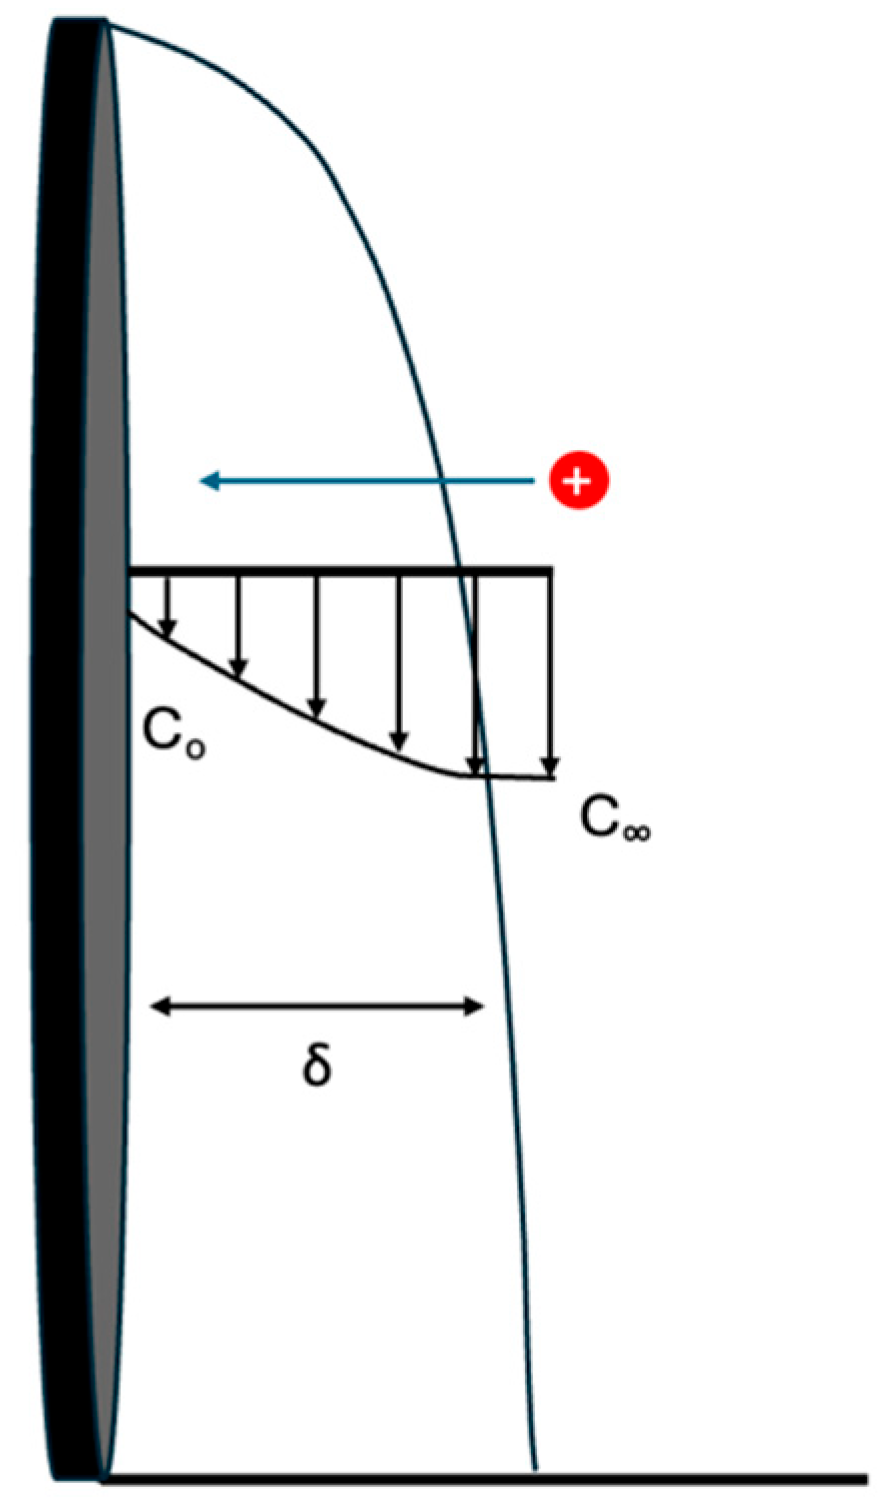
Figure 2 shows a diffusion concentration profile when the bulk solution is more concentrated than the surface of the electrodes. This diffusion profile has a flow across the surface and mass transfer perpendicular to the flow direction dependent on the boundary layer thickness (δ).
The boundary layer thickness was related to flow rate via the Reynolds number (Re), as shown in Equations (4) and (5). The boundary layer thickness has a lower velocity dependence in the turbulent regime, compared to the laminar flow regime. For this study, the water flow rate was moderate making the flow laminar. The flow rate used in this study ranged between 8 × 10
−8 m/s and 4 × 10
−7 m/s, which corresponds to a Reynolds number from 3 × 10
−4 to 0.2. As velocity increased, the Reynolds number increased and the boundary layer thickness decreased. The relationship between mass flux and boundary layer thickness is given by Fick’s first law of diffusion shown in Equations (6) and (7).
In Equation (4), is the density, µ is the viscosity, ν is the velocity, and L is the characteristic length for the flow system. In Equations (5)–(7), δ is the boundary layer thickness, J is molar flux, k is the mass transfer coefficient, C is concentration, and D is the diffusivity.
Osmosis is the transport of water from regions of low solute concentration to regions of high solute concentration across a membrane. As the middle compartment of the cell becomes more concentrated, water will move across the membranes from the more dilute outer chambers into the more concentrated center compartment by osmotic pressure. The equations for osmotic pressure are given in Equations (8) and (9). The reported literature value for the osmotic coefficient (φ) of KH
2PO
4 at a concentration of 1 M is 0.75 [
13].
In Equations (8) and (9), C is the molar concentration difference of ions, R is the ideal gas constant, T is the temperature, and ieff is the Van’t Hoff factor. The Van’t Hoff factor (i) can be adjusted by φ, which is the osmotic coefficient.
3. Results
Electrolysis was performed using a zero-gap anode (with a PEM) and cathode (with an AEM) to produce oxygen and hydrogen, respectively, and drive salt accumulation of product salt in the center compartment of the cell (
Figure 1). The salt concentration in the center compartment was evaluated by measuring its conductivity and pH. A working curve for conductivity vs. concentration was created since the concentration deviates from activity at the concentrations used in the experiments.
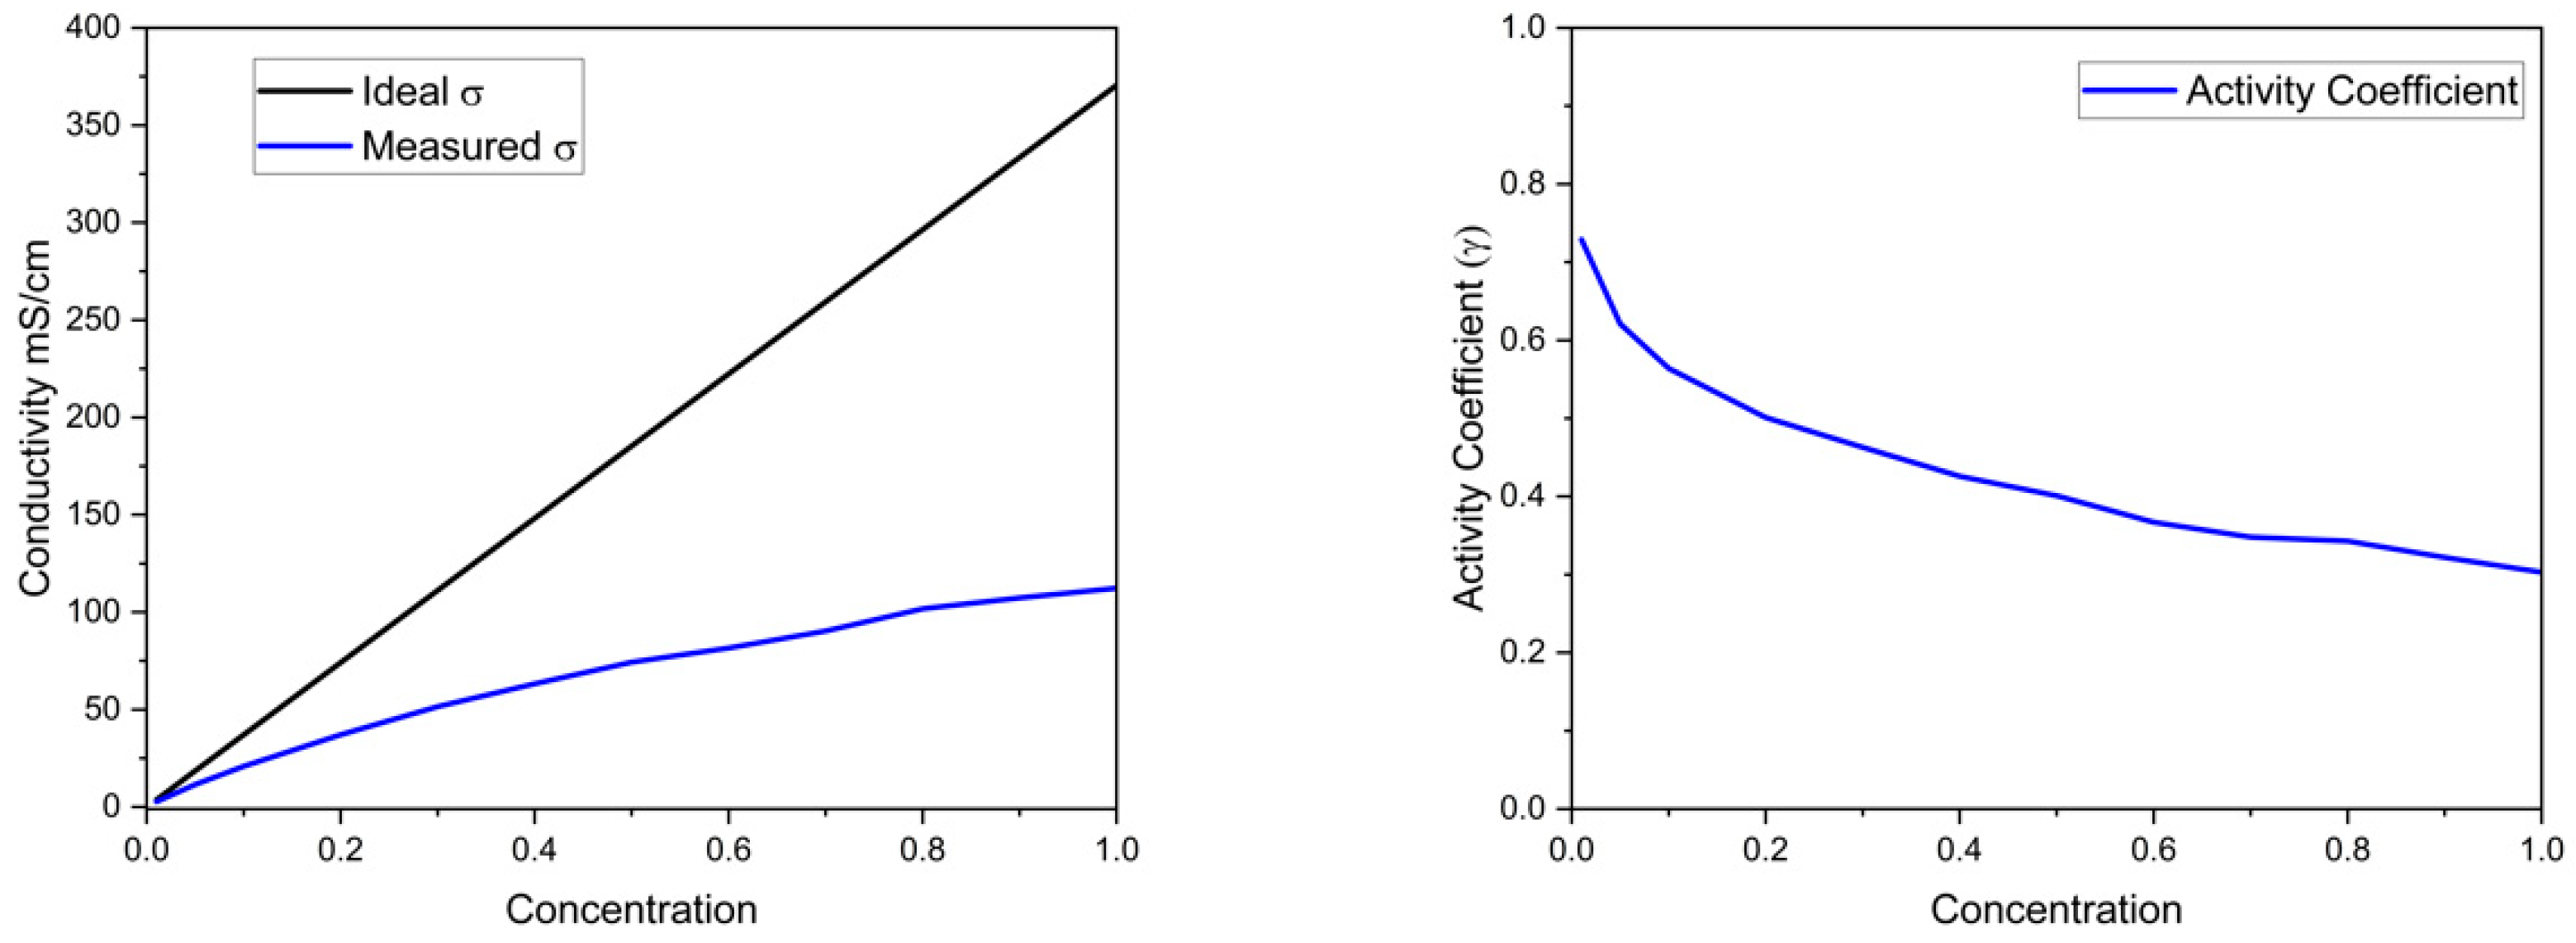
Figure 3 shows the actual conductivity vs. equimolar K
2HPO
4 and KH
2PO
4 concentration and the result for an ideal solution using the diluted solution values for equivalent conductance. The difference between the two is the resulting activity coefficient.
The measured conductivity for the equimolar KH
2PO
4/K
2HPO
4 solution deviated from the dilute solution equivalent conductance values, as expected. The difference between the measured conductivity and the dilute solution values is expressed as an activity coefficient, as shown on the right side of
Figure 3. The activity coefficient vs. concentration was used as a working curve to obtain the concentration in the electrodialysis cell.
As described in the experimental section, the equimolar buffer solution was fed into the two outer chambers of the cell, and the center compartment was preloaded with the same starting solution. The conductivity of each compartment was measured as a function of electrolysis current and time to determine the salt concentration in each chamber of the cell. The conductivity of the initial solution was 24 mS/cm ± 0.5 for all experiments. The first experiment was to establish the reproductivity of the concentration measurement method and ensure that soaking in the membranes did not change the conductivity of the solutions. The cell was assembled with membranes, electrodes and salt solutions, and soaked for 3 hr. The conductivity of the each compartment was measured after 3 h, and all three chambers had values within the 0.5 mS/cm of the initial value. The pH of the cell remained the same in each compartment.
The next control experiment involved operating the cell without membranes at 2.5 V for 1.5 h. The average current during the experiment was 141 mA. The conductivity in the solution (i.e., one large chamber) was within the 0.5 mS/cm of the initial value and the pH was unchanged. The acid and base produced at the anode and cathode, respectively, were neutralized, resulting in no net change in the solution, and salt migration during electrolysis did not change the conductivity because the solution was well mixed.
The goal of this effort was to investigate whether it is possible to extract salts from dilute feed solutions (i.e., in the outer chambers) producing a concentrated product stream (i.e., in the center chamber) without suffering the enormous voltage penalty across the dilute product stream between the two electrodes which normally occurs in ED. The full cell was assembled with an equimolar KH
2PO
4/K
2HPO
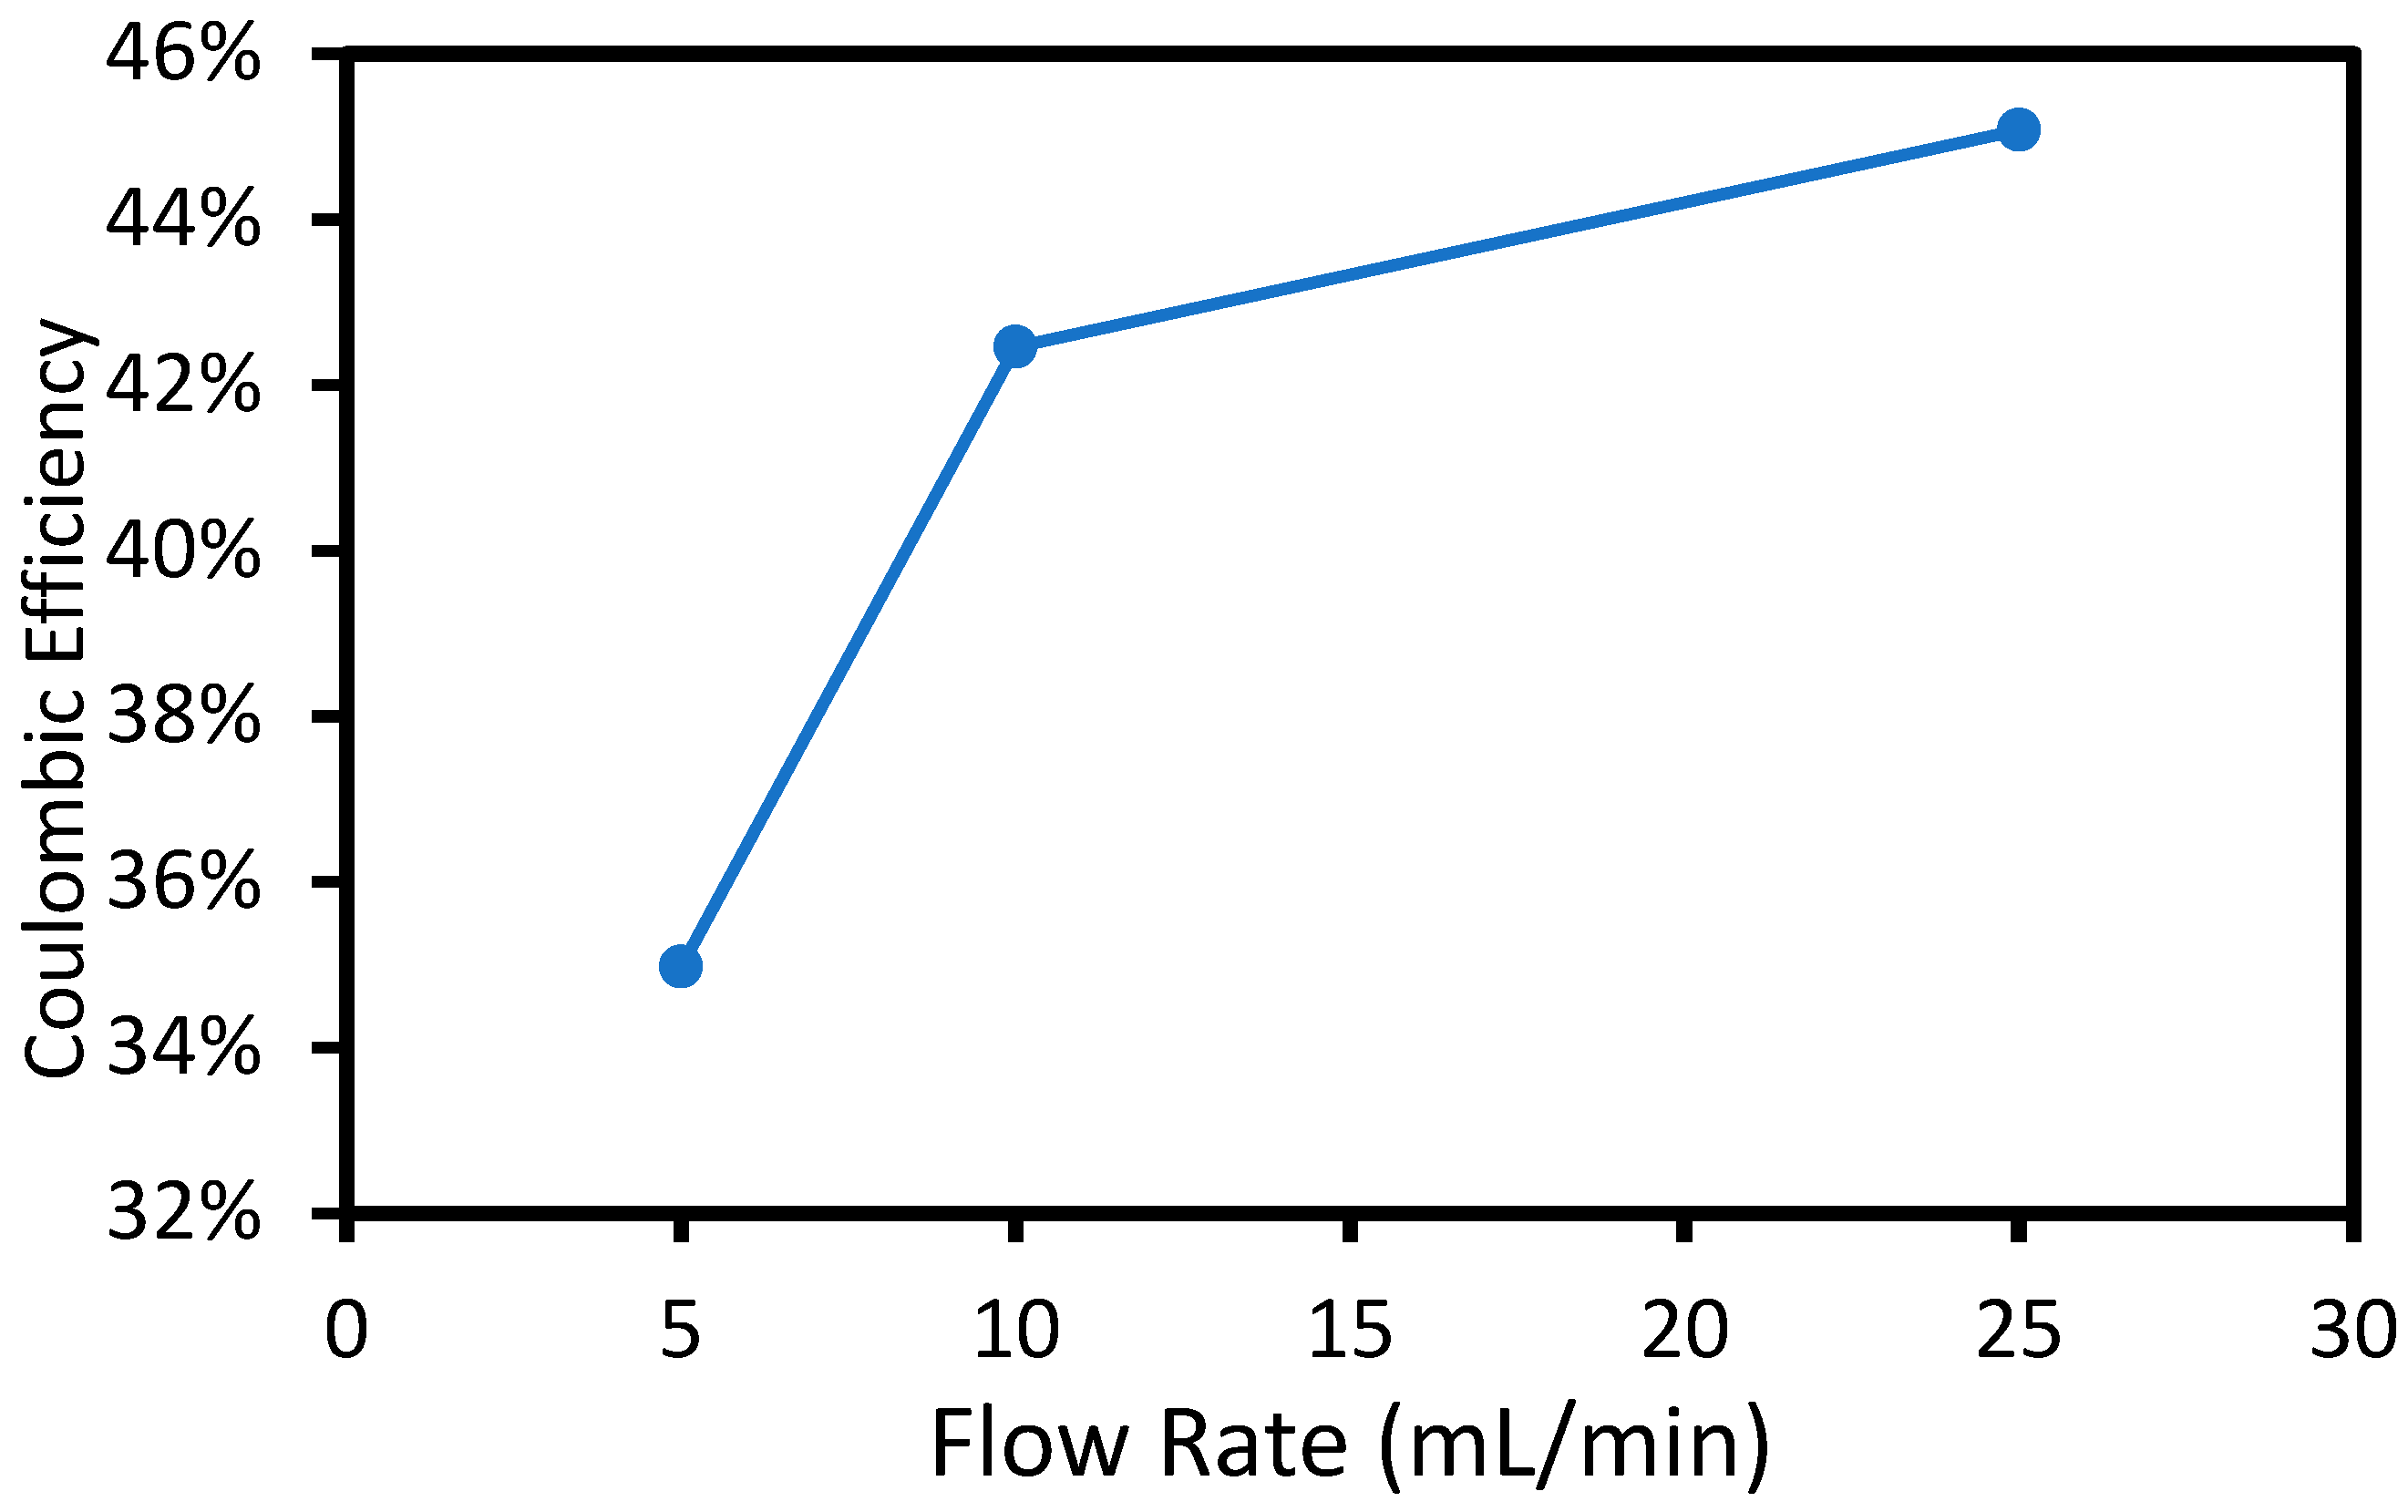
4 solution in each compartment. The applied voltage was 2.00 V, and the flow rate of the feed solutions in the two outer chambers was varied. The concentration of the product stream (i.e., center compartment) was determined by measuring the conductivity and pH of the center product stream. The total charge passed was determined by integrating the current (average value of 17 mA) with time. The resulting coulombic efficiency (moles of salt accumulated in the center product chamber divided by the moles of electrons) is shown below in
Figure 4.
The coulombic efficiency at 5 mL/min flow rate was 33%, which means that 33% of the charge resulted in migration and accumulation of KH2PO4/K2HPO4 salt product in the center chamber. The electric current caused ion migration in order to maintain charge neutrality. Only anions migrate through the AEM and only cations migrate through the PEM. The KH2PO4/K2HPO4 salt accumulation in the center compartment was lower than the expected, assuming only potassium and phosphate ions were mobile (i.e., 100% efficiency because H+ and OH− ions also migrated into the center compartment. If H+ and OH− migration occurred, it would not result in a conductivity change in the center compartment because they would react to form water. Thus, the remaining charge (i.e., 67%) was attributed to H+ and OH− migration into the center chamber resulting in water formation and no net change in KH2PO4/K2HPO4 concentration. Ion migration occurred only between the two electrodes because there was no electric field within the outer chambers. Thus, the KH2PO4/K2HPO4 salts were transported to the MEAs in the outer chambers by diffusion and convection. The type of ions transported across the membranes during electrolysis depends on the concentration and mobility of each ion. An increase in flow rate in the outer chambers resulted in improved coulombic efficiency due to higher mass transport of KH2PO4/K2HPO4 to the anode and cathode by convection-enhanced diffusion, making them more competitive for migration into the center compartment. As discussed in the experimental section, the flow rate of the bulk solution in the outside chambers affects the boundary layer between the electrode surface and the bulk-stock solution in the outer chambers. The higher feed flow rate increased the average Reynolds number from 3 × 10⁻⁴ to 0.2 in the feed compartments, resulting in a decrease in the boundary layer thickness for the electrodes. By decreasing the boundary layer, the KH2PO4/K2HPO4 ions had a shorter distance to travel in order to diffuse to the membrane–electrode interface, which made them more competitive with H+ and OH− migration into the middle chamber.
The three-flow-rate experiment (
Figure 4) was repeated using different applied voltages, as shown in
Figure 5. The average current at 2.75 V and 3.5 V is shown in
Table 2. The current rose rapidly with applied voltage (non-linear) because the activation overpotential for water electrolysis decreases at higher overpotential. The added cell voltage was used primarily to overcome ionic resistance between the two electrodes.
The trend of higher coulombic efficiency with flow rate (constant voltage) shows the benefit of decreasing the diffusive boundary layer thickness. A thinner boundary layer improved the net flux (considering diffusion) to the two electrodes. The improved coulombic efficiency with flow rate in the outer chambers is expected because the diffusive boundary layer thickness (and thus mass transfer coefficient) scales with the square root of the velocity (flow rate). Any efficiency losses can be attributed to the competition for crossover with protons and hydroxide. Although the pH remained close to 7 due to the buffer, the local pH at the electrodes can deviate from that of the bulk solution. The protons that are made at the anode and hydroxides that are made at the cathode can cross the membranes and combine to form water in the center compartment, which does not result in product collection in the center compartment.
In addition to improved coulombic efficiency with higher flow rate, there was also an increase in coulombic efficiency with current. Higher current resulted in higher overall ion flux into the center compartment. It is interesting that the higher overall flux also resulted in the KH
2PO
4/K
2HPO
4 salt being more competitive with H
+ and OH
− migration into the center chamber (i.e., higher efficiency). The reactant feed into the anode and cathode chamber resulted in laminar flow across the surface of the electrodes. The higher current should increase the diffusive boundary layer thickness and decrease the diffusive mass transport coefficient. The data, however, shows the opposite effect on the coulombic efficiency. Instead, increasing the current (via higher voltage) improved the competitiveness of KH
2PO
4/K
2HPO
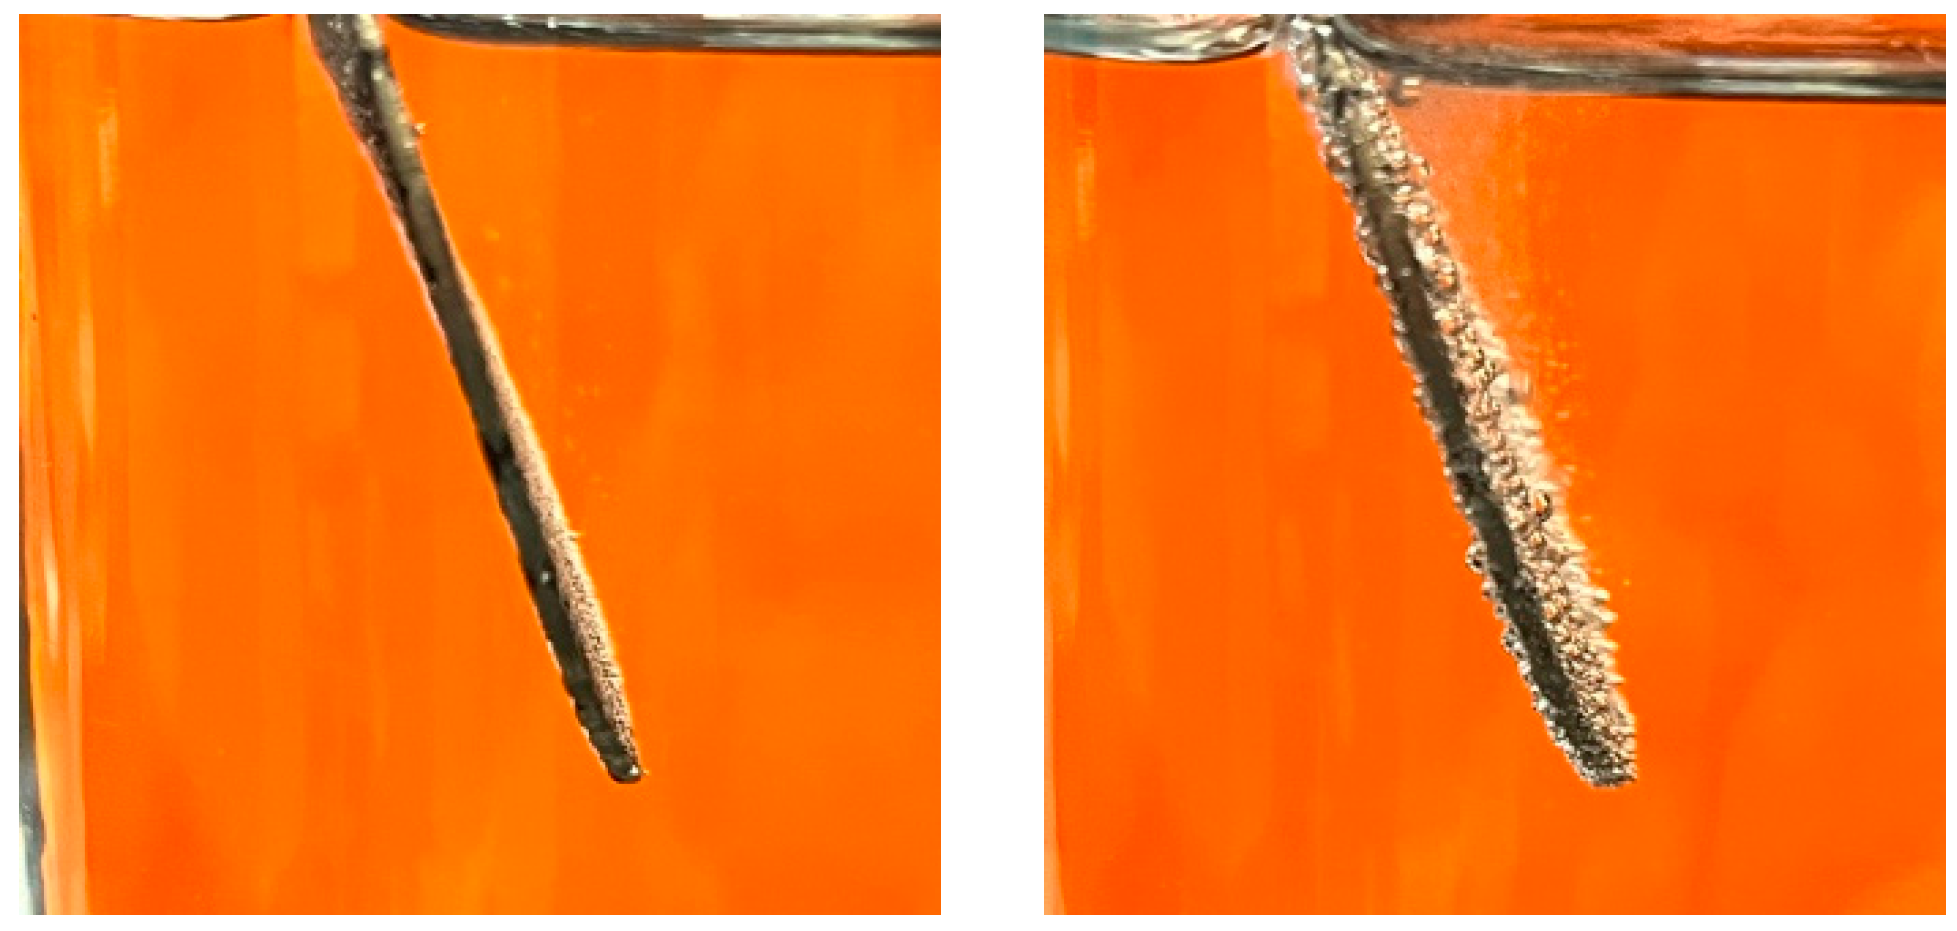
4 for migration into the product stream. This improvement in coulombic efficiency was due to contribution of convective mass transport from bubble formation during electrolysis. It was observed that at higher voltage, the bubbles formed from electrolysis of water were large and contributed significant convective mass transfer. This local agitation moved the mass transfer from the diffusion-dominated regime into the convective regime. As shown in
Figure 6, the bubbles at the surface of the electrodes caused agitation at the surface of the electrodes, resulting in a decrease in boundary layer thickness and increasing the mass transfer coefficient.
KH2PO4/K2HPO4 electrolysis resulted in a higher salt concentration in the center compartment compared to the feed streams in the outer compartments. This raises the question of osmotic pressure-driven flow of water from the outer compartments into the center compartment. The osmotic pressure changes due to a concentration change from 0.1 M to 1.0 M in the center compartment is 16.7 bar, as seen from Equations (8) and (9). Thus, the osmotic pressure due to the concentration increase of the product stream caused water to permeate into the center compartment from the outer feed streams. However, this dilution effect of the product stream could be mitigated by pressurizing the middle compartment by the addition of a throttle valve on the product stream outlet. The burst pressure of the membranes used is typically in excess of 30 bar. The middle compartment could be operated at 30 bar to keep the osmotic flow below zero for a 1.0 M increase in concentration between the feed and product streams. In addition, a staged approach to the zero-gap electrolysis cell could be considered where the change in concentration difference between the feed and product streams is 1 M at each stage.
It is also interesting to consider the upper limit to the concentration of the product stream using this electrodialysis approach. Ultimately, the concentration limit of the product stream, without considering reverse osmosis dewatering of the product stream, is limited by the number of waters of hydration carried by each ion into the center product chamber. Potassium has six waters in its solvation shell [
14]. HPO
42− has a solvation shell of 12 at 1 M, and H
2PO
4− has a solvation shell of 18 at 1 M [
15]. Assuming an equimolar feed solution of KH
2PO
4 and K
2HPO
4, the maximum concentration of ions in the product chamber would be 6.7 M (8.25 waters per ion on average). If the product stream pressure was maintained at a value higher than the osmotic pressure (in a single- or multi-stage electrodialysis device), dewatering of the product could occur, resulting in concentrations higher than 6.7 M. The concentration increase as a final molarity and percent increase in concentration is shown in
Table 3. The high voltage and fast flow rate concentrated the cell by 75%. Using Equations (8) and (9) and assuming an osmotic coefficient of 0.75, the osmotic pressure in the cell is 27.2 atm for KH
2PO
4 and 40.8 atm for K
2HPO
4 for a total osmotic pressure of 68 atm in the center compartment.
Hydrogen can be economically made by water electrolysis, as performed here, to drive the electrodialysis. The economic analysis of this system depends on the value of the concentrated salt product stream vs. the additional voltage required for ED (i.e., the voltage over and above that for electrolysis). To investigate the economics of this cell, the voltage drop across the cell at the three potentials used was measured and is reported in
Table 4. Using the measured voltage drop across the cell due to solution and membrane resistance and the average current, the cost of salt separation was calculated. Attributing the full voltage drop across the membranes and electrolyte to ED is an overestimate because an electrolysis system would also have an ohmic voltage drop, although less than that encountered here. A price per kWh of
$0.05 and cell efficiency of 54.18% (
Table 2) was assumed, and the cost of salt production was found to be
$0.97/kmol. Using the same cell gap and current density in a traditional ED configuration to produce 0.1 mM dilute water product would result in approximately a 1000× higher voltage penalty and electricity cost. This factor of 1000× electricity cost increase for traditional ED is unrealistic and would necessitate a change in cell design (a much thinner center compartment) and lower current density, driving up the size of the device and thus the cost of balance of plant.
A common salt that could be recovered is potassium nitrate. This cell’s price of
$0.97/kmol is very competitive with the value of nitrogen used in fertilizer solution:
$7.01/kmol N (
$500/ton N) [
16]. A more valuable salt product would be even more advantageous to collect. In the EWAS process, the recovery of fatty acids is also possible. A preliminary result using sodium acetate showed that the cell could concentrate carboxylate ions.
One of the clear advantages of this cell over traditional ED is that the cell can be used to concentrate ions between the electrodes, so the electrodialysis voltage penalty decreases as the cell operates and the product in the center compartment becomes more concentrated. ED often uses multiple feed and product solutions between the electrolysis electrodes so that one solution increases in concentration while the alternate one decreases in concentration. Compared to traditional ED, this zero-gap electrode has several advantages. First, traditional ED passes ionic current through dilute and concentrated product streams. One of the feed solutions between the electrolysis electrodes becomes more dilute with time, and the conductivity between the electrodes decreases. The voltage drop across the more concentrated product solution decreases; however, this is more than offset by the increase in the voltage drop across the dilute product stream. This increase in solution resistance scales with the concentration of ions, and recovering half the ions will thus double the resistance. After the first 50% of ions have been recovered, the same voltage penalty must be paid to collect only half as many ions as before, causing the solution resistance to quickly become an issue. The cell demonstrated here has a lower voltage drop across the product stream with time as the concentration of ions increased in the middle compartment, reducing the solution resistance. Second, as a result of the extreme voltage penalty across the dilute product stream, traditional ED is forced to use an extremely thin cell across the product stream, such as a cell with a width of 0.1 mm. This makes device configuration very challenging because it is hard to transition from large circular pipes to thin narrow slots, and small particles will easily clog the thin slots. In the zero-gap, concentrate-only cell demonstrated here, cell gaps in the order of cm can be used (100 times larger), making device construction easier and less sensitive to small particles. Third, the energy required per mole of product is proportional to the voltage drop across the ionic product solution. Traditional ED seeks to produce high-resistance, nearly pure water, whereas the zero-gap approach here is designed to produce a concentrated product whose conductivity is orders of magnitude higher. This allows for rapid removal of product at high current density. However, the zero-gap design has a lower coulombic efficiency (e.g., 50%), which raises the cost per mole of product. Last, the high current density and large cell gaps with the zero-gap design lowers the overall balance of the plant and the cost of maintenance, making it more scalable.


