Article

Electrodialysis Metathesis for the Production of Potassium Phosphate

1
State Key Laboratory of Chemical Engineering, School of Chemical Engineering and Technology, Tianjin University, Tianjin 300350, China
2
Tianjin Key Laboratory of Membrane Science and Desalination Technology, School of Chemical Engineering and Technology, Tianjin University, Tianjin 300350, China
*
Authors to whom correspondence should be addressed.
Membranes 2025, 15(5), 136; https://doi.org/10.3390/membranes15050136
Submission received: 20 March 2025 / Revised: 20 April 2025 / Accepted: 27 April 2025 / Published: 1 May 2025
(This article belongs to the Section Membrane Applications for Water Treatment)

Abstract

:
Potassium phosphate (K3PO4) is a common inorganic compound with broad applications in agriculture and industry. Although the traditional thermal method of preparing K3PO4 by reacting phosphoric acid with potassium hydroxide can obtain high-quality products, it consumes a lot of energy and has high costs. This study explores the process of preparing K3PO4 by Electrodialysis metathesis (EDM). This process uses sodium phosphate (Na3PO4) and potassium chloride (KCl) as raw materials and can prepare K3PO4 continuously. Under the optimized conditions (operating voltage of 8 V, 0.35 mol/L Na3PO4 and 1.05 mol/L KCl in raw flow with the rate of 30 mL/min), the product purity of K3PO4 reaches more than 97%, the energy consumption is 1191 kW·h/t, and the cost is about 8314 CNY/ton. Compared with traditional methods, EDM has the advantages of low cost, simple operation, and high utilization rate. This study shows that EDM technology has significant potential in preparing K3PO4.

1. Introduction

Potassium phosphate (K3PO4) is a common inorganic compound widely used in various agricultural and industrial fields, such as agricultural fertilizers, food additives, detergents, catalysts, and extractants [1,2]. Currently, the production of K3PO4 is simple by reacting thermal phosphoric acid with potassium hydroxide. This method can obtain high-quality products, but its energy consumption is high, resulting in high prices for K3PO4 products. Therefore, with the growing demand for K3PO4, developing low-cost methods for the K3PO4 product is significant.
Based on electrodialysis (ED) [3], electrodialysis metathesis (EDM) is a technology that converts one salt into another salt through the reaction between two different salts [4,5]. EDM can efficiently separate multiple ions, with the advantages of being environmentally friendly, having high purity, and low energy consumption [6,7,8,9]. Its unit component usually consists of four ion exchange membranes (alternating cation and anion membranes) [10], including two desalination chambers and two concentration chambers. The ions in the desalination chamber selectively pass through the membrane and generate the desired products, which are difficult to produce under normal conditions [11].
In recent years, EDM has been widely used in the fields of the conversion of high-value salt resources [12,13], treatment of saline wastewater [14,15,16], preparation of ionic liquids [17], and synthesis of organic compounds [18,19]. In the field of salt conversion, EDM can be used to prepare chlorine-free potash fertilizers (such as KNO3 [20], K2SO4 [21,22], etc.), lithium salts (such as LiNO3 [23], CH3COOLi [24]), etc., with the advantages of low cost and high purity. However, there is no report on the production of phosphate by EDM.
Therefore, we employ EDM to prepare the K3PO4 product with high purity and concentration in a continuous operation mode here. The Na3PO4 and KCl were used as the raw materials. We studied the effects of voltage, flow rate, and feed concentration on ion flux, product concentration, purity, current efficiency, and energy consumption, and optimized the process parameters. This paper provides a new strategy for the green synthesis of phosphate products.

2. Experimental Section

2.1. Experimental Materials
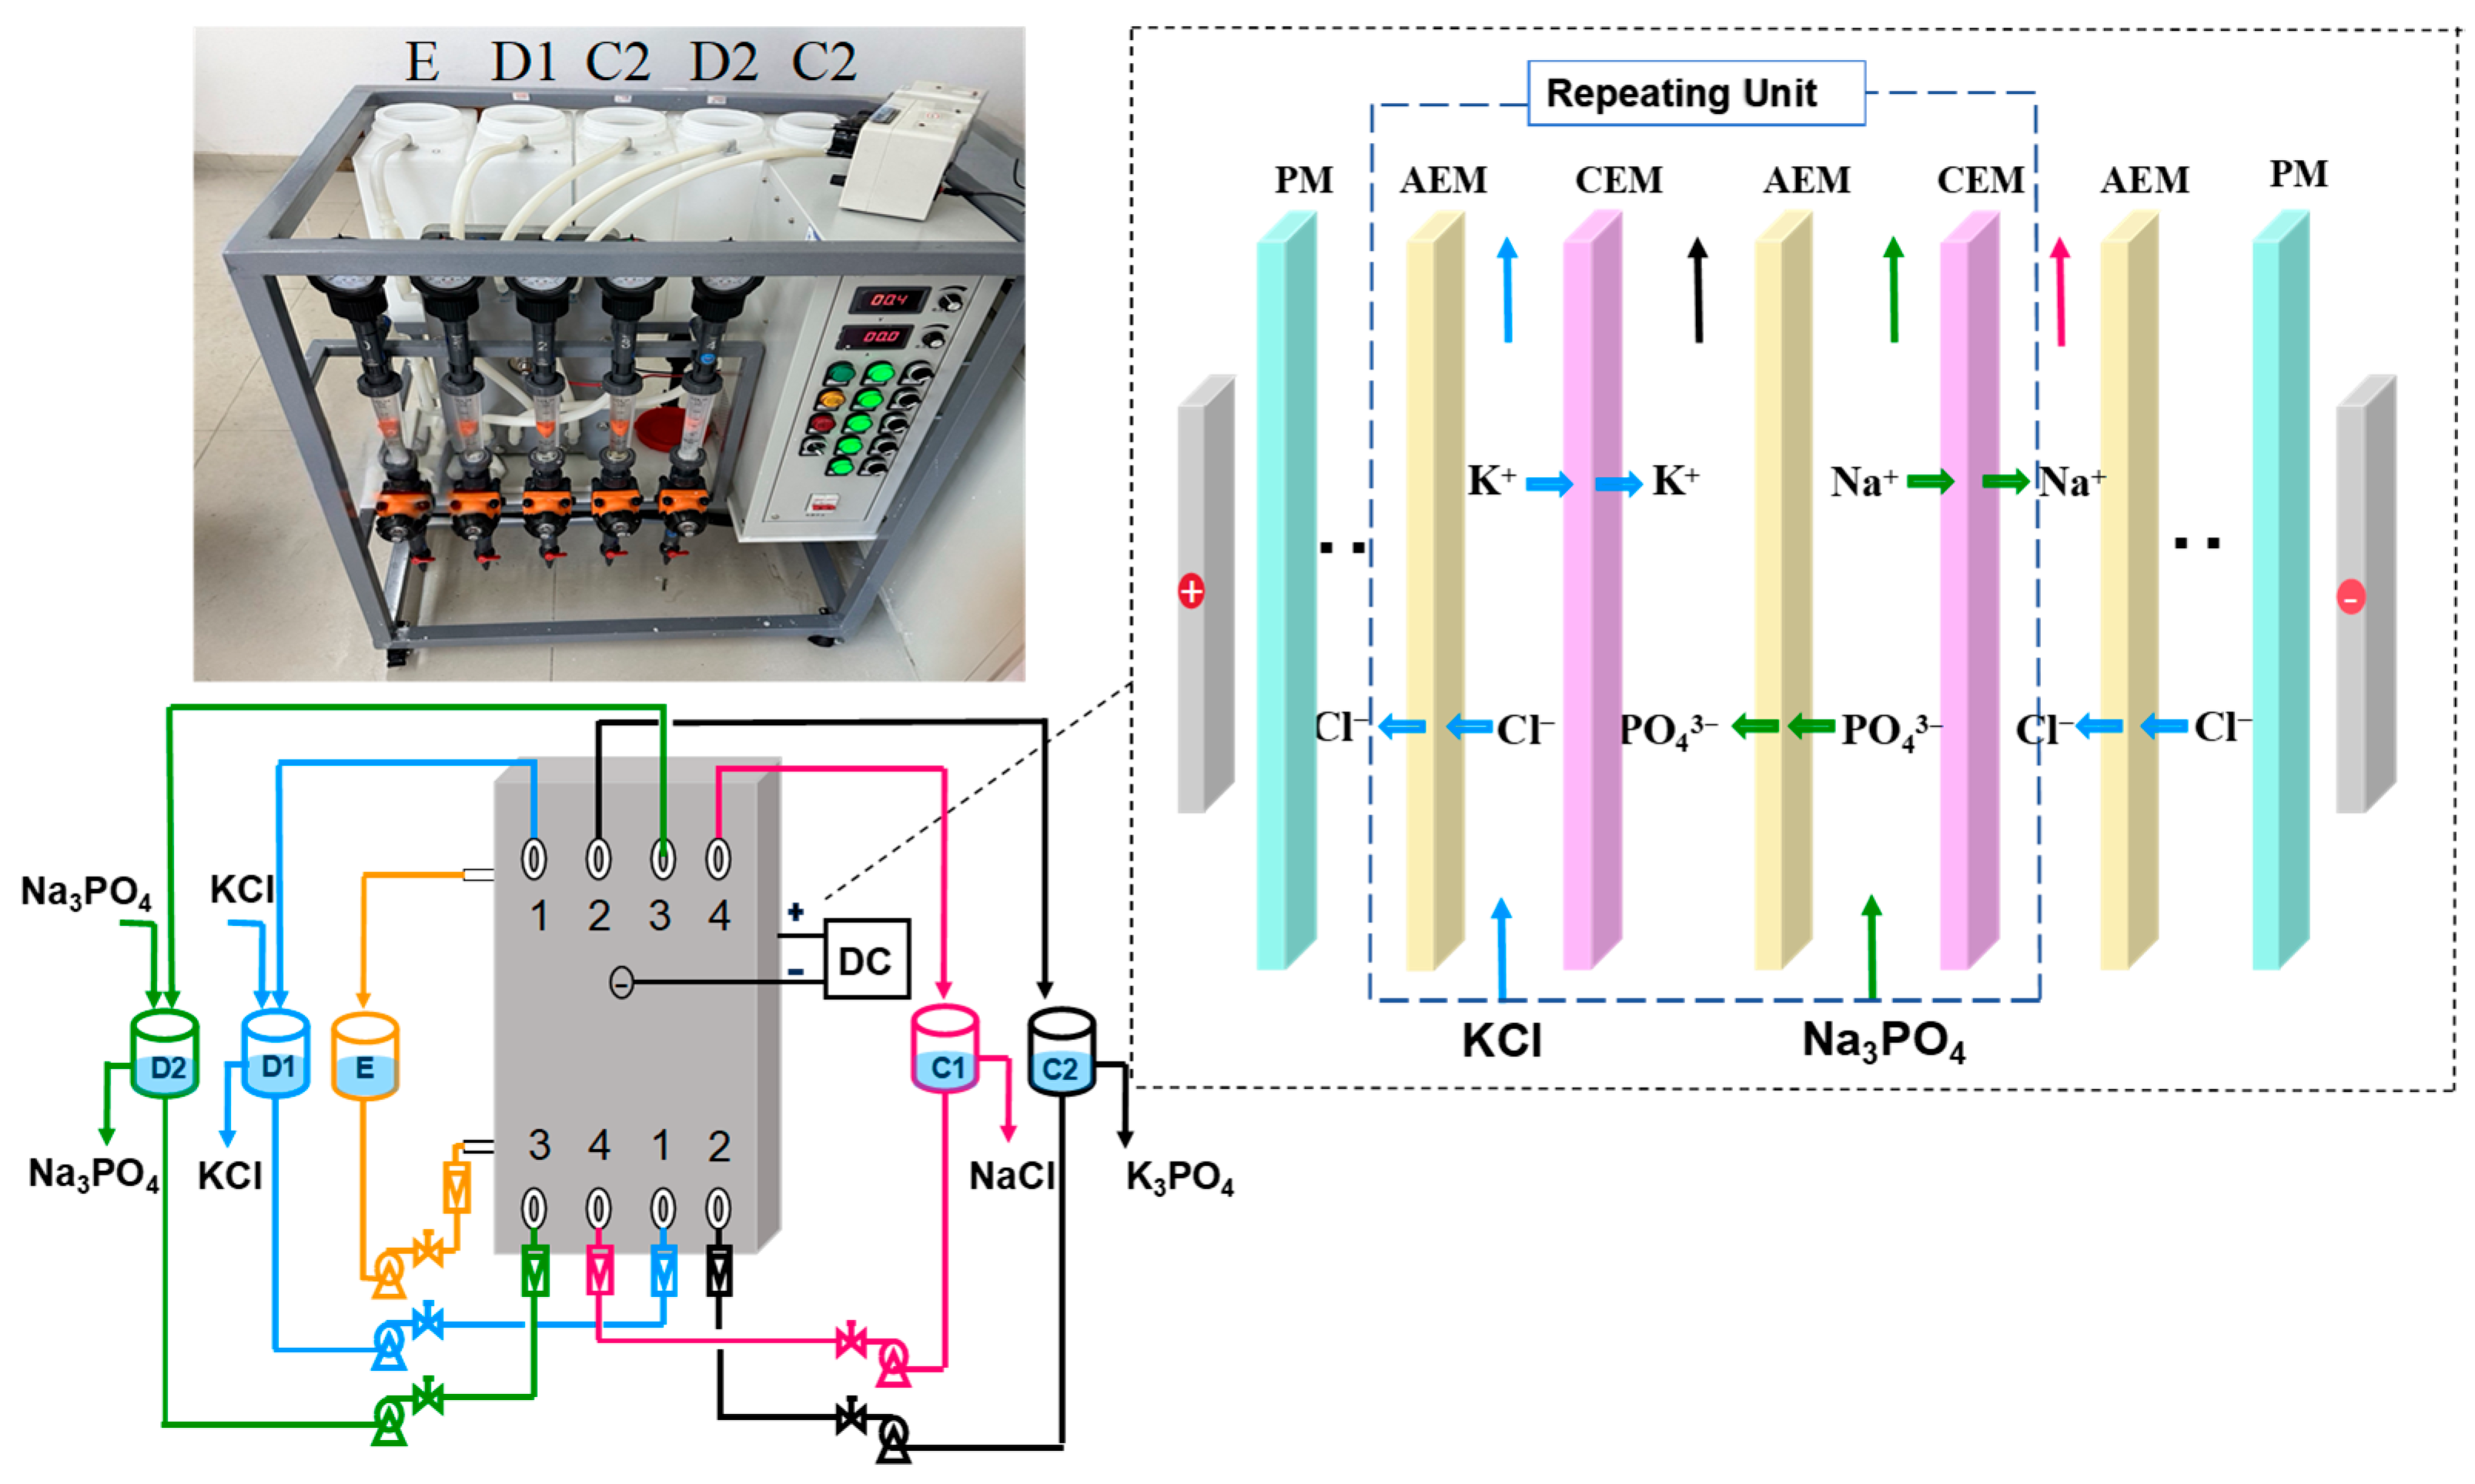
Potassium chloride and sodium phosphate were purchased from Shanghai Dibo Biotechnology Co., Ltd., Shanghai, China, and sodium chloride and potassium phosphate were purchased from Shanghai Bide Pharmaceutical Technology Co., Ltd., Shanghai, China. All reagents were analytically pure. The experimental water was homemade deionized water (conductivity < 10 μS/cm). YRJ cation exchange membrane (CEM) and YRJ anion exchange membrane (AEM) were purchased from Fujian Yanrun Membrane Environmental Protection Technology Co., Ltd., Quanzhou, China. The effective area of each membrane is 0.0442 m2. The spacer thickness is 0.1 cm, and the height of the flow channel is 26 cm. Their main properties are listed in Table 1.

2.2. EDM Equipment

The laboratory-scale EDM system includes a DC power supply, a membrane stack, pumps, and solution tanks.
There are 4 repeating units of ion exchange membranes in the whole membrane stack, each consisting of two AEMs and two CEMs. There is a CEM as the electrode membranes (PM) on each side of the electrode plates (Figure 1). The EDM experimental apparatus includes two desalination chambers (Na3PO4 and KCl), two concentration chambers (K3PO4 and NaCl), and an electrode chamber. The experiment was operated in a constant voltage operation mode. The KCl water tank is marked D1, the Na3PO4 water tank is marked D2, the NaCl water tank is marked C1, the K3PO4 water tank is named C2, and the electrode chamber liquid tank is marked E.

2.3. EDM Experimental Procedure

Before the experiment, the prepared KCl and Na3PO4 raw solutions were added to the desalted water tanks D1 and D2. A certain amount of NaCl solution and K3PO4 solution was added to the concentration tanks C1 and C2, respectively. A 3% Na3PO4 solution was added to the electrode tank. Start the power supply, turn on the circulation pump switch, let the solution in the water tank enter each compartment in the membrane stack, and then return to their respective water tanks. The flow rate of the concentration chamber and the desalination chamber is set to 100 L/h. The flow rate of the electrode chamber is also set to 100 L/h. When there are no bubbles in the tube, turn on the DC power supply, adjust the voltage to the set value, and add the KCl and Na3PO4 raw solutions of equal concentration to the desalted water tanks D1 and D2 at a constant flow rate. The 20 mL samples were taken out every hour. Meanwhile, the pH values of the solutions were measured for the desalination chamber and concentration chamber.

2.4. Analysis and Calculation

2.4.1. Concentration Analysis Methods

The concentration of K⁺ ions was determined using the volumetric method with the tetraphenylborate quaternary ammonium salt reagent [25]. The concentration of Cl⁻ ions was measured using the silverometric method [25]. The concentration of PO43⁻ ions was determined using the phosphomolybdate quinoline gravimetric method [26]. The concentration of Na⁺ ions was calculated using charge conservation, as shown in Equation (1):
C N a + = 3 C P O 4 3 + C C l C K +

2.4.2. Parameter Calculation Methods

1.
Ion flux;
Ion flux refers to the number of ions passing through a membrane per unit area per unit time (Equation (2)).
J i o n , C i = i 1 i c d t × ( V i + V ) + ( c i c i 1 ) × V c N × s × t
In the equation, Jion,Ci is the ion flux in the concentration chamber, mol/(m2 h); c is the ion concentration at equilibrium, mol/L; t is the time interval between two samplings, 1 h; i denotes the i-th hour; Vi is the overflow volume of the concentrated product at the i-th hour, L; V is the sample volume taken each time, 0.02 L; Ci is the ion concentration in the concentration chamber at the i-th hour, mol/L; Vc is the volume of the concentration tank, 5.1 L; N is the number of the repeating units in membrane stack, 4; S is the effective area of each membrane, 0.0442 m2.
2.
Apparent water flux;
The apparent water flux refers to the increase in the number of water molecules migrating per unit time per unit membrane area in the concentration chamber (Equations (3) and (4)).
J w , C 1 = ρ i , c 1 × V i , c 1 V i , c 1 × i 1 i c d t × M N a C l M H 2 O × N × s × t
J w , C 2 = ρ i , c 2 × V i , c 2 V i , c 2 × i 1 i c d t × M K 3 P O 4 M H 2 O × N × s × t
In the equation, JW,C1 and JW,C2 are the apparent water fluxes to C1 and C2 from both membranes forming the compartment, respectively; ρi,c1 and ρi,c2 are the densities of the overflow solution at the i-th hour, g/L; Vi,c1 and Vi,c2 are the volumes of overflow solutions, L; MNaCl is the molar mass of NaCl, 58.5 g/mol; MH2O is the molar mass of water, 18 g/mol; MK3PO4 is the molar mass of K3PO4, 212.6 g/mol.
3.
Energy Consumption;
Energy consumption refers to the amount of electrical energy required to produce 1 ton of product (Equations (5) and (6)).
W K 3 P O 4 = U × I × t × 1000 c × V × M K 3 P O 4
W N a C l = U × I × t × 1000 c × V × M N a C l
In the equation, U is the stack voltage, V; I is the equilibrium current, A; t is the equilibrium time, 1 h; c is the equilibrium concentration of K3PO4 or NaCl, mol/L; V is the overflow volume of K3PO4 or NaCl within 1 h, L.
4.
Current efficiency;
The current efficiency refers to the percentage of the migrated ions in relation to the total electrical quantity between membranes (Equations (7) and (8)).
η K 3 P O 4 ( % ) = c × V × F × z N × I × t × 100
η N a C l ( % ) = c × V × F × z N × I × t × 100
In the equation, c is the equilibrium concentration of K3PO4 or NaCl, mol/L; V is the overflow volume of K3PO4 or NaCl within 1 h, F is the Faraday constant, 96,485 C/mol; z is ionic chemical valence.
5.
Purity.
Purity refers to the proportion of K3PO4 or NaCl in the product (Equations (9) and (10)).
P K 3 P O 4 % = c × M K 3 P O 4 c j × M j × 100 %
P N a C l % = c × M N a C l c j × M j × 100
In the equation, c is the equilibrium concentration of K3PO4 or NaCl, mol/L; cj is the concentration of each component in the mixture (where j refers to K+, Na+, Cl, PO43−), mol/L; Mj is the molar mass of each component in the mixture (where j refers to K+, Na+, Cl, PO43−), g/mol.

3. Results and Discussion

3.1. Effect of Voltage

Voltage is a critical parameter in the EDM process and can provide the primary driving force for the mass transfer of ions. Here, we conducted the EDM in constant voltage mode, with the voltages set at 6 V, 7 V, 8 V, and 9 V. The feed flow rate of both Na3PO4 and KCl solutions was maintained at 30 mL/min, with the feed concentration of Na3PO4 set at 0.3 mol/L and that of KCl at 0.9 mol/L. The experimental temperature was maintained at 25 °C. The linear flow velocity is 2.67 cm/s.

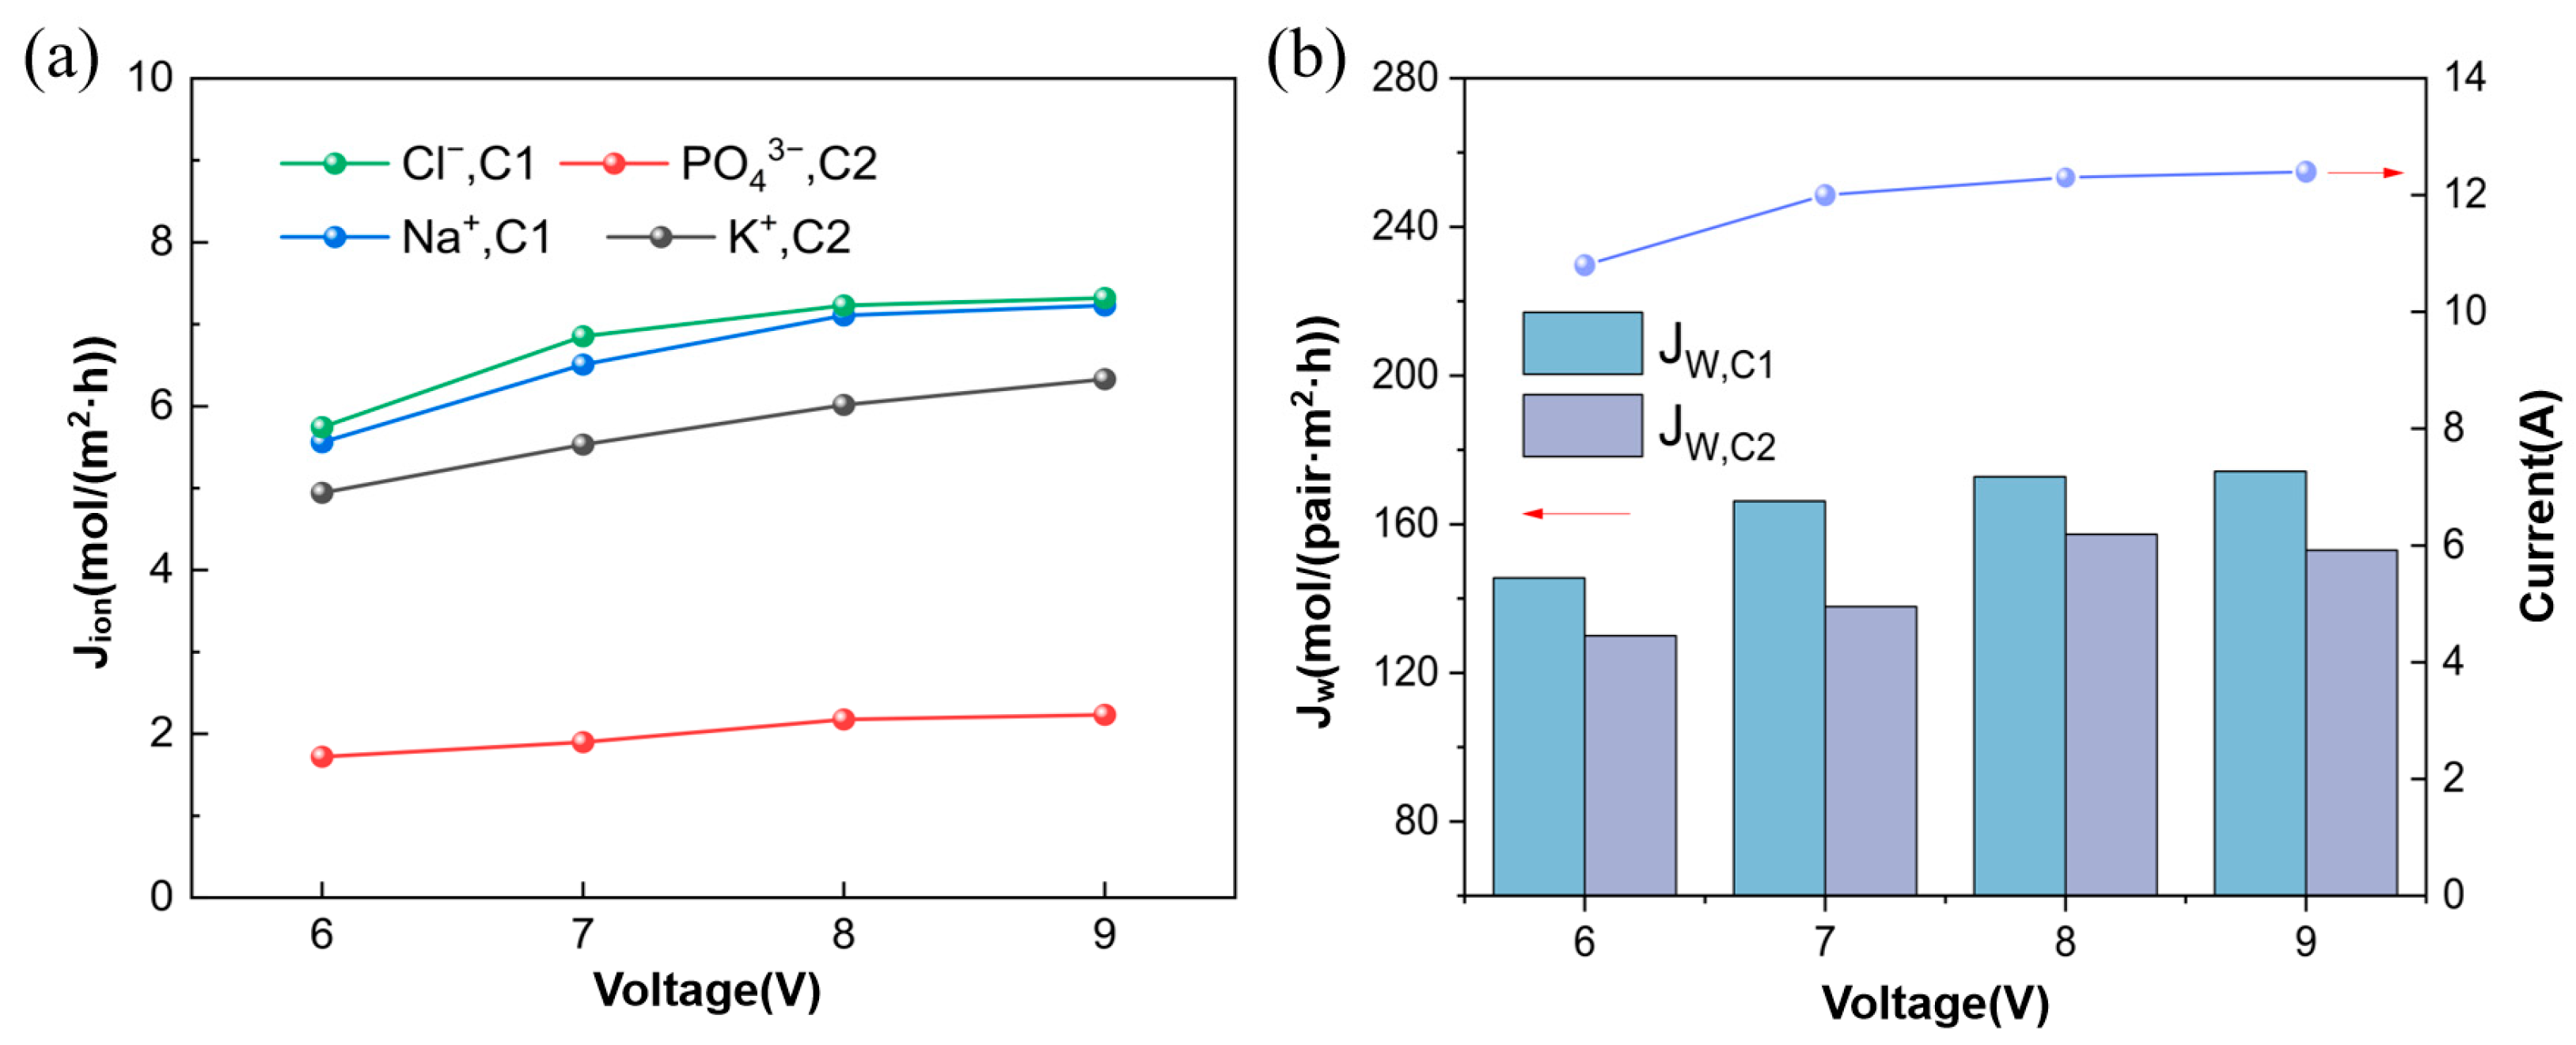
3.1.1. Ion Flux and Apparent Water Flux

As the voltage increases, the ion flux significantly enhances and eventually reaches a plateau, as shown in Figure 2a. The current trend is also shown in Figure 2b. Because the increase in voltage accelerates the ion migration rate, the ion concentration in C1 increases while the ion concentration in the desalination chambers rapidly decreases. In Figure 2a, it can also be observed that JNa+, C1 is approximately equal to JCl,C1, while JK+,C2 is about three times that of JPO43−,C2. JK+,C2 is lower than both JNa+,C1 and JCl,C1. Due to the high charge of the phosphate ion, the electrostatic interaction with K⁺ is strong, resulting in a lower flux of K⁺ compared to JNa+,C1, and JCl,C1. The transport mechanism of water through ion exchange membranes involves two key effects. One is driven by concentration gradients, and the other is by the electromigration of hydrated ions under the influence of an electric field [20]. As the voltage increases, both the ion flux and concentration in the concentration chambers significantly increase, leading to a gradual rise in the apparent water flux JW, as shown in Figure 2b. The steady-state current under different voltages is shown in Figure 2b. Under the conditions of 6 V, 7 V, 8 V, and 9 V, the current densities are 24.4 mA/cm2, 27.1 mA/cm2, 27.8 mA/cm2, and 28.1 mA/cm2, respectively.

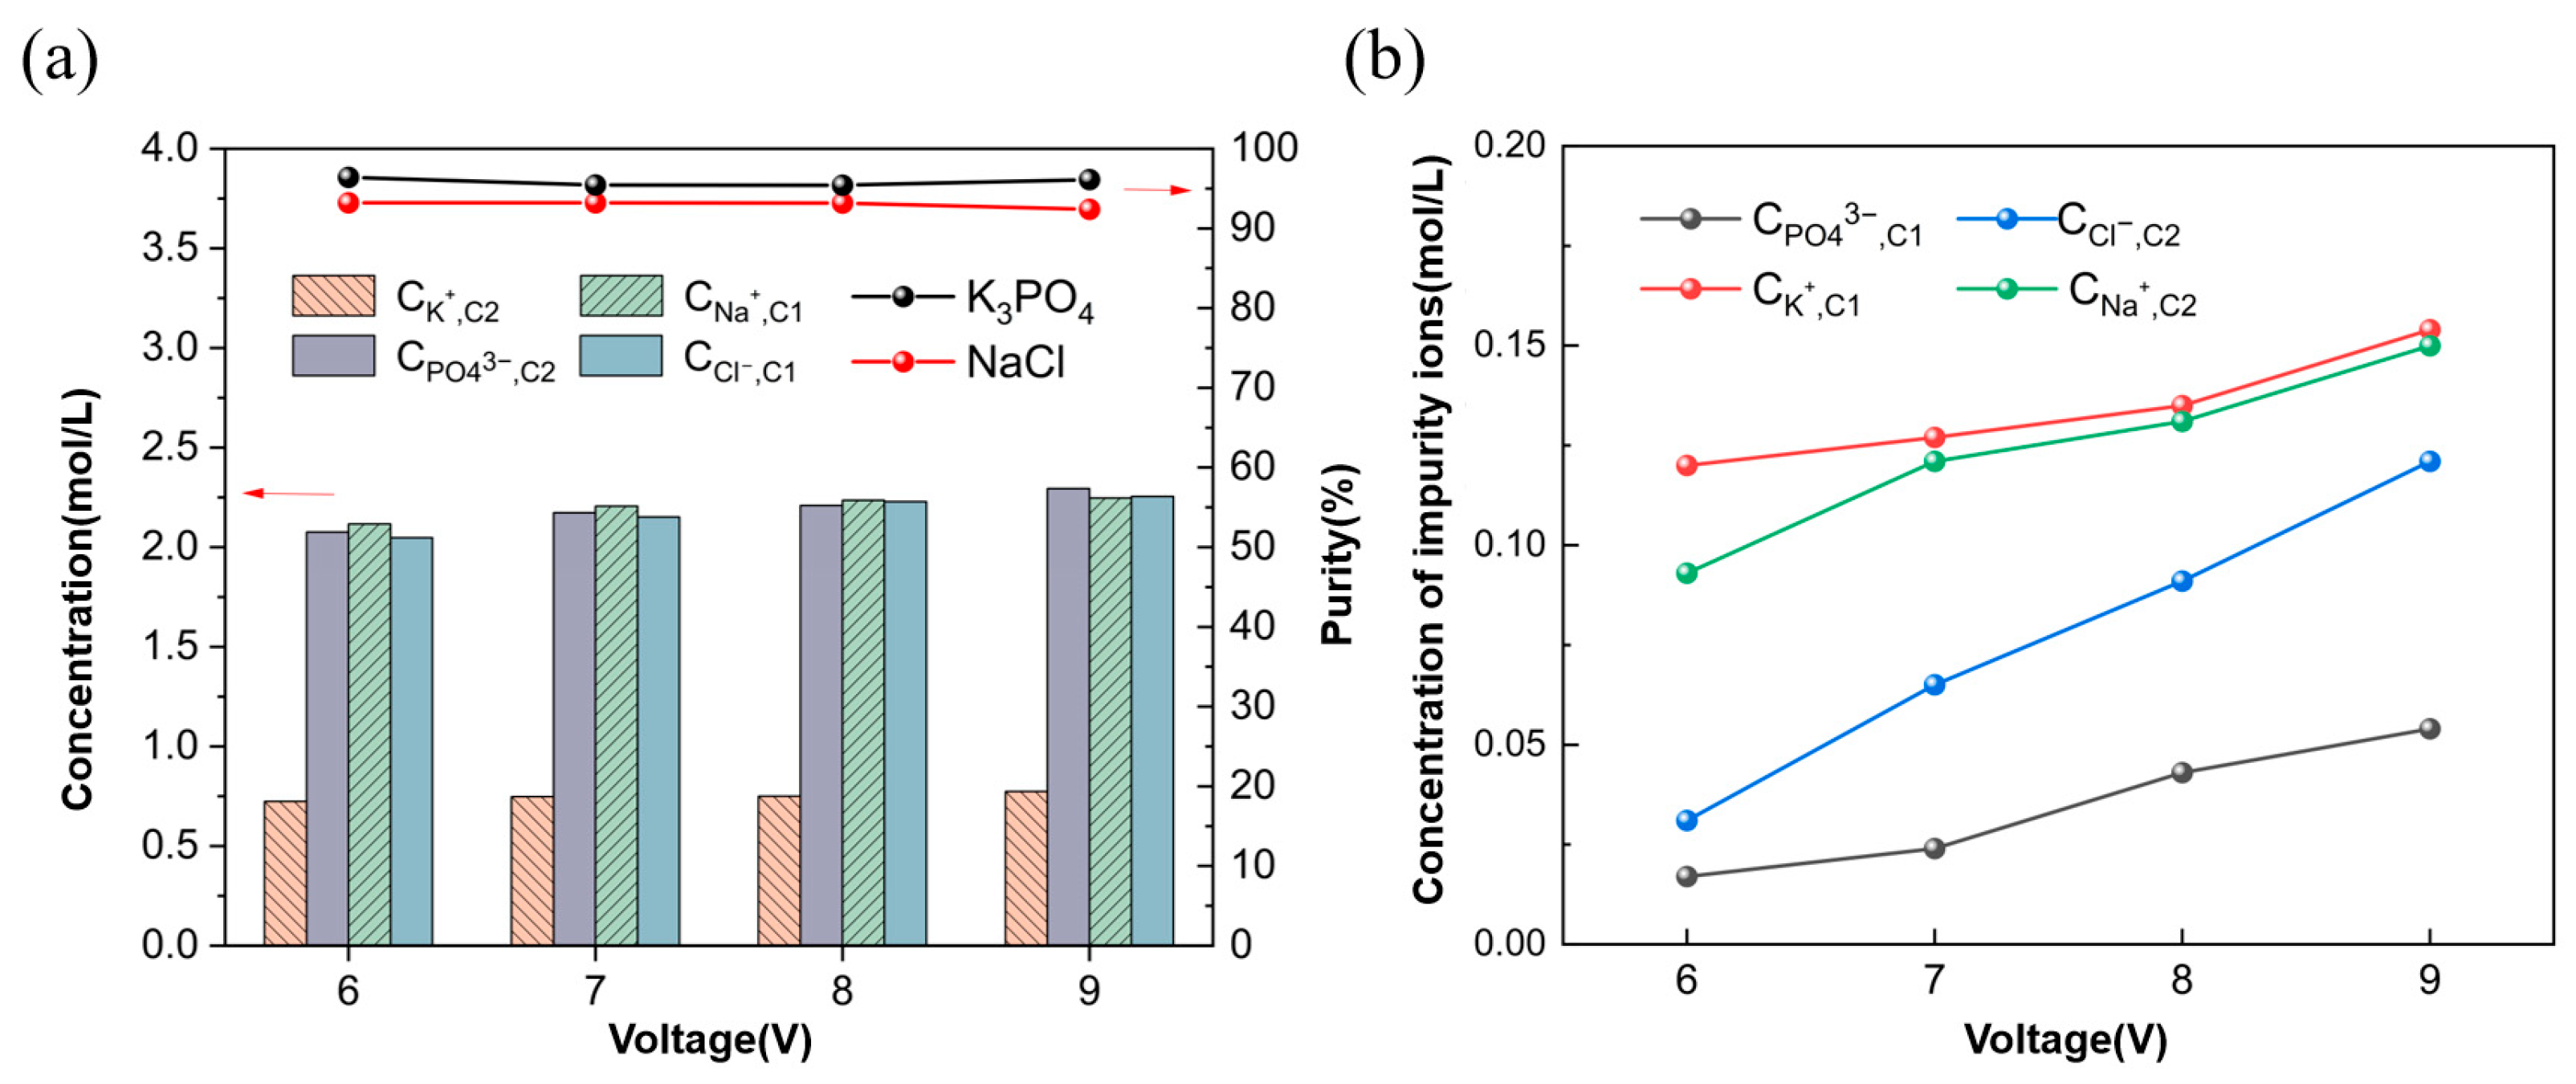
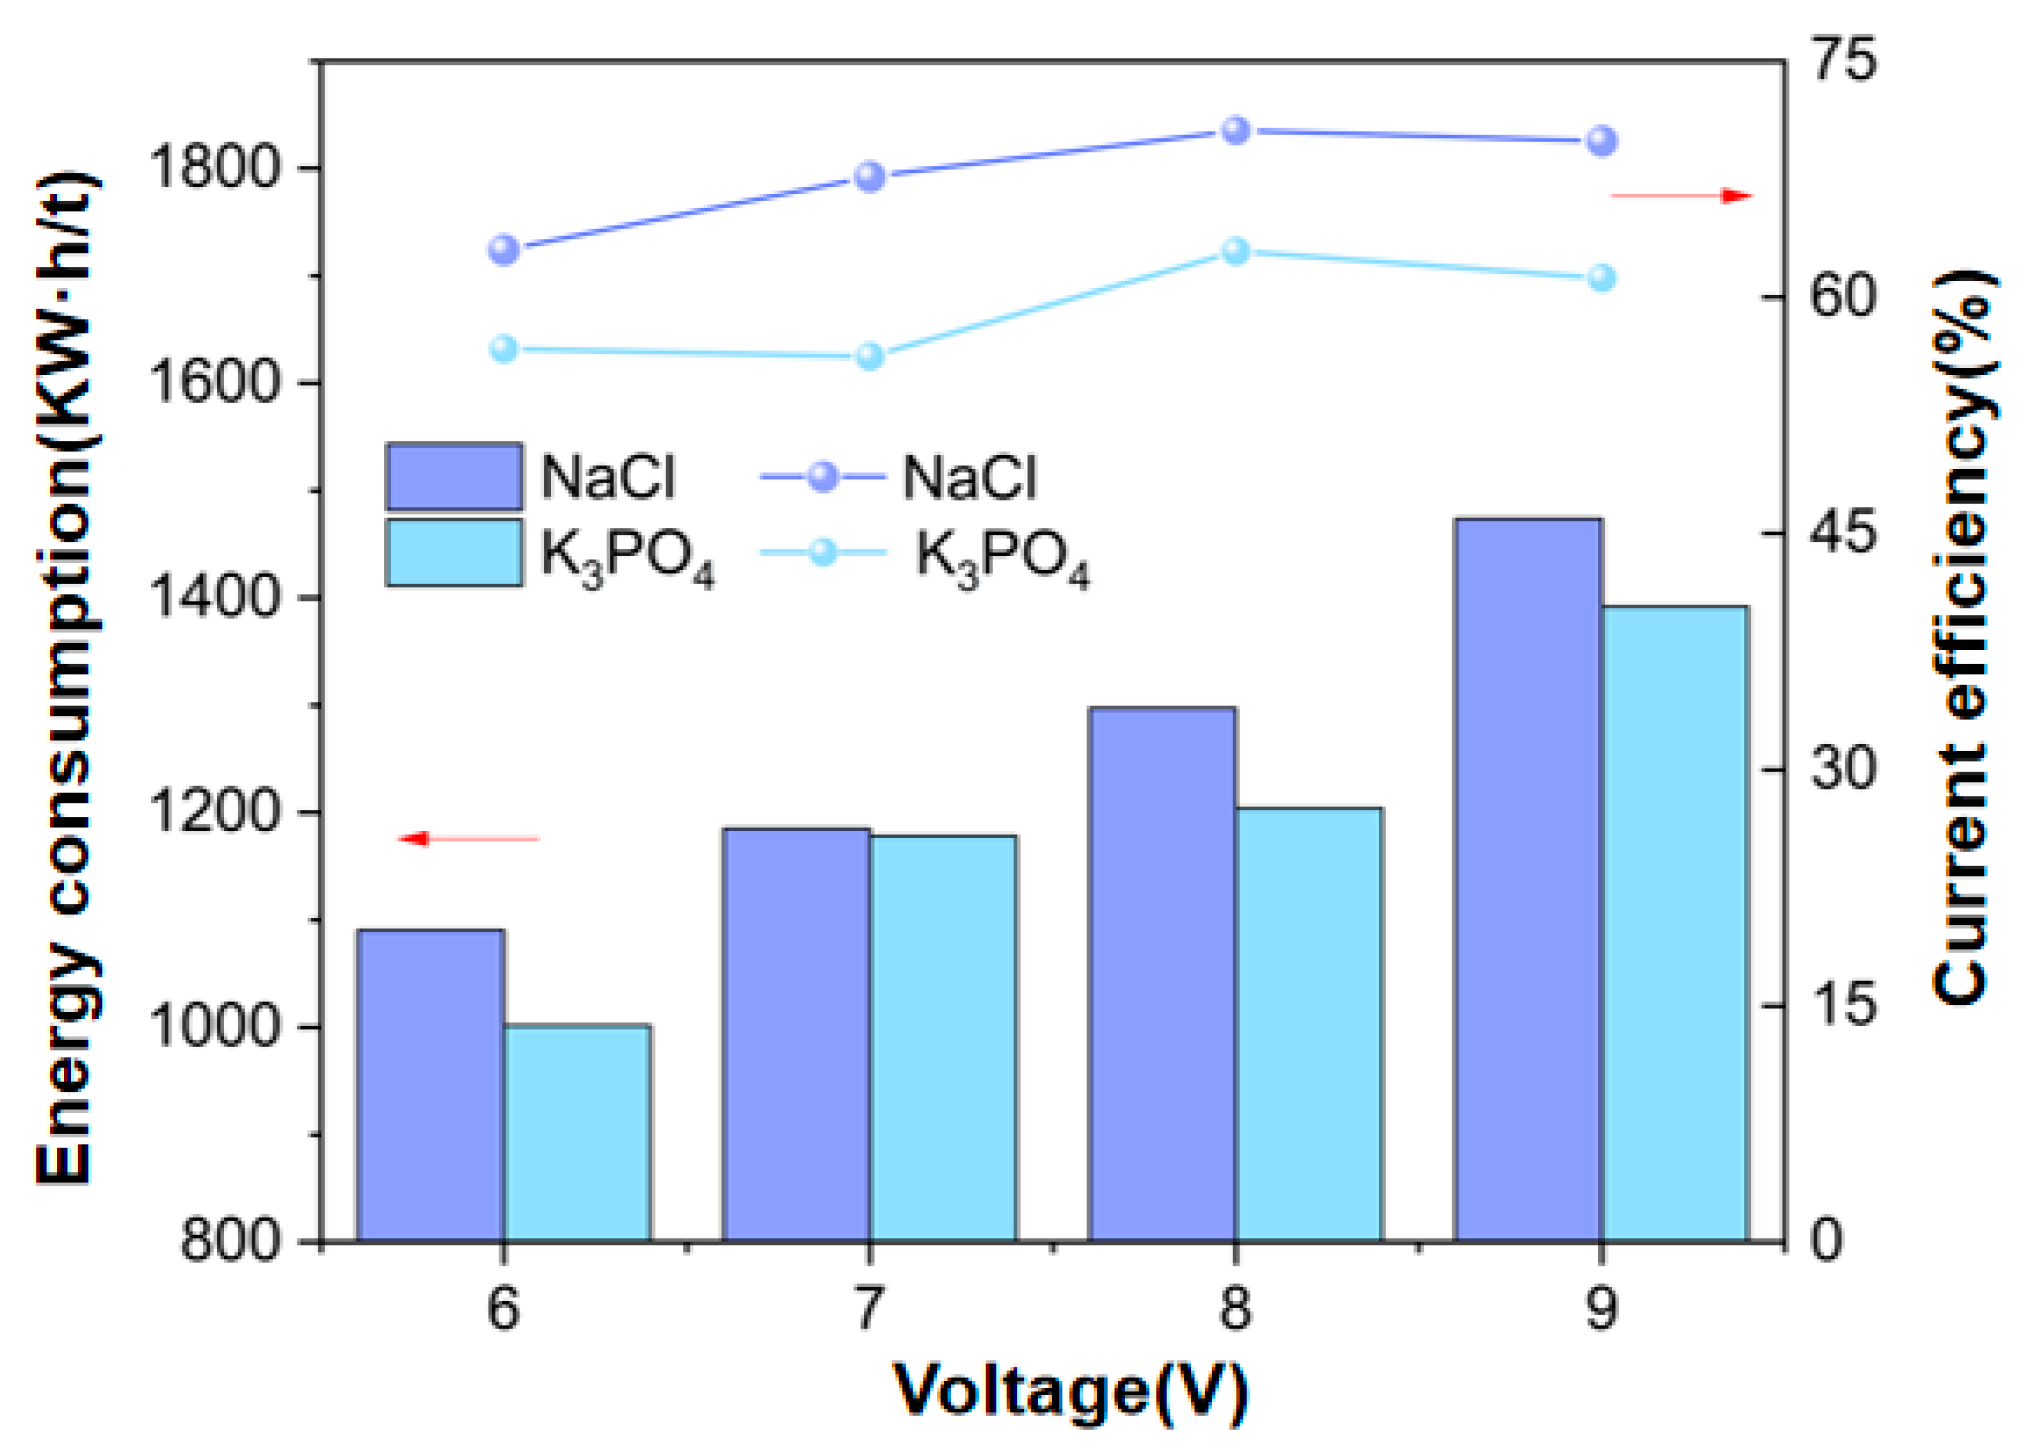
3.1.2. Ion Equilibrium Concentration and Energy Consumption

In Figure 3a, as the voltage increases, the ion concentration in the concentration chambers C1 and C2 increases significantly. That is because as the ion flux increases, more ions migrate to the concentration chamber, increasing ion concentration. In the same compartment (C1), CNa+ and CCl are slightly different. The selectivity of the ion exchange membrane is not 100%, resulting in phosphate ions and potassium ions mixing into the concentration chamber C1, thus affecting the purity of the product. CK+ and CPO43− in C2 are not completely consistent with 3:1 due to the mixing of CNa+ and CCl. Figure 3b shows the concentration of impurity ions in each chamber. It can be found that the concentration of K+ and Na+ cations is significantly greater than that of anions. This is because their ion radius is small, and crossing the ion exchange membrane is easier. Despite the presence of impurity ions, both NaCl and K3PO4 products maintained a high purity, 93% and 96%, respectively.
In Figure 4, the current efficiency of K3PO4 and NaCl increases slightly with the voltage increase. This is because when the voltage increases, the driving force for ion migration through the membrane increases, which increases the product concentration in the concentration chamber accordingly. Under 8 V conditions, the current efficiency of K3PO4 and NaCl solutions reached approximately 63% and 71%, respectively. Voltage is the main factor affecting energy consumption. As the applied voltage increases, energy consumption will also increase. The energy consumption of K3PO4 increases from 1001 kW·h/t to 1391 kW·h/t with the voltage increase. The energy consumption of NaCl increases from 1090 kW·h/t to 1473 kW·h/t with the increase in voltage, which is quite significant. In the study on the continuous operation of EDM to prepare chlorine-free potassium fertilizer [22], the energy consumption of K2SO4 and KH2PO4 was 890 kW·h/t and 1040 kW·h/t, respectively. In this study, the energy consumption of K3PO4 was above 1100 kW·h/t. This was due to the high resistance of the larger hydration radius ions (e.g., PO43−), which resulted in slow ion migration. This requires a higher voltage to drive ion migration, greatly increasing energy consumption.
By analyzing the changes in energy consumption under different voltage conditions and their influence on current efficiency, 8 V is determined to be the optimal operating voltage.

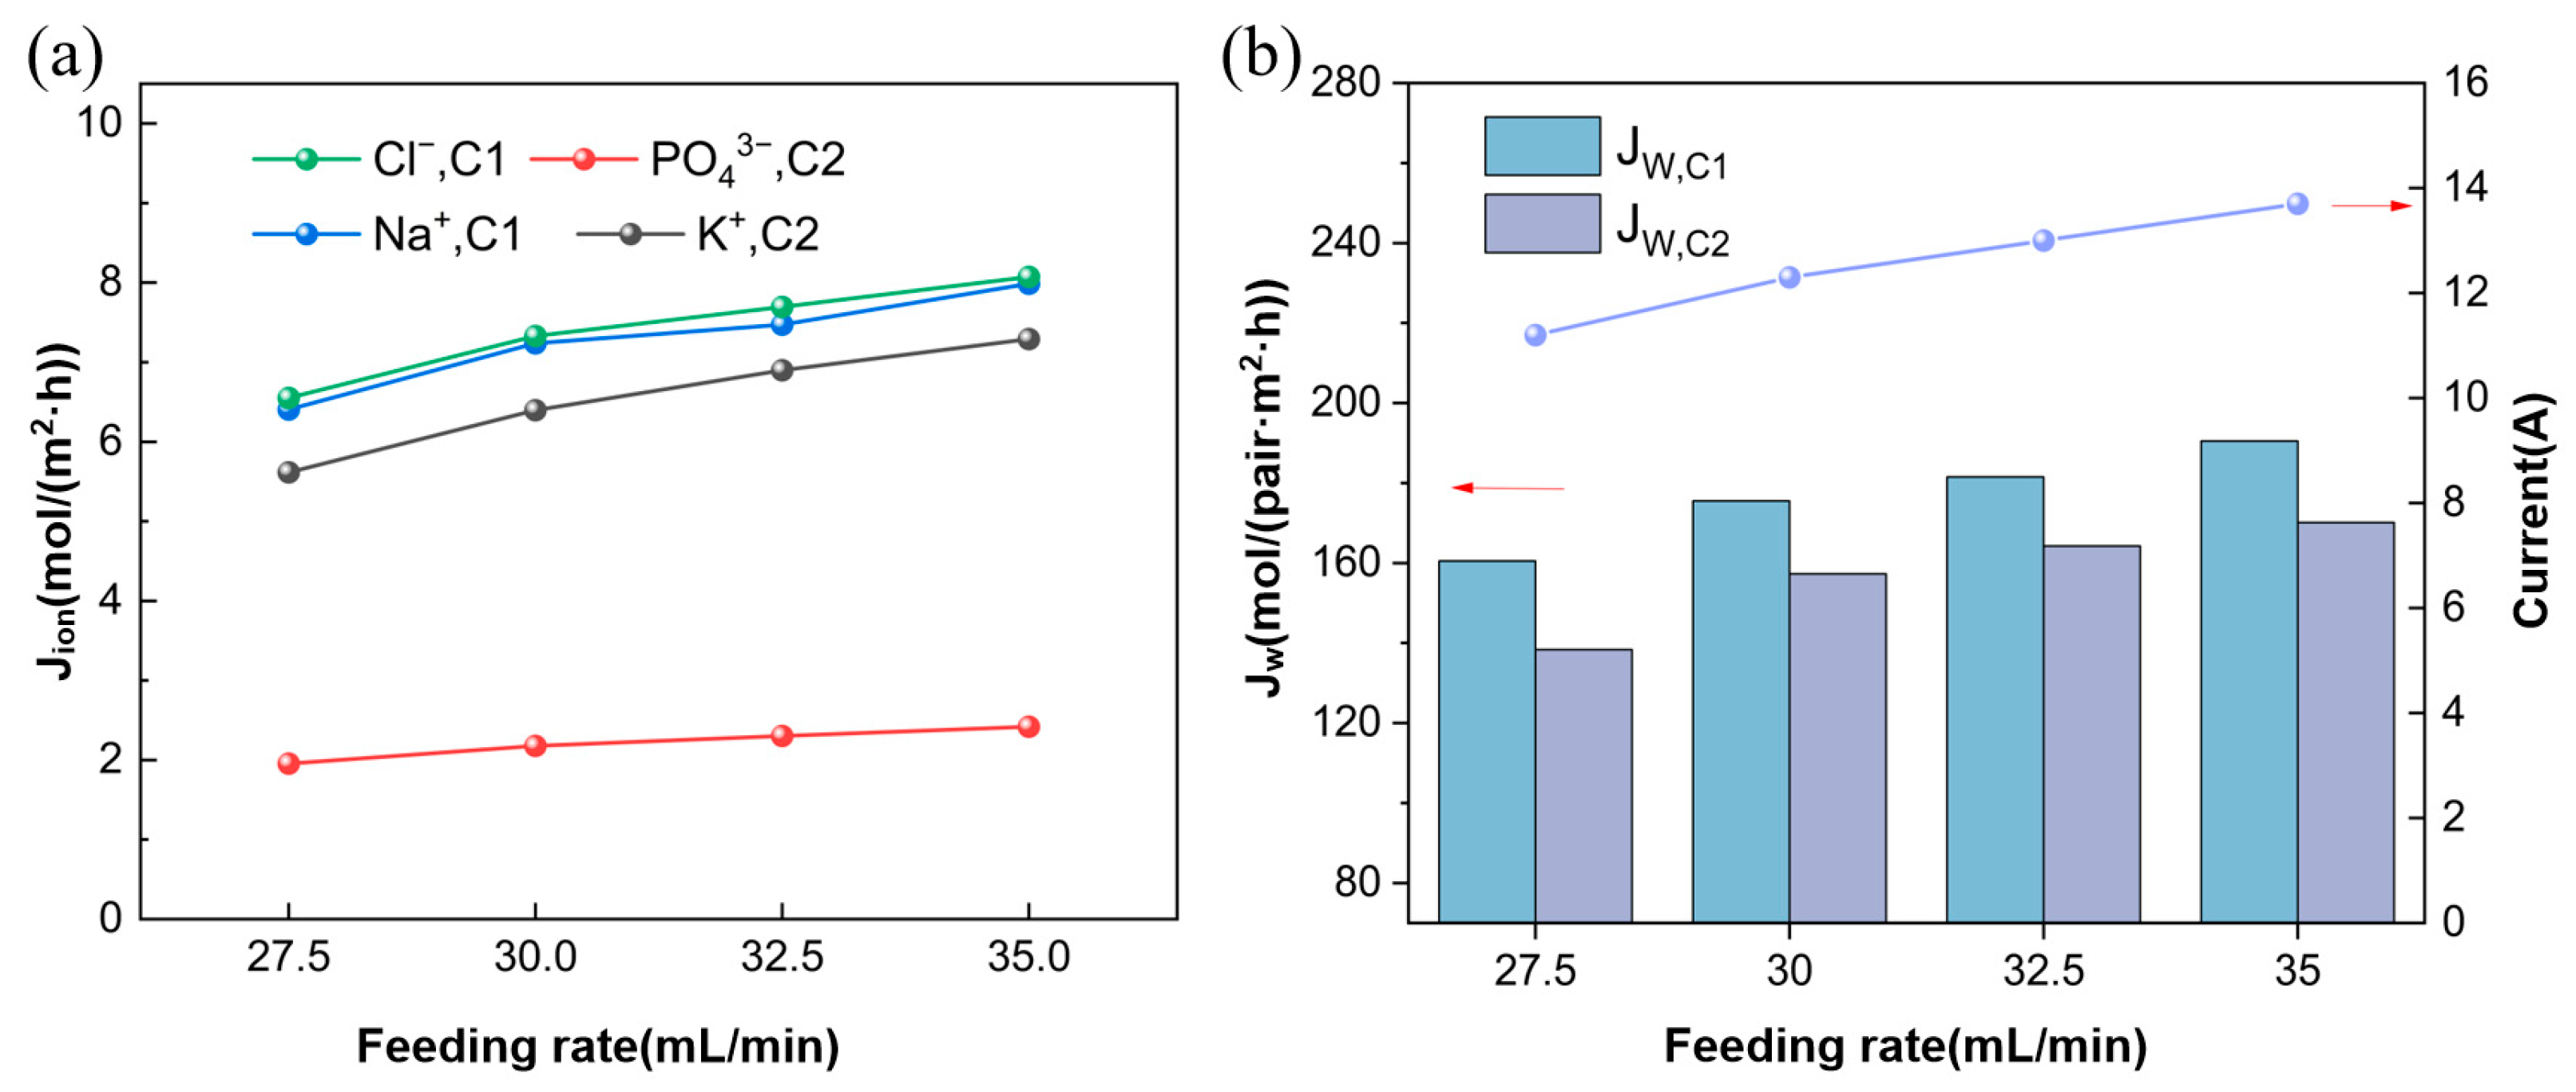
3.2. Effect of Feed Flow Rate

This section studied the effect of feed flow rates on the production of potassium phosphate. The feed flow rate ratio of D1 and D2 was fixed at 1:1, and the feed flow rates were set to 27.5 mL/min, 30 mL/min, 32.5 mL/min, and 35 mL/min. The voltage was 8 V, the Na3PO4 feed concentration was 0.3 mol/L, the KCl feed concentration was 0.9 mol/L, and the experimental temperature was 25 °C. The linear flow velocity is 2.67 cm/s.

3.2.1. Ion Flux and Apparent Water Flux

Figure 5a shows that as the feed flow rate increases, the ion flux in the concentration chamber also increases accordingly. In the continuous operation, the increase in feed flow rate leads to an increase in the number of ions entering the desalination tank (D1, D2) simultaneously, thereby increasing the concentration of the solution. The increase in solution concentration further increases the amount of ions available for migration, ultimately increasing ion flux. The current trend is also shown in Figure 5b. Under the conditions of feed flow rates of 27.5 mL/min, 30 mL/min, 32.5 mL/min, and 35 mL/min, the current densities were 25.3 mA/cm2, 27.8 mA/cm2, 29.4 mA/cm2, and 31.0 mA/cm2, respectively. As the ion flux increases, the water electroosmosis flux driven by ion migration also indicates a significant growth trend, leading to a gradual increase in water flux, as shown in Figure 5b.

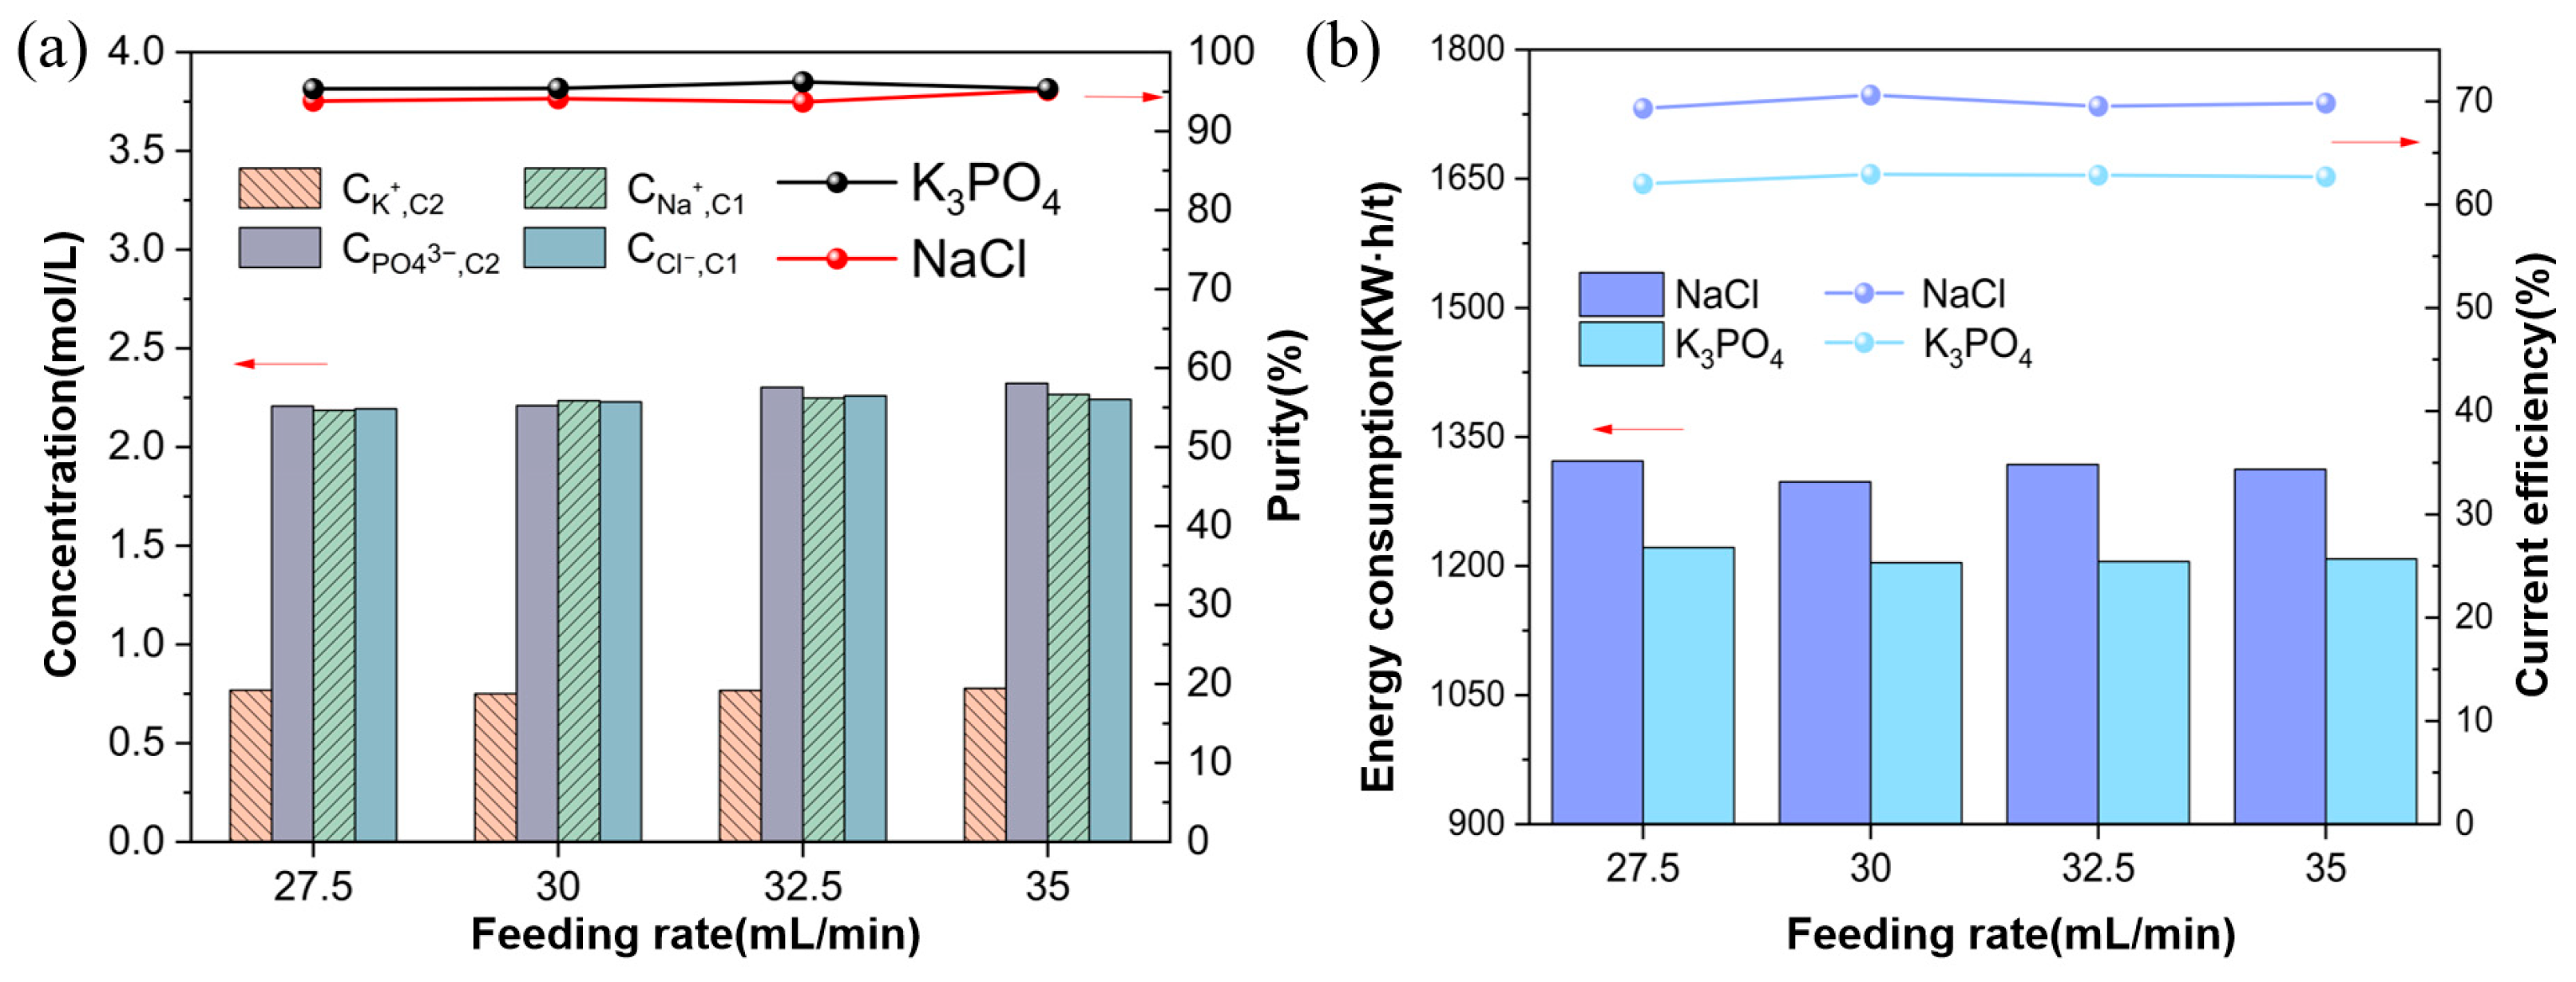
3.2.2. Ion Equilibrium Concentration and Energy Consumption

In Figure 6a, as the feed flow rate increases, the ion concentration in the concentration chambers C1 and C2 does not change significantly. This is because the change in ion concentration in the concentration chamber mainly depends on the membrane’s selective permeability and ion migration rate rather than the feed flow rate. Therefore, although the feed flow rate has increased, the ion migration and reaction rate within the system have stabilized, resulting in no significant change in ion concentration. The results show that the purity of K3PO4 is maintained at about 96%, while the purity of NaCl remains relatively stable at about 94%.
In Figure 6b, as the feed rate increases, the energy consumption and efficiency of K3PO4 and NaCl remain stable. This shows that changes in feed rate have little effect on process performance. Specifically, the current efficiency of K3PO4 remains at around 62%, while the current efficiency of NaCl stabilizes at around 70%. At the same time, the energy consumption of K3PO4 is about 1300 kW·h/t, and the energy consumption of NaCl is about 1200 kW·h/t. These values have almost no significant changes under different feed rate conditions.

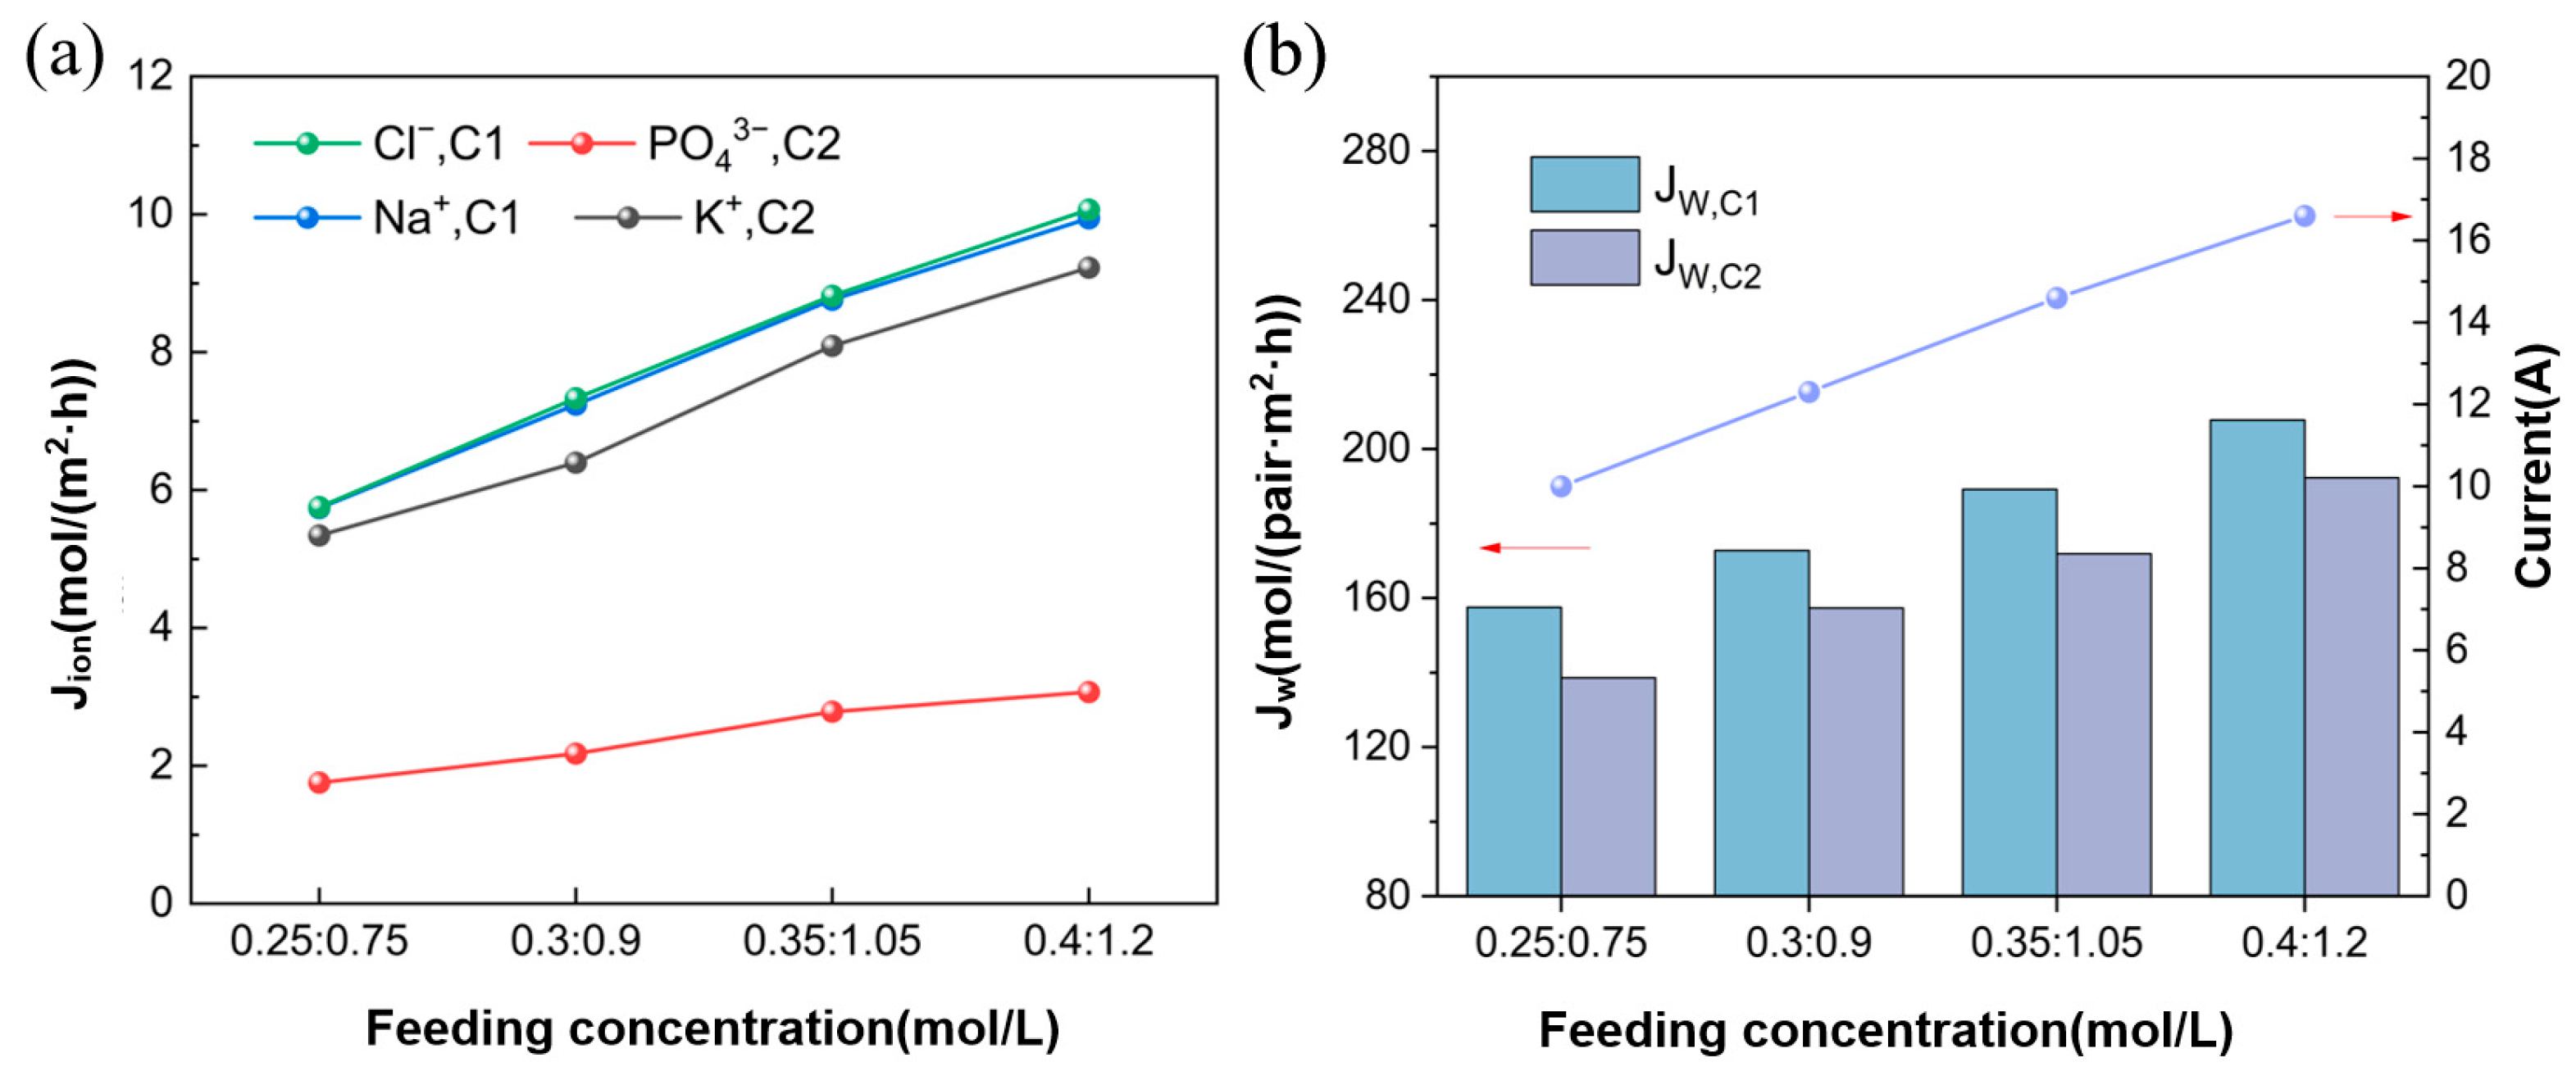
3.3. Effect of Concentration of the Feed Solution

This section investigates the impact of feed concentration on the production performance of K3PO4. The experiments were conducted using a constant voltage mode (8 V), maintaining a fixed ratio of 1:3 for the feed concentrations of Na3PO4 and KCl. The feed concentration of Na3PO4 were set at 0.25 mol/L, 0.3 mol/L, 0.35 mol/L, and 0.4 mol/L, respectively. Other parameters were kept constant during the experiments: feed flow rate of both Na3PO4 and KCl solutions at 30 mL/min and experimental temperature at 25 °C. The linear flow velocity is 2.67 cm/s.

3.3.1. Ion Flux and Apparent Water Flux

Figure 7a,b demonstrates the significant impact of feed concentration on ion flux and apparent water flux. As the feed concentration increases, both ion flux and apparent water flux exhibit a noticeable increase. Compared to the effects of increasing the feed flow rate, the impact of increasing feed concentration is more significant. This result suggests that as the feed concentration increases, the concentration difference between the desalination chamber and the concentration chamber decreases, leading to a reduced ion concentration gradient across the membrane facilitating ion migration. Under the conditions of the raw water concentration of Na3PO4 being 0.25 mol/L, 0.3 mol/L, 0.35 mol/L, and 0.4 mol/L, the current densities were 22.6 mA/cm2, 27.8 mA/cm2, 33.0 mA/cm2, and 37.6 mA/cm2, respectively.

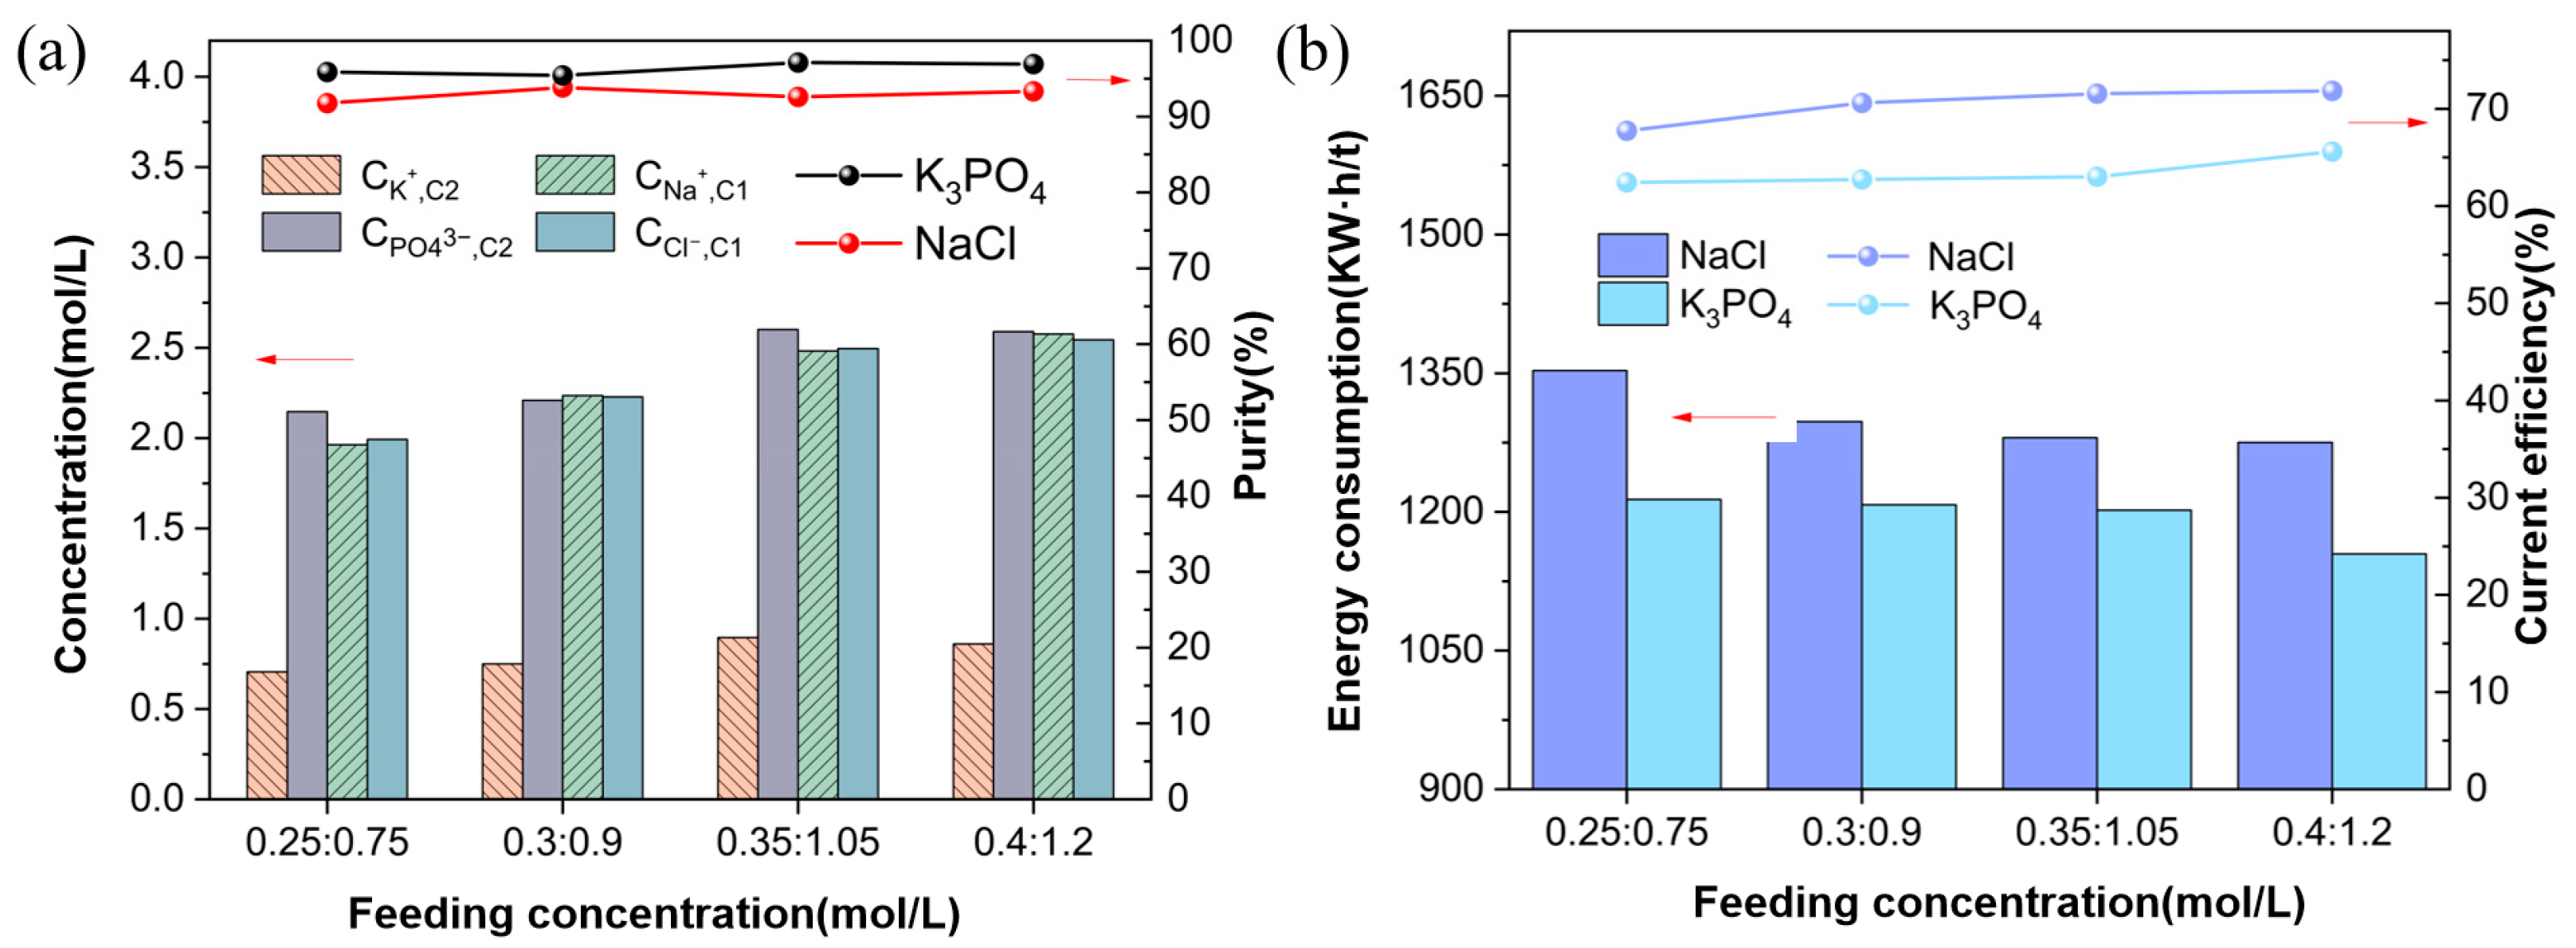
3.3.2. Ion Equilibrium Concentration and Energy Consumption

In Figure 8a, as the feed concentration increases, the ion concentrations in the concentration chambers C1 and C2 significantly increase. Increasing the feed concentration enhances the ion flux through the membranes, leading to higher equilibrium concentrations. Additionally, increasing the feed concentration boosts the flux, reducing competition from impurity ions and improving product purity. Under specific feed concentration conditions (Na3PO4:KCl = 0.35 mol/L:1.05 mol/L), the purity of K3PO4 reaches its maximum at approximately 97%, while the purity of sodium chloride (NaCl) is about 93%.
In Figure 8b, with the increase in feed concentration, the current efficiency of K3PO4 and NaCl shows an increase trend. That is because the increase in feed concentration reduces the concentration difference across the membrane, significantly increasing the overflow of C1 and C2 solutions and improving the overall efficiency. Specifically, the efficiency of K3PO4 increases from 62.4% to 65.6% with feed concentration, and the efficiency of NaCl increases from 67.7% to 71.8% with the increase in feed concentration. With the increase in feed concentration, the energy consumption of K3PO4 and NaCl does not change much. The energy consumption of K3PO4 decreases from 1213 kW·h/t to 1154 kW·h/t; the energy consumption of NaCl also decreases from 1352 kW·h/t to 1275 kW·h/t.
Under the condition of Na3PO4: KCl = 0.35 mol/L:1.05 mol/L in the feed concentration, the product purity is greater than 97%, meeting the national standard GB 25563-2010 [27]. In actual production, using a Mechanical Vapor Recompression (MVR) evaporator to evaporate the solution, the energy consumption for the evaporation of 1-ton water was reported to be about 20–40 kW·h/t [28]. Therefore, for this assessment, we have selected 40 kW·h/t.
We have conducted a comprehensive economic evaluation. Membrane and equipment cost estimates are shown in Table 2, and the total process cost of the process is 619 CNY/t K3PO4. As shown in Table 3, the production cost of K3PO4 prepared by EDM is about 8314 CNY/ton. The current market price of K3PO4 is about 13,500 CNY/ton [29]. That is, the production of K3PO4 by EDM has a significant economic benefit.

4. Conclusions

This study employed the electrodialysis metathesis (EDM) process to produce K3PO4. The effects of voltage, feed flow rate, and feed concentration on the production performance were investigated systematically.
The voltage is the key factor influencing process performance. Additionally, appropriately increasing the feed concentration can more effectively enhance ion migration and water transport efficiency, improving overall process performance and reducing energy consumption. Under the condition of Na3PO4: KCl = 0.35 mol/L:1.05 mol/L in the feed concentration, the purity of K3PO4 reached over 97%, with an energy consumption of 1191 kW·h/t and a cost of approximately 8314 CNY/ton. This study demonstrates the potential of EDM in the production of K3PO4. Future work could explore the membrane areas and additional repeating units to achieve industrial-scale production. Moreover, EDM shows unique advantages in treating phosphate-containing wastewater by effectively recovering valuable phosphorus resources while reducing environmental pollution, providing an innovative approach for the resource utilization of phosphate-containing wastewater.

Author Contributions

Conceptualization, S.X., Z.Z., L.X. and W.Z.; Methodology, S.X., Z.Z., L.X. and L.Z.; Investigation, Z.Z., L.X., L.Z. and W.Z.; Writing—original draft, Z.Z.; Writing—review and editing, S.X. and W.Z.; Visualization, L.Z. All authors have read and agreed to the published version of the manuscript.

Funding

The Central Guidance on Local Science and Technology Development Foundation of Hebei Province of China (226Z3101G), the Hebei Province Natural Science Foundation of China (B2022202061).

Institutional Review Board Statement

Not applicable.

Data Availability Statement

The original contributions presented in the study are included in the article; further inquiries can be directed to the corresponding authors.

Conflicts of Interest

The authors declare no conflicts of interest.

References

  1. Tan, D.-Z.; Zhang, Q.-Y.; Chen, T.-T.; Fan, W.-J.; Li, Y.-N. Preparing Potassium Dihydrogen Phosphate Using Waste Phosphoric Acid: A Green Chemistry Experiment. J. Chem. Educ. 2025, 102, 783–786. [Google Scholar] [CrossRef]
  2. Kirish, K.; Vlasov, P.; Dmitrevskii, B. Production of Potassium Phosphate by a Conversion Method. Fibre Chem. 2020, 52, 148–153. [Google Scholar] [CrossRef]
  3. Xu, S.; Zhao, H.; Xie, L.; Wang, K.; Zhang, W. Study on the Treatment of Refined Sugar Wastewater by Electrodialysis Coupled with Upflow Anaerobic Sludge Blanket and Membrane Bioreactor. Membranes 2023, 13, 527. [Google Scholar] [CrossRef] [PubMed]
  4. Trivedi, J.S.; Bhadja, V.; Makwana, B.S.; Jewrajka, S.K.; Chatterjee, U. Sustainable process for the preparation of potassium sulfate by electrodialysis and its concentration and purification by a nanofiltration process. RSC Adv. 2016, 6, 71807–71817. [Google Scholar] [CrossRef]
  5. Chen, T.; Bi, J.; Sun, M.; Liu, J.; Yuan, J.; Zhao, Y.; Ji, Z. Electrodialysis metathesis for high-value resource conversion and recovery: From sustainable applications to future prospects. Chem. Eng. J. 2023, 473. [Google Scholar] [CrossRef]
  6. Meng, H.; Li, H.; Li, C.; Li, L. Synthesis of ionic liquid using a four-compartment configuration electrodialyzer. J. Membr. Sci. 2008, 318, 1–4. [Google Scholar] [CrossRef]
  7. Rottiers, T.; Bruggen, B.V.d.; Pinoy, L. Synthesis and transport of impurities in electrodialysis metathesis: Production of choline dihydrogen phosphate. J. Membr. Sci. 2017, 541, 550–557. [Google Scholar] [CrossRef]
  8. Gao, W.; Zhao, H.; Wei, X.; Meng, X.; Wu, K.; Liu, Y. A Green and Economical Method for Preparing Potassium Glutamate through Electrodialysis Metathesis. Ind. Eng. Chem. Res. 2022, 61, 1486–1493. [Google Scholar] [CrossRef]
  9. Chen, Q.; Zhou, Y.; Ge, S.; Liang, G.; Afsar, N.U. Electrodialysis Metathesis (EDM) Desalination for the Effective Removal of Chloride and Nitrate from Tobacco Extract: The Effect of Membrane Type. Membranes 2023, 13, 214. [Google Scholar] [CrossRef]
  10. Wang, X.; Du, Y.; Liu, J.; Xu, F.; Ji, Z.; Guo, X.; Li, F.; Yuan, J. Modeling and simulation of continuous electrodialysis metathesis process for conversion of Na2SO4 to K2SO4. Desalination 2022, 528, 115605. [Google Scholar] [CrossRef]
  11. Wang, H.; Yan, J.; Song, W.; Jiang, C.; Wang, Y.; Xu, T. Ion exchange membrane related processes towards carbon capture, utilization and storage: Current trends and perspectives. Sep. Purif. Technol. 2022, 296, 121390. [Google Scholar] [CrossRef]
  12. Han, X.; Yan, X.; Wang, X.; Ran, J.; Wu, C.; Zhang, X. Preparation of chloride-free potash fertilizers by electrodialysis metathesis. Sep. Purif. Technol. 2018, 191, 144–152. [Google Scholar] [CrossRef]
  13. Jaroszek, H.; Dydo, P. Potassium nitrate synthesis by electrodialysis-metathesis: The effect of membrane type. J. Membr. Sci. 2018, 549, 28–37. [Google Scholar] [CrossRef]
  14. Chen, Q.B.; Li, P.F.; Wang, J.; Xu, Y.; Zhao, J. Reclamation of sulfate-laden wastewater via a hybrid selective nanofiltration and electrodialysis metathesis process. J. Environ. Chem. Eng. 2022, 10, 108712. [Google Scholar] [CrossRef]
  15. Zhao, Y.; Wang, X.; Yuan, J.; Ji, Z.; Liu, J.; Wang, S.; Guo, X.; Li, F.; Wang, J.; Bi, J. An efficient electrodialysis metathesis route to recover concentrated NaOH-NH4Cl products from simulated ammonia and saline wastewater in coal chemical industry. Sep. Purif. Technol. 2022, 301, 122042. [Google Scholar] [CrossRef]
  16. Gurreri, L.; Tamburini, A.; Cipollina, A.; Micale, G. Electrodialysis Applications in Wastewater Treatment for Environmental Protection and Resources Recovery: A Systematic Review on Progress and Perspectives. Membranes 2020, 10, 146. [Google Scholar] [CrossRef]
  17. Haerens, K.; De Vreese, P.; Matthijs, E.; Pinoy, L.; Binnemans, K.; Van der Bruggen, B. Production of ionic liquids by electrodialysis. Sep. Purif. Technol. 2012, 97, 90–95. [Google Scholar] [CrossRef]
  18. Chai, P.; Wang, J.; Lu, H. The cleaner production of monosodium L-glutamate by resin-filled electro-membrane reactor. J. Membr. Sci. 2015, 493, 549–556. [Google Scholar] [CrossRef]
  19. Feng, J.; Wang, Q.; Li, N.; Sun, Y.; Ma, Z.; Xu, D.; Gao, J.; Wang, J.; Wang, L.; Gao, X. Techno-economic evaluation of preparing high-valued TPAOH from its low-cost bromide via electrodialysis metathesis (EDM). Sep. Purif. Technol. 2020, 237, 116371. [Google Scholar] [CrossRef]
  20. Zhang, X.; Han, X.; Yan, X.; Chen, X.; Jin, Z.; Hu, X. Continuous synthesis of high purity KNO3 through electrodialysis metathesis. Sep. Purif. Technol. 2019, 222, 85–91. [Google Scholar] [CrossRef]
  21. Liu, J.; Li, D.; Xu, F.; Yuan, J.; Ji, Z.; Zhao, Y.; Li, F.; Guo, X.; Wang, S. The efficient conversion of K2SO4 from Na2SO4 by continuous electrodialysis metathesis process. Desalination Water Treat. 2021, 238, 267–276. [Google Scholar] [CrossRef]
  22. Sharma, P.P.; Yadav, V.; Rajput, A.; Kulshrestha, V. Synthesis of Chloride-Free Potash Fertilized by Ionic Metathesis Using Four-Compartment Electrodialysis Salt Engineering. ACS Omega 2018, 3, 6895–6902. [Google Scholar] [CrossRef] [PubMed]
  23. Wen, W.F.; Wang, J.; Zhong, C.Y.; Chen, Q.; Zhang, W.M. Direct production of lithium nitrate from the primary lithium salt by electrodialysis metathesis. J. Membr. Sci. 2022, 654, 120555. [Google Scholar] [CrossRef]
  24. Zhong, C.-Y.; Lv, Y.-P.; Wen, W.-F.; Chen, Q.; Zhang, W.-M. Sustainable Production of Lithium Acetate by Bipolar Membrane Electrodialysis Metathesis. ACS Sustain. Chem. Eng. 2022, 10, 6045–6056. [Google Scholar] [CrossRef]
  25. Liu, J.; Xu, F.; Yuan, J.; Ji, Z.; Zhao, Y.; Li, F.; Guo, X. High-value conversion of Na2SO4 wastewater by a continuous electrodialytic metathesis process: Effects of coexisting ions. J. Membr. Sci. 2020, 615, 118584. [Google Scholar] [CrossRef]
  26. Jin, Y.; Li, J.; Yang, B.; Zou, D.; Li, W. Solid-Liquid Equilibria in the Quaternary System K+//H2PO42−, SO42−, Cl-H2O at 298.2 K and 323.2 K. J. Chem. Eng. Data ACS J. Data 2016, 61, 330–335. [Google Scholar] [CrossRef]
  27. Available online: https://ndls.org.cn/standard/detail/c27e8ed457ab094ec6e941b8f2121a62 (accessed on 15 March 2025).
  28. Tiezheng, T.; Menachem, E. The Global Rise of Zero Liquid Discharge for Wastewater Management: Drivers, Technologies, and Future Directions. Environ. Sci. Technol. 2016, 50, 6846–6855. [Google Scholar]
  29. Available online: https://www.100ppi.com/mprice/plist-1-4876-1.html (accessed on 15 March 2025).
Figure 1. Schematic diagram of the EDM process.
Membranes 15 00136 g001
Figure 2. (a) Ion flux at different voltages; (b) Apparent water flux and current at different voltages (Experimental conditions: feed flow rate of Na3PO4 and KCl solutions at 30 mL/min, feed concentration of Na3PO4 at 0.3 mol/L, feed concentration of KCl at 0.9 mol/L, experimental temperature at 25 °C).
Membranes 15 00136 g002
Figure 3. (a) Ion concentration and purity under different voltages, (b) Impurity ion concentration under different voltages (Experimental conditions: feed flow rates of Na3PO4 and KCl solutions at 30 mL/min, feed concentration of Na3PO4 at 0.3 mol/L, feed concentration of KCl at 0.9 mol/L, temperature at 25 °C).
Membranes 15 00136 g003
Figure 4. Energy consumption and current efficiency at different voltages (Experimental conditions: feed flow rate of Na3PO4 and KCl solutions at 30 mL/min, feed concentration of Na3PO4 at 0.3 mol/L, feed concentration of KCl at 0.9 mol/L, experimental temperature at 25 °C).
Membranes 15 00136 g004
Figure 5. (a) Ion flux at different feed flow rates; (b) Apparent water flux and current at different feed flow rates (Experimental conditions: voltage of 8 V, feed concentration of Na3PO4 at 0.3 mol/L, feed concentration of KCl at 0.9 mol/L, experimental temperature at 25 °C).
Membranes 15 00136 g005
Figure 6. (a) Ion concentrations and purities at different feed flow rates; (b) Energy consumption and current efficiency at different feed flow rates (Experimental conditions: voltage of 8 V, feed concentration of Na3PO4 at 0.3 mol/L, feed concentration of KCl at 0.9 mol/L, experimental temperature at 25 °C).
Membranes 15 00136 g006
Figure 7. (a) Ion flux at different feed concentrations; (b) Apparent water flux and current at different feed concentrations (Experimental conditions: voltage of 8 V, feed flow rate of Na3PO4 and KCl solutions at 30 mL/min, experimental temperature at 25 °C).
Membranes 15 00136 g007
Figure 8. (a) Ion concentrations and purities at different feed concentrations; (b) Energy consumption and current efficiency at different feed concentrations (Experimental conditions: voltage 8 V, feed flow rate of Na3PO4 and KCl solutions at 30 mL/min, experimental temperature at 25 °C).
Membranes 15 00136 g008
Table 1. The main parameters used are AEM and CEM.
Membrane TypeMembrane Size/mm2Thickness/mmResistance
/Ω·cm2
Burst Strength
/MPa
Recommended Operating Temperature/°C
CEM (YRJCM-I)400 × 2000.264.0≥0.2515–40
AEM (YRJAM-I)400 × 2000.173.5≥0.2515–40
Table 2. Estimation of continuous EDM process cost.
ItemsK3PO4Remarks
Membrane area, m20.08
Repeating units4
Process capacity, kg K3PO4/year737Annual operation
Days = 300
Membrane life and amortization of the peripheral equipment, years5
Cation exchange membrane price, CNY/m2500
Anion exchange membrane price, CNY/m21000
Membrane cost, CNY480
Stack cost, CNY7201.5 times membrane
cost
Peripheral equipment cost, CNY10801.5 times stack cost
Total investment cost, CNY2280
Amortization, CNY/year456
Total process cost, CNY/t K3PO4619
Table 3. Costs required for producing 1 ton of K3PO4.
TypeNameConsumptionSpecific Value (CNY/ton)Value (CNY)
Material consumptionKCl1.054 ton32003162
Na3PO40.773 ton32002474
Electric consumptionEDM(K3PO4)1191 kW·h/t0.7834
EDM(NaCl)1285 kW·h/t0.7896
MVR(K3PO4)184 kW·h0.7129
MVR(NaCl)236 kW·h0.7165
Equipment consumptionEDM process cost1 ton619619
Total 8314
Disclaimer/Publisher’s Note: The statements, opinions and data contained in all publications are solely those of the individual author(s) and contributor(s) and not of MDPI and/or the editor(s). MDPI and/or the editor(s) disclaim responsibility for any injury to people or property resulting from any ideas, methods, instructions or products referred to in the content.

