
Simulation of Carbon Dioxide Absorption in a Hollow Fiber Membrane Contactor Under Non-Isothermal Conditions

Abstract
1. Introduction
2. Methodology
2.1. Model Development
2.2. Governing Equations and Boundary Conditions
2.2.1. Shell Side Equations
2.2.2. Membrane Side Equations
2.2.3. Tube Side Equations
2.2.4. Boundary Conditions
2.3. Reaction Mechanism
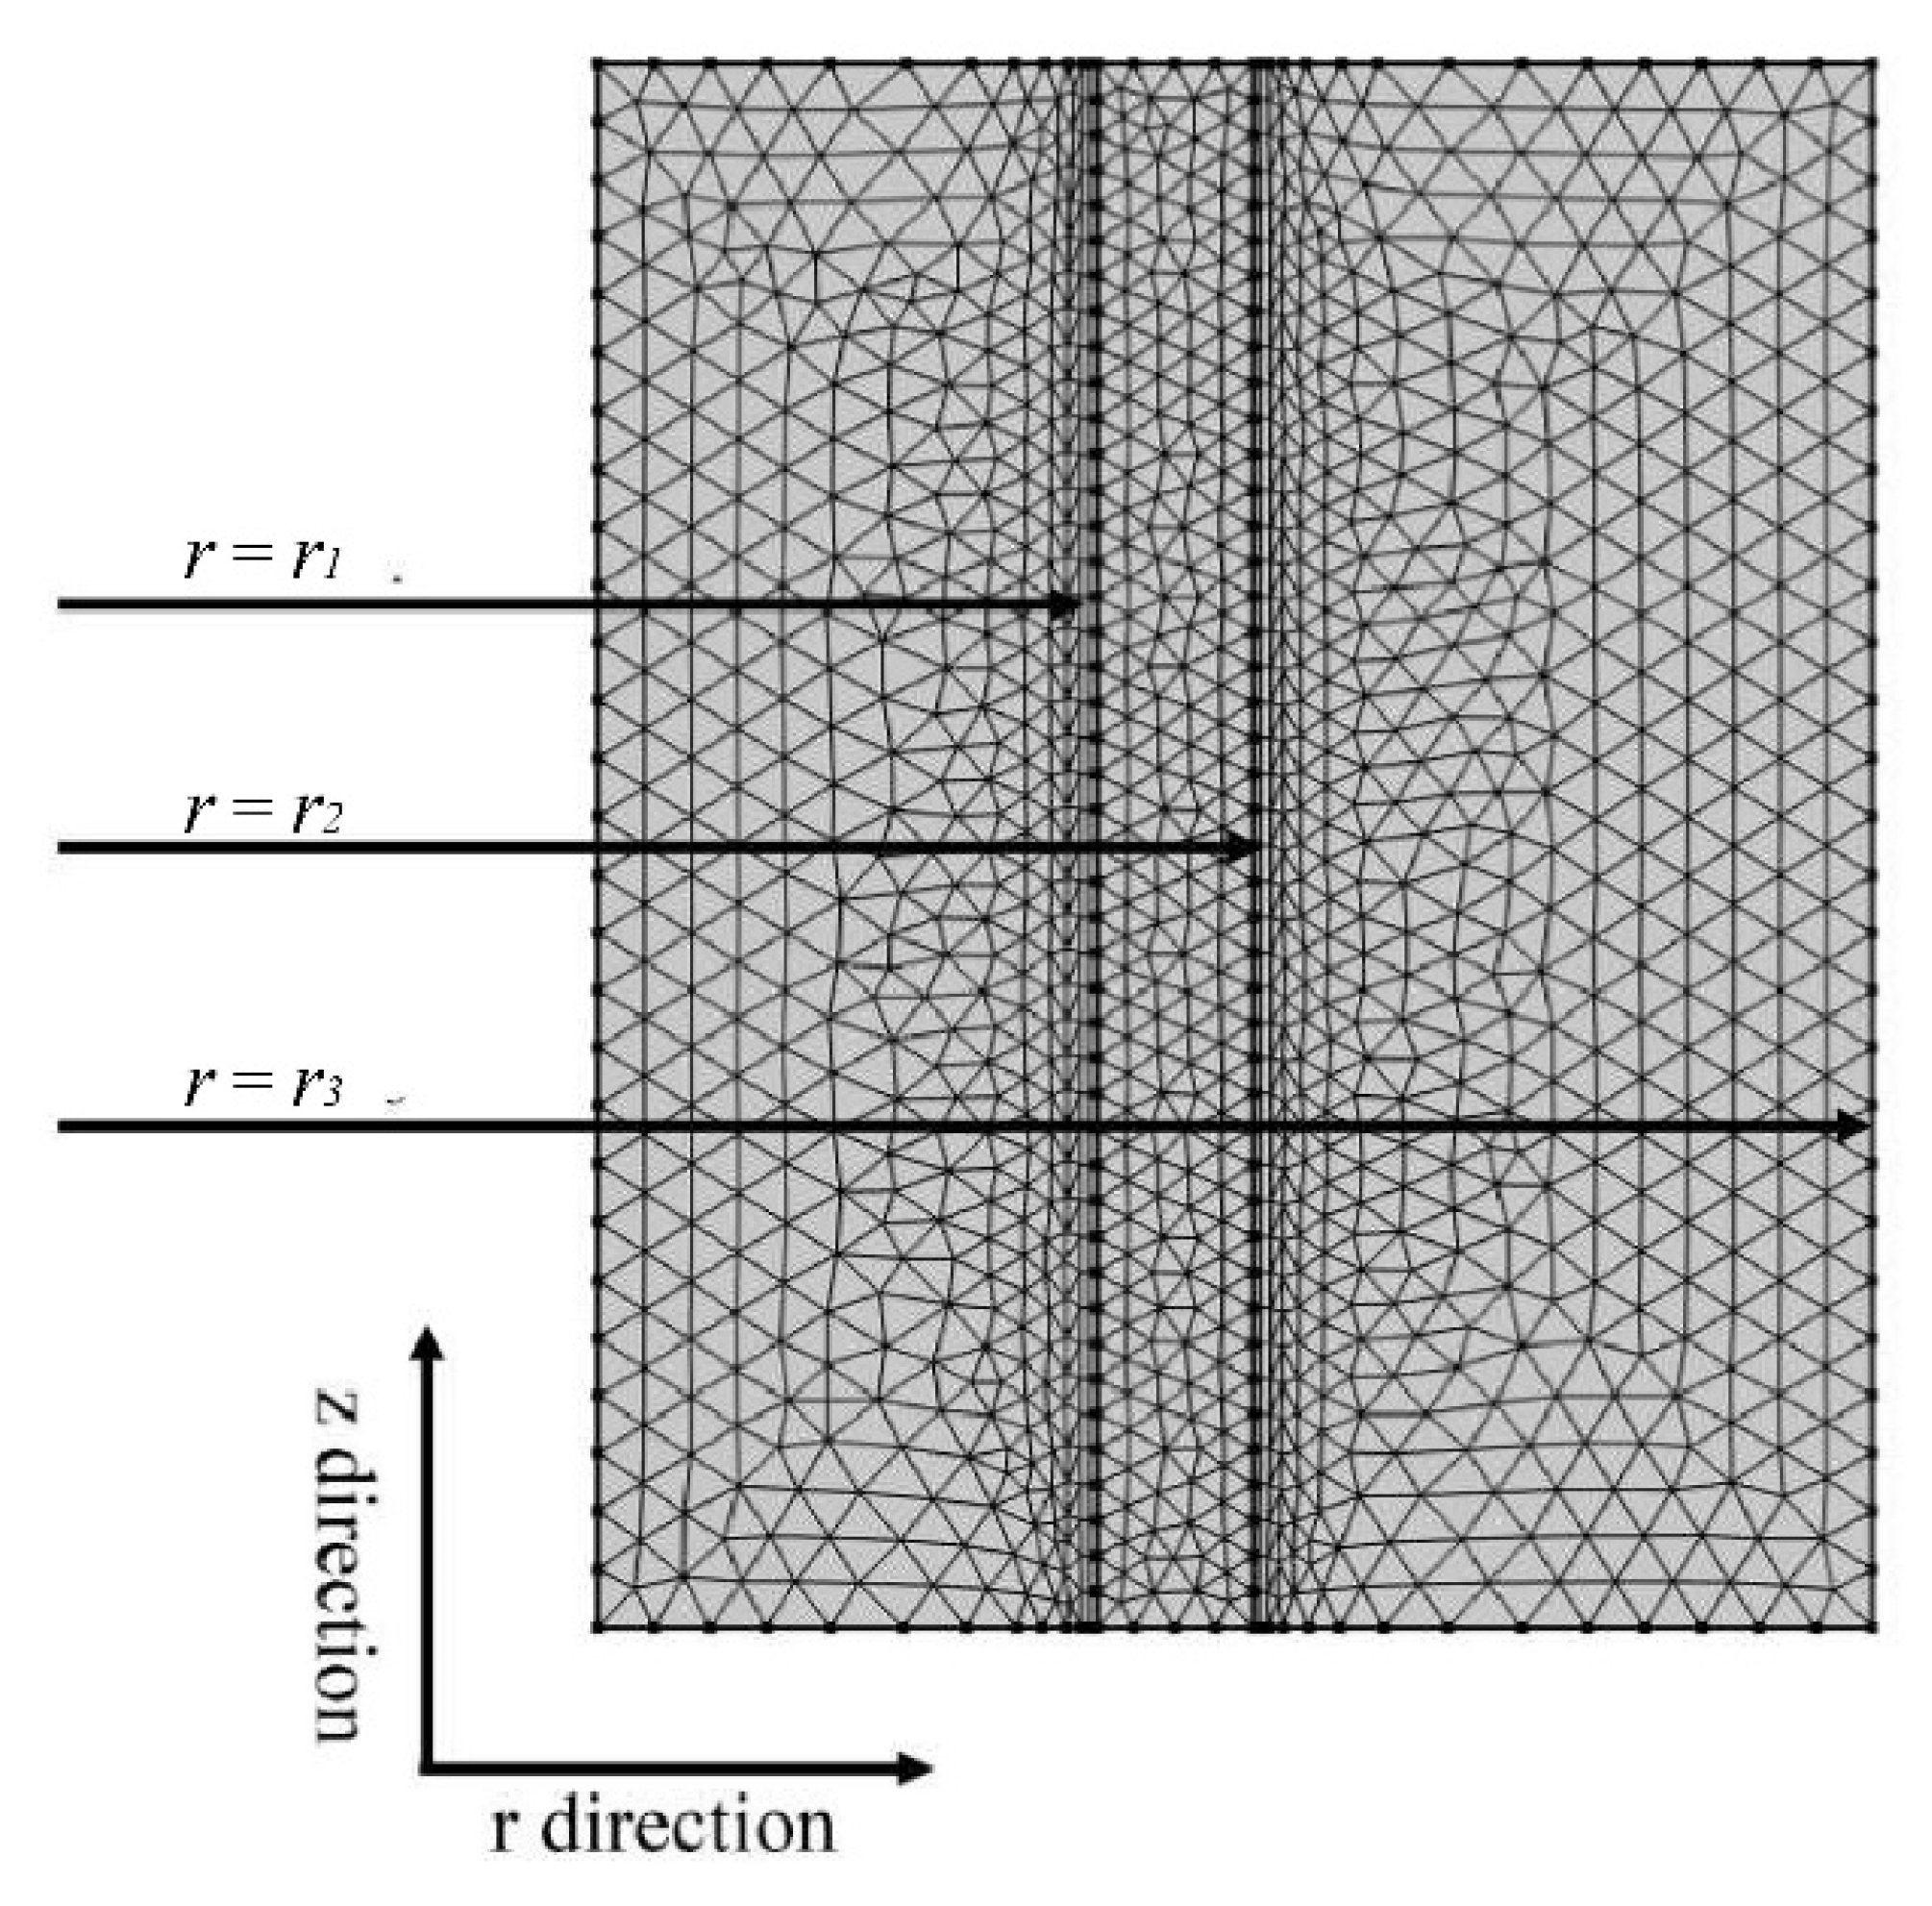
2.4. Verification of Grid Independence
2.5. Numerical Model Validation
3. Results and Discussion
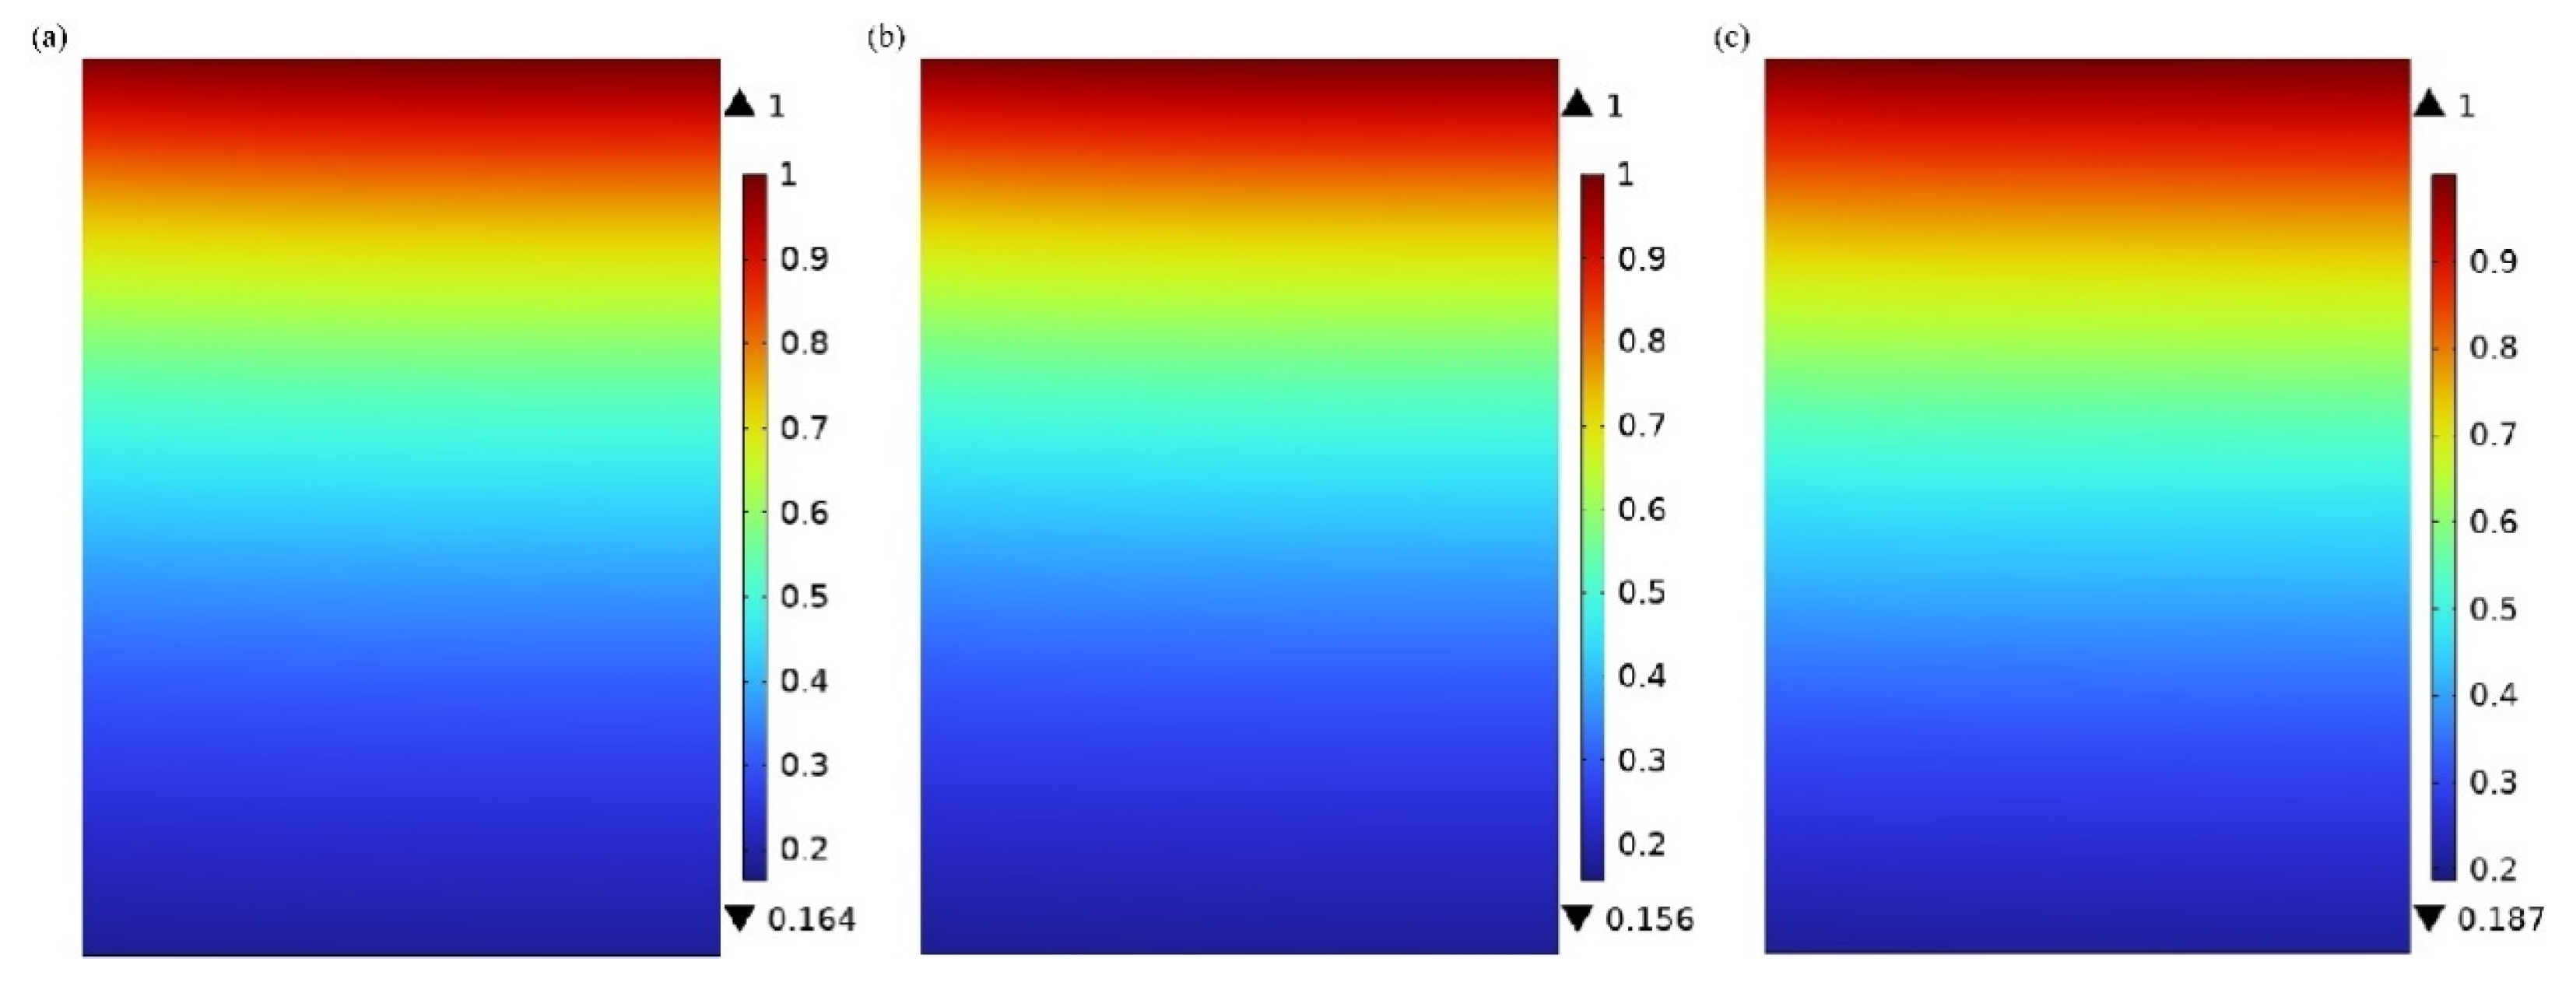
3.1. CO2 Concentration Distribution in the Shell Side
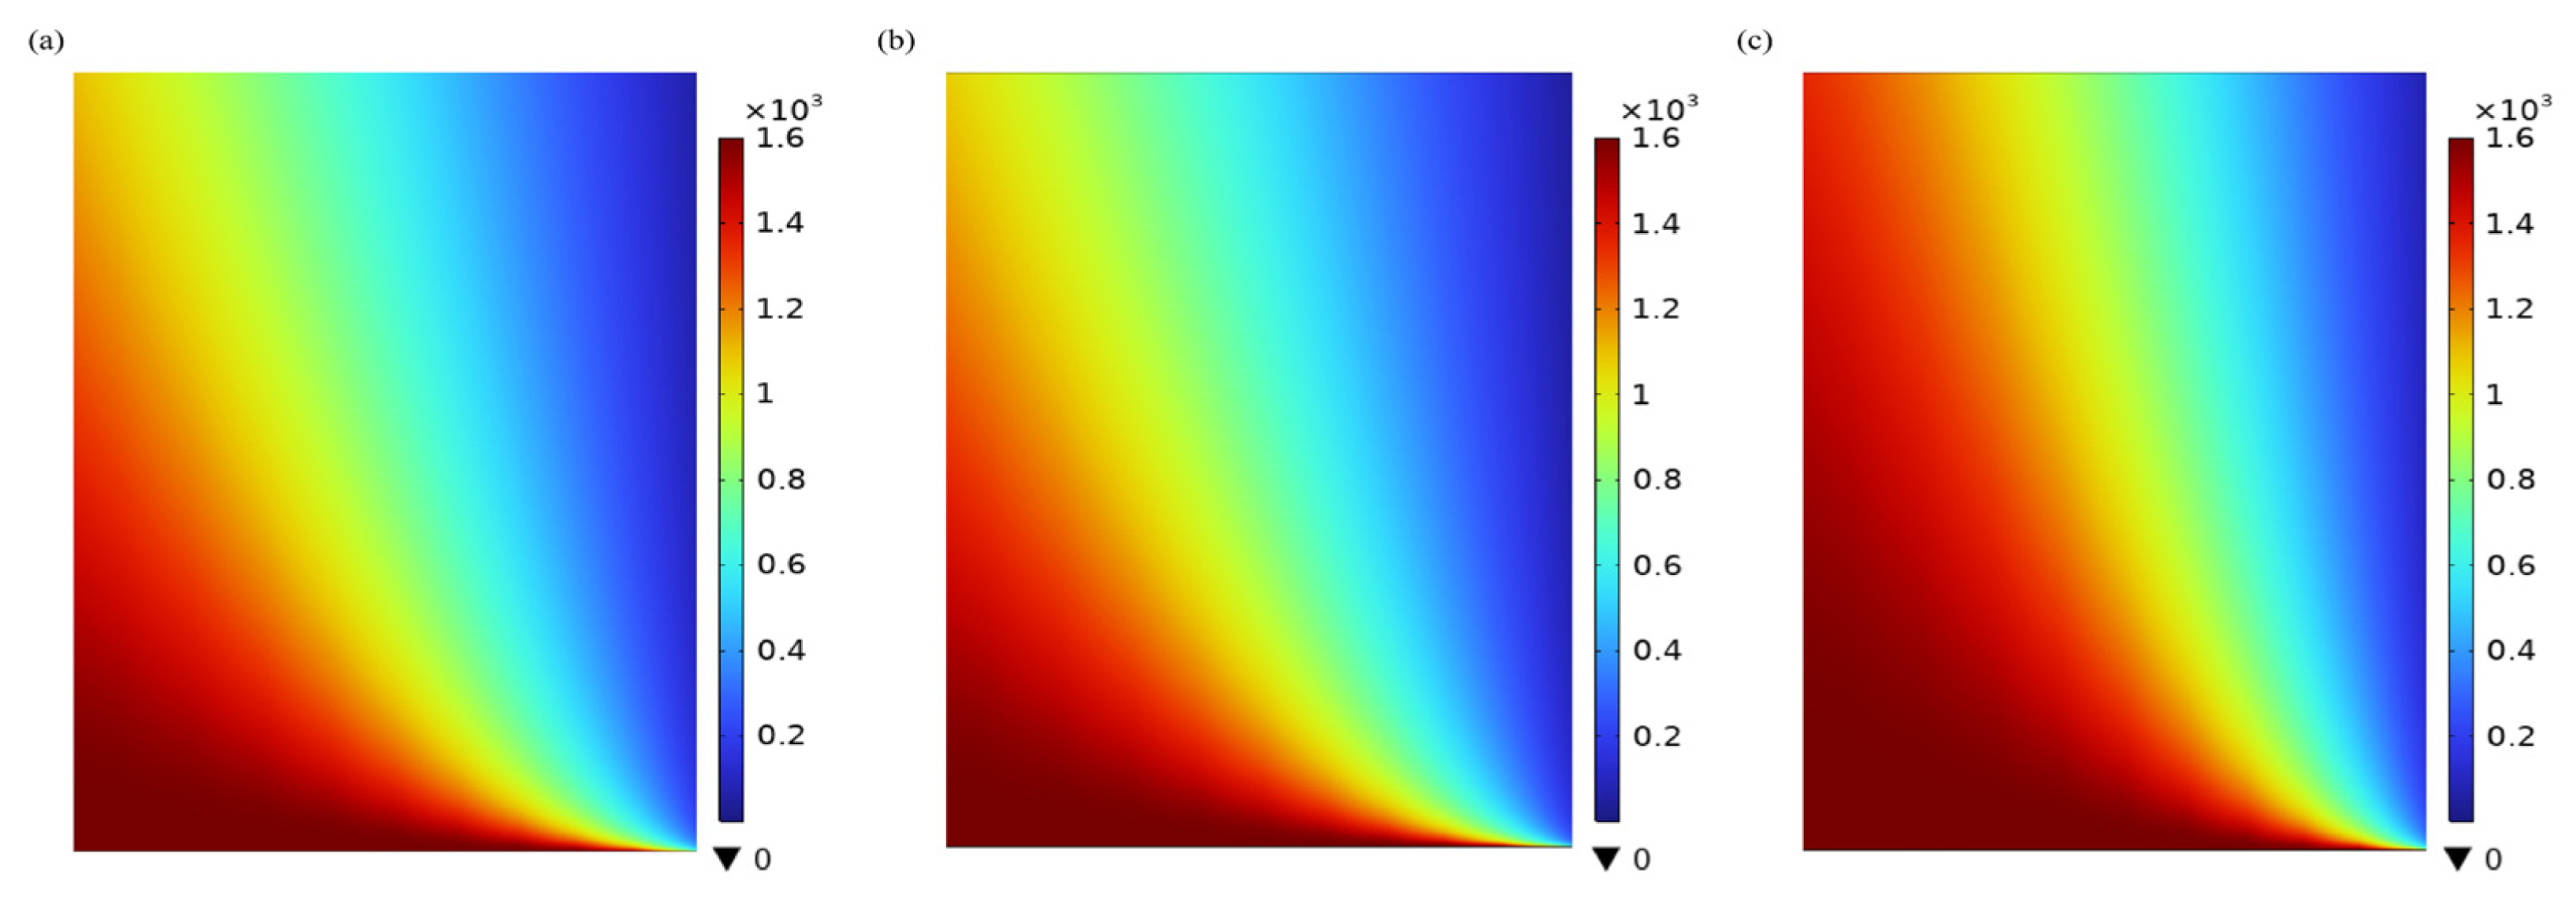
3.2. Absorbent Concentration Distribution in the Tube Side
3.3. Influence of Reaction Heat on CO2 Removal Efficiency
3.4. Effect of Gas Flow Rate and CO2 Inlet Concentration on CO2 Removal
3.5. Effect of Liquid Flow Rate on CO2 Removal
3.6. Effect of Absorbent Concentration on CO2 Removal
3.7. Effect of Membrane Porosity on CO2 Removal
4. Conclusions
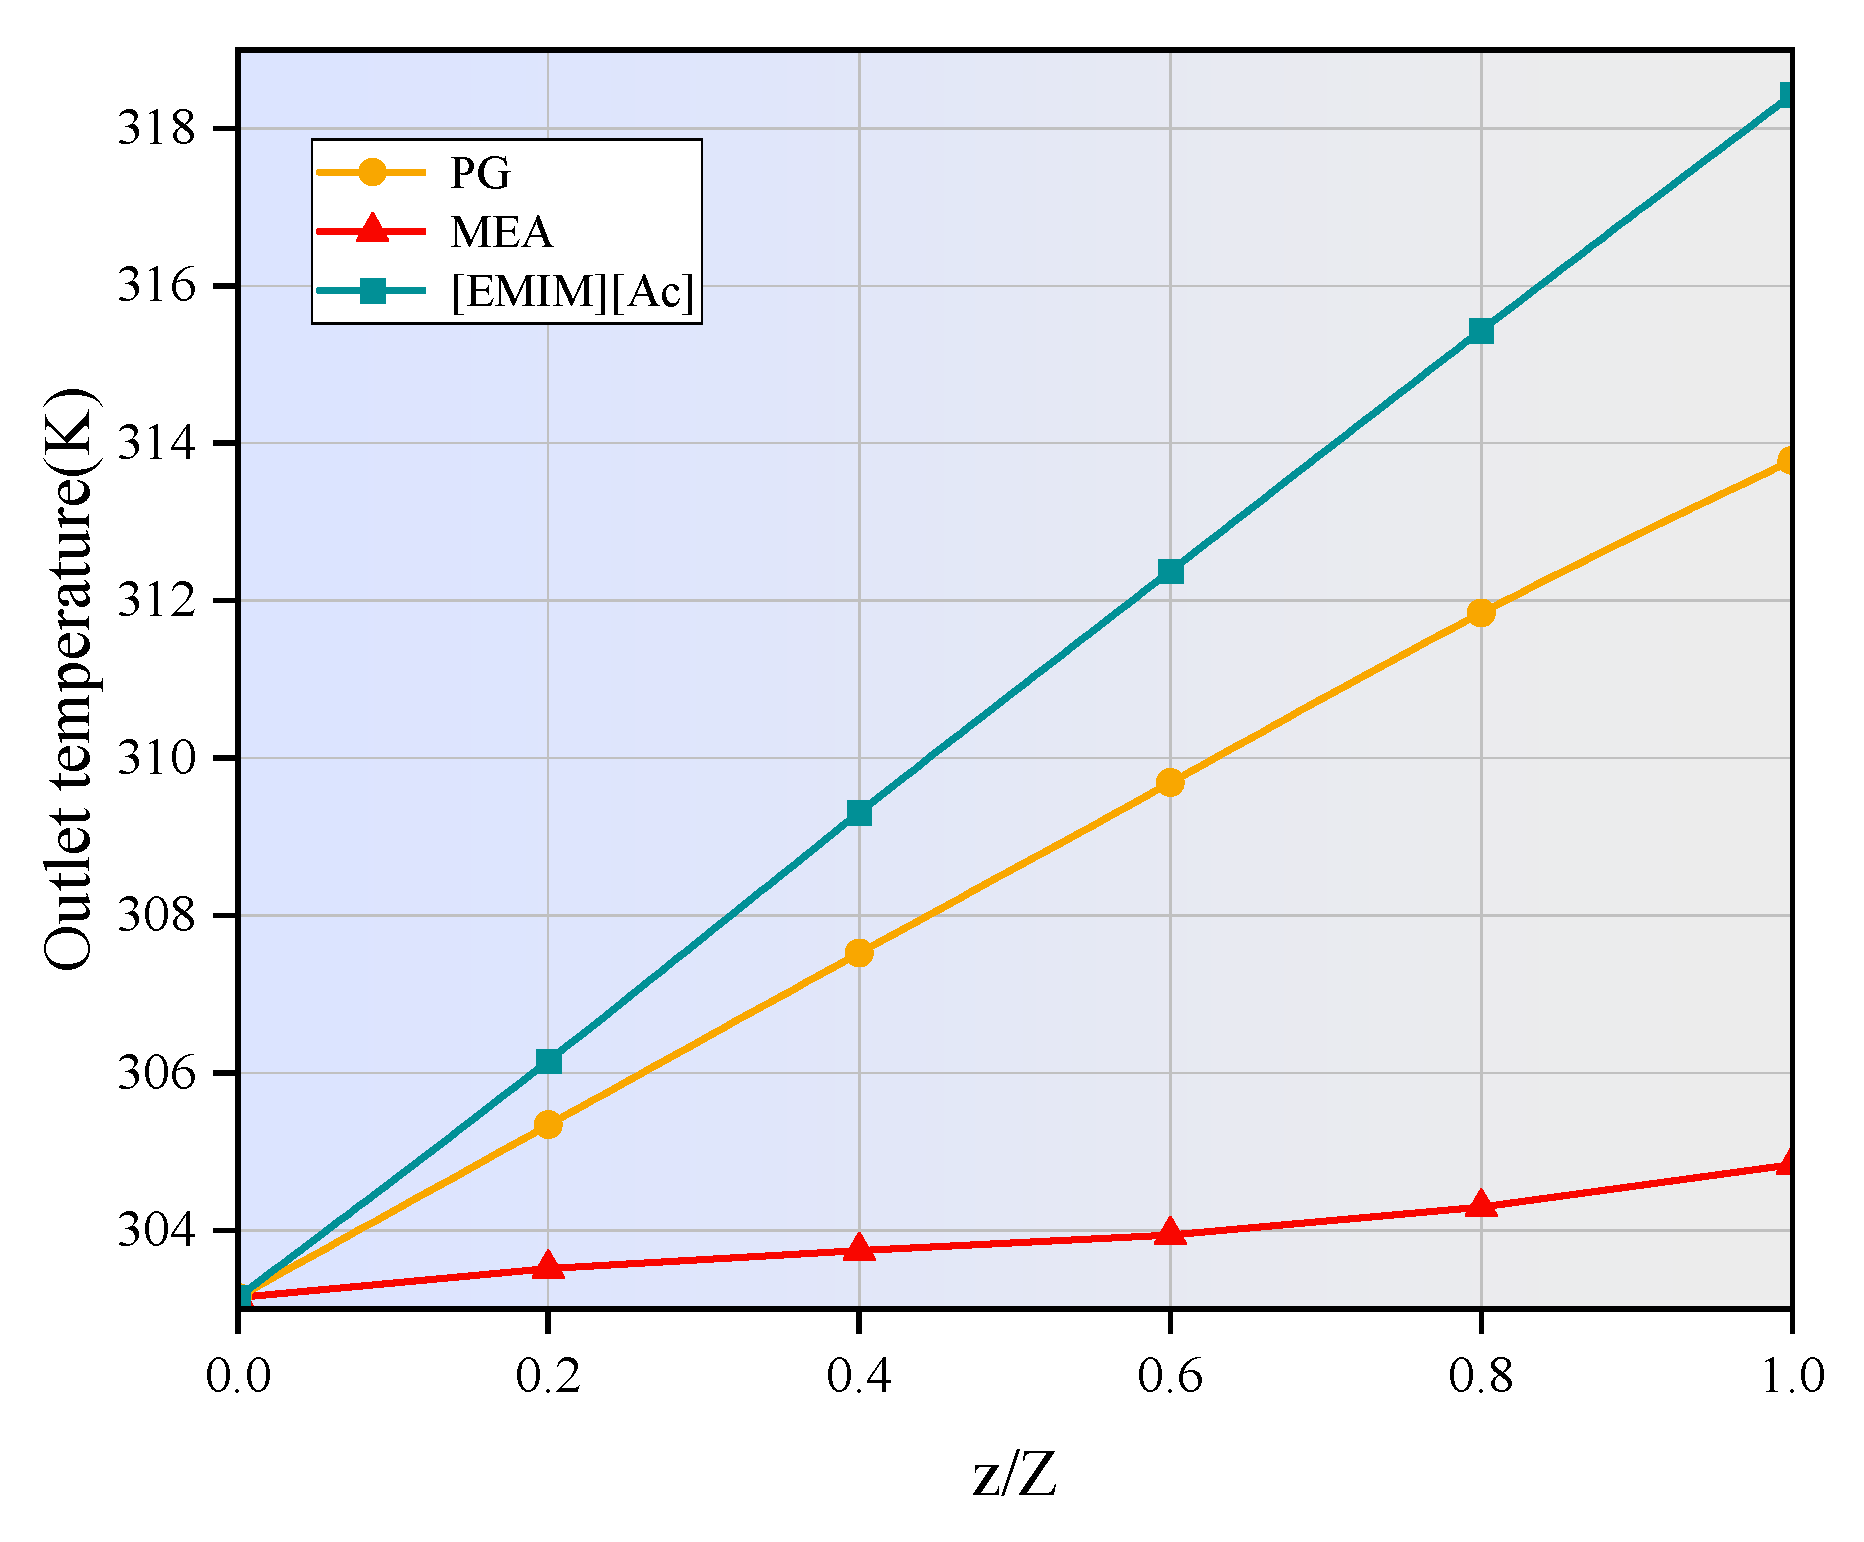
- (1)
- The temperatures along the membrane contactor length for three studied absorbents all show an upward trend, with an increase of 2 to 15 K. This temperature increase intensifies the molecular motion in the absorbent, leading to a higher frequency of molecular collisions. Consequently, the mass transfer of CO2 is enhanced, allowing it to dissolve more rapidly into the absorption liquid and thereby increasing the CO2 absorption rate.
- (2)
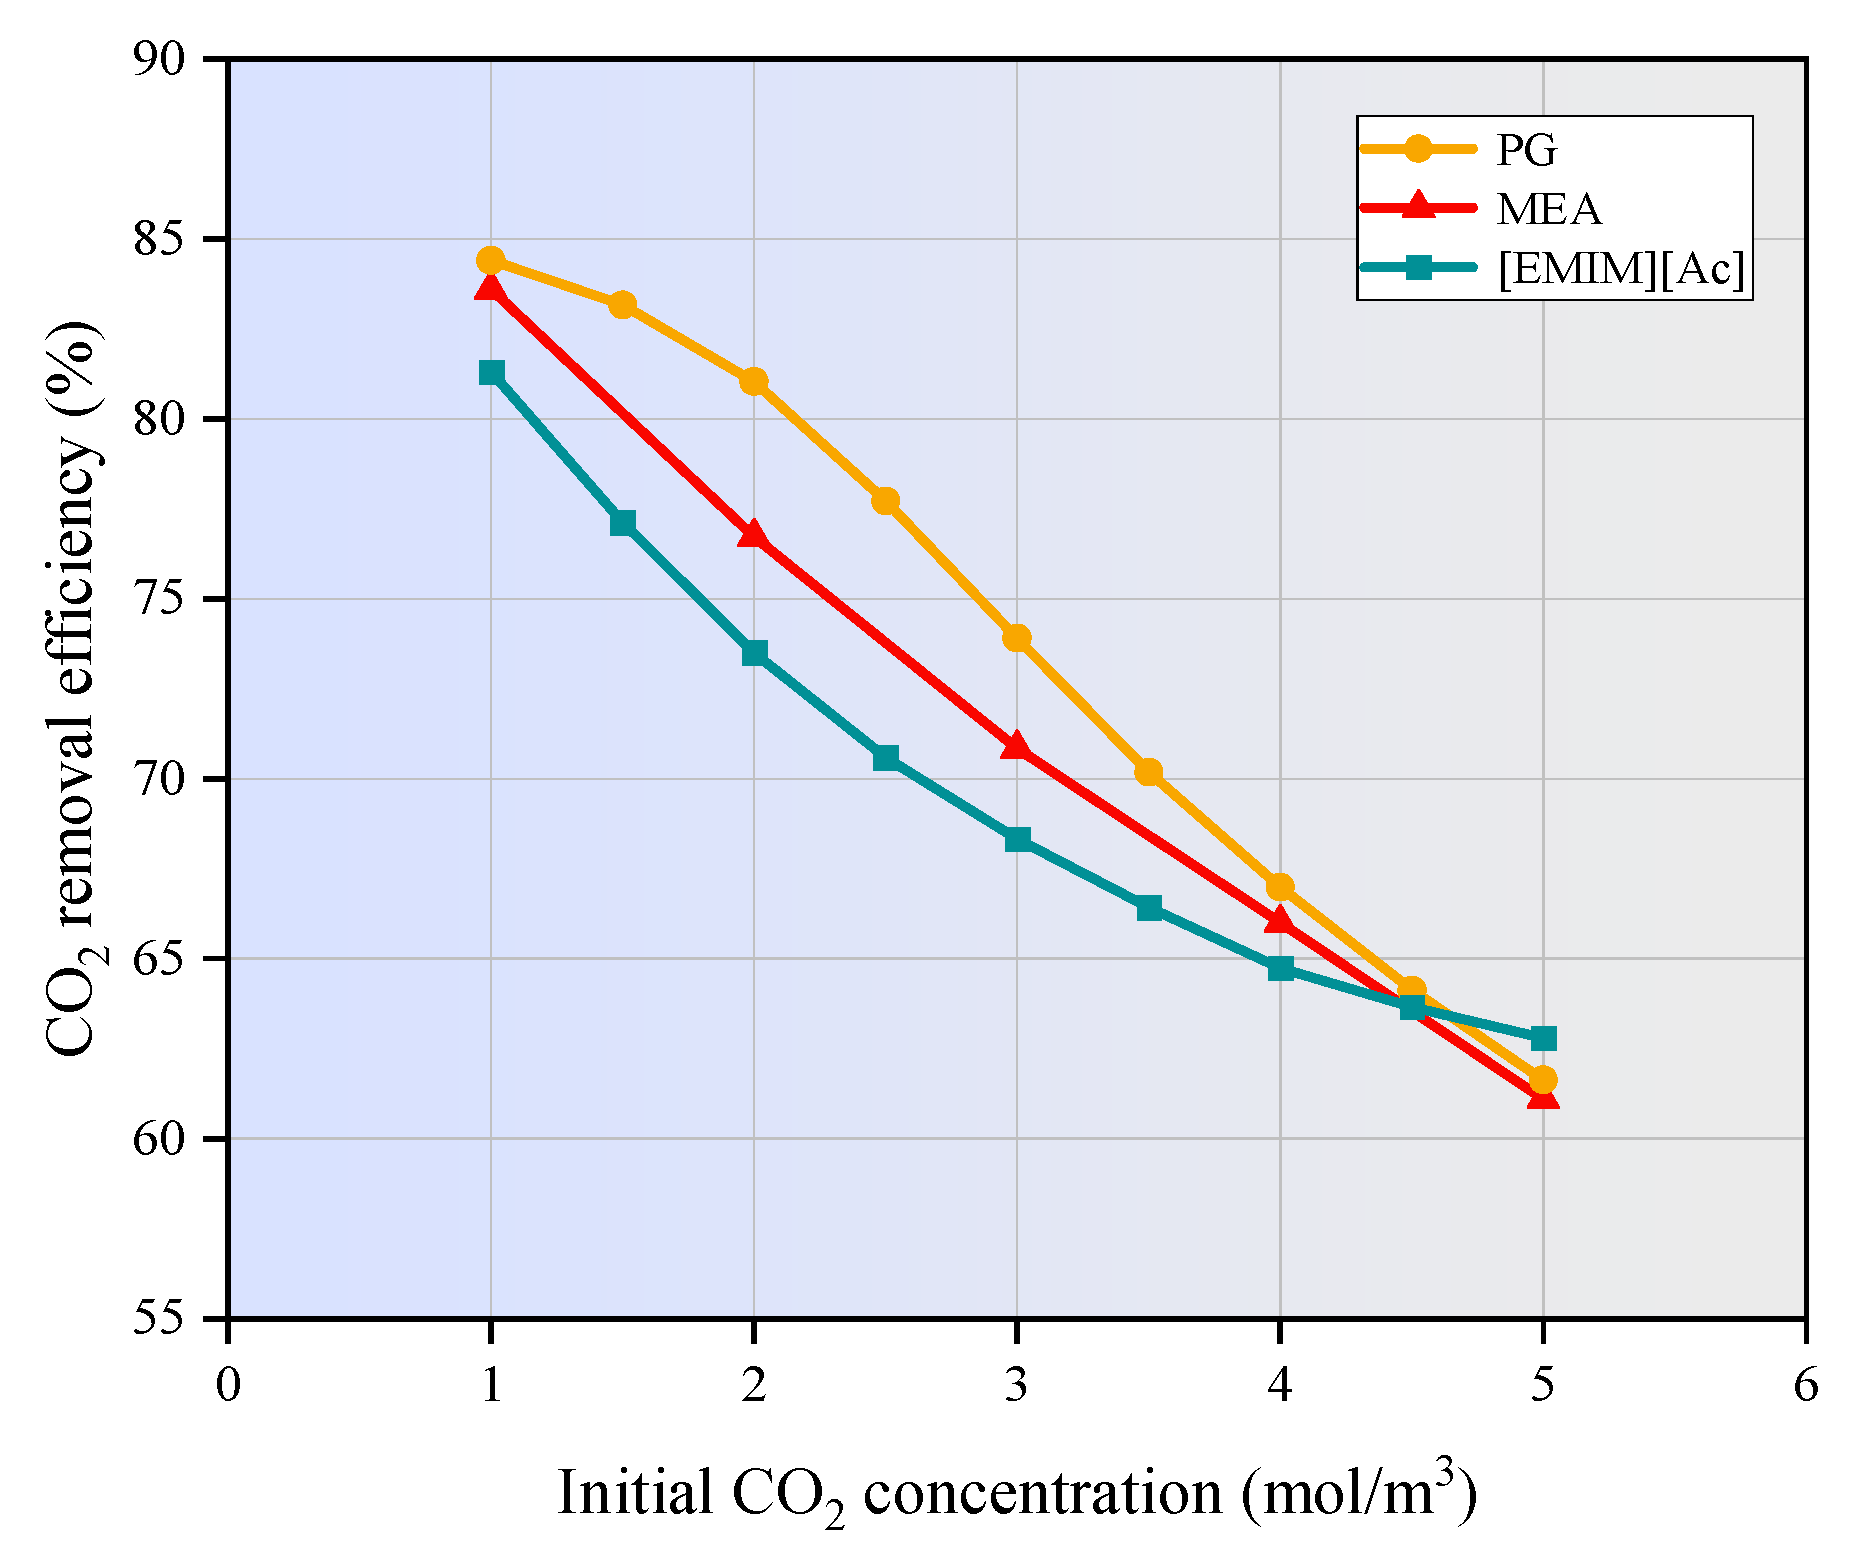
- As the gas flow rate and CO2 inlet concentration increase, the CO2 removal efficiency decreases significantly. When the gas velocity increases from 1m/s to 5m/s, the CO2 removal efficiency of MEA and PG is decreased by 41.8% and 41.2%, respectively. [EMIM][Ac] is more susceptible to the influence of gas velocity, and the corresponding CO2 removal efficiency is decreased by nearly 47%. When the CO2 inlet concentration increases from 1 mol/m3 to 5 mol/m3, the CO2 removal efficiency of three absorption systems are decreased by around 20%.
- (3)
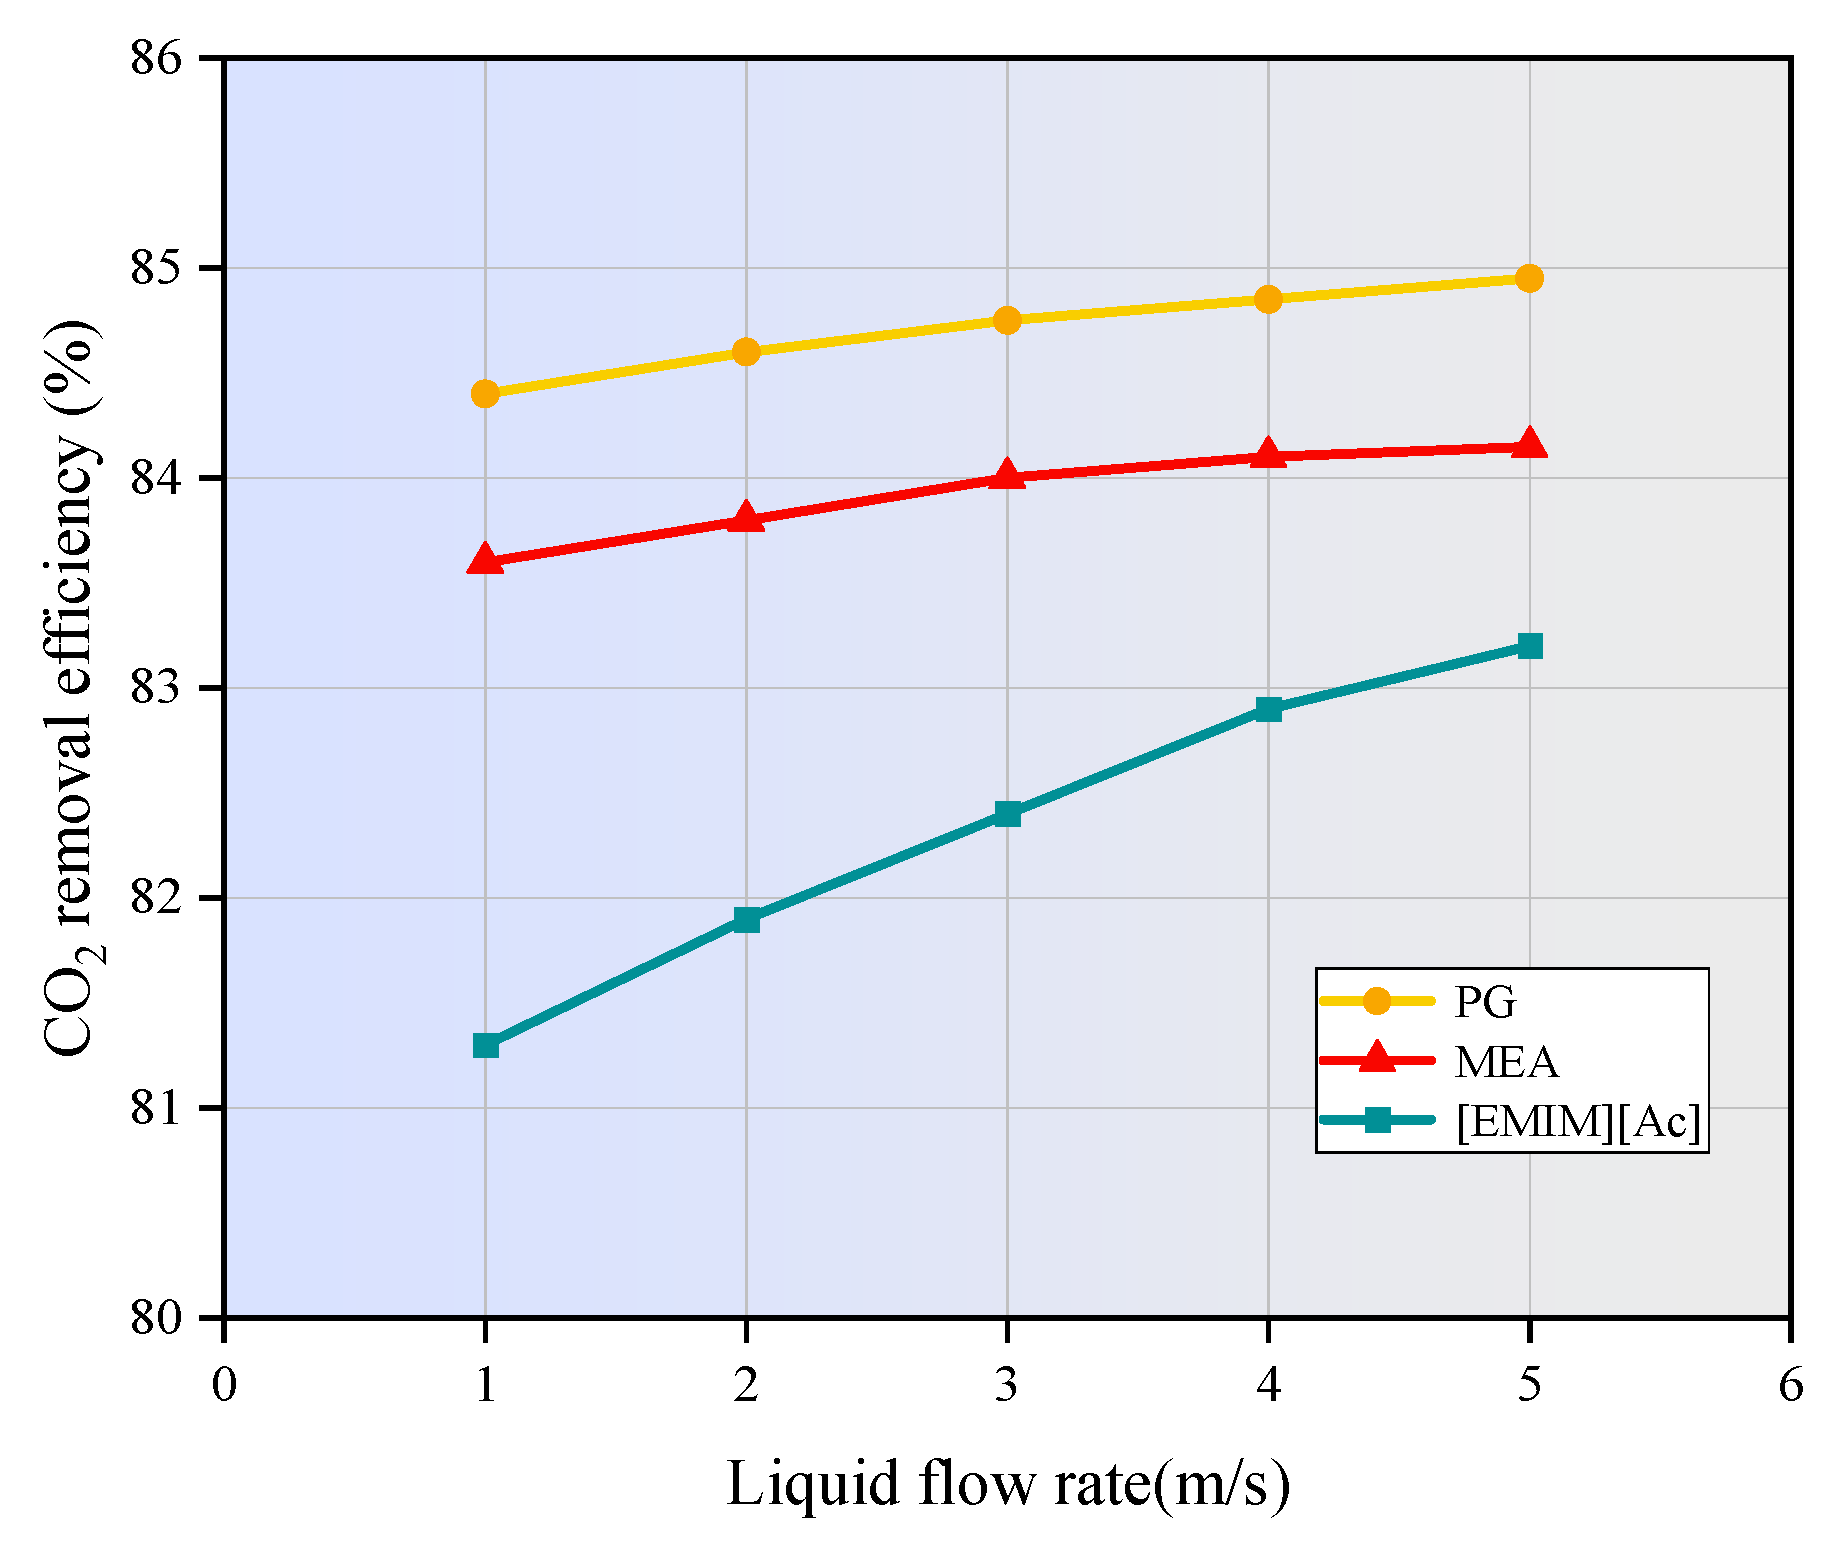
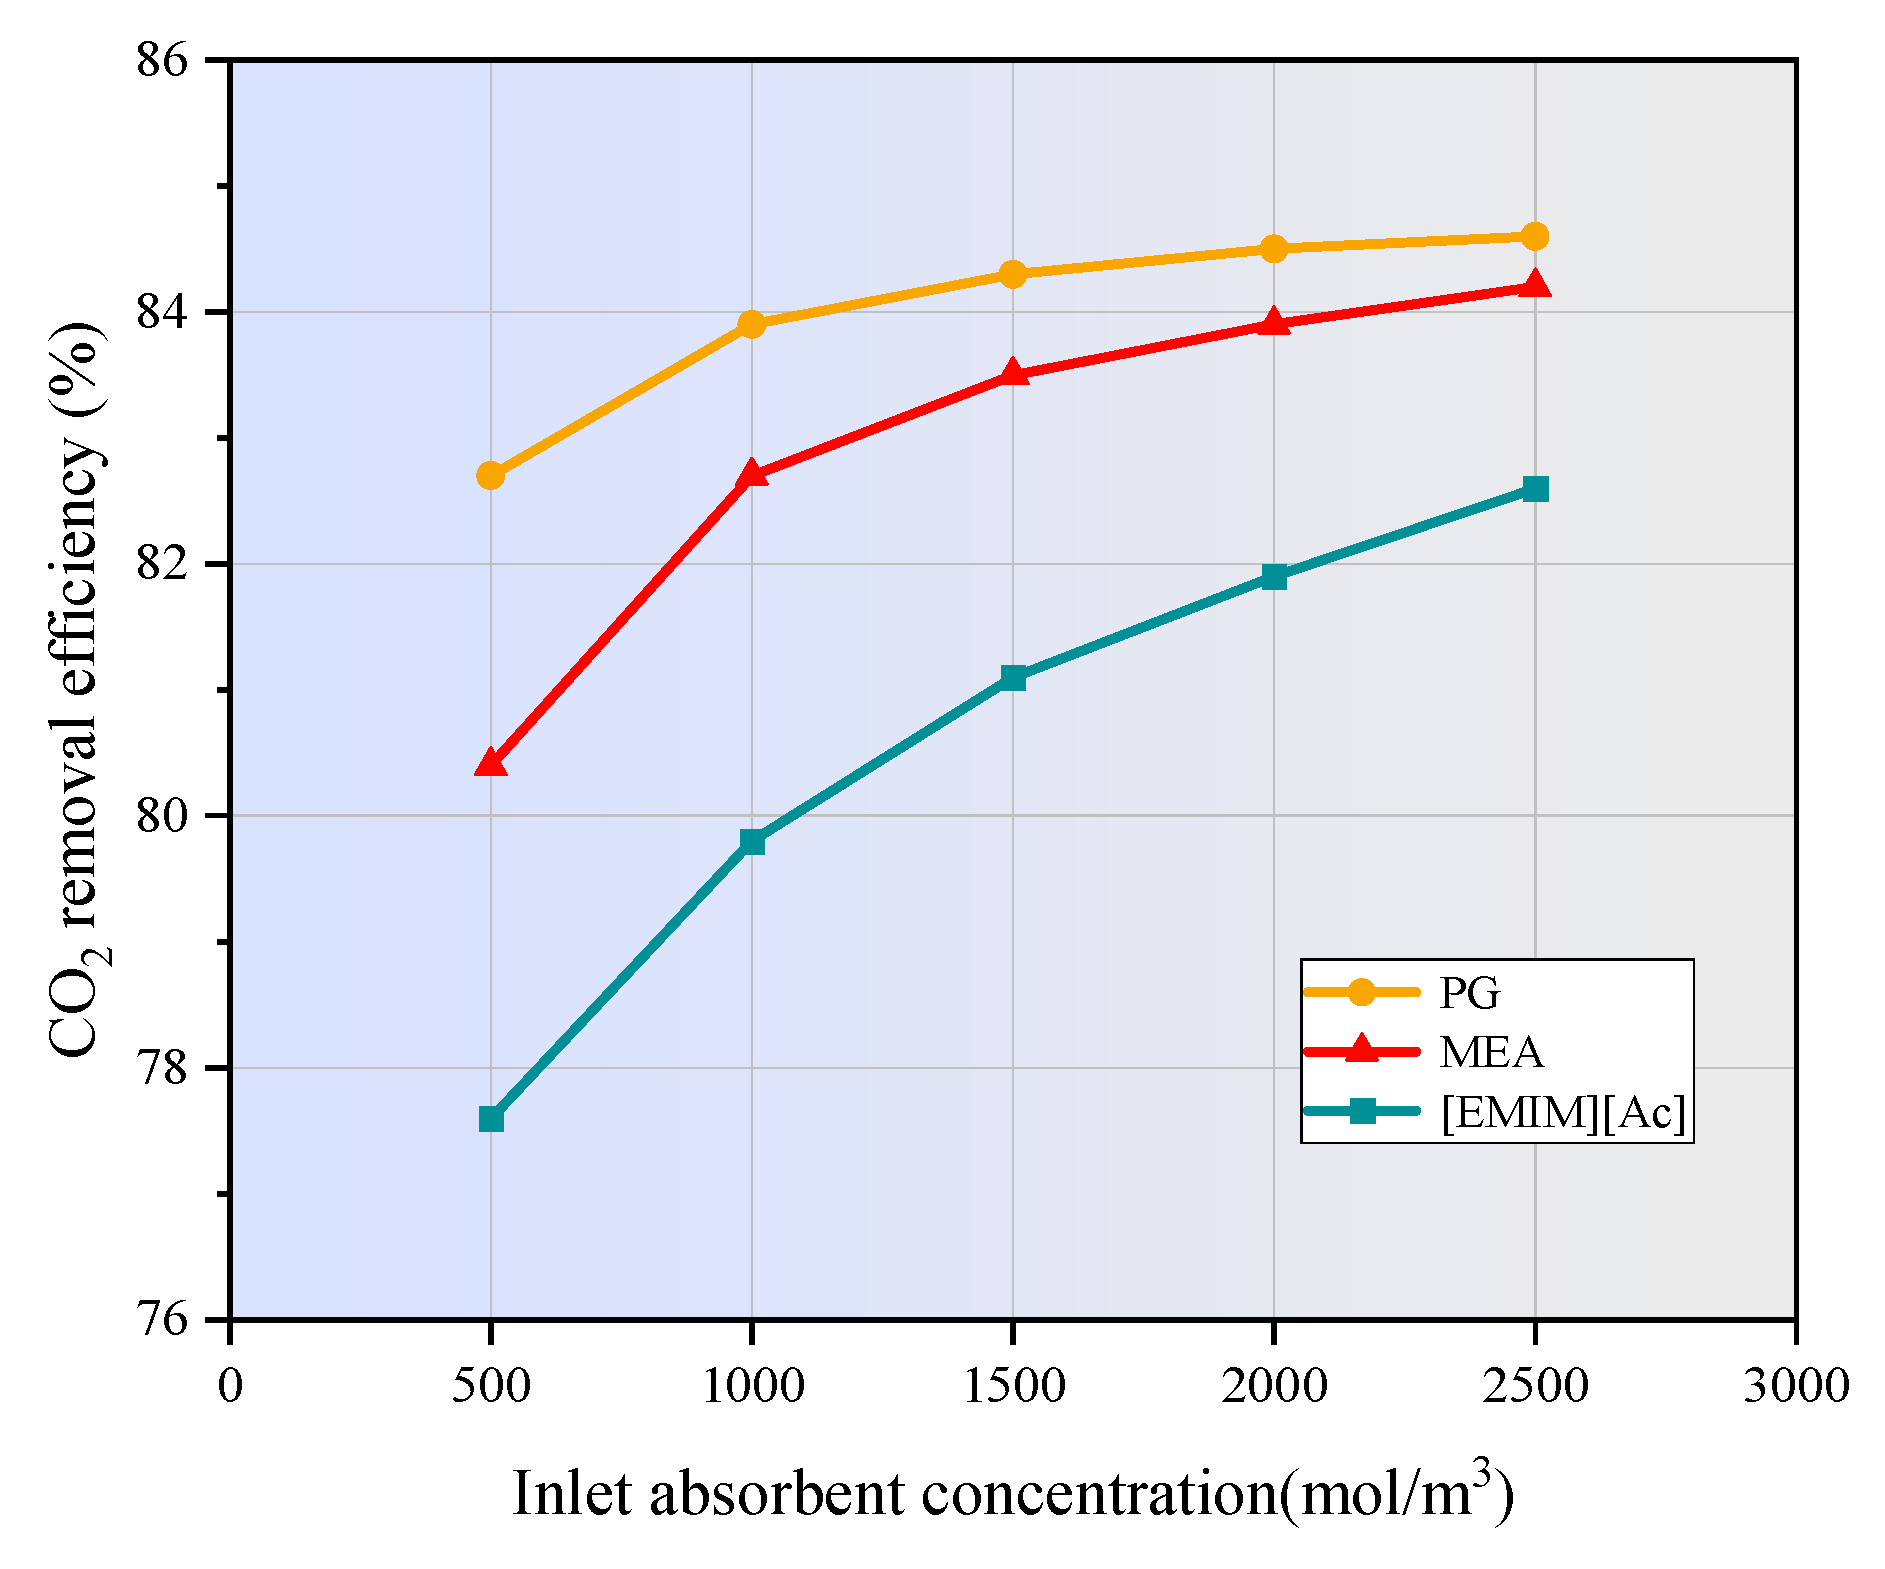
- The increase in liquid velocity and absorbent concentration has a limited positive effect on CO2 removal. When the liquid velocity increases from 1 m/s to 5 m/s, the CO2 removal efficiency of MEA, PG, and [EMIM][Ac] is only increased by 0.5%, 0.5%, and 1.9%. While the absorbent concentration increased from 500 mol/m3 to 2500 mol/m3, the CO2 removal rates of MEA, PG, and [EMIM][Ac] is increased by 3.8%, 1.9%, and 5%.
- (4)
- When the membrane length increases from 100 mm to 500 mm, the CO2 removal efficiency of MEA, PG, and [EMIM][Ac] is increased from 50% to 95.7%, 95.7%, and 93.2%. When the porosity increases from 0.1 to 0.9, the CO2 removal efficiency of MEA, PG, and [EMIM][Ac] is increased by 85.1%, 88%, and 82% respectively.
- (5)
- In this study, PG exhibits the highest absorption capacity, followed by MEA and [EMIM][Ac], and [EMIM][Ac] is more sensitive to changes in various parameters compared to the other two absorbents.
Author Contributions
Funding
Institutional Review Board Statement
Data Availability Statement
Conflicts of Interest
References
- Gkotsis, P.; Peleka, E.; Zouboulis, A. Membrane-Based Technologies for Post-Combustion CO2 Capture from Flue Gases: Recent Progress in Commonly Employed Membrane Materials. Membranes 2023, 13, 898. [Google Scholar] [CrossRef] [PubMed]
- IEA. 2020. Available online: https://www.iea.org/reports/energy-technology-perspectives-2020 (accessed on 15 January 2024).
- Li, J.; Zhang, H.D.; Gao, Z.P.; Fu, J.; Ao, W.Y.; Dai, J.J. Experimental and Theoretical Studies on Mass Transfer Performance for CO2 Absorption into Aqueous N,N-Dimethylethanolamine Solution in the Polytetrafluoroethylene Hollow-Fiber Membrane Contactor. Ind. Eng. Chem. Res. 2018, 57, 16862–16874. [Google Scholar]
- Miroshnichenko, D.; Shalygin, M.; Bazhenov, S. Simulation of the Membrane Process of CO2 Capture from Flue Gas via Commercial Membranes While Accounting for the Presence of Water Vapor. Membranes 2023, 13, 692. [Google Scholar] [CrossRef]
- Li, F.; Lv, Y.; Bi, J.; Zhang, H.; Zhao, W.; Su, Y.; Du, T.; Mu, J. Environmental Impact Evaluation of CO2 Absorption and Desorption Enhancement by Membrane Gas Absorption: A Life Cycle Assessment Study. Energies 2024, 17, 2371. [Google Scholar] [CrossRef]
- Mu, J.; Bi, J.; Lv, Y.; Su, Y.; Zhao, W.; Zhang, H.; Li, F.; Du, T.; Zhou, H. Techno-economic evaluation on solar-assisted post-combustion CO2 capture in hollow fiber membrane contactors. Energies 2024, 17, 2139. [Google Scholar] [CrossRef]
- Lu, G.; Wang, Z.; Bhatti, U.H.; Fan, X. Recent progress in carbon dioxide capture technologies: A review. Clean Energy Sci. Technol. 2023, 1, 32. [Google Scholar] [CrossRef]
- Lv, Y.; Yu, X.; Jia, J.; Tu, S.; Yan, J.; Dahlquist, E. Fabrication and Characterization of Superhydrophobic Polypropylene Hollow Fiber Membranes for Carbon Dioxide Absorption. Appl. Energy 2012, 1, 167–174. [Google Scholar] [CrossRef]
- Tran, M.L.; Nguyen, C.H.; Chu, K.-Y.; Juang, R.-S. A Simplified Kinetic Modeling of CO2 Absorption into Water and Monoethanolamine Solution in Hollow-Fiber Membrane Contactors. Membranes 2023, 13, 494. [Google Scholar] [CrossRef] [PubMed]
- Lv, Y.; Yu, X.; Tu, S.; Yan, J.; Dahlquist, E. Experimental studies on simultaneous removal of CO2 and SO2 in a polypropylene hollow fiber membrane contactor. Appl. Energy 2012, 97, 283–288. [Google Scholar] [CrossRef]
- Sumayli, A.; Mahdi, W.A.; Alshahrani, S.M. Numerical evaluation of CO2 molecular removal from CO2/N2 mixture utilizing eco-friendly [emim][OAc] and [emim][MeSO4] ionic liquids inside membrane contactor. J. Mol. Liq. 2024, 396, 123958. [Google Scholar] [CrossRef]
- Nakhjiri, A.T.; Heydarinasab, A. Computational simulation and theoretical modeling of CO2 separation using EDA, PZEA and PS absorbents inside the hollow fiber membrane contactor. J. Ind. Eng. Chem. 2019, 78, 106–115. [Google Scholar] [CrossRef]
- Nakhjiri, A.T.; Heydarinasab, A.; Bakhtiari, O.; Mohammadi, T. The effect of membrane pores wettability on CO2 removal from CO2/CH4 gaseous mixture using NaOH, MEA and TEA liquid absorbents in hollow fiber membrane contactor. Chin. J. Chem. Eng. 2018, 26, 1845–1861. [Google Scholar] [CrossRef]
- Nakhjiri, A.T.; Heydarinasab, A. Efficiency evaluation of novel liquid potassium lysinate chemical solution for CO2 molecular removal inside the hollow fiber membrane contactor: Comprehensive modeling and CFD simulation. J. Mol. Liq. 2020, 297, 111561. [Google Scholar] [CrossRef]
- Nakhjiri, A.T.; Heydarinasab, A.; Bakhtiari, O.; Mohammadi, T. Numerical simulation of CO2/H2S simultaneous removal from natural gas using potassium carbonate aqueous solution in hollow fiber membrane contactor. J. Environ. Chem. Eng. 2020, 8, 104130. [Google Scholar] [CrossRef]
- Ao, D.; Ma, G.; Zang, C.; Qin, Y.; Qi, Y.; Wan, W. A Numerical Study on Removal of CO2 by 2-(tert-Butylamino) Ethanol in a Hollow Fiber Membrane Contactor. Ind. Eng. Chem. Res. 2022, 61, 3685–3693. [Google Scholar] [CrossRef]
- Hajilary, N.; Rezakazemi, M. CFD modeling of CO2 capture by water-based nanofluids using hollow fiber membrane contactor. Int. J. Greenh. Gas Control. 2018, 77, 88–95. [Google Scholar] [CrossRef]
- Ansaripour, M.; Haghshenasfard, M.; Moheb, A. Experimental and numerical investigation of CO2 absorption using nanofluids in a hollow-fiber membrane contactor. Chem. Eng. Technol. 2018, 41, 367–378. [Google Scholar] [CrossRef]
- Rezakazemi, M.; Darabi, M.; Soroush, E.; Mesbah, M. CO2 absorption enhancement by water-based nanofluids of CNT and SiO2 using hollow-fiber membrane contactor. Sep. Purif. Technol. 2019, 210, 920–926. [Google Scholar] [CrossRef]
- Vaezi, M.; Sanaeepur, H.; Amooghin, A.E.; Nakhjiri, A.T. Modeling of CO2 absorption in a membrane contactor containing 3-diethylaminopropylamine (DEAPA) solvent. Int. J. Greenh. Gas Control. 2023, 127, 103938. [Google Scholar] [CrossRef]
- Bozonc, A.C.; Cormos, A.M.; Dragan, S.; Dinca, C.; Cormos, C.C. Dynamic Modeling of CO2 Absorption Process Using Hollow-Fiber Membrane Contactor in MEA Solution. Energies 2022, 15, 7241. [Google Scholar] [CrossRef]
- Xia, J.; Zhang, Z.; Wang, L.; Wang, F.; Miao, H.; Zhang, H.; Xia, L.; Yuan, J. Performance evaluation and optimization of hollow fiber membrane contactors for carbon dioxide absorption: A comparative study of ammonia, ethanolamine, and diethanolamine solvents. J. Environ. Chem. Eng. 2023, 11, 111354. [Google Scholar] [CrossRef]
- Bozonc, A.C.; Sandu, V.C.; Cormos, C.C.; Cormos, A.M. 3D-CFD Modeling of Hollow-Fiber Membrane Contactor for CO2 Absorption Using MEA Solution. Membranes 2024, 14, 86. [Google Scholar] [CrossRef]
- Sohaib, Q.; Muhammad, A.; Younas, M.; Rezakazemi, M.; Druon-Bocquet, S.; Sanchez-Marcano, J. Rigorous non-isothermal modeling approach for mass and energy transport during CO2 absorption into aqueous solution of amino acid ionic liquids in hollow fiber membrane contactors. Sep. Purif. Technol. 2021, 254, 117644. [Google Scholar] [CrossRef]
- Zaidiza, D.A.; Wilson, S.G.; Belaissaoui, B.; Rode, S.; Castel, C.; Roizard, D.; Favre, E. Rigorous modelling of adiabatic multicomponent CO2 post-combustion capture using hollow fibre membrane contactors. Chem. Eng. Sci. 2016, 145, 45–58. [Google Scholar] [CrossRef]
- Happel, J. Viscous flow relative to arrays of cylinders. AIChE J. 1959, 5, 174–177. [Google Scholar] [CrossRef]
- Faiz, R.; Al-Marzouqi, M. Insights on natural gas purification: Simultaneous absorption of CO2 and H2S using membrane contactors. Sep. Purif. Technol. 2011, 76, 351–361. [Google Scholar] [CrossRef]
- Al-Marzouqi, M.H.; El-Naas, M.H.; Marzouk, S.A.; Al-Zarooni, M.A.; Abdullatif, N.; Faiz, R. Modeling of CO2 absorption in membrane contactors. Sep. Purif. Technol. 2008, 59, 286–293. [Google Scholar] [CrossRef]
- Cao, F.; Gao, H.; Ling, H.; Huang, Y.; Liang, Z. Theoretical modeling of the mass transfer performance of CO2 absorption into DEAB solution in hollow fiber membrane contactor. J. Membr. Sci. 2020, 593, 117439. [Google Scholar] [CrossRef]
- Faiz, R.; Al-Marzouqi, M. Mathematical modeling for the simultaneous absorption of CO2 and H2S using MEA in hollow fiber membrane contactors. J. Membr. Sci. 2009, 342, 269–278. [Google Scholar] [CrossRef]
- Nakhjiri, A.T.; Heydarinasab, A.; Bakhtiari, O.; Mohammadi, T. Experimental investigation and mathematical modeling of CO2 sequestration from CO2/CH4 gaseous mixture using MEA and TEA aqueous absorbents through polypropylene hollow fiber membrane contactor. J. Membr. Sci. 2018, 565, 1–13. [Google Scholar] [CrossRef]
- Ghobadi, J.; Ramirez, D.; Khoramfar, S.; Kabir, M.M.; Jerman, R.; Saeed, M. Mathematical modeling of CO2 separation using different diameter hollow fiber membranes. Int. J. Greenh. Gas Control. 2021, 104, 103204. [Google Scholar] [CrossRef]
- Bakhshali, N.; Tahery, R.; Banazadeh, H. Modelling and simulation of mass transfer in tubular gas-liquid membrane contactors for turbulent flow conditions and comparison of results with laminar flow conditions. Middle-East J. Sci. 2013, 10, 1419–1430. [Google Scholar]
- Lee, H.J.; Kim, M.K.; Park, J.H.; Magnone, E. Temperature and pressure dependence of the CO2 absorption through a ceramic hollow fiber membrane contactor module. Chem. Eng. Process. Process Intensif. 2020, 150, 107871. [Google Scholar] [CrossRef]
- Keshavarz, P.; Fathikalajahi, J.; Ayatollahi, S. Analysis of CO2 separation and simulation of a partially wetted hollow fiber membrane contactor. J. Hazard. Mater. 2008, 152, 1237–1247. [Google Scholar] [CrossRef]
- Paul, S.; Ghoshal, A.K.; Mandal, B. Removal of CO2 by single and blended aqueous alkanolamine solvents in hollow-fiber membrane contactor: Modeling and simulation. Ind. Eng. Chem. Res. 2007, 46, 2576–2588. [Google Scholar] [CrossRef]
- Park, S.W.; Choi, B.S.; Lee, J.W. Chemical absorption of carbon dioxide with triethanolamine in non-aqueous solutions. Korean J. Chem. Eng. 2006, 23, 138–143. [Google Scholar] [CrossRef]
- Lv, B.; Xia, Y.; Shi, Y.; Liu, N.; Li, W.; Li, S. A novel hydrophilic amino acid ionic liquid [C2OHmim][Gly] as aqueous sorbent for CO2 capture. Int. J. Greenh. Gas Control. 2016, 46, 1–6. [Google Scholar] [CrossRef]
- Masoumi, S.; Keshavarz, P.; Ayatollahi, S.; Mehdipour, M.; Rastgoo, Z. Enhanced carbon dioxide separation by amine-promoted potassium carbonate solution in a hollow fiber membrane contactor. Energy Fuels 2013, 27, 5423–5432. [Google Scholar] [CrossRef]
- Zhang, Z.; Yan, Y.; Zhang, L.; Chen, Y.; Ran, J.; Pu, G.; Qin, C. Theoretical study on CO2 absorption from biogas by membrane contactors: Effect of operating parameters. Ind. Eng. Chem. Res. 2014, 53, 14075–14083. [Google Scholar] [CrossRef]
- Yan, S.P.; Fang, M.X.; Zhang, W.F.; Wang, S.Y.; Xu, Z.K.; Luo, Z.Y.; Cen, K.F. Experimental study on the separation of CO2 from flue gas using hollow fiber membrane contactors without wetting. Fuel Process. Technol. 2007, 88, 501–511. [Google Scholar] [CrossRef]
- Zareie-kordshouli, F.; Lashani-zadehgan, A.; Darvishi, P. Comparative evaluation of CO2 capture from flue gas by [Emim][Ac] ionic liquid, aqueous potassium carbonate (without activator) and MEA solutions in a packed column. Int. J. Greenh. Gas Control. 2016, 52, 305–318. [Google Scholar] [CrossRef]
- Yin, Y.; Gao, H.; Liang, Z. Experimental and Numerical Analysis for Improving CO2 Mass Transfer Performance of Blended Solvents in Hollow Fiber Membrane Contactors. Ind. Eng. Chem. Res. 2023, 62, 13458–13469. [Google Scholar] [CrossRef]
- Shirazian, S.; Taghvaie Nakhjiri, A.; Heydarinasab, A.; Ghadiri, M. Theoretical investigations on the effect of absorbent type on carbon dioxide capture in hollow-fiber membrane contactors. PLoS ONE 2020, 15, e0236367. [Google Scholar] [CrossRef] [PubMed]


| Specifications | Value | Unit |
|---|---|---|
| Module length (L) | 100 | mm |
| Module inner radius (R) | 10 | mm |
| Fiber inner radius (r1) Fiber outer radius (r2) | 0.16 0.21 | mm mm |
| Porosity (ε) | 40 | % |
| Tortuosity (τ) | 4 | |
| Number of fibers (n) | 600 |
| Parameter | Value | Unit | References |
|---|---|---|---|
| DCO2-shell | 1.8 × 10⁻⁵ | m2/s | [35] |
| DCO2-MEA | 1.51 × 10⁻⁹ | m2/s | [36] |
| DCO2-PG | 1.8 × 10⁻⁹ | m2/s | [37] |
| DCO2-[EMIM][Ac] | 5.58 × 10⁻¹⁰ | m2/s | [38] |
| DMEA-tube | 9.32 × 10⁻¹⁰ | m2/s | [36] |
| DPG-tube | 1.05 × 10⁻⁹ | m2/s | [37] |
| D[EMIM][Ac]-tube | 8.36 × 10⁻¹¹ | m2/s | [38] |
| kMEA | mol/m3·s | [36] | |
| kPG | 1016 exp(−8544/T) | mol/m3·s | [37] |
| k[EMIM][Ac] | 1545 exp(−1240.9/T) | mol/m3·s | [38] |
| mCO2-MEA | 0.86 | [39] | |
| mCO2-PG | 0.625 | [13] | |
| mCO2-[EMIM][Ac] | 0.529 | [38] |
| Boundary | Tube | Membrane | Shell |
|---|---|---|---|
| z = 0 | = | Insulated | |
| z = L | Insulated | = | |
| r = 0 | |||
| r = r1 | |||
| r = r2 | |||
| r = r3 |
| Boundary | Tube | Membrane | Shell |
|---|---|---|---|
| z = 0 | |||
| z = L | |||
| r = 0 | |||
| r = r1 | |||
| r = r2 | |||
| r = r3 |
Disclaimer/Publisher’s Note: The statements, opinions and data contained in all publications are solely those of the individual author(s) and contributor(s) and not of MDPI and/or the editor(s). MDPI and/or the editor(s) disclaim responsibility for any injury to people or property resulting from any ideas, methods, instructions or products referred to in the content. |
© 2025 by the authors. Licensee MDPI, Basel, Switzerland. This article is an open access article distributed under the terms and conditions of the Creative Commons Attribution (CC BY) license (https://creativecommons.org/licenses/by/4.0/).
Share and Cite
Jin, Y.; Wang, L.; Bi, J.; Zhao, W.; Zhang, H.; Lv, Y.; Chen, X. Simulation of Carbon Dioxide Absorption in a Hollow Fiber Membrane Contactor Under Non-Isothermal Conditions. Membranes 2025, 15, 93. https://doi.org/10.3390/membranes15030093
Jin Y, Wang L, Bi J, Zhao W, Zhang H, Lv Y, Chen X. Simulation of Carbon Dioxide Absorption in a Hollow Fiber Membrane Contactor Under Non-Isothermal Conditions. Membranes. 2025; 15(3):93. https://doi.org/10.3390/membranes15030093
Chicago/Turabian StyleJin, Youkang, Lei Wang, Jinpeng Bi, Wei Zhao, Hui Zhang, Yuexia Lv, and Xi Chen. 2025. "Simulation of Carbon Dioxide Absorption in a Hollow Fiber Membrane Contactor Under Non-Isothermal Conditions" Membranes 15, no. 3: 93. https://doi.org/10.3390/membranes15030093
APA StyleJin, Y., Wang, L., Bi, J., Zhao, W., Zhang, H., Lv, Y., & Chen, X. (2025). Simulation of Carbon Dioxide Absorption in a Hollow Fiber Membrane Contactor Under Non-Isothermal Conditions. Membranes, 15(3), 93. https://doi.org/10.3390/membranes15030093