
The Effect of Membrane Surface Hydrophobicity on the Performance and Water Production Cost of a Desalination Unit


Abstract
1. Introduction
2. Materials and Methods
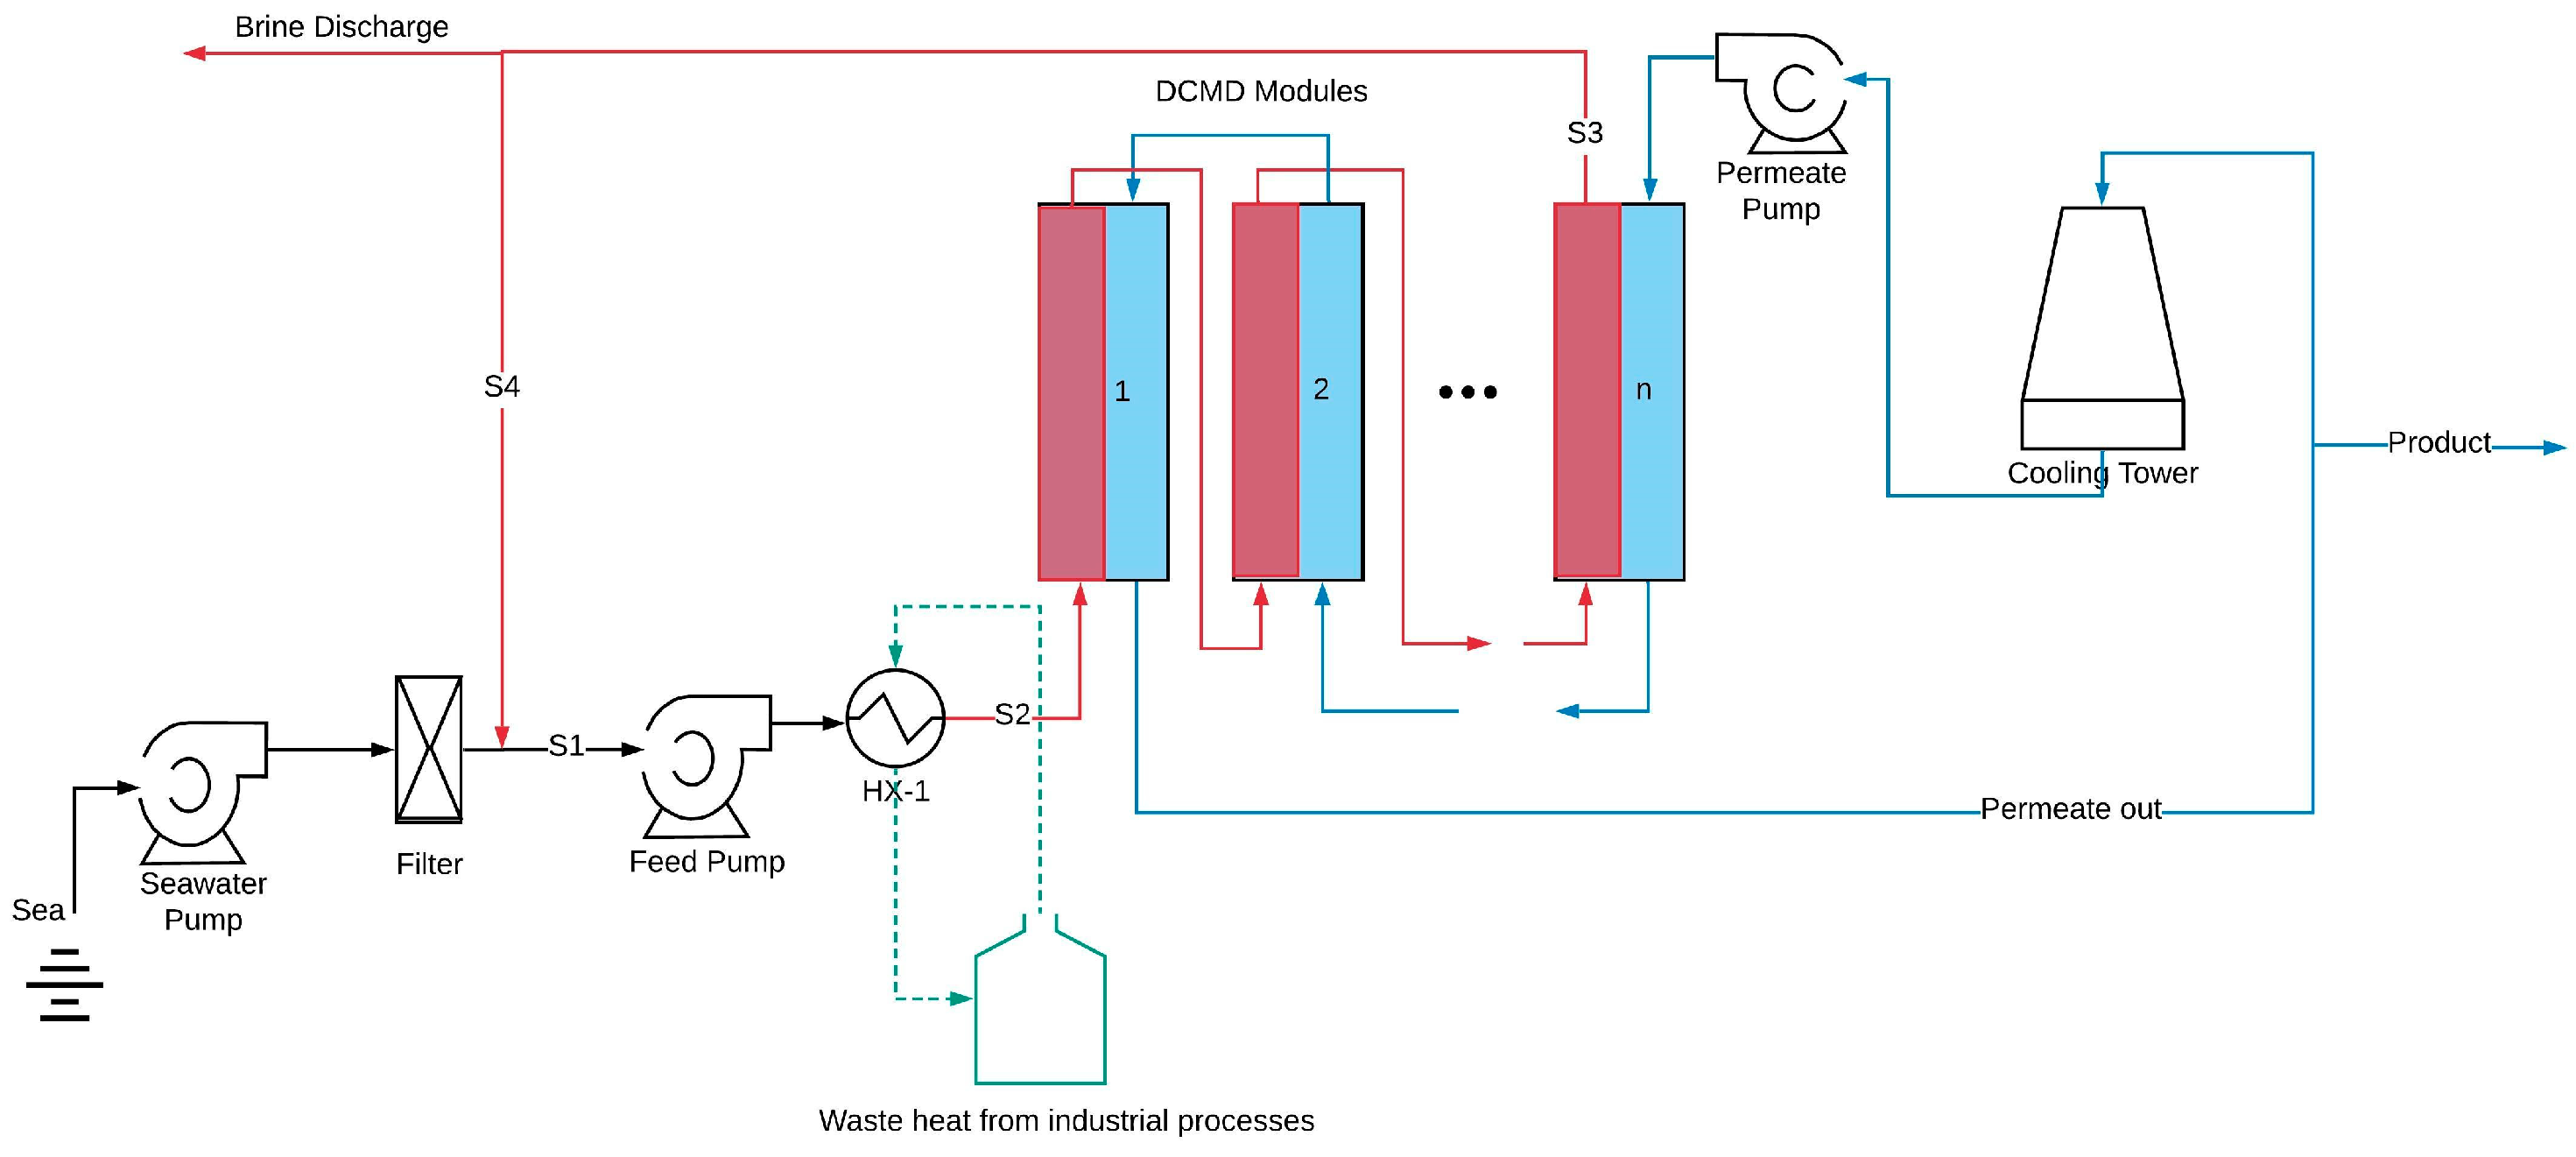
2.1. Desalination Plant
2.2. Mathematical Modeling of DCMD
2.3. Membrane Pore Wetting
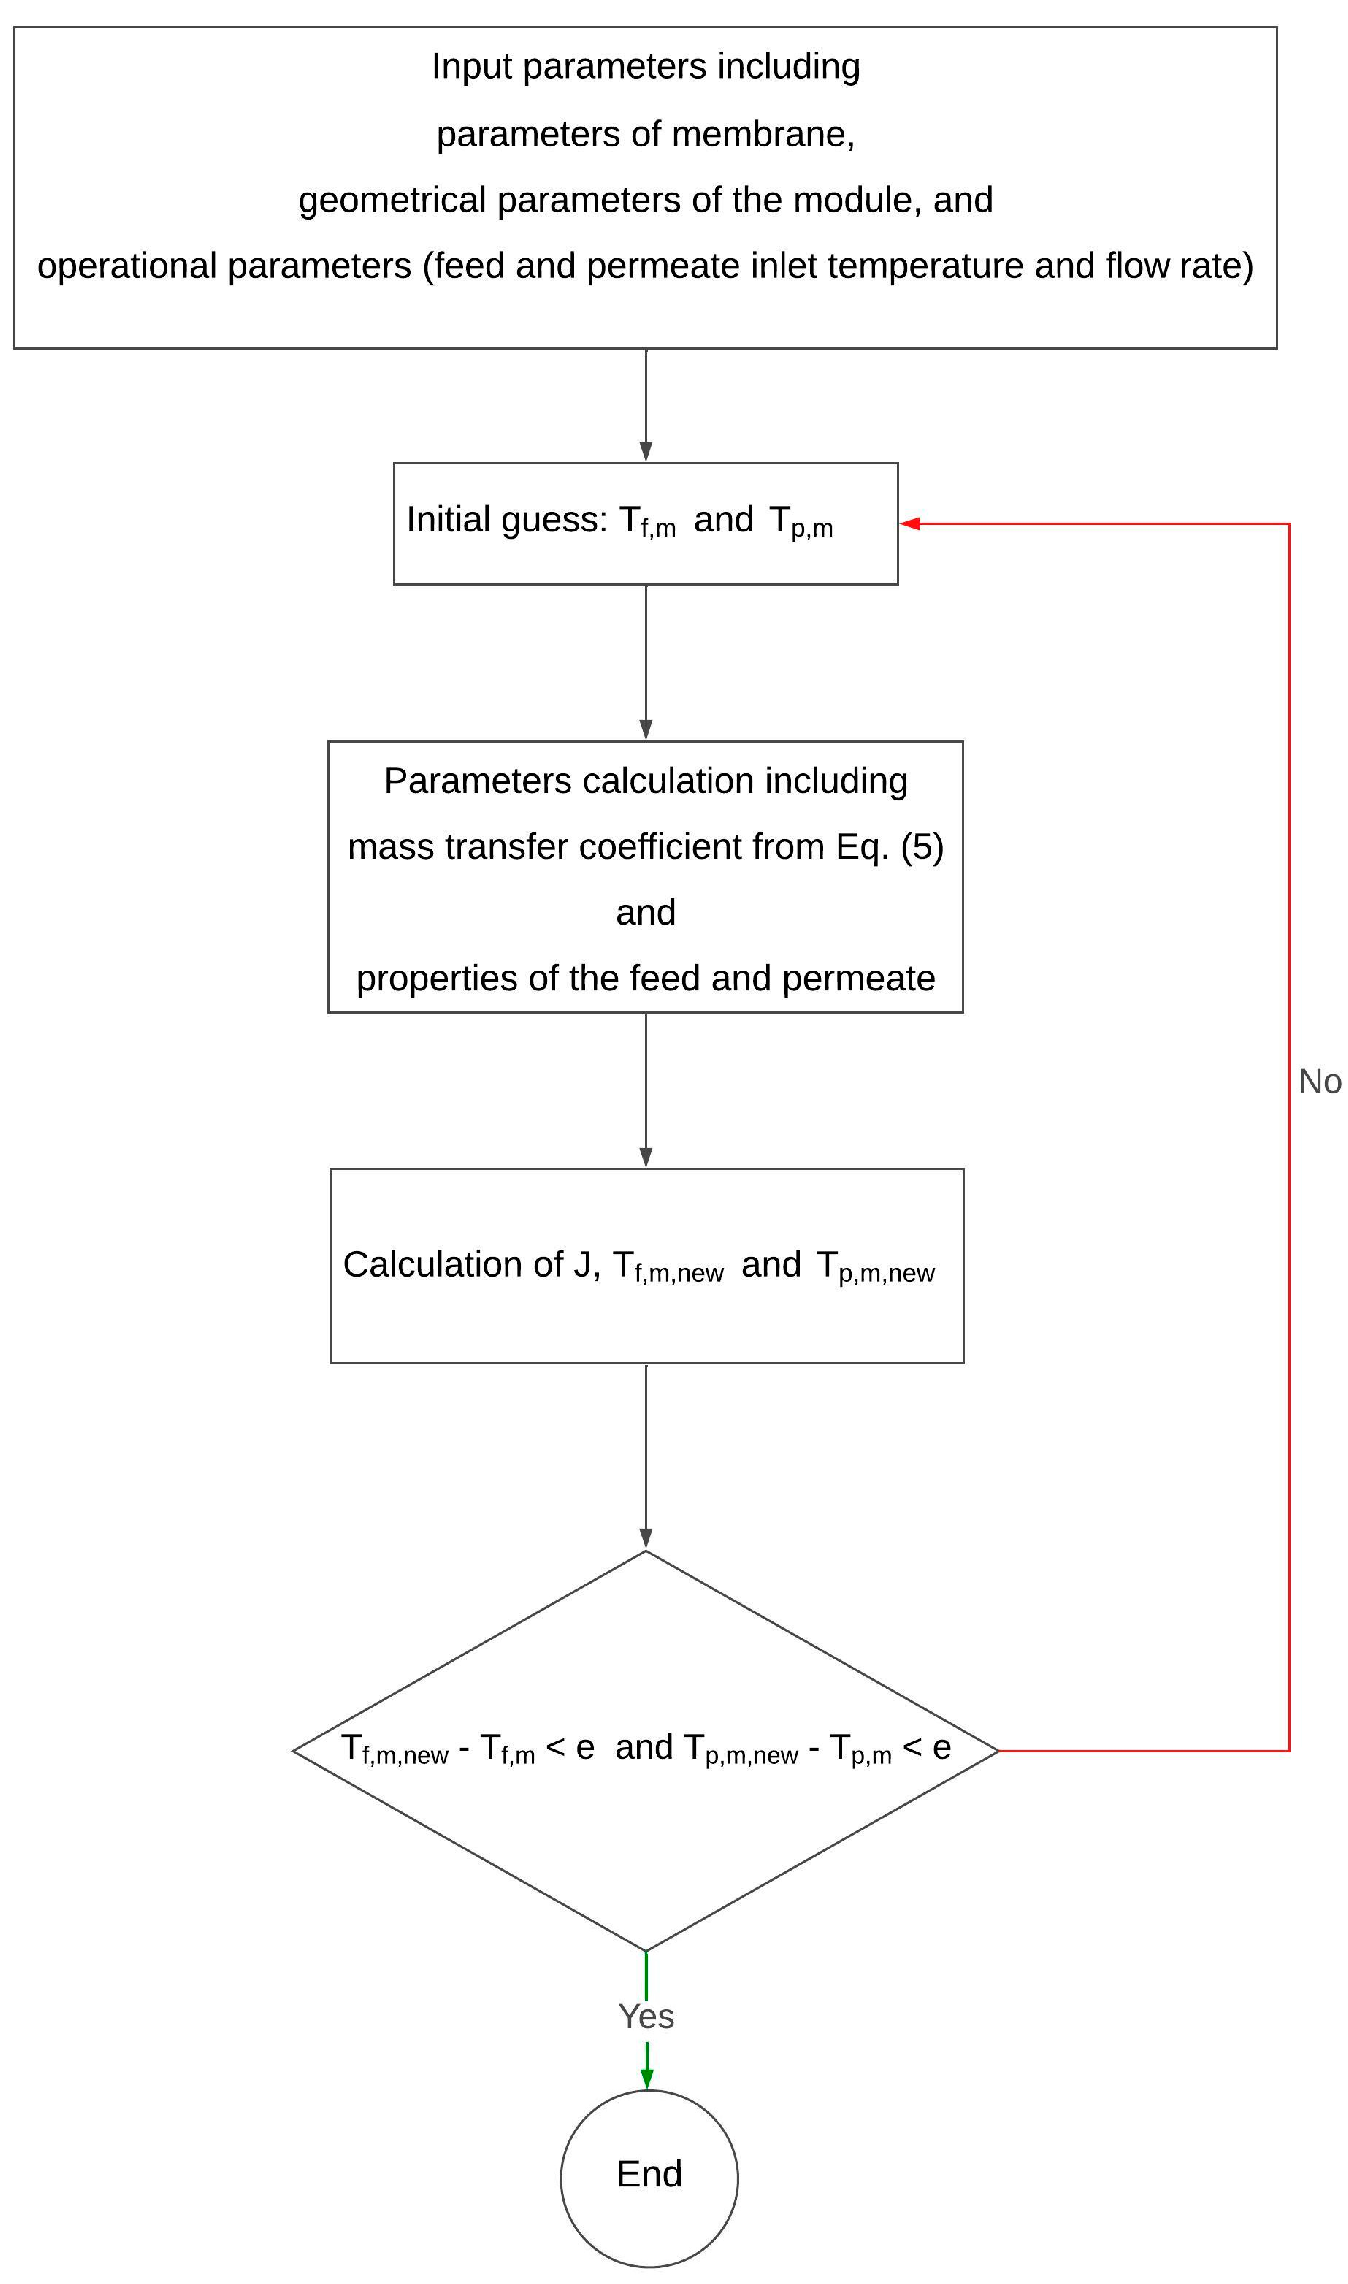
2.4. Code Development
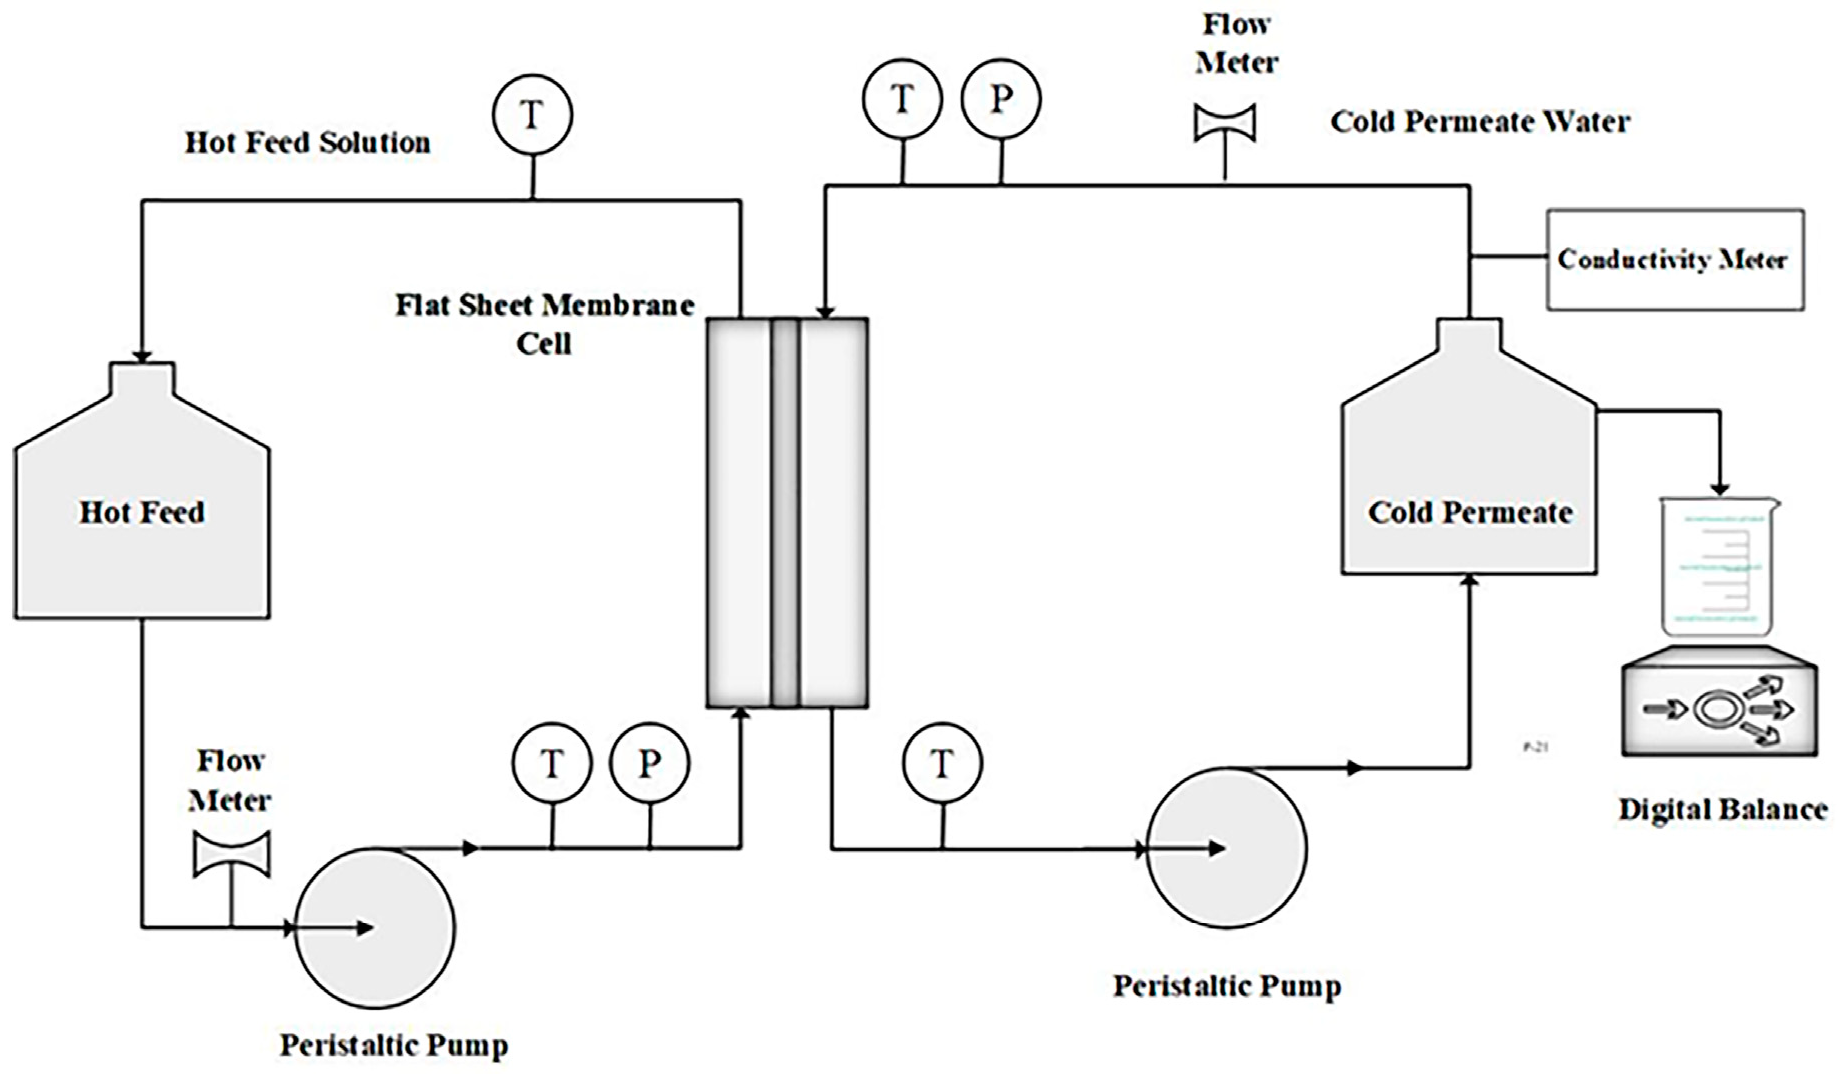
2.5. DCMD Experiments
2.6. Cost Calculation
3. Results and Discussions
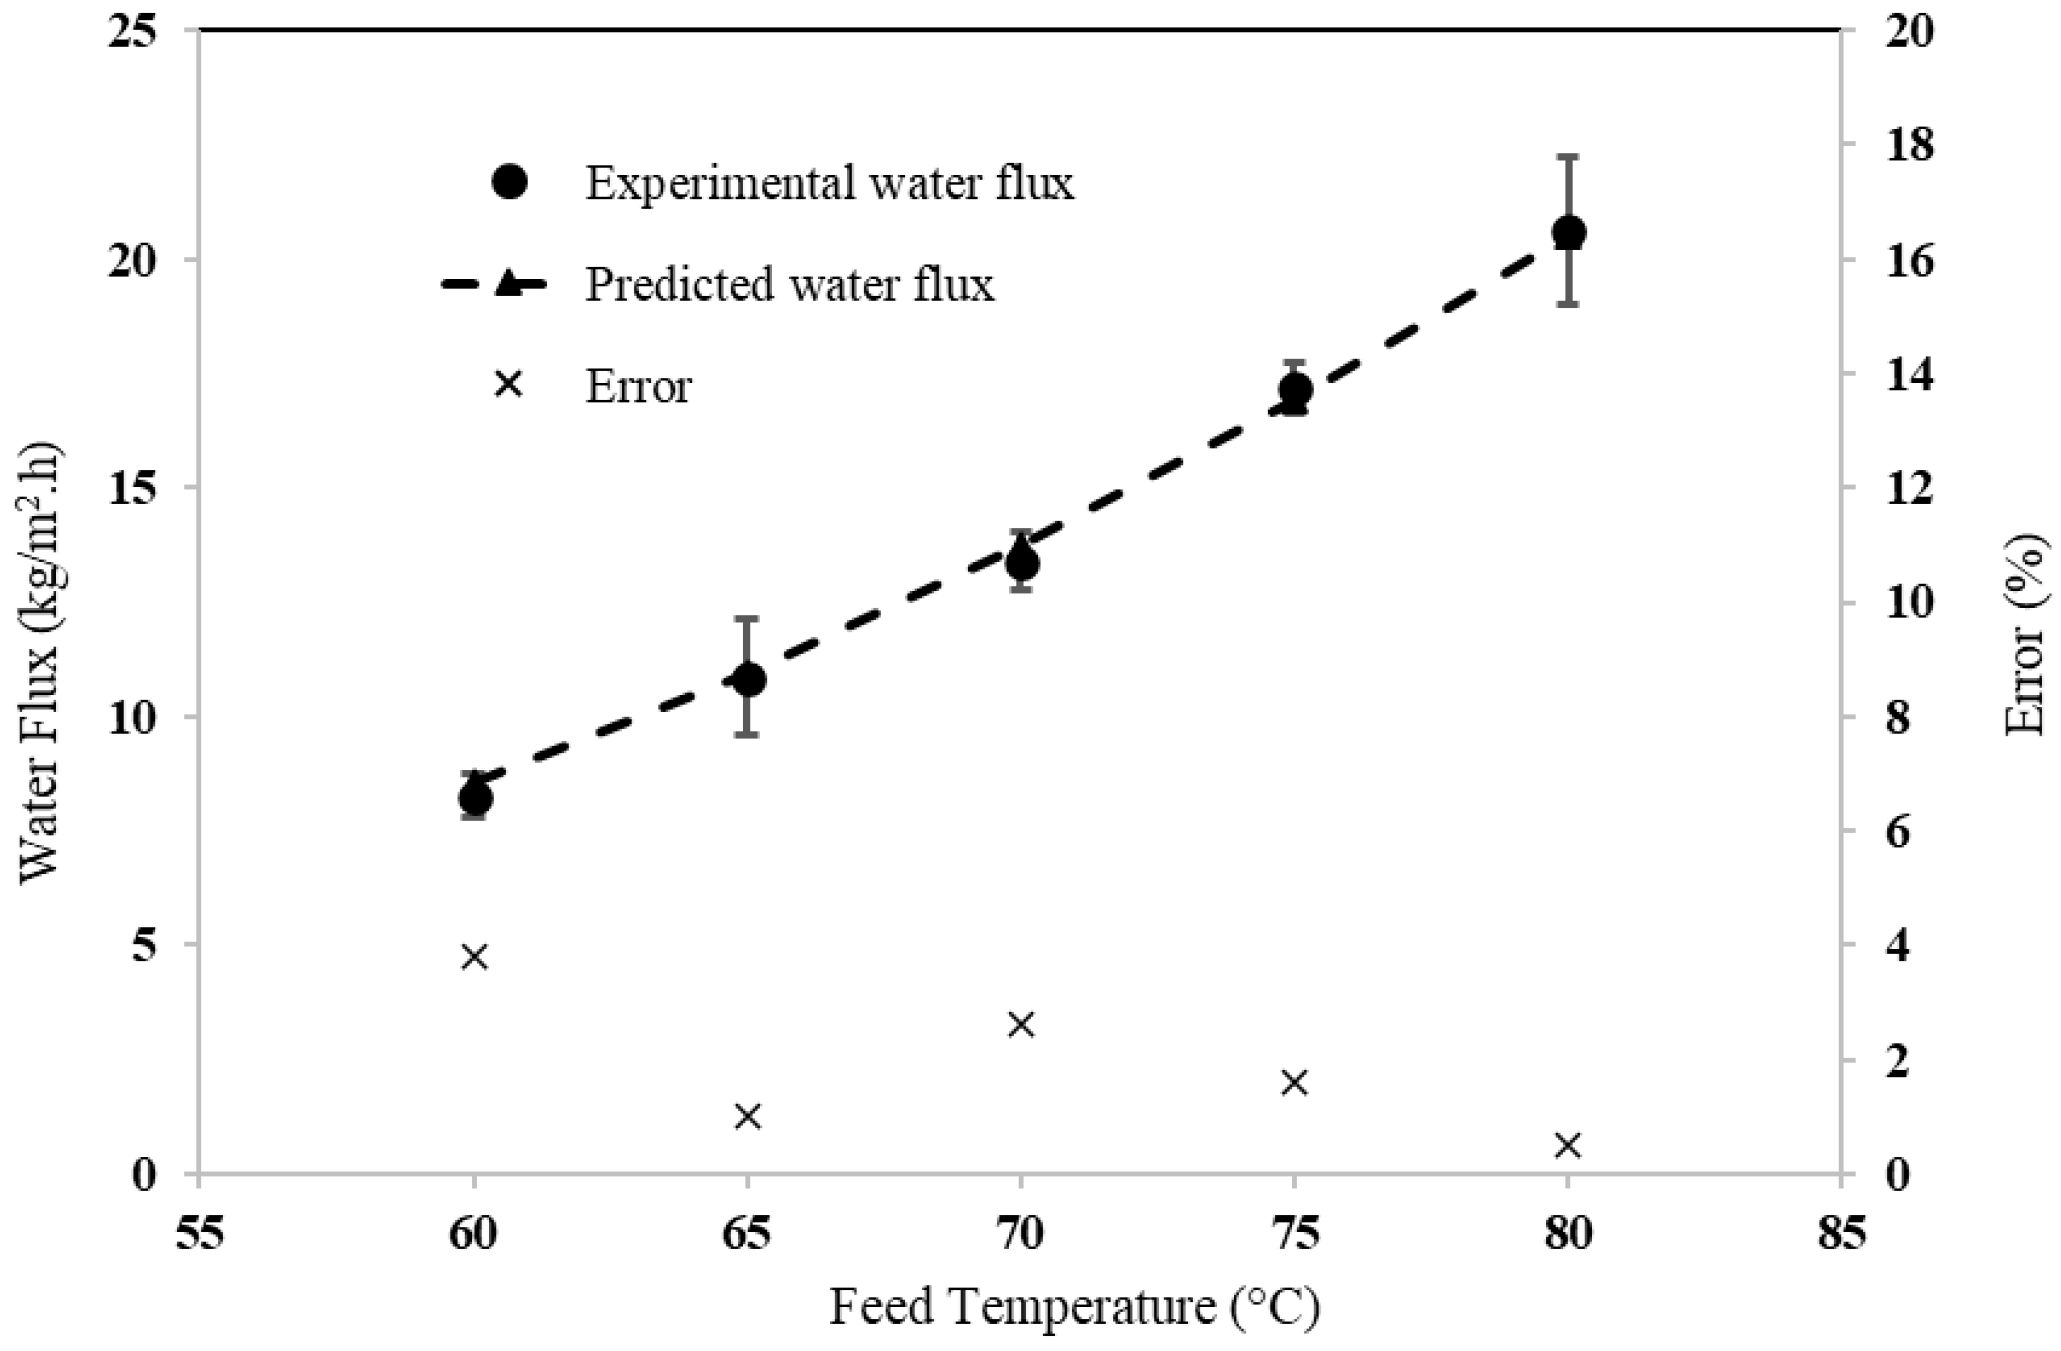
3.1. Model Validation
3.2. Effect of Membrane Characteristics on LEP
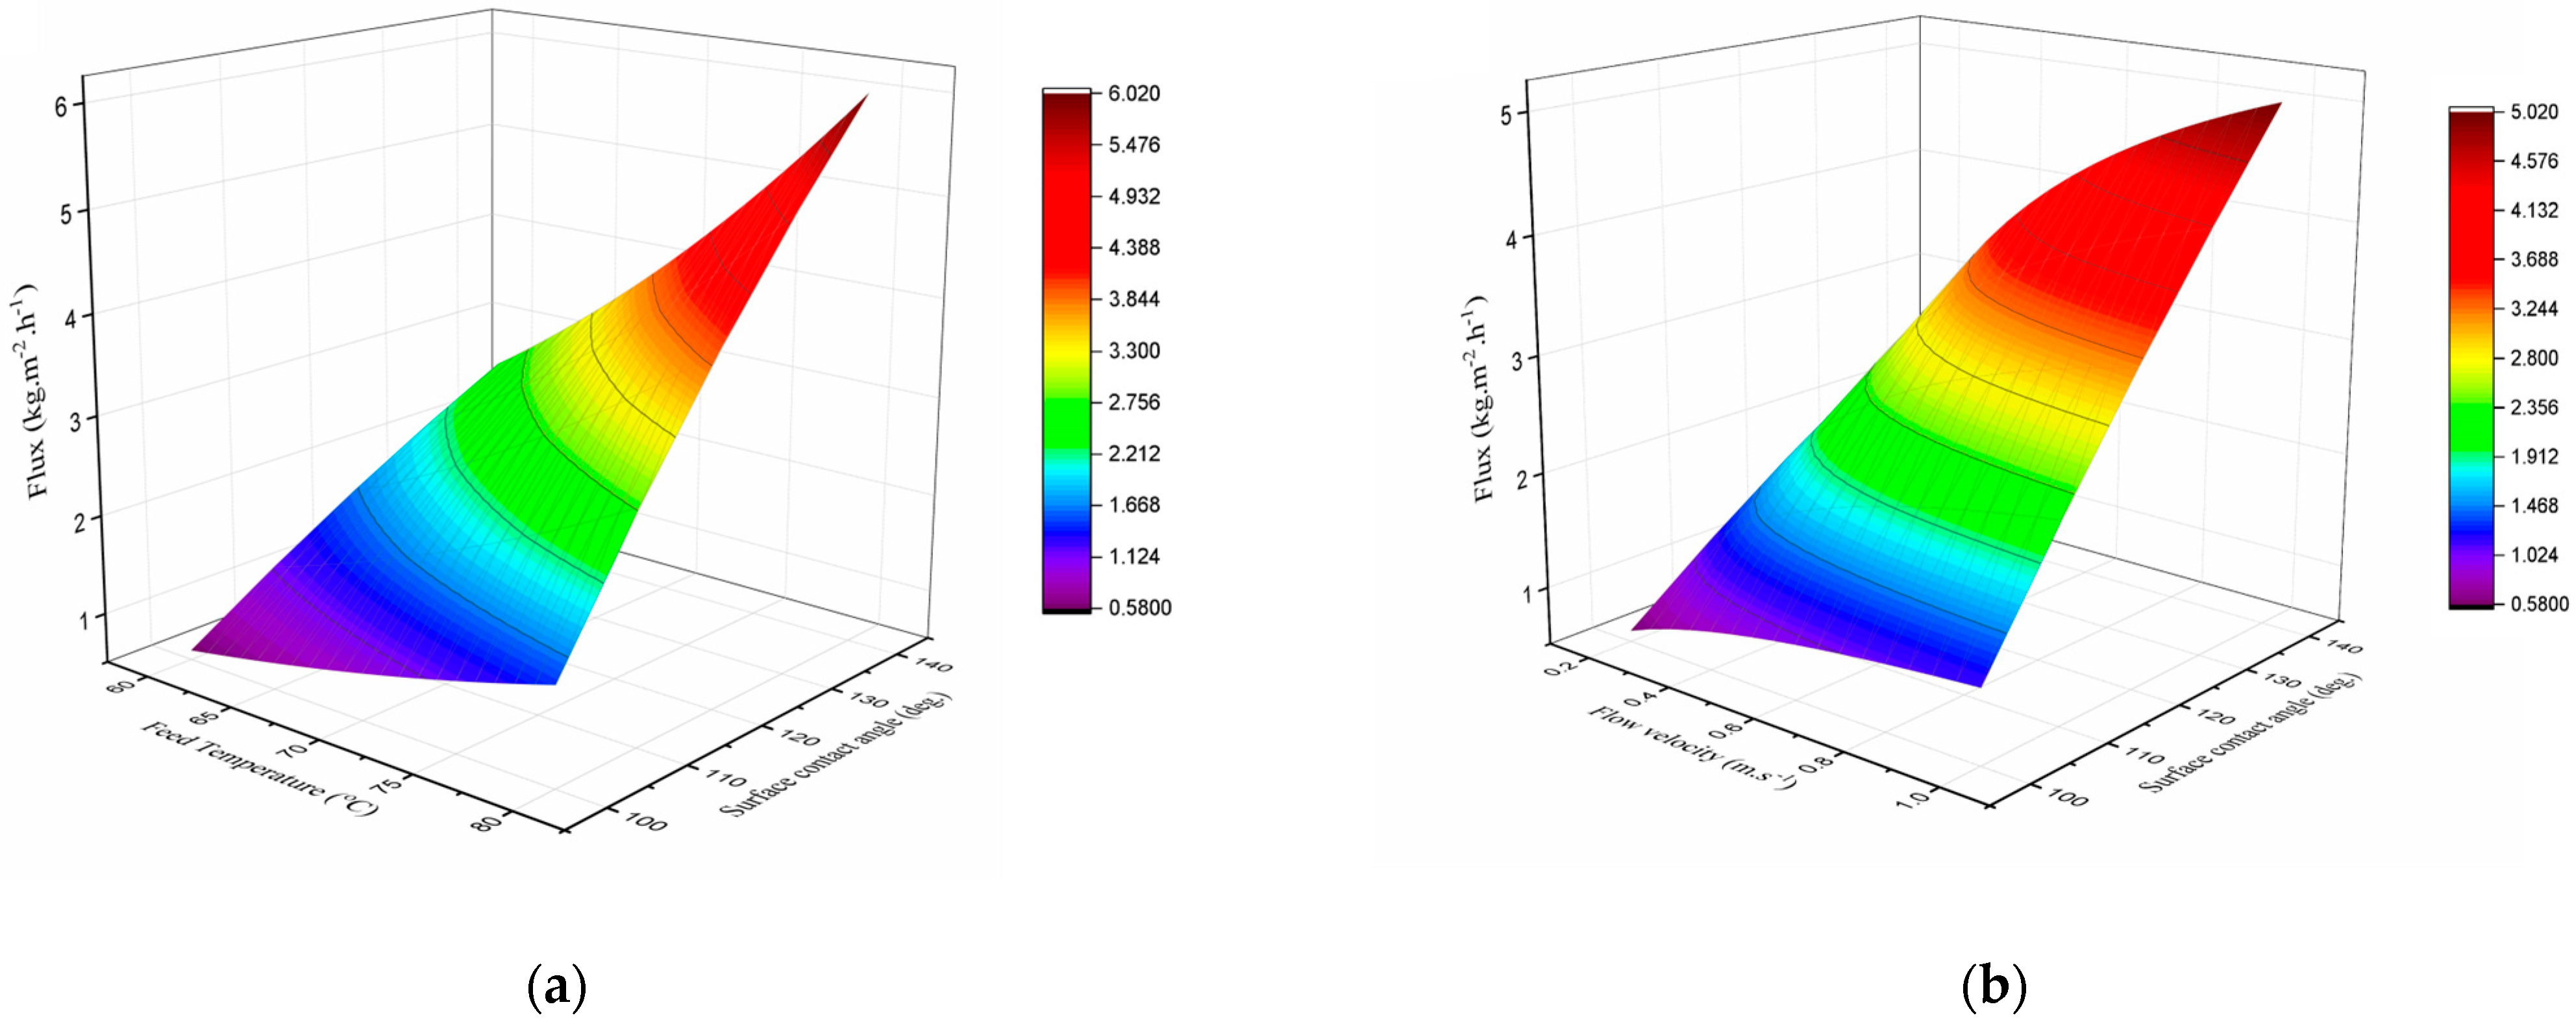
3.3. Effect of Membrane Hydrophobicity on DCMD Flux
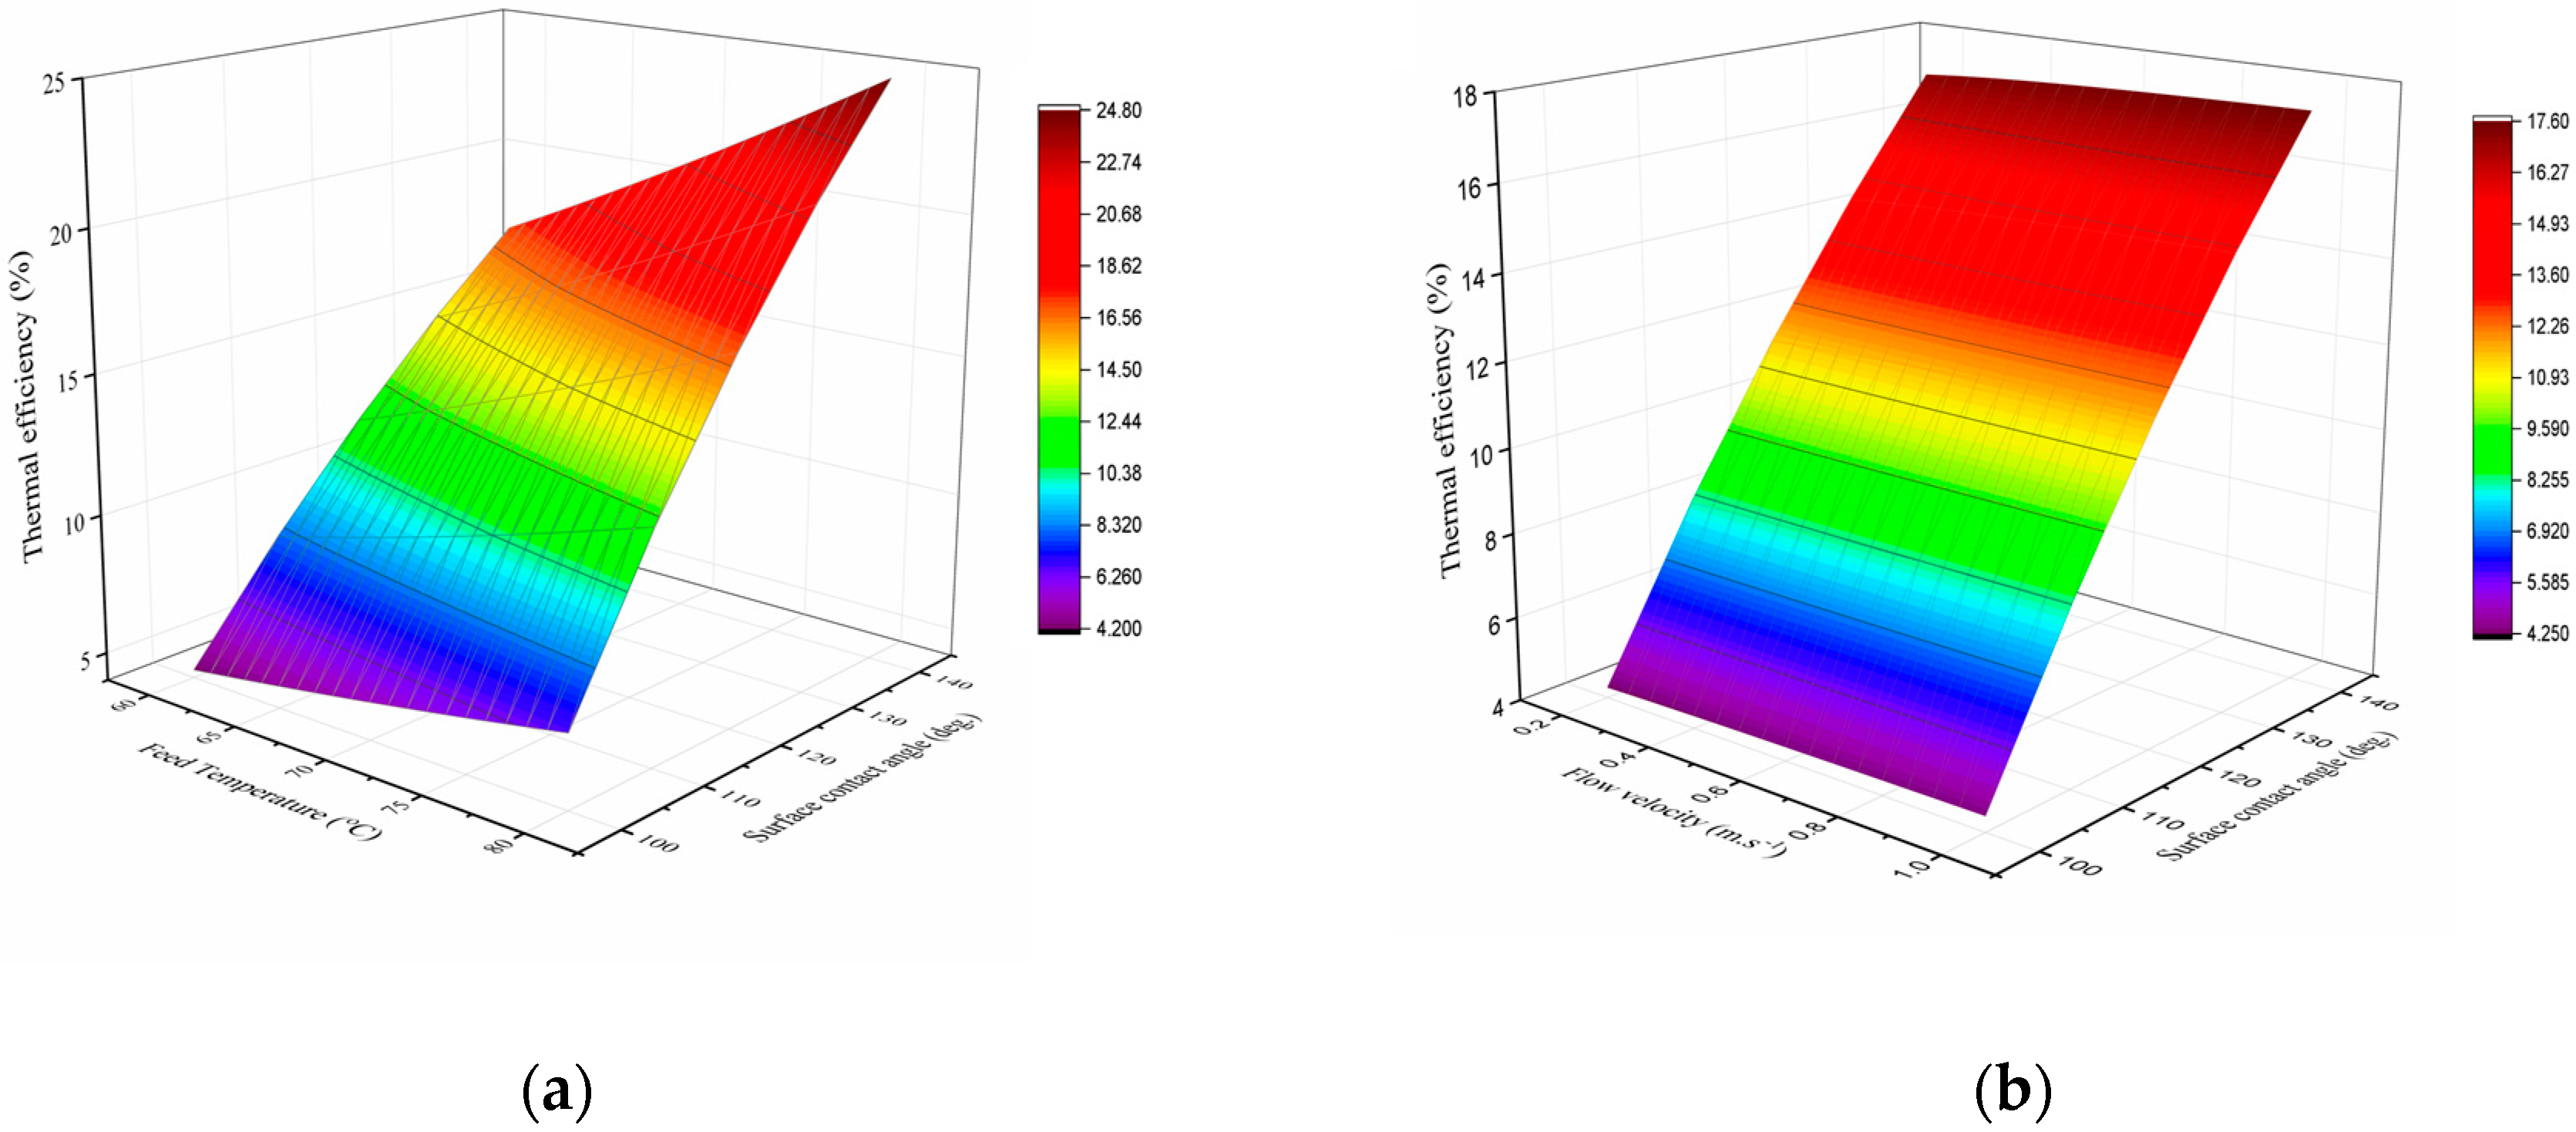
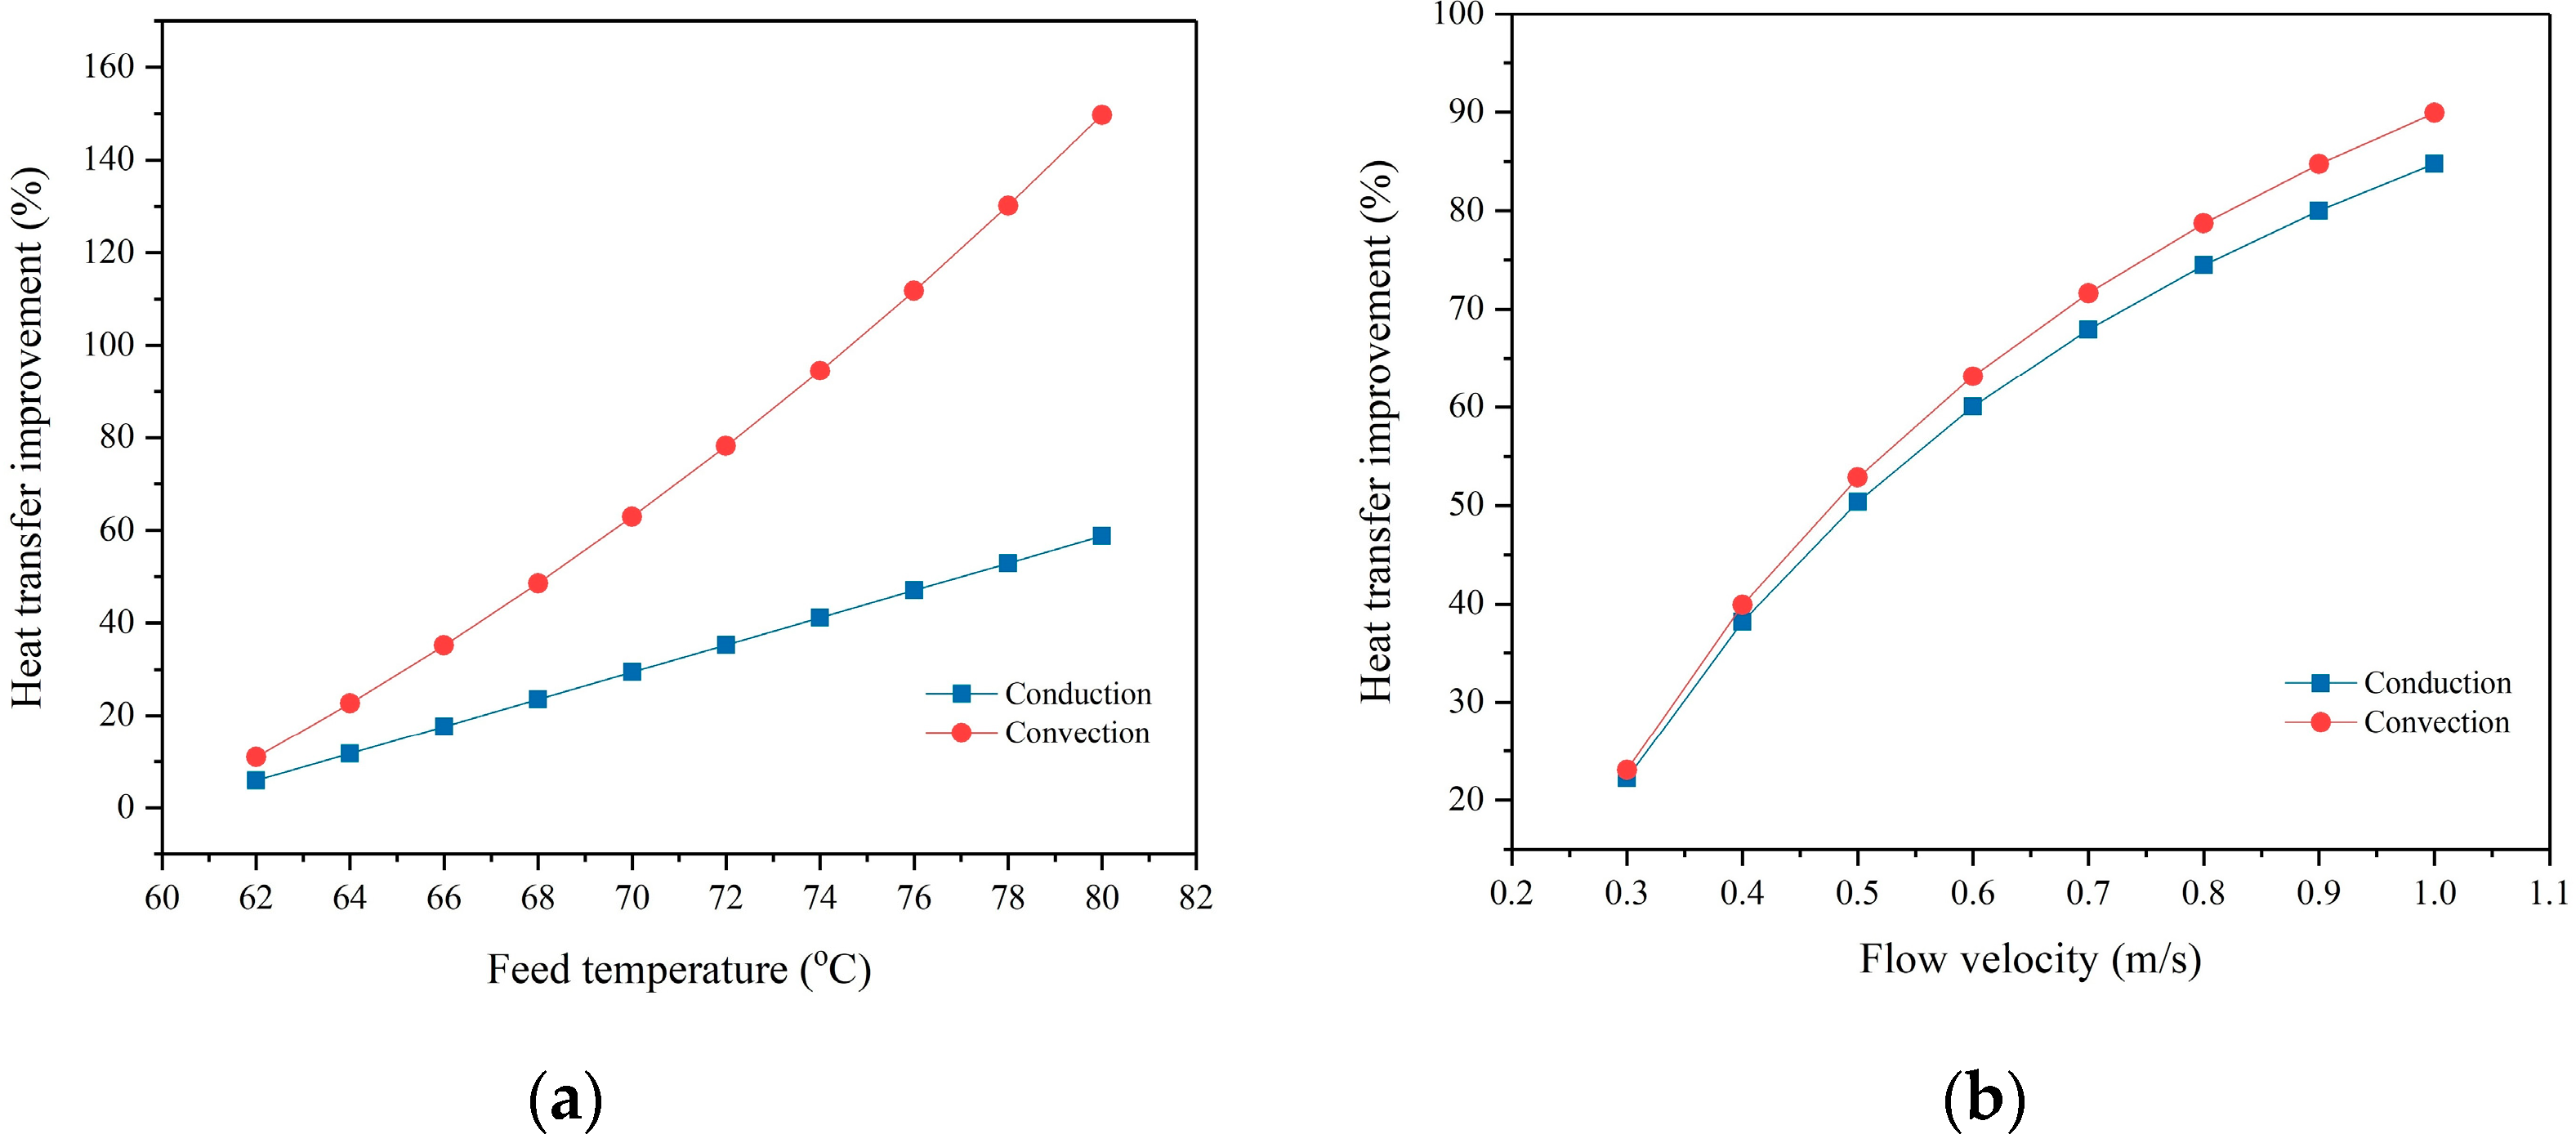
3.4. Effect of Membrane Hydrophobicity on DCMD Thermal Efficiency
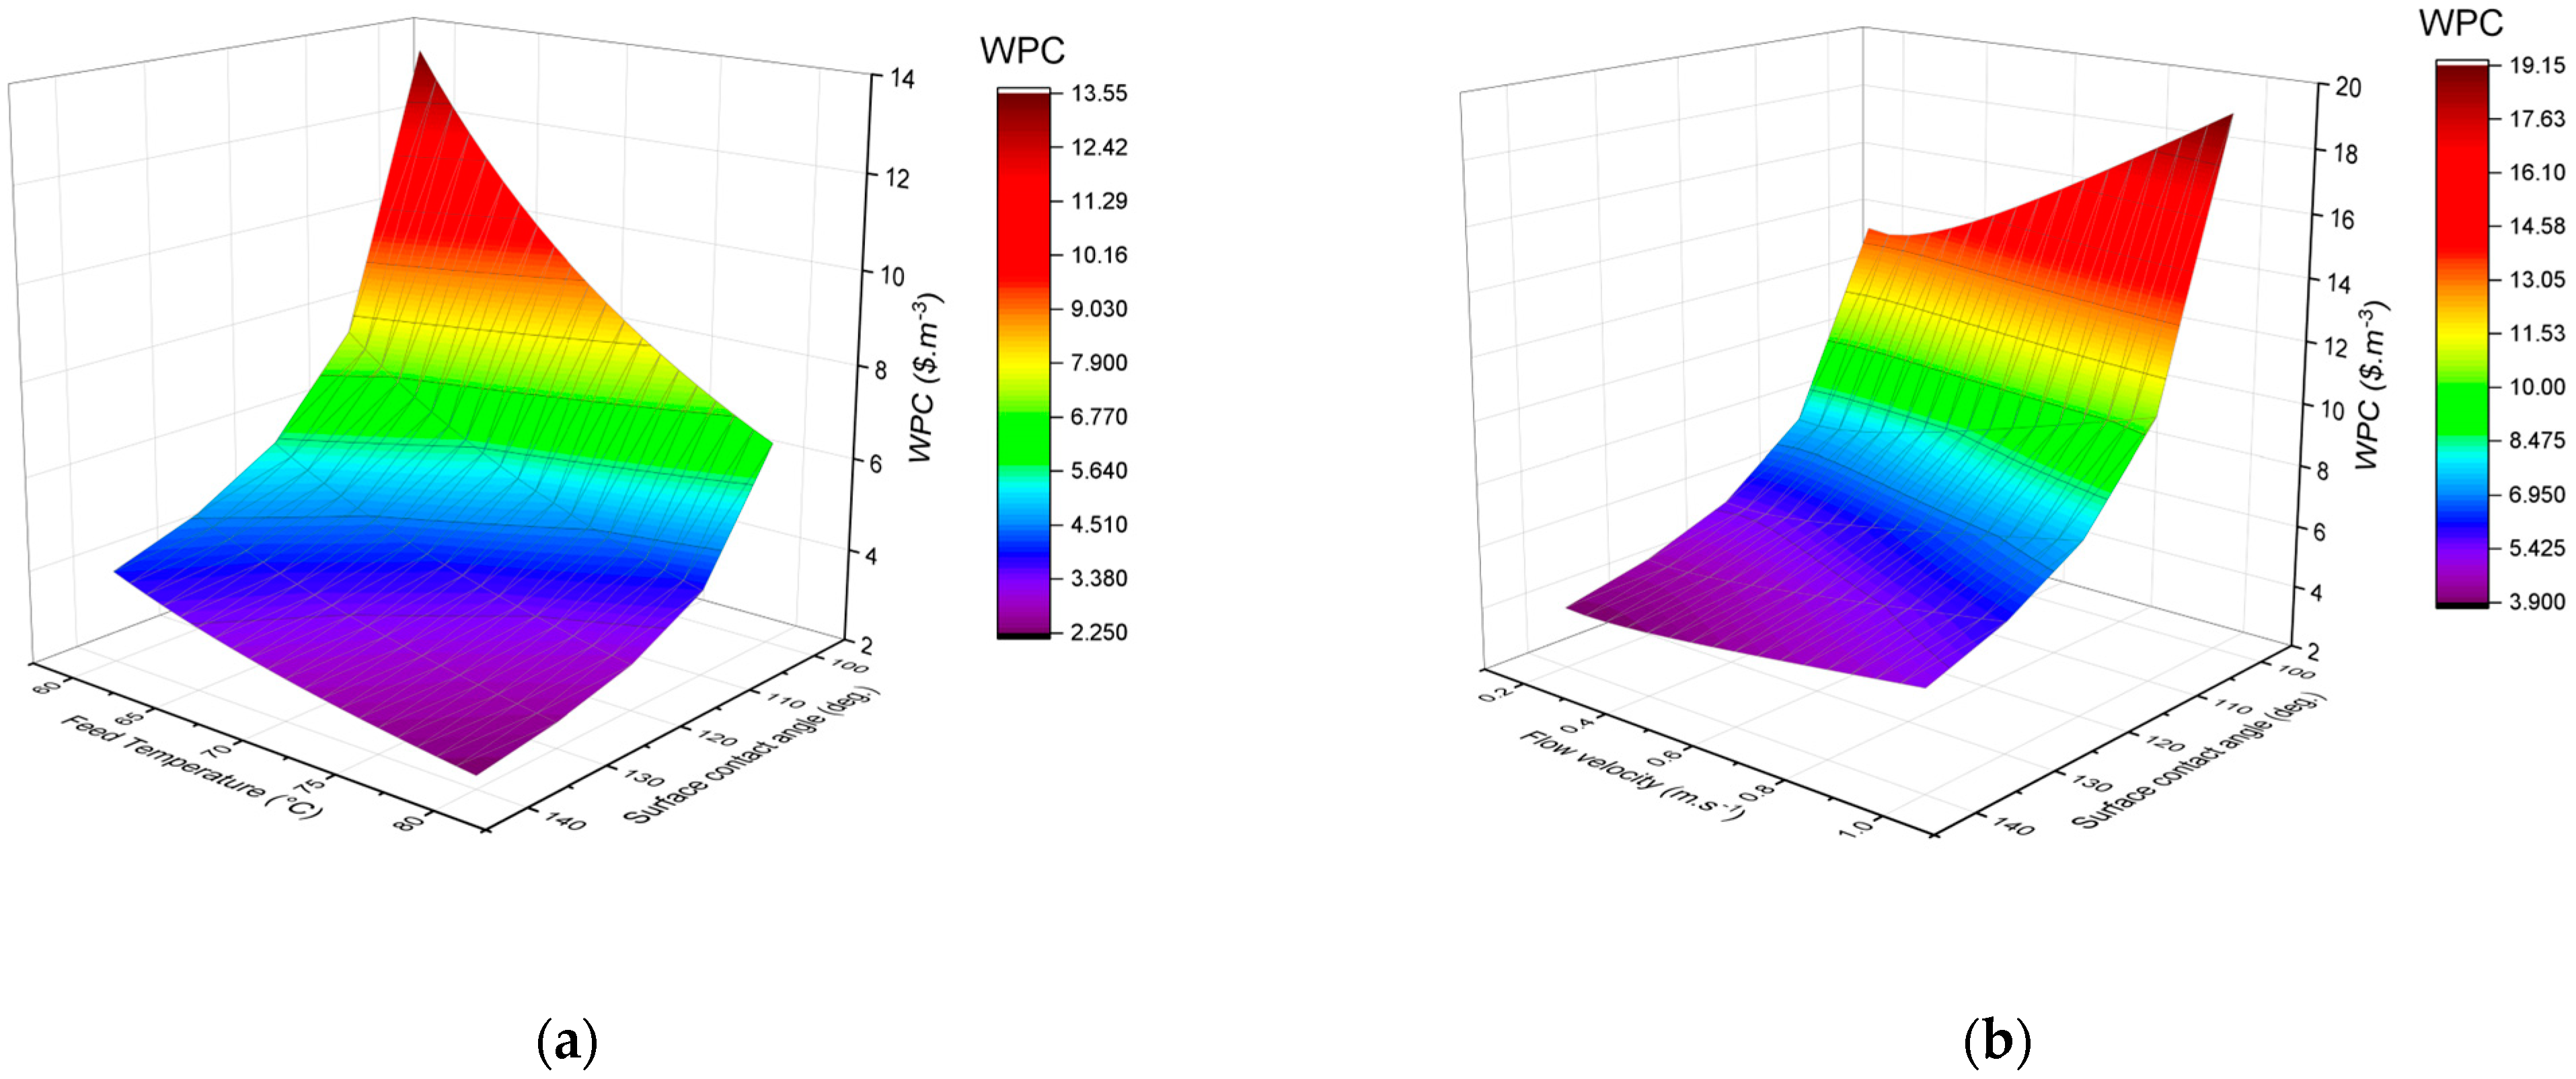
3.5. Effect of Membrane Hydrophobicity on Water Production Cost (WPC)
4. Conclusions
Author Contributions
Funding
Institutional Review Board Statement
Data Availability Statement
Conflicts of Interest
Abbreviations
| A | area [m2] | Greek letters | |
| B | pore geometric coefficient [-] | γ | liquid surface tension [N·m−1] |
| C | membrane distillation coefficient [g·m−2·s−1·Pa−1] | δ | thickness [m] |
| D | diffusivity [m2·s−1] | ΔH | latent heat [J·kg−1] |
| d | diameter [m] | ε | membrane porosity [-] |
| dh | hydraulic diameter [m] | η | efficiency |
| H | flow channel height [m] | θ | contact angle [degree] |
| h | heat transfer coefficient [W·m−2·K−1] | λ | mean free path [m] |
| J | permeate flux [kg·m−2·s−1] | μ | viscosity [N·s·m−2] |
| KB | Boltzmann constant [J·K−1] | ρ | density [kg·m−3] |
| k | thermal conductivity [W·m−1·K−1] | σ | molecular size [m] |
| Kn | Knudsen number [-] | τ | tortuosity of membrane [-] |
| L | flow channel length [m] | Subscripts | |
| LEP | liquid entry pressure [N·m−2] | a | air |
| M | molecular weight [kg·mol−1] | c | contact angle |
| Nu | Nusselt number [-] | D | molecular diffusion |
| mass flow rate [kg·s−1] | f | feed | |
| P | pressure [N·m−2] | g | gas |
| p | vapor pressure [N·m−2] | i | inlet |
| Pr | Prandtl number [-] | k | thermal conductivity [W·m−1·K−1] |
| Q | heat flux [W·m−2] | K | Knudsen diffusion |
| q | volumetric flow rate [m3·s−1] | m | membrane |
| R | gas constant [J·mol−1·K−1] | o | outlet |
| Re | Reynolds number [-] | p | permeate, pore |
| r | pore size [m] | s | salt |
| T | temperature [K] | v | vapor |
| ʋ | velocity [m·s−1] | w | water |
| W | flow channel width [m] | ||
| x | solution concentration [-] | ||
| Acronyms | |||
| CEPCI | Chemical Engineering Plant Cost Index | RO | reverse osmosis |
| DCMD | direct contact membrane distillation | TCC | total capital cost |
| LEP | liquid entry pressure | TPC | temperature polarization coefficient |
| MD | membrane distillation | WPC | water production cost |
References
- Curcio, E.; Drioli, E. Membrane Distillation and Related Operations—A Review. Sep. Purif. Rev. 2005, 34, 35–86. [Google Scholar] [CrossRef]
- Drioli, E.; Ali, A.; Macedonio, F. Membrane operations for process intensification in desalination. Appl. Sci. 2017, 7, 100. [Google Scholar] [CrossRef]
- Ashoor, B.B.; Mansour, S.; Giwa, A.; Dufour, V.; Hasan, S.W. Principles and applications of direct contact membrane distillation (DCMD): A comprehensive review. Desalination 2016, 398, 222–246. [Google Scholar] [CrossRef]
- Al-Obaidani, S.; Curcio, E.; Macedonio, F.; Di Profio, G.; Al-Hinai, H.; Drioli, E. Potential of membrane distillation in seawater desalination: Thermal efficiency, sensitivity study and cost estimation. J. Membr. Sci. 2008, 323, 85–98. [Google Scholar] [CrossRef]
- Dow, N.; Gray, S.; Zhang, J.; Ostarcevic, E.; Liubinas, A.; Atherton, P.; Roeszler, G.; Gibbs, A.; Duke, M. Pilot trial of membrane distillation driven by low grade waste heat: Membrane fouling and energy assessment. Desalination 2016, 391, 30–42. [Google Scholar] [CrossRef]
- Sarbatly, R.; Chiam, C.K. Evaluation of geothermal energy in desalination by vacuum membrane distillation. Appl. Energy 2013, 112, 737–746. [Google Scholar] [CrossRef]
- Banat, F.; Jumah, R.; Garaibeh, M. Exploitation of solar energy collected by solar stills for desalination by membrane distillation. Renew. Energy 2002, 25, 293–305. [Google Scholar] [CrossRef]
- Fath, H.E.S.; Elsherbiny, S.M.; Hassan, A.A.; Rommel, M.; Wieghaus, M.; Koschikowski, J.; Vatansever, M. PV and thermally driven small-scale, stand-alone solar desalination systems with very low maintenance needs1. Desalination 2008, 225, 58–69. [Google Scholar] [CrossRef]
- Chafidz, A.; Al-Zahrani, S.; Al-Otaibi, M.N.; Hoong, C.F.; Lai, T.F.; Prabu, M. Portable and integrated solar-driven desalination system using membrane distillation for arid remote areas in Saudi Arabia. Desalination 2014, 345, 36–49. [Google Scholar] [CrossRef]
- Alkhudhiri, A.; Darwish, N.; Hilal, N. Membrane distillation: A comprehensive review. Desalination 2012, 287, 2–18. [Google Scholar] [CrossRef]
- El-Bourawi, M.S.; Ding, Z.; Ma, R.; Khayet, M. A framework for better understanding membrane distillation separation process. J. Membr. Sci. 2006, 285, 4–29. [Google Scholar] [CrossRef]
- Razmjou, A.; Arifin, E.; Dong, G.; Mansouri, J.; Chen, V. Superhydrophobic modification of TiO2 nanocomposite PVDF membranes for applications in membrane distillation. J. Membr. Sci. 2012, 415, 850–863. [Google Scholar] [CrossRef]
- Zhang, X.; Shi, F.; Niu, J.; Jiang, Y.; Wang, Z. Superhydrophobic surfaces: From structural control to functional application. J. Mater. Chem. 2008, 18, 621–633. [Google Scholar] [CrossRef]
- Camacho, L.M.; Dumée, L.; Zhang, J.; de Li, J.; Duke, M.; Gomez, J.; Gray, S. Advances in membrane distillation for water desalination and purification applications. Water 2013, 5, 94–196. [Google Scholar] [CrossRef]
- Gálvez, J.B.; García-Rodríguez, L.; Martín-Mateos, I. Seawater desalination by an innovative solar-powered membrane distillation system: The MEDESOL project. Desalination 2009, 246, 567–576. [Google Scholar] [CrossRef]
- Chang, H.; Chang, C.; Hung, C.; Cheng, T.; Ho, C. Optimization Study of Small-Scale Solar Membrane Distillation Desalination Systems (s-SMDDS). Int. J. Environ. Res. Public Health 2014, 11, 12064–12087. [Google Scholar] [CrossRef]
- Saffarini, R.B.; Summers, E.K.; Arafat, H.A.; Lienhard, V.J.H. Economic evaluation of stand-alone solar powered membrane distillation systems. Desalination 2012, 299, 55–62. [Google Scholar] [CrossRef]
- Duong, H.C.; Cooper, P.; Nelemans, B.; Cath, T.Y.; Nghiem, L.D. Optimising thermal efficiency of direct contact membrane distillation by brine recycling for small-scale seawater desalination. Desalination 2015, 374, 1–9. [Google Scholar] [CrossRef]
- Saffarini, R.B.; Summers, E.K.; Arafat, H.A.; Lienhard, V.J.H. Technical evaluation of stand-alone solar powered membrane distillation systems. Desalination 2012, 286, 332–341. [Google Scholar] [CrossRef]
- Jantaporn, W.; Ali, A.; Aimar, P. Specific energy requirement of direct contact membrane distillation. Chem. Eng. Res. Des. 2017, 128, 15–26. [Google Scholar] [CrossRef]
- Guillén-Burrieza, E.; Alarcón-Padilla, D.C.; Palenzuela, P.; Zaragoza, G. Techno-economic assessment of a pilot-scale plant for solar desalination based on existing plate and frame MD technology. Desalination 2015, 374, 70–80. [Google Scholar] [CrossRef]
- Martínez, L.; Rodríguez-Maroto, J.M. On transport resistances in direct contact membrane distillation. J. Membr. Sci. 2007, 295, 28–39. [Google Scholar] [CrossRef]
- Phattaranawik, J.; Jiraratananon, R.; Fane, G. Effect of pore size distribution and air flux on mass transport in direct contact membrane distillation. J. Membr. Sci. 2003, 215, 75–85. [Google Scholar] [CrossRef]
- Qtaishat, M.; Matsuura, T.; Kruczek, B.; Khayet, M. Heat and mass transfer analysis in direct contact membrane distillation. Desalination 2008, 219, 272–292. [Google Scholar] [CrossRef]
- Dumée, L.F.; Gray, S.; Duke, M.; Sears, K.; Schütz, J.; Finn, N. The role of membrane surface energy on direct contact membrane distillation performance. Desalination 2013, 323, 22–30. [Google Scholar] [CrossRef]
- Ali, M.I.; Summers, E.K.; Arafat, H.A.; Lienhard, V.J.H. Effects of membrane properties on water production cost in small scale membrane distillation systems. Desalination 2012, 306, 60–71. [Google Scholar] [CrossRef]
- Lawson, K.W.; Lloyd, D.R. Membrane distillation. J. Membr. Sci. 1997, 124, 1–25. [Google Scholar] [CrossRef]
- Lawal, D.U.; Khalifa, A.E. Flux Prediction in Direct Contact Membrane Distillation. Int. J. Mater. Mech. Manuf. 2014, 2, 302–308. [Google Scholar] [CrossRef]
- Phattaranawik, J.; Jiraratananon, R.; Fane, G.; Halim, C. Mass flux enhancement using spacer filled channels in direct contact membrane distillation. J. Membr. Sci. 2001, 187, 193–201. [Google Scholar] [CrossRef]
- Bahmanyar, A.; Asghari, M.; Khoobi, N. Numerical simulation and theoretical study on simultaneously effects of operating parameters in direct contact membrane distillation. Chem. Eng. Process. Process Intensif. 2012, 61, 42–50. [Google Scholar] [CrossRef]
- Martínez-Díez, L.; Vázquez-González, M.I. Temperature and concentration polarization in membrane distillation of aqueous salt solutions. J. Membr. Sci. 1999, 156, 265–273. [Google Scholar] [CrossRef]
- Rabiei, S.; Mousavi, S.M.; Paterson, A.H.J. Development of hierarchical surface roughness on porous poly (vinylidene fluoride) membrane for membrane distillation process. Polym. Eng. Sci. 2020, 60, 1686–1698. [Google Scholar]
- Banat, F.; Jwaied, N. Economic evaluation of desalination by small-scale autonomous solar-powered membrane distillation units. Desalination 2008, 220, 566–573. [Google Scholar] [CrossRef]
- Zuo, G.; Wang, R.; Field, R.; Fane, A.G. Energy efficiency evaluation and economic analyses of direct contact membrane distillation system using Aspen Plus. Desalination 2011, 283, 237–244. [Google Scholar] [CrossRef]
- Tavakkoli, S.; Lokare, O.R.; Vidic, R.D.; Khanna, V. A techno-economic assessment of membrane distillation for treatment of Marcellis shale produced water. Desalination 2017, 416, 24–34. [Google Scholar] [CrossRef]
- Ulrich, G.D. A Guide to Chemical Engineering Process Design and Economics; Wiley: New York, NY, USA, 1984. [Google Scholar]
- Ma, Z.; Hong, Y.; Ma, L.; Su, M. Superhydrophobic Membranes with Ordered Arrays of Nanospiked Microchannels for Water Desalination. Langmuir 2009, 25, 5446–5450. [Google Scholar] [CrossRef] [PubMed]
- Hagedorn, A.; Fieg, G.; Winter, D.; Koschikowski, J.; Grabowski, A.; Mann, T. Membrane and spacer evaluation with respect to future module design in membrane distillation. Desalination 2017, 413, 154–167. [Google Scholar] [CrossRef]
- Al-Karaghouli, A.; Kazmerski, L.L. Energy consumption and water production cost of conventional and renewable-energy-powered desalination processes. Renew. Sustain. Energy Rev. 2013, 24, 343–356. [Google Scholar] [CrossRef]


| Property | Value | Unit |
|---|---|---|
| Membrane | PVDF | - |
| Membrane porosity (ε) | 75% | - |
| Membrane thickness (δ) | 100 | μm |
| Channel dimensions (L × W × H) | 0.5 × 0.5 × 0.004 | m |
| The hydraulic diameter of the channel | 0.008 | m |
| The surface area of a membrane sheet | 0.25 | m2 |
| Number of sheets per module | 5 | |
| Number of modules in series | 5 |
| Item | Value | Unit | Reference |
|---|---|---|---|
| Plant Capacity | 20 | m3product/day | - |
| Plant Lifespan | 20 | years | [4] |
| Plant Availability Factor | 90 | % | [4] |
| Interest Rate | 5 | % | [4] |
| Electricity Cost | 0.07 | $/kWh | [35] |
| DCMD Module Cost | 225 | $/unit | - |
| Membrane Cost | 60 | $/m2 | [35] |
| Membrane Replacement Rate | 20 | %/year | [35] |
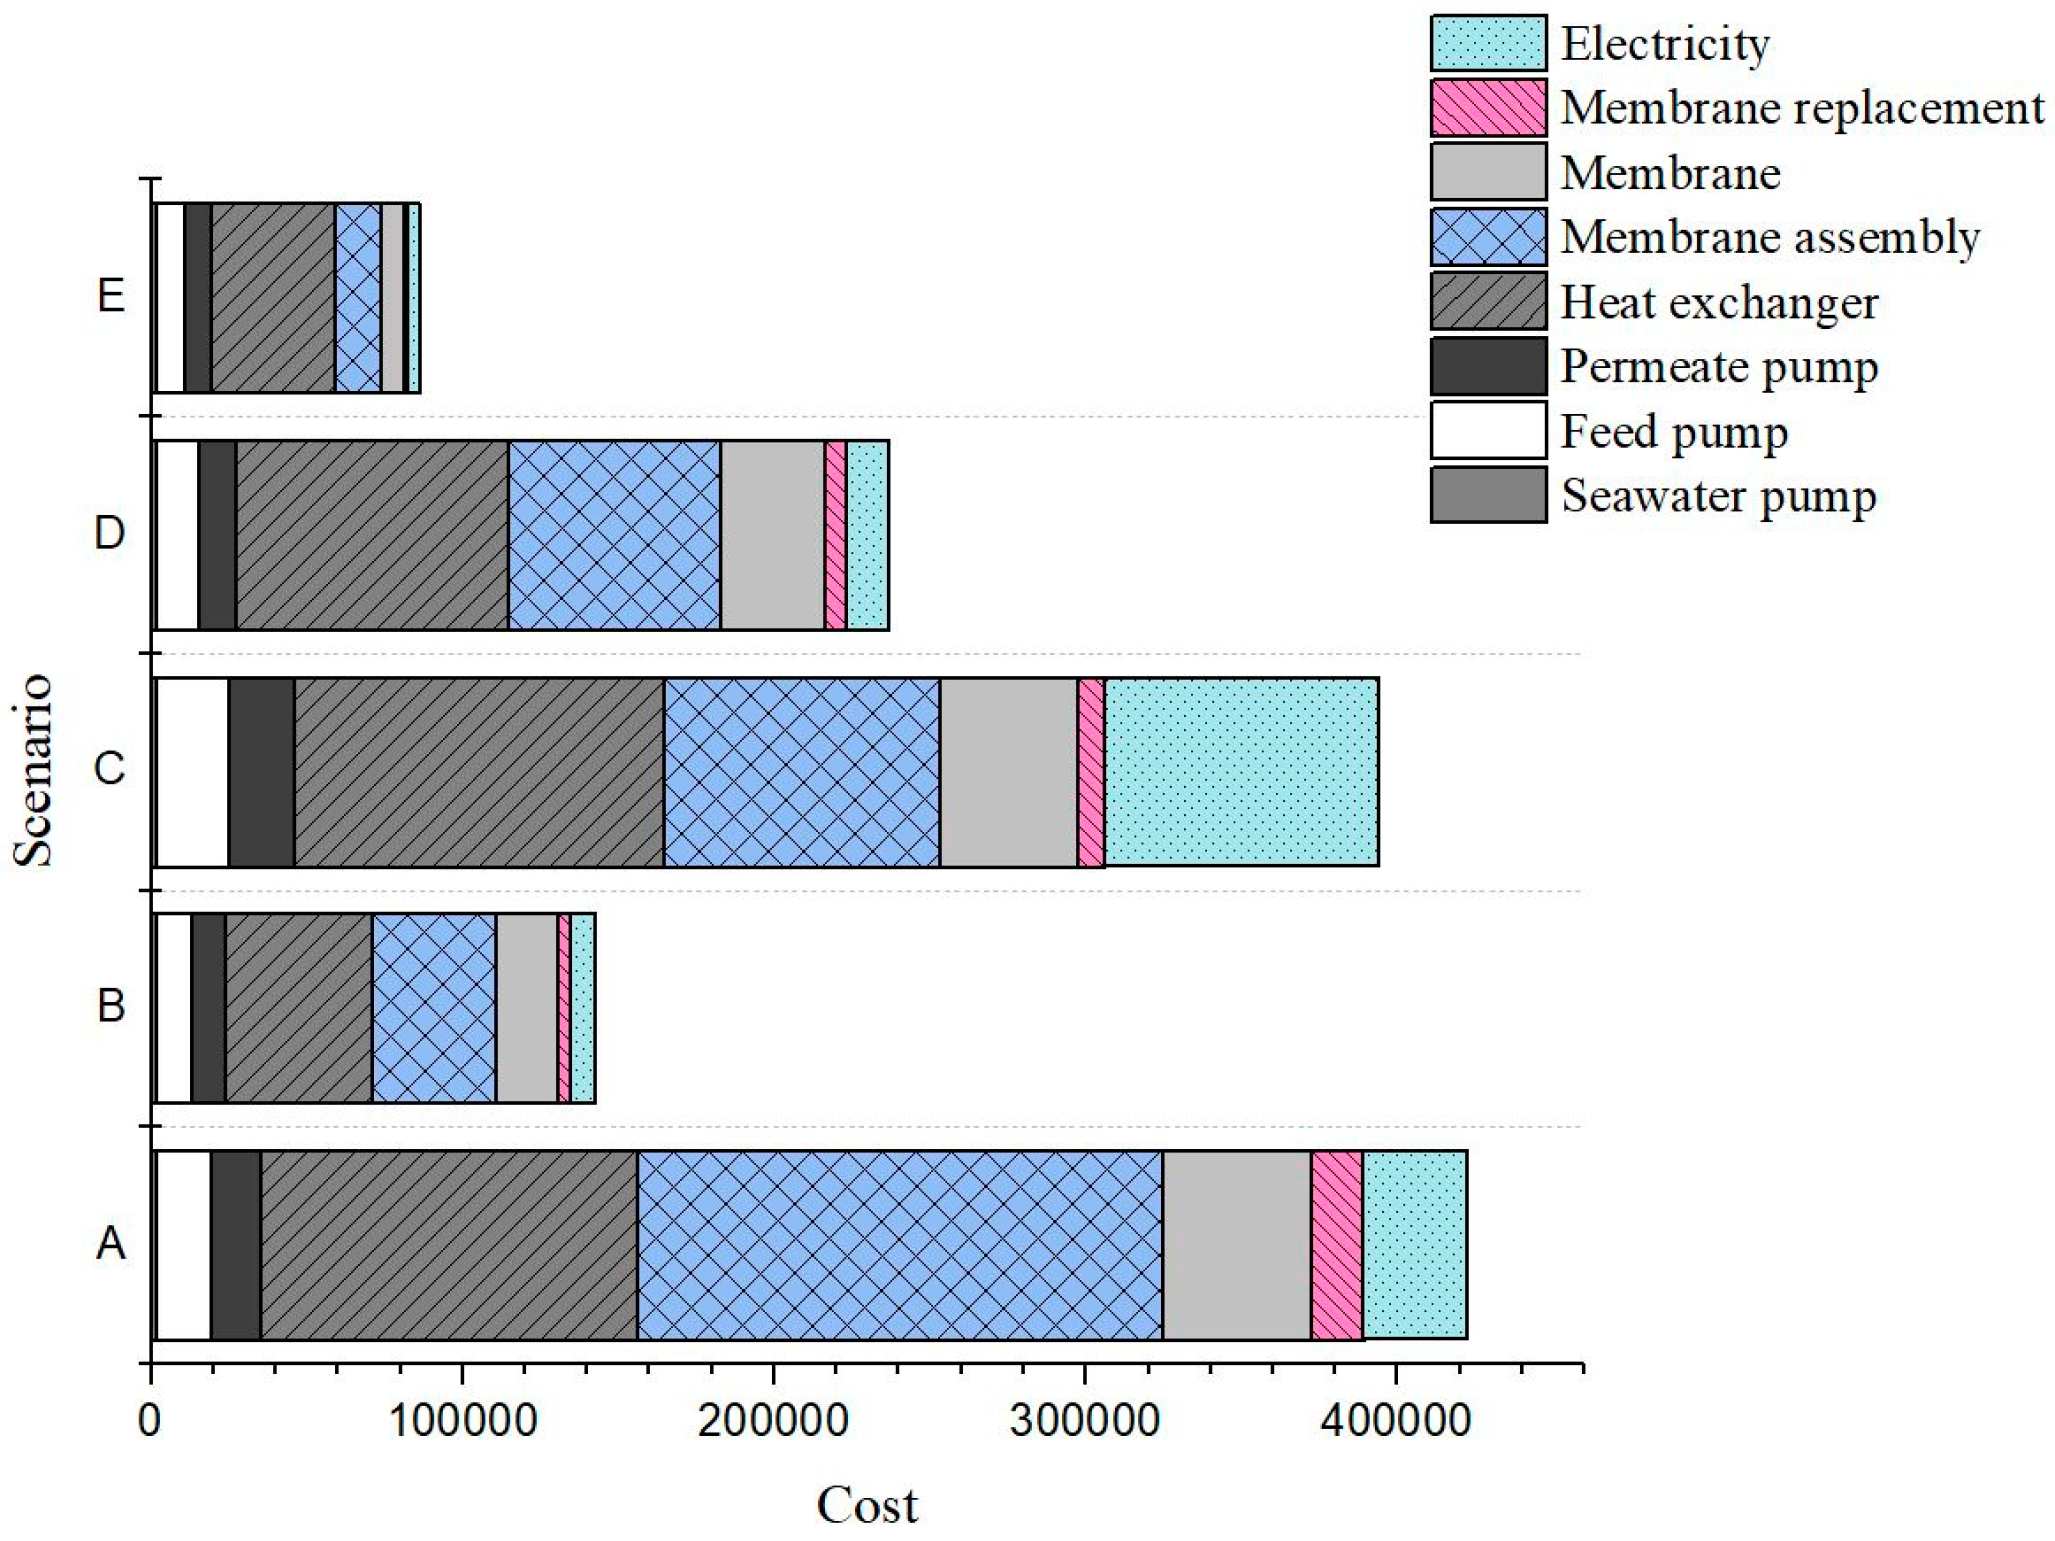
| Cost Items | Tf,in = 60 °C, u = 0.2 m/s, θ = 100° (A) | Tf,in = 60 °C, u = 0.2 m/s, θ = 140° (B) | Tf,in = 60 °C, u = 1 m/s, θ = 100° (C) | Tf,in = 80 °C, u = 0.2 m/s, θ = 100° (D) | Tf,in = 80 °C, u = 0.25 m/s, θ = 140° (E) |
|---|---|---|---|---|---|
| Heat exchanger ($) | 121,254 | 47,214 | 118,697 | 87,348 | 39,770 |
| Feed pump ($) | 17,885 | 11,862 | 23,555 | 13,777 | 9492 |
| Permeate pump ($) | 15,738 | 10,434 | 20,743 | 12,148 | 8361 |
| Seawater pump ($) | 1465 | 1465 | 1465 | 1465 | 1465 |
| Membrane ($) | 84,005 | 19,857 | 44,228 | 33,890 | 7309 |
| Membrane assembly ($) | 168,010 | 39,714 | 88,456 | 67,780 | 14,618 |
| Electricity ($/yr.) | 33,475 | 7924 | 88,058 | 13,439 | 3633 |
| Membrane replacement ($/yr.) | 16,801 | 3971 | 8845 | 6778 | 1462 |
| Annualized capital ($/yr.) | 5.78 | 2.06 | 4.29 | 3.22 | 1.40 |
| Annualized O&M ($/yr.) | 7.72 | 1.88 | 14.82 | 3.15 | 0.85 |
| WPC ($/m3) | 13.51 | 3.95 | 19.12 | 6.37 | 2.25 |
Disclaimer/Publisher’s Note: The statements, opinions and data contained in all publications are solely those of the individual author(s) and contributor(s) and not of MDPI and/or the editor(s). MDPI and/or the editor(s) disclaim responsibility for any injury to people or property resulting from any ideas, methods, instructions or products referred to in the content. |
© 2025 by the authors. Licensee MDPI, Basel, Switzerland. This article is an open access article distributed under the terms and conditions of the Creative Commons Attribution (CC BY) license (https://creativecommons.org/licenses/by/4.0/).
Share and Cite
Rabiei, S.; Paterson, A.H.J. The Effect of Membrane Surface Hydrophobicity on the Performance and Water Production Cost of a Desalination Unit. Membranes 2025, 15, 63. https://doi.org/10.3390/membranes15020063
Rabiei S, Paterson AHJ. The Effect of Membrane Surface Hydrophobicity on the Performance and Water Production Cost of a Desalination Unit. Membranes. 2025; 15(2):63. https://doi.org/10.3390/membranes15020063
Chicago/Turabian StyleRabiei, Sima, and Anthony H. J. Paterson. 2025. "The Effect of Membrane Surface Hydrophobicity on the Performance and Water Production Cost of a Desalination Unit" Membranes 15, no. 2: 63. https://doi.org/10.3390/membranes15020063
APA StyleRabiei, S., & Paterson, A. H. J. (2025). The Effect of Membrane Surface Hydrophobicity on the Performance and Water Production Cost of a Desalination Unit. Membranes, 15(2), 63. https://doi.org/10.3390/membranes15020063