
A Hybrid CFD Platform for Colloidal Fouling Prediction in Electrodialysis


Abstract
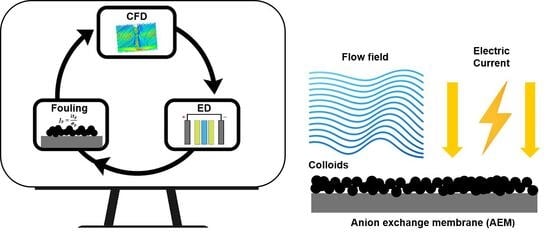
1. Introduction
2. Modelling Approach
2.1. CFD Model
2.1.1. Periodicity and Unit Cell Approach
2.1.2. Numerical Details
2.2. Colloidal Fouling Model
2.3. Coupling CFD and Fouling Models
2.4. Investigated Conditions
2.5. Model Validation
3. Results
3.1. Flow Field and Mass Transport for the Clean Channel
3.2. Fouled Channel
4. Conclusions
Author Contributions
Funding
Data Availability Statement
Conflicts of Interest
Nomenclature
| Membrane surface area in a Unit Cell (m2) | |
| Colloid diameter (m) | |
| C | Molar salt concentration (mol/m3) |
| Molar bulk salt concentration (mol/m3) | |
| Mean molar bulk salt concentration (mol/m3) | |
| C0 | Molar solvent concentration (mol/m3) |
| Colloid concentration (mol/m3) | |
| Molar salt concentration at membrane–solution interface (mol/m3) | |
| Mean molar salt concentration at membrane–solution interface (mol/m3) | |
| D | Salt diffusion coefficient (m2/s) |
| Colloid diffusion coefficient (m2/s) | |
| F | Faraday constant (C/mol) |
| i | Current density (A/m2) |
| Salt flux (mol/m2∙s) | |
| Colloid flux towards membrane (1/m2∙s) | |
| Unit vector of main flow direction | |
| Concentration gradient along the main flow direction (mol/m4) | |
| Pressure gradient along the main flow direction (N/m3) | |
| Number of APAM colloids attached to the membrane (–) | |
| p | Pressure (Pa) |
| R | Universal gas constant (J/mol∙K) |
| T | Temperature (K) |
| Transport number (–) | |
| Colloid transport number (–) | |
| u | Velocity vector (m/s) |
| Solvent velocity vector (m/s) | |
| Velocity along main direction (m/s) | |
| Mean velocity along main direction (m/s) | |
| z | Valence number (–) |
| Colloid dimensionless charge (–) | |
| Greek | |
| α | Growth efficiency (–) |
| β | Attachment probability (–) |
| Colloid electrophoretic mobility (m2/s∙V) | |
| Δp | Pressure losses (Pa) |
| Vacuum permittivity (F/m) | |
| Relative permittivity of water (–) | |
| Zeta potential (V) | |
| Dynamic viscosity of solution (Pa∙s) | |
| θ | Polarization coefficient |
| Boltzmann constant (J/K) | |
| Density (kg/m3) | |
| Colloid charge (C) | |
| τ | Wall shear stress (Pa) |
| φ | Specific fouling resistance (Ω/fouling fraction) |
| Abbreviations | |
| APAM | Anion polyacrylamide |
| AEM | Anion-exchange membrane |
| CEM | Cation-exchange membrane |
| IEM | Ion-exchange membrane |
| ED | Electrodialysis |
Appendix A
Appendix A.1. Model Calibration


Appendix A.2. Grid-Dependence Study

References
- Buonomenna, M.G. Membrane processes for a sustainable industrial growth. RSC Adv. 2013, 3, 5694–5740. [Google Scholar] [CrossRef]
- He, X. A review of material development in the field of carbon capture and the application of membrane-based processes in power plants and energy-intensive industries. Energy. Sustain. Soc. 2018, 8, 34. [Google Scholar] [CrossRef]
- Campione, A.; Gurreri, L.; Ciofalo, M.; Micale, G.; Tamburini, A.; Cipollina, A. Electrodialysis for water desalination: A critical assessment of recent developments on process fundamentals, models and applications. Desalination 2018, 434, 121–160. [Google Scholar] [CrossRef]
- Sonin, A.A.; Probstein, R.F. A hydrodynamic theory of desalination by electrodialysis. Desalination 1968, 5, 293–329. [Google Scholar] [CrossRef]
- Adhikary, S.K.; Narayanan, P.K.; Thampy, S.K.; Dave, N.J.; Chauhan, D.K.; Indusekhar, V.K. Desalination of brackish water of higher salinity by electrodialysis. Desalination 1991, 84, 189–200. [Google Scholar] [CrossRef]
- Tsiakis, P.; Papageorgiou, L.G. Optimal design of an electrodialysis brackish water desalination plant. Desalination 2005, 173, 173–186. [Google Scholar] [CrossRef]
- Fidaleo, M.; Moresi, M. Electrodialysis Applications in The Food Industry. Adv. Food Nutr. Res. 2006, 51, 265–360. [Google Scholar] [CrossRef]
- Luiz, A.; McClure, D.D.; Lim, K.; Leslie, G.; Coster, H.G.L.; Barton, G.W.; Kavanagh, J.M. Potential upgrading of bio-refinery streams by electrodialysis. Desalination 2017, 415, 20–28. [Google Scholar] [CrossRef]
- Tang, H.; Wang, X.; Zhao, X.; Dong, Y.; Xu, B.; Wang, L. Ion migration characteristics during the bipolar membrane electrodialysis treatment of concentrated reverse osmosis brine. Desalination 2023, 561, 116660. [Google Scholar] [CrossRef]
- Ding, R.; Ding, Z.; Chen, X.; Fu, J.; Zhou, Z.; Chen, X.; Zheng, X.; Jin, Y.; Chen, R. Integration of electrodialysis and Donnan dialysis for the selective separation of ammonium from high-salinity wastewater. Chem. Eng. J. 2021, 405, 127001. [Google Scholar] [CrossRef]
- Proskynitopoulou, V.; Vourros, A.; Garagounis, I.; Dimopoulos Toursidis, P.; Lorentzou, S.; Zouboulis, A.; Panopoulos, K. Enhancing nutrient and water recovery from liquid digestate: A comparative study of selective electrodialysis and conventional treatment methods. J. Environ. Chem. Eng. 2024, 12, 112675. [Google Scholar] [CrossRef]
- Gurreri, L.; Tamburini, A.; Cipollina, A.; Micale, G. Electrodialysis applications in wastewater treatment for environmental protection and resources recovery: A systematic review on progress and perspectives. Membranes 2020, 10, 146. [Google Scholar] [CrossRef] [PubMed]
- Tedesco, M.; Hamelers, H.V.M.; Biesheuvel, P.M. Nernst-Planck transport theory for (reverse) electrodialysis: I. Effect of co-ion transport through the membranes channel. J. Memb. Sci. 2016, 510, 370–381. [Google Scholar] [CrossRef]
- Strathmann, H. Ion-Exchange Membrane Separation Processes; Elsevier: Amsterdam, The Netherlands, 2004; ISBN 978-0-444-50236-0. Available online: https://www.elsevier.com/books/ion-exchange-membrane-separation-processes/strathmann/978-0-444-50236-0 (accessed on 2 September 2025).
- Apel, P.Y.; Velizarov, S.; Volkov, A.V.; Eliseeva, T.V.; Nikonenko, V.V.; Parshina, A.V. Fouling and Membrane Degradation in Electromembrane and Baromembrane Processes. Membr. Membr. Technol. 2022, 4, 69–92. [Google Scholar] [CrossRef]
- Mikhaylin, S.; Bazinet, L. Fouling on ion-exchange membranes: Classi fi cation, characterization and strategies of prevention and control. Adv. Colloid Interface Sci. 2016, 229, 34–56. [Google Scholar] [CrossRef]
- Vermaas, D.A.; Kunteng, D.; Saakes, M.; Nijmeijer, K. Fouling in reverse electrodialysis under natural conditions. Water Res. 2012, 47, 1289–1298. [Google Scholar] [CrossRef]
- Zhao, Z.; Shi, S.; Cao, H.; Shan, B.; Sheng, Y. Property characterization and mechanism analysis on organic fouling of structurally di ff erent anion exchange membranes in electrodialysis. Desalination 2018, 428, 199–206. [Google Scholar] [CrossRef]
- Han, S.-J.; Park, J.-S. Understanding Membrane Fouling in Electrically Driven Energy Conversion Devices. Energies 2021, 14, 212. [Google Scholar] [CrossRef]
- Grossman, G.; Sonin, A.A. Membrane fouling in electrodialysis: A model and experiments. Desalination 1973, 12, 107–125. [Google Scholar] [CrossRef]
- Korngold, E.; de Körösy, F.; Rahav, R.; Taboch, M.F. Fouling of anionselective membranes in electrodialysis. Desalination 1970, 8, 195–220. [Google Scholar] [CrossRef]
- Sosa-fernandez, P.A.; Miedema, S.J.; Bruning, H.; Leermakers, F.A.M.; Post, J.W.; Rijnaarts, H.H.M. Effects of feed composition on the fouling on cation-exchange membranes desalinating polymer-flooding produced water. J. Colloid Interface Sci. 2021, 584, 634–646. [Google Scholar] [CrossRef]
- Voutetaki, A.; Gkouletsos, D.; Papadopoulos, A.I.; Seferlis, P.; Plakas, K.; Bollas, D.; Parcharidis, S. Efficient modeling of electrodialysis process for waste water treatment through systematic parameter estimation. Chem. Eng. Trans. 2020, 81, 841–846. [Google Scholar] [CrossRef]
- Nikonenko, V.; Urtenov, M.; Mareev, S.; Pourcelly, G. Mathematical modeling of the effect of water splitting on ion transfer in the depleted diffusion layer near an ion-exchange membrane. Membranes 2020, 10, 22. [Google Scholar] [CrossRef] [PubMed]
- Zourmand, Z.; Faridirad, F.; Kasiri, N.; Mohammadi, T. Mass transfer modeling of desalination through an electrodialysis cell. Desalination 2015, 359, 41–51. [Google Scholar] [CrossRef]
- Uzdenova, A. 2D mathematical modelling of overlimiting transfer enhanced by electroconvection in flow-through electrodialysis membrane cells in galvanodynamic mode. Membranes 2019, 9, 39. [Google Scholar] [CrossRef]
- Battaglia, G.; Gurreri, L.; Ciofalo, M.; Cipollina, A.; Bogle, I.D.L.; Pirrotta, A.; Micale, G. A 2-D model of electrodialysis stacks including the effects of membrane deformation. Desalination 2021, 500, 114835. [Google Scholar] [CrossRef]
- Battaglia, G.; Gurreri, L.; Farulla, G.A.; Cipollina, A.; Pirrotta, A.; Micale, G.; Ciofalo, M. Pressure-induced deformation of pillar-type profiled membranes and its effects on flow and mass transfer. Computation 2019, 7, 32. [Google Scholar] [CrossRef]
- Gurreri, L.; Tamburini, A.; Cipollina, A.; Micale, G.; Ciofalo, M. CFD prediction of concentration polarization phenomena in spacer- fi lled channels for reverse electrodialysis. J. Memb. Sci. 2014, 468, 133–148. [Google Scholar] [CrossRef]
- Kovář, P.; Smoleň, M.; Pagáč, J.; Kincl, M.; Slouka, Z. Experimental 3D concentration profiles along an electrodialysis channel reveal a strong effect of natural convection. Desalination 2023, 548, 116302. [Google Scholar] [CrossRef]
- Battaglia, G.; Gurreri, L.; Airòfarulla, G.; Cipollina, A.; Pirrotta, A.; Micale, G.; Ciofalo, M. Membrane deformation and its effects on flow and mass transfer in the electromembrane processes. Int. J. Mol. Sci. 2019, 20, 1840. [Google Scholar] [CrossRef]
- Fricker, M.B.; Kutscher, D.; Aeschlimann, B.; Frommer, J.; Dietiker, R.; Bettmer, J.; Günther, D. High spatial resolution trace element analysis by LA-ICP-MS using a novel ablation cell for multiple or large samples. Int. J. Mass Spectrom. 2011, 307, 39–45. [Google Scholar] [CrossRef]
- Jen, C.P.; Weng, C.H.; Huang, C. Te Three-dimensional focusing of particles using negative dielectrophoretic force in a microfluidic chip with insulating microstructures and dual planar microelectrodes. Electrophoresis 2011, 32, 2428–2435. [Google Scholar] [CrossRef]
- Peng, J.; Lee, S.J. Numerical simulation of proton exchange membrane fuel cells at high operating temperature. J. Power Sources 2006, 162, 1182–1191. [Google Scholar] [CrossRef]
- Yan, Y.Y. Recent Advances in Computational Simulation of Macro-, Meso-, and Micro-Scale Biomimetics Related Fluid Flow Problems. J. Bionic Eng. 2007, 4, 97–107. [Google Scholar] [CrossRef]
- Kjeang, E.; Goldak, J.; Golriz, M.R.; Gu, J.; James, D.; Kordesch, K. Modeling methanol crossover by diffusion and electro-osmosis in a flowing electrolyte direct methanol fuel cell. Fuel Cells 2005, 5, 486–498. [Google Scholar] [CrossRef]
- Liu, J.; Wang, Z.; Tang, C.Y.; Leckie, J.O. Modeling Dynamics of Colloidal Fouling of RO/NF Membranes with A Novel Collision-Attachment Approach. Environ. Sci. Technol. 2018, 52, 1471–1478. [Google Scholar] [CrossRef]
- Liu, J.; Fan, Y.; Sun, Y.; Wang, Z.; Zhao, D.; Li, T.; Dong, B.; Tang, C.Y. Modelling the critical roles of zeta potential and contact angle on colloidal fouling with a coupled XDLVO-collision attachment approach. J. Memb. Sci. 2021, 623, 119048. [Google Scholar] [CrossRef]
- Wang, H.; Wu, J.; Fu, P.; Qu, Z.; Zhao, W.; Song, Y. CFD-DEM Study of Bridging Mechanism of Particles in Ceramic Membrane Pores under Surface Filtration Conditions. Processes 2022, 10, 475. [Google Scholar] [CrossRef]
- Lohaus, J.; Perez, Y.M.; Wessling, M. What are the microscopic events of colloidal membrane fouling? J. Memb. Sci. 2018, 553, 90–98. [Google Scholar] [CrossRef]
- De Jaegher, B.; Larumbe, E.; De Schepper, W.; Verliefde, A.; Nopens, I. Colloidal fouling in electrodialysis: A neural differential equations model. Sep. Purif. Technol. 2020, 249, 116939. [Google Scholar] [CrossRef]
- De Jaegher, B.; De Schepper, W.; Verliefde, A.; Nopens, I. Enhancing mechanistic models with neural differential equations to predict electrodialysis fouling. Sep. Purif. Technol. 2021, 259, 118028. [Google Scholar] [CrossRef]
- Guo, H.; Xiao, L.; Yu, S.; Yang, H.; Hu, J.; Liu, G.; Tang, Y. Analysis of anion exchange membrane fouling mechanism caused by anion polyacrylamide in electrodialysis. Desalination 2014, 346, 46–53. [Google Scholar] [CrossRef]
- Newman, J.; Balsara, N.P. Electrochemical Systems; John Wiley & Sons: Hoboken, NJ, USA, 2021. [Google Scholar]
- La Cerva, M.L.; Di Liberto, M.; Gurreri, L.; Tamburini, A.; Cipollina, A.; Micale, G.; Ciofalo, M. Coupling CFD with a one-dimensional model to predict the performance of reverse electrodialysis stacks. J. Memb. Sci. 2017, 541, 595–610. [Google Scholar] [CrossRef]
- Gurreri, L.; Tamburini, A.; Cipollina, A.; Micale, G.; Ciofalo, M. Flow and mass transfer in spacer-filled channels for reverse electrodialysis: A CFD parametrical study. J. Memb. Sci. 2016, 497, 300–317. [Google Scholar] [CrossRef]
- Ciofalo, M.; Stasiek, J.; Collins, M.W. Investigation corrugated of flow and heat transfer Numerical simulations. Int. J. Heat Mass Transf. 1996, 39, 165–192. [Google Scholar] [CrossRef]
- Li, Y.L.; Tung, K.L. CFD simulation of fluid flow through spacer-filled membrane module: Selecting suitable cell types for periodic boundary conditions. Desalination 2008, 233, 351–358. [Google Scholar] [CrossRef]
- Kirby, B.J. Micro- and Nanoscale Fluid Mechanics; Cambridge University Press: Cambridge, UK, 2012; ISBN 9780511760723. [Google Scholar]
- Gambinossi, F.; Mylon, S.E.; Ferri, J.K. Aggregation kinetics and colloidal stability of functionalized nanoparticles. Adv. Colloid Interface Sci. 2015, 222, 332–349. [Google Scholar] [CrossRef]
- Zhang, W.; Crittenden, J.; Li, K.; Chen, Y. Attachment efficiency of nanoparticle aggregation in aqueous dispersions: Modeling and experimental validation. Environ. Sci. Technol. 2012, 46, 7054–7062. [Google Scholar] [CrossRef]
- Picioreanu, C.; Vrouwenvelder, J.S.; Loosdrecht, M.C.M. Van Three-dimensional modeling of biofouling and fluid dynamics in feed spacer channels of membrane devices. J. Membr. Sci. 2009, 345, 340–354. [Google Scholar] [CrossRef]
- Vrouwenvelder, J.S.; Picioreanu, C.; Kruithof, J.C.; Van Loosdrecht, M.C.M. Biofouling in spiral wound membrane systems: Three-dimensional CFD model based evaluation of experimental data. J. Membr. Sci. 2010, 346, 71–85. [Google Scholar] [CrossRef]
- Radu, A.I.; van Steen, M.S.H.; Vrouwenvelder, J.S.; van Loosdrecht, M.C.M.; Picioreanu, C. Spacer geometry and particle deposition in spiral wound membrane feed channels. Water Res. 2014, 64, 160–176. [Google Scholar] [CrossRef] [PubMed]
- Bird, R.B.; Stewart, W.E.; Lightfoot, E.N. Transport Phenomena, 2nd ed.; Wiley: New York, NY, USA, 2002; ISBN 0471410772. [Google Scholar]
- Ranade, V.V.; Kumar, A. Fluid dynamics of spacer filled rectangular and curvilinear channels. J. Memb. Sci. 2006, 271, 1–15. [Google Scholar] [CrossRef]
- Koutsou, C.P.; Yiantsios, S.G.; Karabelas, A.J. Direct numerical simulation of flow in spacer-filled channels: Effect of spacer geometrical characteristics. J. Memb. Sci. 2007, 291, 53–69. [Google Scholar] [CrossRef]
- Tamburini, A.; La Barbera, G.; Cipollina, A.; Ciofalo, M.; Micale, G. CFD simulation of channels for direct and reverse electrodialysis. Desalin. Water Treat. 2012, 48, 370–389. [Google Scholar] [CrossRef]
- Saeed, A.; Vuthaluru, R.; Vuthaluru, H.B. Impact of Feed Spacer Filament Spacing on Mass Transport and Fouling Propensities of RO Membrane Surfaces. Chem. Eng. Commun. 2015, 202, 634–646. [Google Scholar] [CrossRef]
- Schwinge, J.; Wiley, D.E.; Fletcherb, D.F. A CFD study of unsteady flow in narrow spacer-filled channels for spiral-wound membrane modules. Desalination 2002, 146, 7. [Google Scholar] [CrossRef]
- Koutsou, C.P.; Yiantsios, S.G.; Karabelas, A.J. A numerical and experimental study of mass transfer in spacer-filled channels: Effects of spacer geometrical characteristics and Schmidt number. J. Memb. Sci. 2009, 326, 234–251. [Google Scholar] [CrossRef]
- Gu, B.; Adjiman, C.S.; Xu, X.Y. Correlations for concentration polarization and pressure drop in spacer-filled RO membrane modules based on CFD simulations. Membranes 2021, 11, 338. [Google Scholar] [CrossRef] [PubMed]
- Bae, S.; Gu, B.; Lee, J.H. A 3D CFD study on the effects of feed spacer designs on membrane performance for high-permeance RO membranes. J. Water Process Eng. 2023, 53, 103887. [Google Scholar] [CrossRef]
- Jin, D.; Cui, Y.; Jin, Y. Effect of spacer geometry on reverse electrodialysis stack performance. Desalination 2025, 602, 118652. [Google Scholar] [CrossRef]
- Petryakov, M.; Gorobchenko, A.; Mareev, A.; Moroz, I.; Kislyi, A.; Anand, V.; Mareev, S. 3D simulation of the electrodialysis process. Unobvious spacer filaments placement to increase the limiting current. J. Memb. Sci. 2025, 721, 123829. [Google Scholar] [CrossRef]
- Lowrie, W.; Lukin, V.S.; Shumlak, U. A priori mesh quality metric error analysis applied to a high-order finite element method. J. Comput. Phys. 2011, 230, 5564–5586. [Google Scholar] [CrossRef]
- Hill, S.; Deising, D.; Acher, T.; Klein, H.; Bothe, D.; Marschall, H. Boundedness-preserving implicit correction of mesh-induced errors for VOF based heat and mass transfer. J. Comput. Phys. 2018, 352, 285–300. [Google Scholar] [CrossRef]
- Sohn, J.; Liulys, M.; Avgoustaki, D.D.; Xydis, G. CFD analysis of airflow uniformity in a Shipping-Container vertical farm. Comput. Electron. Agric. 2023, 215, 108363. [Google Scholar] [CrossRef]


| Experimental Conditions | |
|---|---|
| Feed solution concentration | 0.05 mol/L NaCl + APAM |
| APAM concentration | 0.1–0.2–0.3 g/L |
| Current density | 20–25–30 A/m2 |
| Total test time | 24 h |
Disclaimer/Publisher’s Note: The statements, opinions and data contained in all publications are solely those of the individual author(s) and contributor(s) and not of MDPI and/or the editor(s). MDPI and/or the editor(s) disclaim responsibility for any injury to people or property resulting from any ideas, methods, instructions or products referred to in the content. |
© 2025 by the authors. Licensee MDPI, Basel, Switzerland. This article is an open access article distributed under the terms and conditions of the Creative Commons Attribution (CC BY) license (https://creativecommons.org/licenses/by/4.0/).
Share and Cite
Volpe, F.; Battaglia, G.; Cipollina, A.; Micale, G.; Tamburini, A. A Hybrid CFD Platform for Colloidal Fouling Prediction in Electrodialysis. Membranes 2025, 15, 375. https://doi.org/10.3390/membranes15120375
Volpe F, Battaglia G, Cipollina A, Micale G, Tamburini A. A Hybrid CFD Platform for Colloidal Fouling Prediction in Electrodialysis. Membranes. 2025; 15(12):375. https://doi.org/10.3390/membranes15120375
Chicago/Turabian StyleVolpe, Francesco, Giuseppe Battaglia, Andrea Cipollina, Giorgio Micale, and Alessandro Tamburini. 2025. "A Hybrid CFD Platform for Colloidal Fouling Prediction in Electrodialysis" Membranes 15, no. 12: 375. https://doi.org/10.3390/membranes15120375
APA StyleVolpe, F., Battaglia, G., Cipollina, A., Micale, G., & Tamburini, A. (2025). A Hybrid CFD Platform for Colloidal Fouling Prediction in Electrodialysis. Membranes, 15(12), 375. https://doi.org/10.3390/membranes15120375