
Experimental Investigation of a Plate–Frame Water Gap Membrane Distillation System for Seawater Desalination

 ,
,  ,
,  , ,
, ,  , ,
, ,  ,
,  and
and 
Abstract
:1. Introduction
2. Materials and Methods
2.1. Materials
2.2. Membrane Characterization
2.3. MD Experiment
2.4. Analytical Methods
3. Results
3.1. Membrane Characteristics
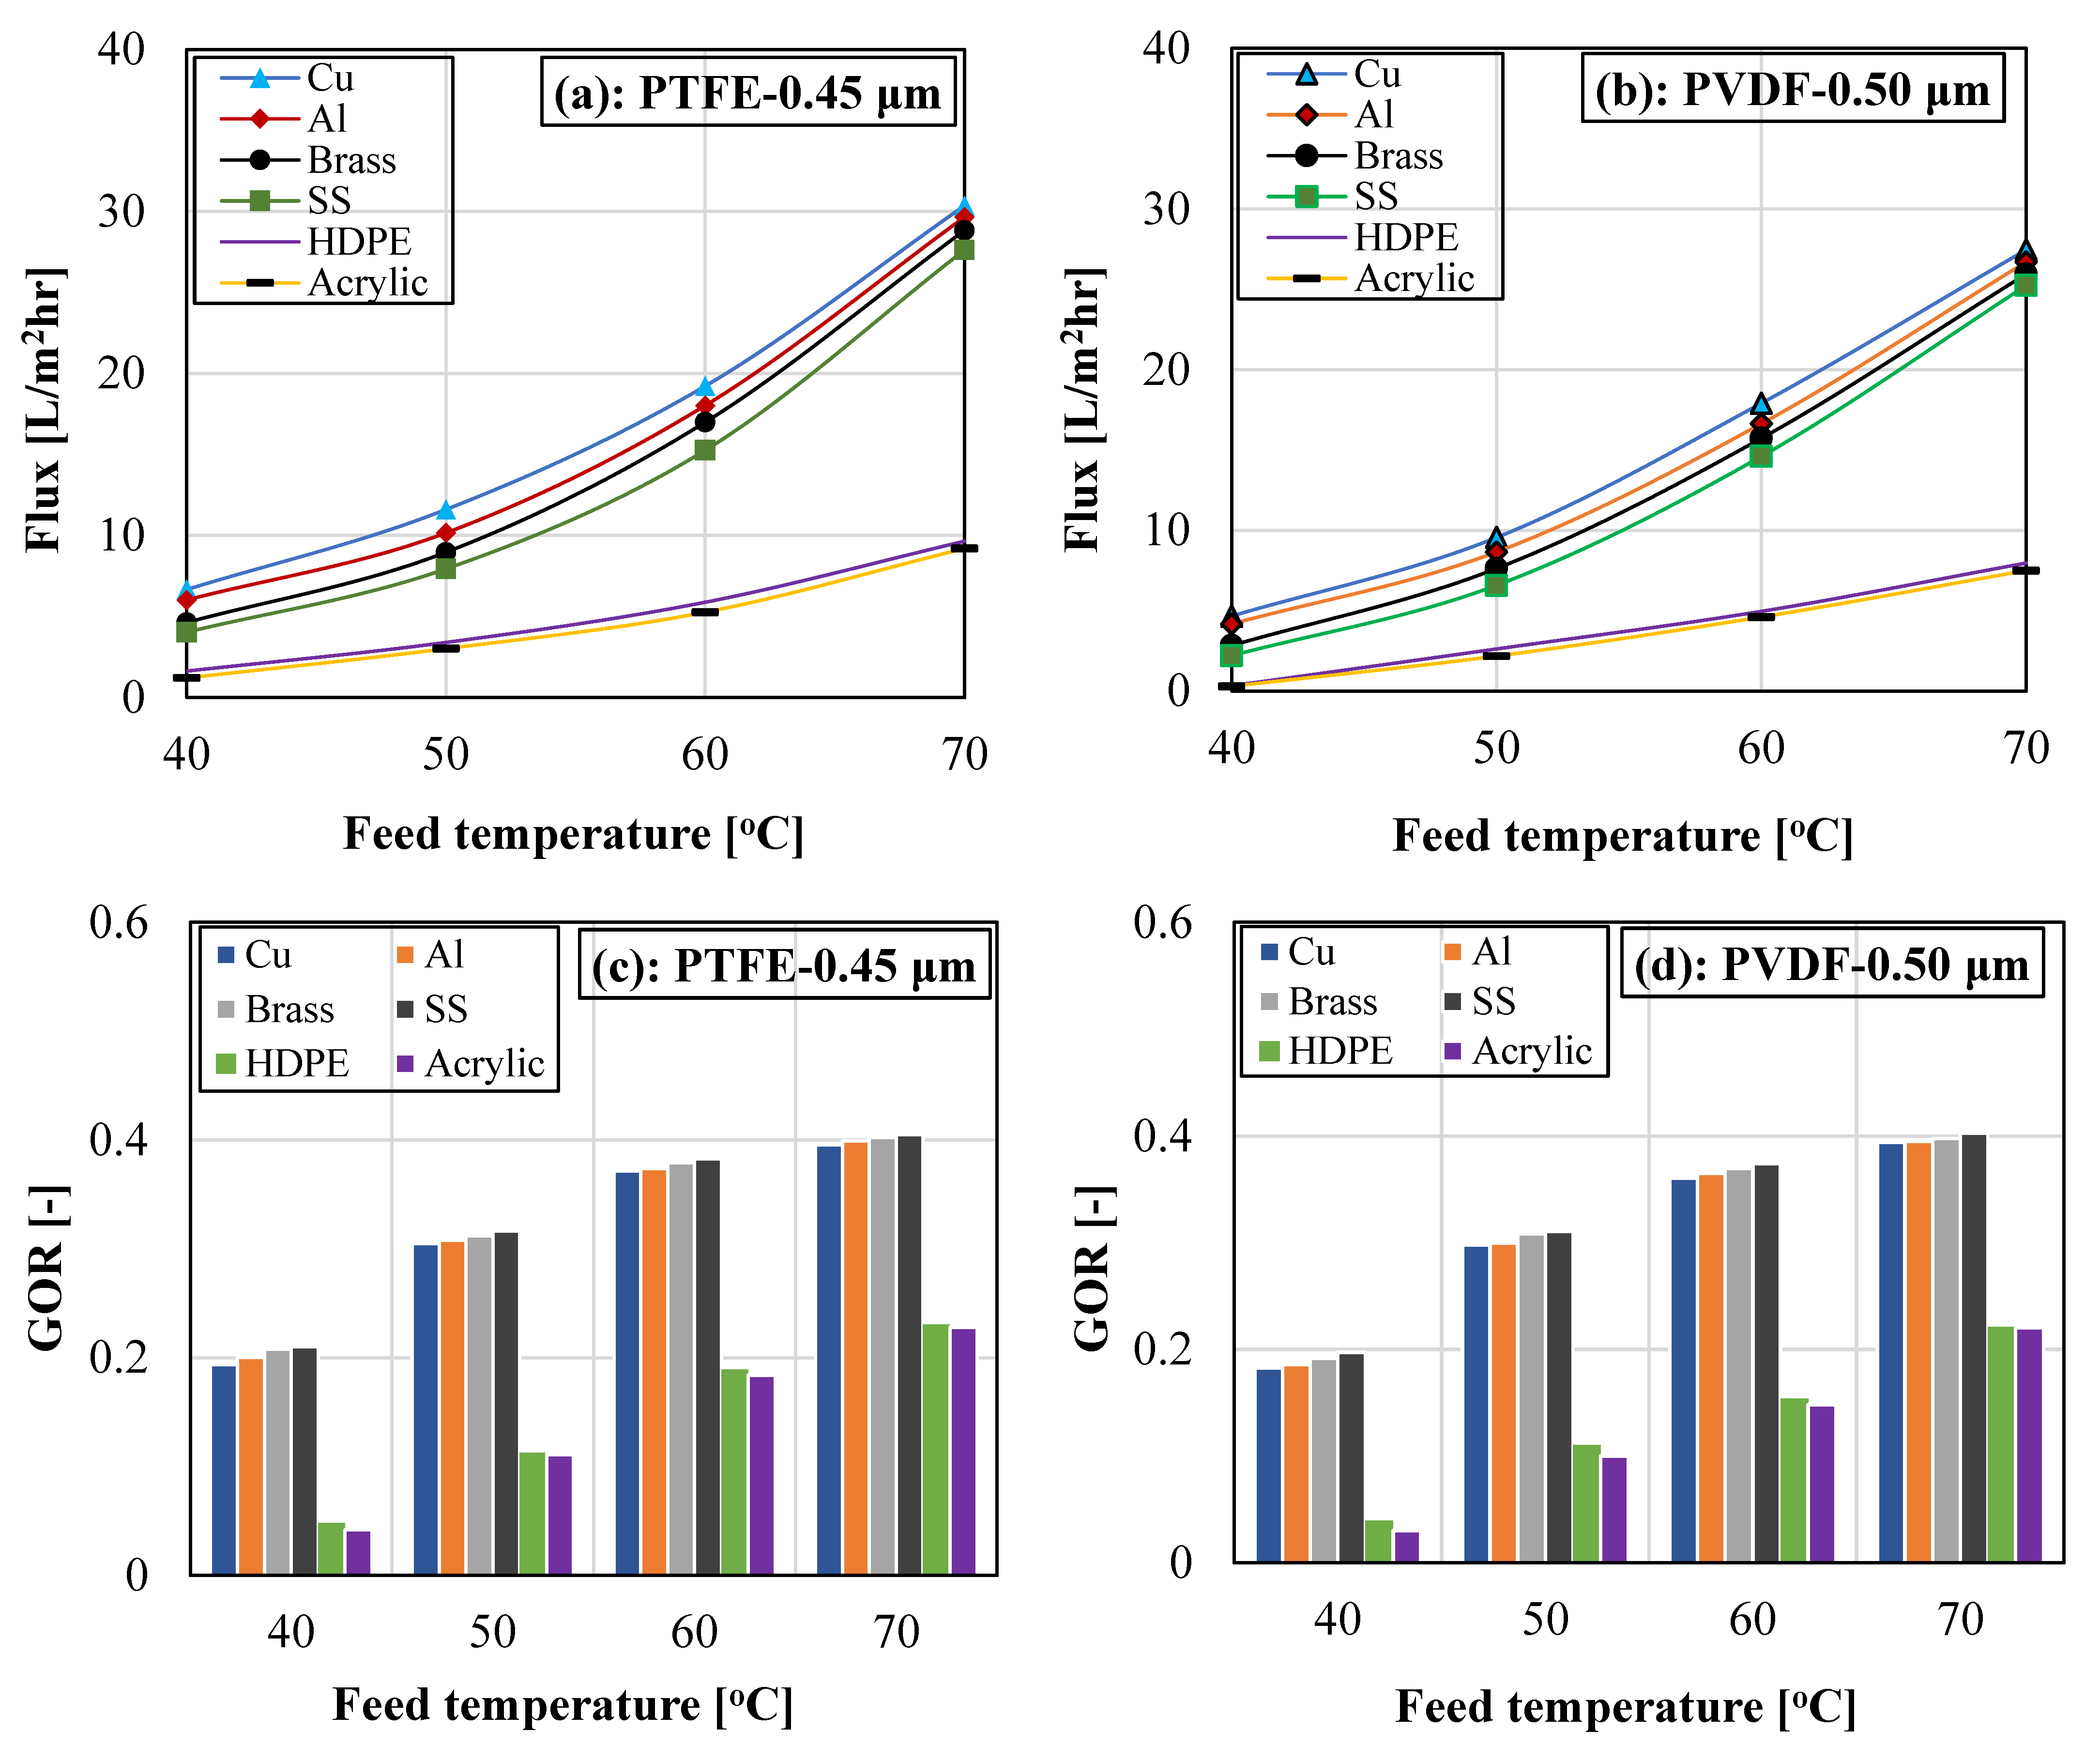
3.2. Influence of Feed Temperature and Cooling Plate Material
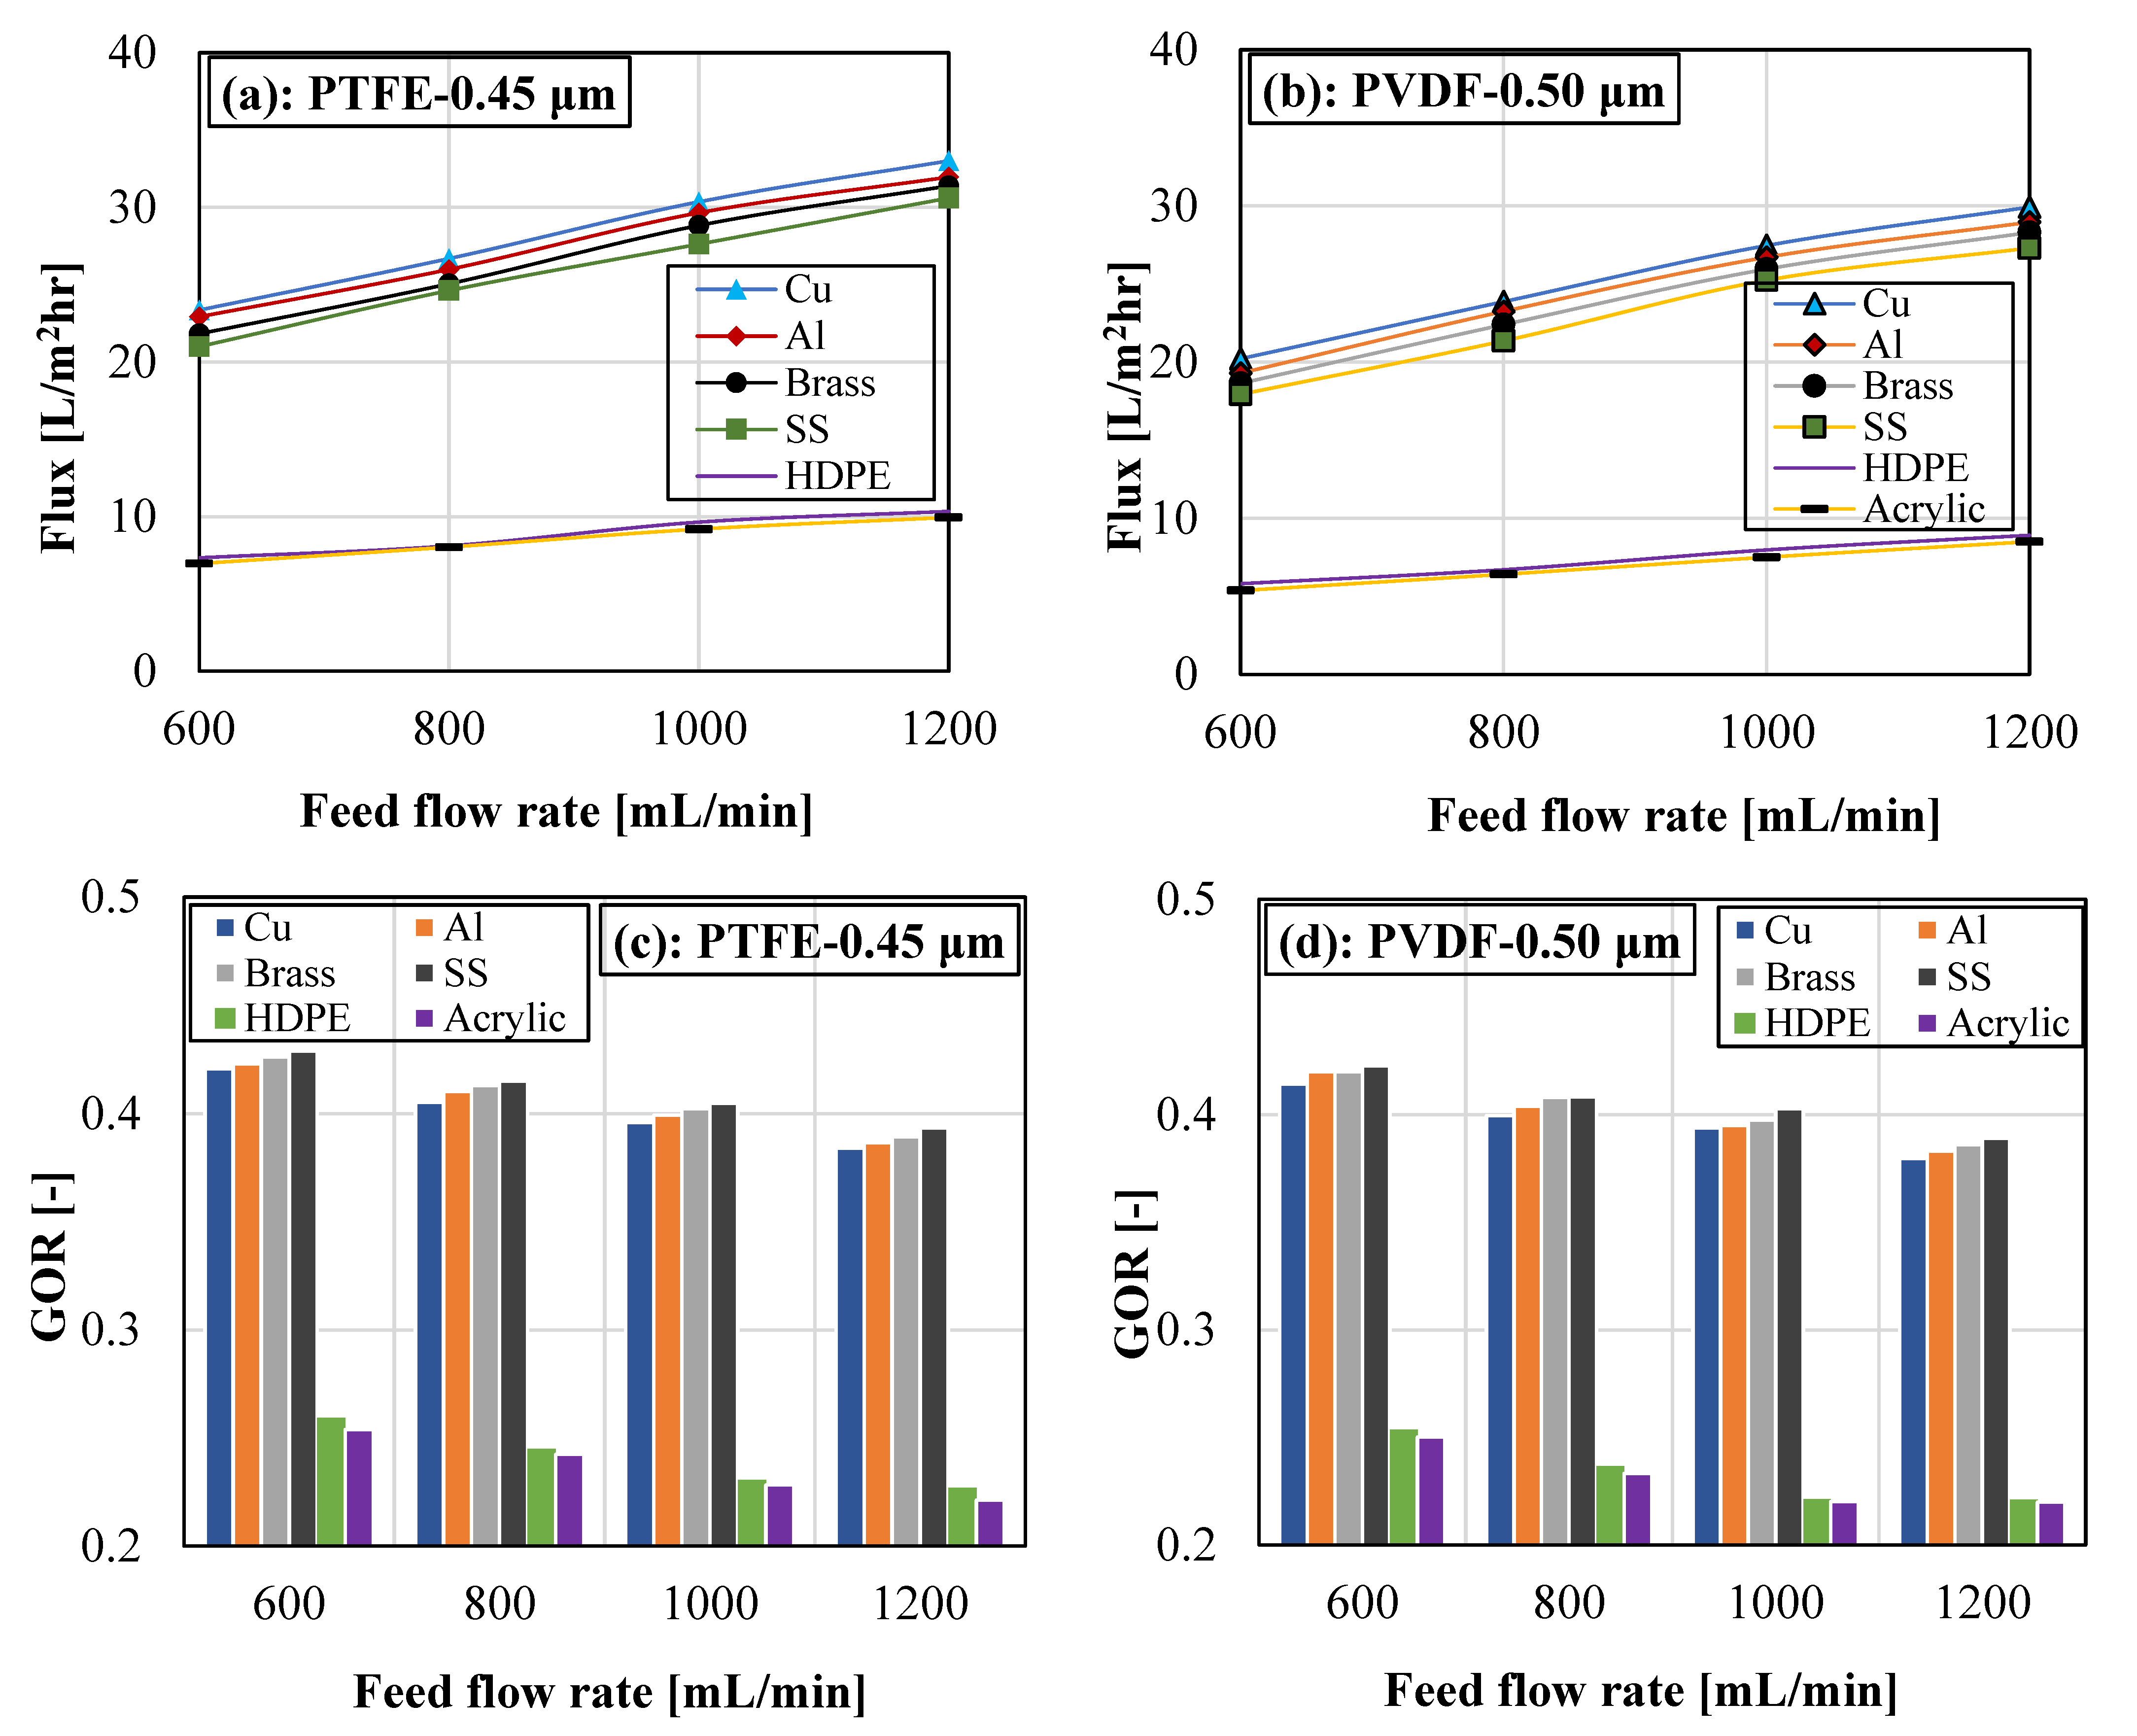
3.3. Impact of Feed Flow Rate and Cooling Plate Material
4. Conclusions
Author Contributions
Funding
Institutional Review Board Statement
Informed Consent Statement
Data Availability Statement
Acknowledgments
Conflicts of Interest
References
- Hu, Y.; Cheng, H. Water pollution during China’s industrial transition. Environ. Dev. 2013, 8, 57–73. [Google Scholar] [CrossRef]
- El-Dessouky, H.T.; Ettouney, H.M. Multiple-effect evaporation desalination systems: Thermal analysis. Desalination 1999, 125, 259–276. [Google Scholar] [CrossRef]
- Ameri, M.; Mohammadi, S.S.; Hosseini, M.; Seifi, M. Effect of design parameters on multi-effect desalinationsystem specifications. Desalination 2009, 245, 266–283. [Google Scholar] [CrossRef]
- Alhazmy, M.M. Multi stage flash desalination plant with brine–feed mixing and cooling. Energy 2011, 36, 5225–5232. [Google Scholar] [CrossRef]
- Al-Obaidi, M.A.; Rasn, K.H.; Aladwani, S.H.; Kadhom, M.; Mujtaba, I.M. Flexible design and operation of multi-stage reverse osmosis desalination process for producing different grades of water with maintenance and cleaning opportunity. Chem. Eng. Res. Des. 2022, 182, 525–543. [Google Scholar] [CrossRef]
- Bahar, R.; Hawlader, M.N.A.; Woei, L.S. Performance evaluation of a mechanical vapor compression desalination system. Desalination 2004, 166, 123–127. [Google Scholar] [CrossRef]
- Hamed, O.A.; Zamamiri, A.M.; Aly, S.; Lior, N. Thermal performance and exergy analysis of a thermal vapor compression desalination system. Energy Convers. Manag. 1996, 37, 379–387. [Google Scholar] [CrossRef]
- Hussain Soomro, S.; Santosh, R.; Bak, C.U.; Yoo, C.H.; Kim, W.S.; Kim, Y.D. Effect of humidifier characteristics on performance of a small-scale humidification-dehumidification desalination system. Appl. Therm. Eng. 2022, 210, 118400. [Google Scholar] [CrossRef]
- Gude, V.G. Emerging Technologies for Sustainable Desalination Handbook; Elsevier: Amsterdam, The Netherlands, 2018. [Google Scholar]
- Bin Abid, M.; Wahab, R.A.; Salam, M.A.; Gzara, L.; Moujdin, I.A. Desalination technologies, membrane distillation, and electrospinning, an overview. Heliyon 2023, 9, e12810. [Google Scholar] [CrossRef]
- Yan, Z.; Jiang, Y.; Liu, L.; Li, Z.; Chen, X.; Xia, M.; Fan, G.; Ding, A. Membrane Distillation for Wastewater Treatment: A Mini Review. Water 2021, 13, 3480. [Google Scholar] [CrossRef]
- Alkhudhiri, A.; Darwish, N.; Hilal, N. Membrane distillation: A comprehensive review. Desalination 2012, 287, 2–18. [Google Scholar] [CrossRef]
- Islam, M.R.; Lin, B.; Yu, Y.; Chen, C.-C.; Malmali, M. Comparative Energetics of Various Membrane Distillation Configurations and Guidelines for Design and Operation. Membranes 2023, 13, 273. [Google Scholar] [CrossRef] [PubMed]
- Ho, C.D.; Chen, L.; Yang, Y.L.; Chen, S.T.; Lim, J.W.; Chen, Z.Z. Permeate Flux Enhancement in Air Gap Membrane Distillation Modules with Inserting Λ-Ribs Carbon-Fiber Open Slots. Membranes 2023, 13, 66. [Google Scholar] [CrossRef]
- Khan, A.; Ibrar, I.; Mirdad, A.; Al-Juboori, R.A.; Deka, P.; Subbiah, S.; Altaee, A. Novel Approach to Landfill Wastewater Treatment Fouling Mitigation: Air Gap Membrane Distillation with Tin Sulfide-Coated PTFE Membrane. Membranes 2023, 13, 483. [Google Scholar] [CrossRef] [PubMed]
- Wu, Z.; Guo, F. Finned Tubular Air Gap Membrane Distillation. Membranes 2023, 13, 498. [Google Scholar] [CrossRef]
- Alsalhy, Q.F.; Ibrahim, S.S.; Hashim, F.A. Experimental and theoretical investigation of air gap membrane distillation process for water desalination. Chem. Eng. Res. Des. 2018, 130, 95–108. [Google Scholar] [CrossRef]
- Fawzy, M.K.; Varela-Corredor, F.; Boi, C.; Bandini, S. The Role of the Morphological Characterization of Multilayer Hydrophobized Ceramic Membranes on the Prediction of Sweeping Gas Membrane Distillation Performances. Membranes 2022, 12, 939. [Google Scholar] [CrossRef]
- Said, I.A.; Chomiak, T.; Floyd, J.; Li, Q. Sweeping gas membrane distillation (SGMD) for wastewater treatment, concentration, and desalination: A comprehensive review. Chem. Eng. Process. Process. Intensif. 2020, 153, 107960. [Google Scholar] [CrossRef]
- Khayet, M.; Cojocaru, C.; Baroudi, A. Modeling and optimization of sweeping gas membrane distillation. Desalination 2012, 287, 159–166. [Google Scholar] [CrossRef]
- Zhao, S.; Feron, P.H.M.; Xie, Z.; Zhang, J.; Hoang, M. Condensation studies in membrane evaporation and sweeping gas membrane distillation. J. Membr. Sci. 2014, 462, 9–16. [Google Scholar] [CrossRef]
- Abejón, R.; Saidani, H.; Deratani, A.; Richard, C.; Sánchez-Marcano, J. Concentration of 1,3-dimethyl-2-imidazolidinone in Aqueous Solutions by Sweeping Gas Membrane Distillation: From Bench to Industrial Scale. Membranes 2019, 9, 158. [Google Scholar] [CrossRef] [PubMed]
- Hussein, S.S.; Ibrahim, S.S.; Toma, M.A.; Alsalhy, Q.F.; Drioli, E. Novel chemical modification of polyvinyl chloride membrane by free radical graft copolymerization for direct contact membrane distillation (DCMD) application. J. Membr. Sci. 2020, 611, 118266. [Google Scholar] [CrossRef]
- Aljumaily, M.M.; Alayan, H.M.; Mohammed, A.A.; Alsaadi, M.A.; Alsalhy, Q.F.; Figoli, A.; Criscuoli, A. The influence of coating super-hydrophobic carbon nanomaterials on the performance of membrane distillation. Appl. Water Sci. 2022, 12, 28. [Google Scholar] [CrossRef]
- Hassan, M.K.; Khraisheh, M.; Tewodros, B.N.; Yang, D.R.; Park, K. Design Parameters of a Direct Contact Membrane Distillation and a Case Study of Its Applicability to Low-Grade Waste Energy. Membranes 2022, 12, 1279. [Google Scholar] [CrossRef]
- Khatri, M.; Francis, L.; Hilal, N. Modified Electrospun Membranes Using Different Nanomaterials for Membrane Distillation. Membranes 2023, 13, 338. [Google Scholar] [CrossRef]
- Tetteh, K.; Rathilal, S.; Femi Bakare, B.; Almeshaal, M.A.; Choubani, K. Using the Log Mean Temperature Difference (LMTD) and ε-NTU Methods to Analyze Heat and Mass Transfer in Direct Contact Membrane Distillation. Membranes 2023, 13, 588. [Google Scholar] [CrossRef]
- Nassif, A.G.; Ibrahim, S.S.; Majdi, H.S.; Alsalhy, Q.F. Ethanol Separation from an Ethanol–Water Solution Using Vacuum Membrane Distillation. Membranes 2022, 12, 807. [Google Scholar] [CrossRef]
- Idrees, H.; Ali, S.; Sajid, M.; Rashid, M.; Khawaja, F.I.; Ali, Z.; Anwar, M.N. Techno-Economic Analysis of Vacuum Membrane Distillation for Seawater Desalination. Membranes 2023, 13, 339. [Google Scholar] [CrossRef]
- Lu, K.J.; Zuo, J.; Chang, J.; Kuan, H.N.; Chung, T.S. Omniphobic Hollow-Fiber Membranes for Vacuum Membrane Distillation. Environ. Sci. Technol. 2018, 52, 4472–4480. [Google Scholar] [CrossRef]
- Abu-Zeid, M.A.E.R.; Zhang, Y.; Dong, H.; Zhang, L.; Chen, H.L.; Hou, L. A comprehensive review of vacuum membrane distillation technique. Desalination 2015, 356, 1–14. [Google Scholar] [CrossRef]
- Jung, W.; Choe, Y.; Kim, T.; Ok, J.G.; Lee, H.H.; Kim, Y.H. High-permeability vacuum membrane distillation utilizing mechanically compressed carbon nanotube membranes. RSC Adv. 2021, 12, 201–206. [Google Scholar] [CrossRef] [PubMed]
- Elbessomy, M.O.; Elsamni, O.A.; Elsheniti, M.B.; Elsherbiny, S.M. Optimum configurations of a compact hollow-fiber water gap membrane distillation module for ultra-low waste heat applications. Chem. Eng. Res. Des. 2023, 195, 218–234. [Google Scholar] [CrossRef]
- Im, B.G.; Francis, L.; Santosh, R.; Kim, W.S.; Ghaffour, N.; Kim, Y.D. Comprehensive insights into performance of water gap and air gap membrane distillation modules using hollow fiber membranes. Desalination 2022, 525, 115497. [Google Scholar] [CrossRef]
- Memon, S.; Im, B.G.; Lee, H.S.; Kim, Y.D. Comprehensive experimental and theoretical studies on material-gap and water-gap membrane distillation using composite membranes. J. Memb. Sci. 2023, 666, 121108. [Google Scholar] [CrossRef]
- Gao, L.; Zhang, J.; Gray, S.; Li, J.-D. Experimental study of hollow fiber permeate gap membrane distillation and its performance comparison with DCMD and SGMD. Sep. Purif. Technol. 2017, 188, 11–23. [Google Scholar] [CrossRef]
- Cheng, L.; Zhao, Y.; Li, P.; Li, W.; Wang, F. Comparative study of air gap and permeate gap membrane distillation using internal heat recovery hollow fiber membrane module. Desalination 2018, 426, 42–49. [Google Scholar] [CrossRef]
- Yazgan-Birgi, P.; Hassan Ali, M.I.; Swaminathan, J.; Lienhard, J.H.; Arafat, H.A. Computational fluid dynamics modeling for performance assessment of permeate gap membrane distillation. J. Memb. Sci. 2018, 568, 55–66. [Google Scholar] [CrossRef]
- Lawal, D.U. Performance enhancement of permeate gap membrane distillation system augmented with impeller. Sustain. Energy Technol. Assess. 2022, 54, 102792. [Google Scholar] [CrossRef]
- Ugrozov, V.V.; Elkina, I.B.; Nikulin, V.N.; Kataeva, L.I. Theoretical and experimental research of liquid-gap membrane distillation process in membrane module. Desalination 2003, 157, 325–331. [Google Scholar] [CrossRef]
- Im, B.G.; Lee, J.G.; Kim, Y.D.; Kim, W.S. Theoretical modeling and simulation of AGMD and LGMD desalination processes using a composite membrane. J. Membr. Sci. 2018, 565, 14–24. [Google Scholar] [CrossRef]
- Yue, C.; Peng, Y.; Chen, L.; Schaefer, L.A. Thermal analysis of a heat pump-based liquid gap membrane distillation H2SO4 system. Chem. Eng. Process. Process. Intensif. 2021, 167, 108509. [Google Scholar] [CrossRef]
- Essalhi, M.; Khayet, M. Application of a porous composite hydrophobic/hydrophilic membrane in desalination by air gap and liquid gap membrane distillation: A comparative study. Sep. Purif. Technol. 2014, 133, 176–186. [Google Scholar] [CrossRef]
- Francis, L.; Ghaffour, N.; Alsaadi, A.A.; Amy, G.L. Material gap membrane distillation: A new design for water vapor flux enhancement. J. Membr. Sci. 2013, 448, 240–247. [Google Scholar] [CrossRef]
- Cai, J.; Yin, H.; Guo, F. Transport analysis of material gap membrane distillation desalination processes. Desalination 2020, 481, 114361. [Google Scholar] [CrossRef]
- Swaminathan, J.; Chung, H.W.; Warsinger, D.M.; AlMarzooqi, F.A.; Arafat, H.A.; Lienhard, J.H. Energy efficiency of permeate gap and novel conductive gap membrane distillation. J. Membr. Sci. 2016, 502, 171–178. [Google Scholar] [CrossRef]
- Khalifa, A.E. Water and air gap membrane distillation for water desalination—An experimental comparative study. Sep. Purif. Technol. 2015, 141, 276–284. [Google Scholar] [CrossRef]
- Alawad, S.M.; Lawal, D.U.; Khalifa, A.E.; Aljundi, I.H.; Antar, M.A.; Baroud, T.N. Analysis of water gap membrane distillation process with an internal gap circulation propeller. Desalination 2023, 551, 116379. [Google Scholar] [CrossRef]
- Khalifa, A.E. Flux enhanced water gap membrane distillation process-circulation of gap water. Sep. Purif. Technol. 2020, 231, 115938. [Google Scholar] [CrossRef]
- Alawad, S.M.; Khalifa, A.E.; Antar, M.A. Performance analysis of multistage water gap membrane distillation system with economic evaluation. Appl. Therm. Eng. 2021, 184, 116297. [Google Scholar] [CrossRef]
- Ruiz-Aguirre, A.; Andrés-Mañas, J.A.; Fernández-Sevilla, J.M.; Zaragoza, G. Modeling and optimization of a commercial permeate gap spiral wound membrane distillation module for seawater desalination. Desalination 2017, 419, 160–168. [Google Scholar] [CrossRef]
- Gao, L.; Zhang, J.; Gray, S.; Li, J.-D. Modelling mass and heat transfers of Permeate Gap Membrane Distillation using hollow fibre membrane. Desalination 2019, 467, 196–209. [Google Scholar] [CrossRef]
- Gu, M.; Zhang, J.; Wang, X.; Tao, H.; Ge, L. Formation of poly(vinylidene fluoride) (PVDF) membranes via thermally induced phase separation. Desalination 2006, 192, 160–167. [Google Scholar] [CrossRef]
- Smolders, K.; Franken, A.C.M. Terminology for Membrane Distillation. Desalination 1989, 72, 249–262. [Google Scholar] [CrossRef]
- Lawal, D.; Abdul Azeem, M.; Khalifa, A.; Falath, W.; Baroud, T.; Antar, M. Performance improvement of an air gap membrane distillation process with rotating fan. Appl. Therm. Eng. 2022, 204, 117964. [Google Scholar] [CrossRef]
- Carvill, J. Mechanical Engineer’s Data Handbook; Butterworth-Heinemann; Elsevier: Oxford, UK, 1993. [Google Scholar]
- Martienssen, W.W.H. (Ed.) . Springer Handbook of Condensed Matter and Materials Data; Springer: Berlin/Heidelberg, Germany, 2005. [Google Scholar] [CrossRef]
- Mohd Ramli, M.R.; Ahmad, A.L.; Leo, C.P. Surface Modification of Polytetrafluoroethylene Hollow Fiber Membrane for Direct Contact Membrane Distillation through Low-Density Polyethylene Solution Coating. ACS Omega 2021, 6, 4609–4618. [Google Scholar] [CrossRef] [PubMed]
- Boudenne, A.; Ibos, L.; Gehin, E.; Candau, Y. A simultaneous characterization of thermal conductivity and diffusivity of polymer materials by a periodic method. J. Phys. D Appl. Phys. 2003, 37, 132–139. [Google Scholar] [CrossRef]
- Zhou, Y.; Chen, L.; Huang, M.; Hu, W.; Chen, G.; Wu, B. Experimental Investigation of the Desalination Process for Direct Contact Membrane Distillation Using Plate and Frame Membrane Module. Appl. Sci. 2023, 13, 9439. [Google Scholar] [CrossRef]
- Szczerbińska, J.; Kujawski, W.; Arszyńska, J.M.; Kujawa, J. Assessment of air-gap membrane distillation with hydrophobic porous membranes utilized for damaged paintings humidification. J. Membr. Sci. 2017, 538, 1–8. [Google Scholar] [CrossRef]
- Hussein, A.; Khalifa, A.E.; Alawad, S.M.; Antar, M.A. Experimental investigation of membrane distillation with bubble column dehumidifier system for water desalination. Case Stud. Therm. Eng. 2022, 39, 102383. [Google Scholar] [CrossRef]
- Guillén-Burrieza, E.; Blanco, J.; Zaragoza, G.; Alarcón, D.C.; Palenzuela, P.; Ibarra, M.; Gernjak, W. Experimental analysis of an air gap membrane distillation solar desalination pilot system. J. Memb. Sci. 2011, 379, 386–396. [Google Scholar] [CrossRef]
- Banat, F.; Jwaied, N.; Rommel, M.; Koschikowski, J.; Wieghaus, M. Performance evaluation of the “large SMADES” autonomous desalination solar-driven membrane distillation plant in Aqaba, Jordan. Desalination 2007, 217, 17–28. [Google Scholar] [CrossRef]
- Shahu, V.T.; Thombre, S.B. Theoretical analysis and parametric investigation of an innovative helical air gap membrane desalination system. Appl. Water Sci. 2022, 12, 18. [Google Scholar] [CrossRef]
- Summers, E.K.; Lienhard, J.H. Experimental study of thermal performance in air gap membrane distillation systems, including the direct solar heating of membranes. Desalination 2013, 330, 100–111. [Google Scholar] [CrossRef]
- Gopi, G.; Vasanthkumar, M.; Arthanareeswaran, G.; Ismail, A.F.; Thuyavan, Y.L.; Goh, P.S.; Matsuura, T. Performance, energy and economic investigation of airgap membrane distillation system: An experimental and numerical investigation. Desalination 2023, 551, 116400. [Google Scholar] [CrossRef]
- Lin, Y.X.; Liou, Y.K.; Lee, S.L.; Chen, S.Y.; Tao, F.T.; Cheng, T.W.; Tung, K.L. Preparation of PVDF/PMMA composite membrane with green solvent for seawater desalination by gap membrane distillation. J. Memb. Sci. 2023, 679, 121676. [Google Scholar] [CrossRef]
- Cipollina, A.; Di Sparti, M.G.; Tamburini, A.; Micale, G. Development of a Membrane Distillation module for solar energy seawater desalination. Chem. Eng. Res. Des. 2012, 90, 2101–2121. [Google Scholar] [CrossRef]


| Properties | PTFE | PVDF | |
|---|---|---|---|
| Active layer thickness | 8 ± 2 μm | 105 ± 3 μm | |
| Support layer thickness | 143 ± 16 μm | - | |
| Total thickness | 156 ± 14 μm | 105 ± 3 μm | |
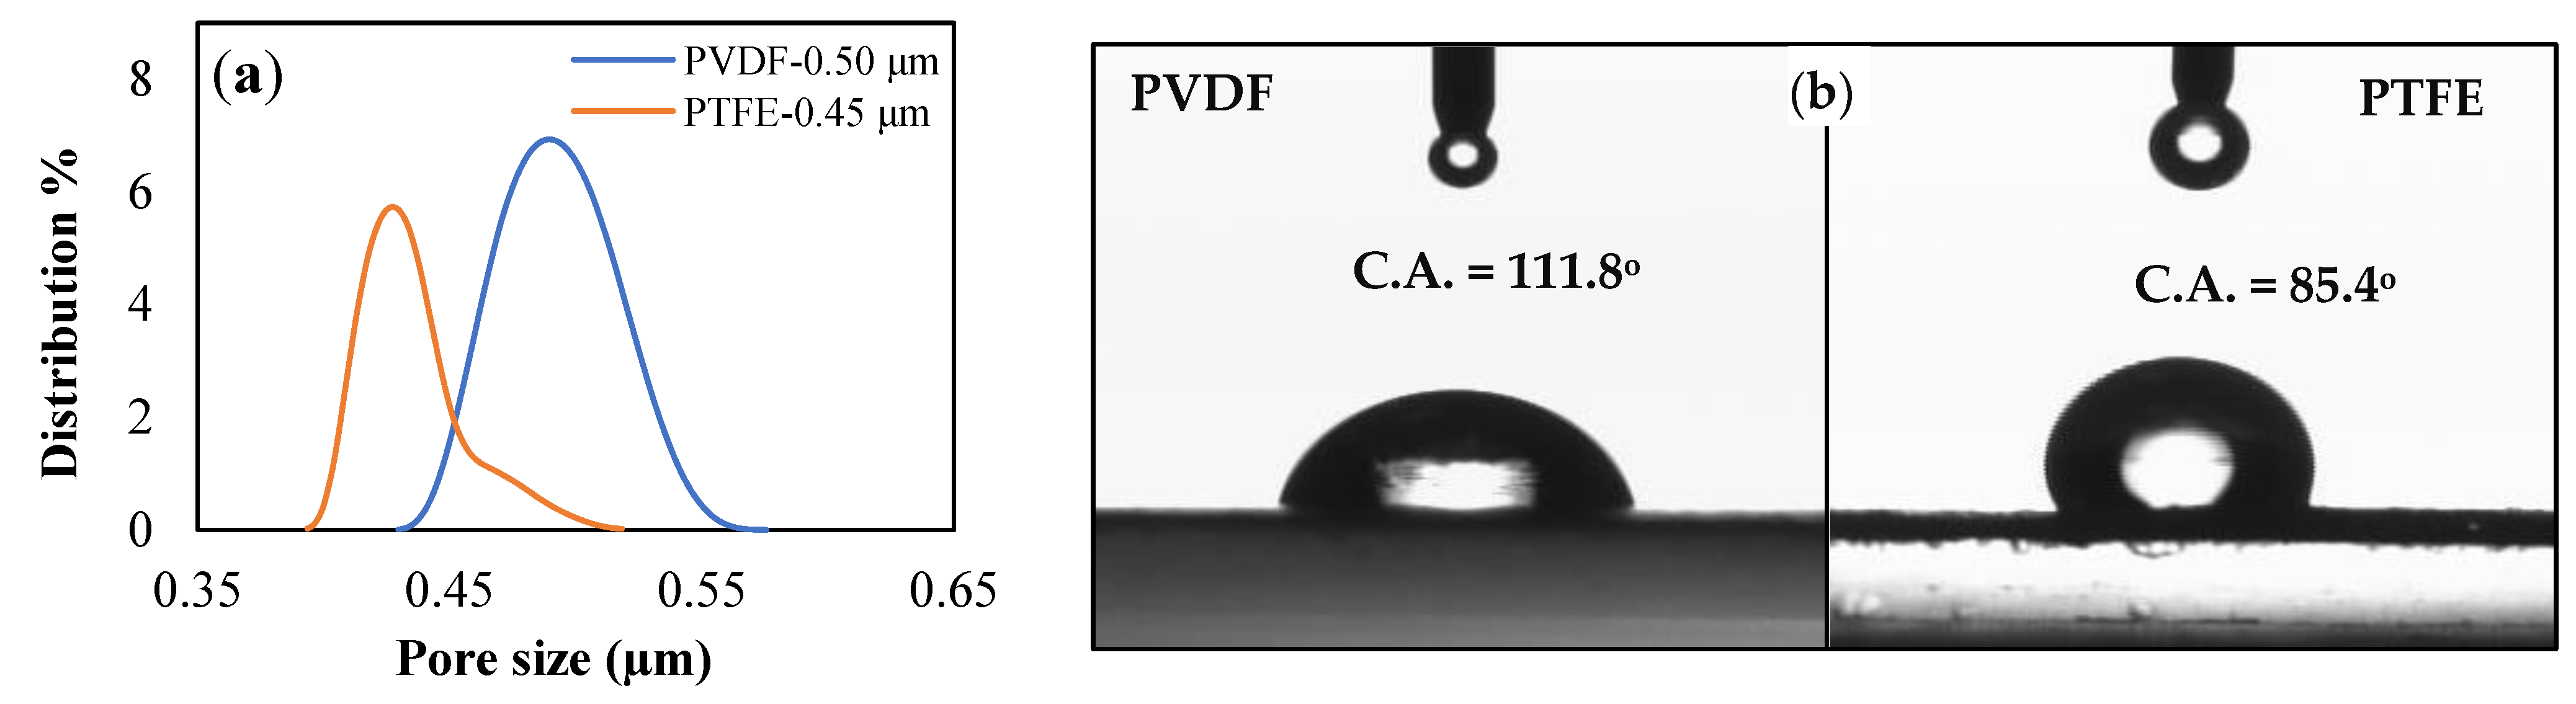
| Pore Size | Mean | 0.45 μm | 0.50 μm |
| Min. | 0.40 μm | 0.43 μm | |
| Max. | 0.50 μm | 0.57 μm | |
| Porosity | 74.78% | 75.35% | |
| Water Contact Angle | 111.8° | 85.4° | |
| Liquid Entry Pressure (LEP) | 2.4 ± 0.1 bar | 0.4 ± 0.1 bar | |
| Effective Area | 7.316 × 10⁻⁴ m2 | ||
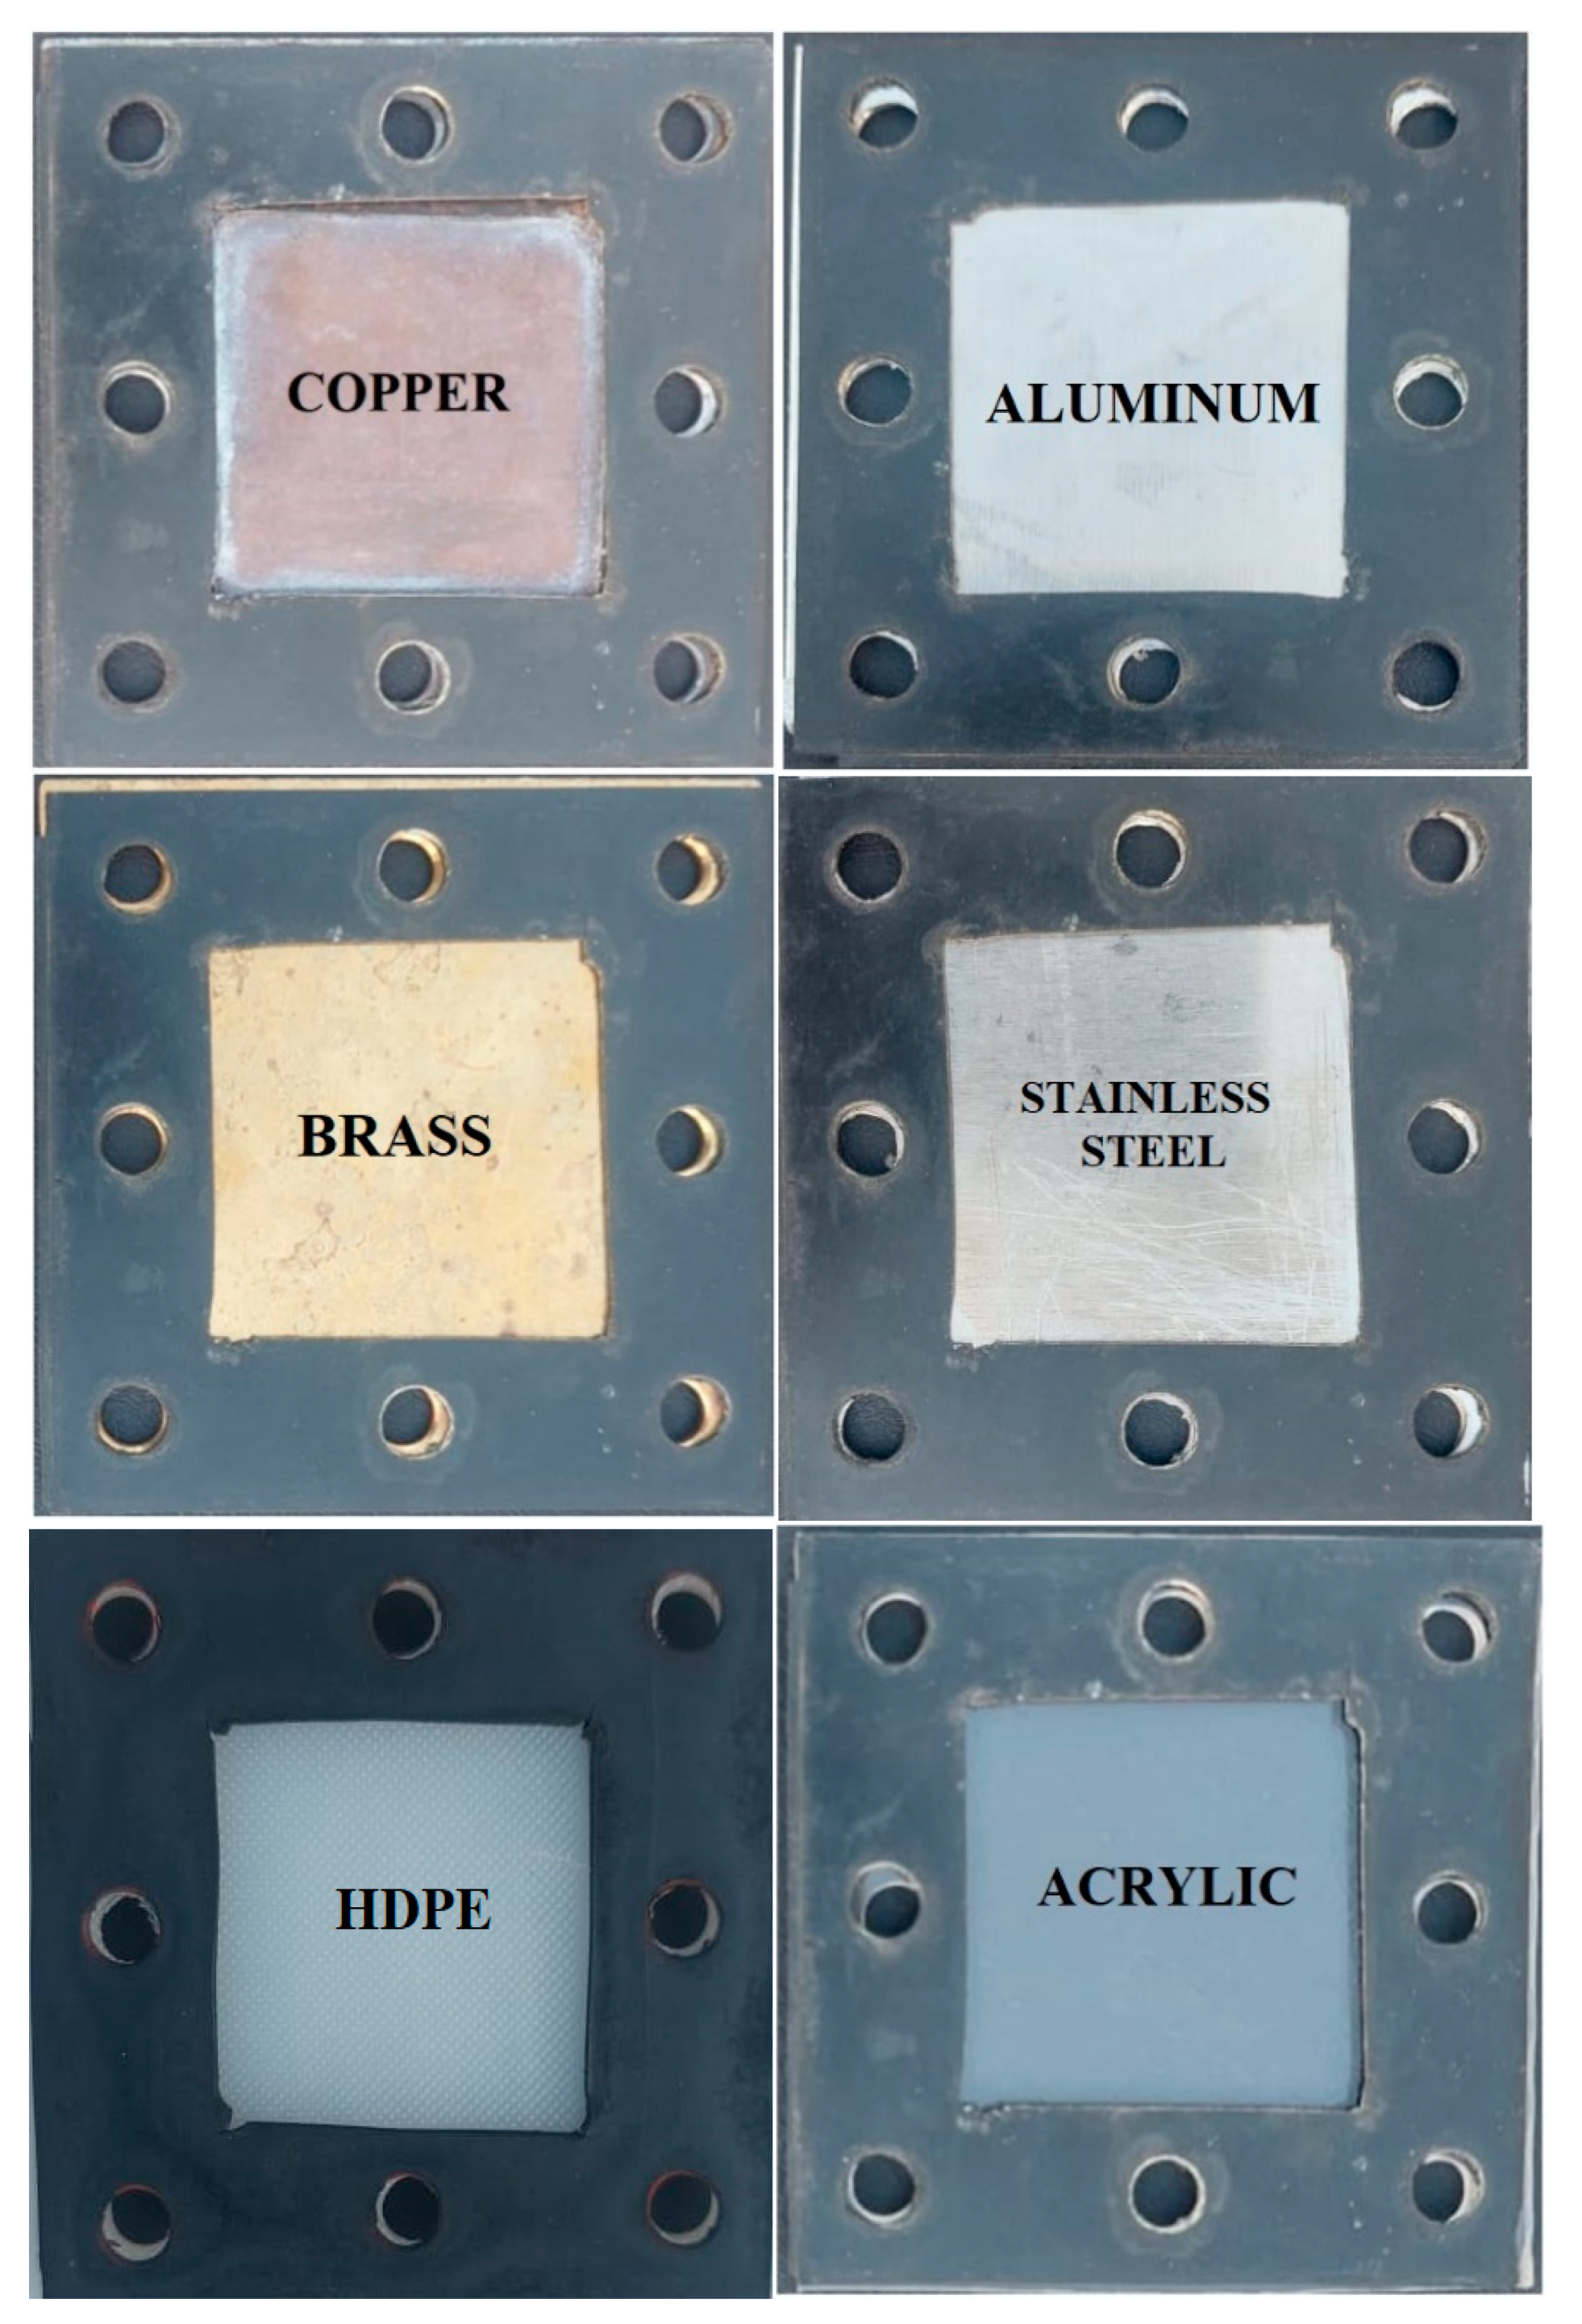
| Materials | Copper (Cu) | Aluminum (Al) | Brass | Stainless Steel (SS) | HDPE | Acrylic |
|---|---|---|---|---|---|---|
| Thermal Conductivity (W/m-K) | 397 [57] | 239 [56] | 126 [57] | 25 [56] | 0.38–0.51 [57] | 0.20 [56] |
| Thickness (mm) | 2 | 2 | 2 | 2 | 2 | 2.3 |
| Feed Temperature [°C] | PTFE Membrane | PVDF Membrane | ||||||||||
|---|---|---|---|---|---|---|---|---|---|---|---|---|
| Cu | Al | Brass | SS | HDPE | Acrylic | Cu | Al | Brass | SS | HDPE | Acrylic | |
| 40 | 22.3 | 23.7 | 24.4 | 25.7 | 31.7 | 32.1 | 22.1 | 23.1 | 23.9 | 25.0 | 30.9 | 31.5 |
| 50 | 26.1 | 27.0 | 27.9 | 28.2 | 40.8 | 41.6 | 25.7 | 26.2 | 27.1 | 27.7 | 39.6 | 40.1 |
| 60 | 28.7 | 29.5 | 30.6 | 31.8 | 49.0 | 49.9 | 28.0 | 29.0 | 29.9 | 30.7 | 48.3 | 49.0 |
| 70 | 32.5 | 34.0 | 35.3 | 37.1 | 61.3 | 62.2 | 32.0 | 33.3 | 34.6 | 36.4 | 61.0 | 61.6 |
| Feed Flow rate [mL/min] | PTFE Membrane | PVDF Membrane | ||||||||||
| Cu | Al | Brass | SS | HDPE | Acrylic | Cu | Al | Brass | SS | HDPE | Acrylic | |
| 600 | 31.9 | 33.2 | 34.6 | 36.3 | 60.1 | 60.9 | 31.1 | 32.4 | 33.8 | 35.3 | 59.9 | 60.3 |
| 800 | 32.2 | 33.7 | 35.0 | 36.6 | 60.8 | 61.6 | 31.6 | 32.8 | 34.2 | 35.8 | 60.5 | 61.1 |
| 1000 | 32.5 | 34.0 | 35.3 | 37.1 | 61.3 | 62.2 | 32.0 | 33.3 | 34.6 | 36.4 | 61.0 | 61.6 |
| 1200 | 32.9 | 34.3 | 35.9 | 37.7 | 61.8 | 62.9 | 32.4 | 33.8 | 35.0 | 37.1 | 61.6 | 62.0 |
| Module Type/Cold Plate | Membrane Type | Conditions | Feed Salinity | Vapor Flux (kg/m2hr) | GOR (-) | References |
|---|---|---|---|---|---|---|
| Plate–Frame SGMD—bubble column dehumidifier/NA | PTFE | Feed temperature of 50 to 80 °C. Feed flow rate of 2.38 to 4.85 L/min. Coolant temperature of 15 °C. Coolant flow rate of 2.3 L/min. | 2 g/L | 60 | 0.76 | [61] |
| Circular Plate–Frame AGMD module/NA | PP, PVDF, and PTFE | Feed temperature of 50 °C. Cold temperature of 7 °C | NA | 7.6 | 1.01 | [62] |
| Plate–Frame AGMD/NA | PTFE | Feed temperature of 40–85 °C. Feed flow rate = Cold flow rate = 20 L/min. | 1 g/L and 35 g/L | 6.5 | 0.28–0.79 | [63] |
| Spiral wound AGMD/NA | PTFE | Feed temperature of 55–95 °C. Feed flow rate:1000 to 1300 L/h. | Untreated real seawater (55,000 μS/cm) | 1.5 | 0.4–0.7 | [64] |
| Tubular helical AGMD/copper | PTFE | Feed temperature of 45 to 75 °C. Feed flow rate = Coolant flow rate = 3 L/min. | 20 g/L | 20 | 0.11 | [65] |
| Plate–Frame AGMD/copper | PVDF | Feed temperature of 20 to 85 °C. Gap width of 1.55 mm. Feed flow rate of 1 kg/s | NA | 0.4 | 0.25 | [66] |
| Plate–Frame AGMD/NA | PVDF and PVDF/PVP | Feed temperature of 40 to 80 °C. Feed flow rate of 1 to 2.5 L/min. Air gap width of 4, 6, 8, and 10 mm. | 0.021 g/L and 35 g/L | 8.734 | NA | [67] |
| Plate–Frame WGMD, AGMD, DCMD/Metal | PVDF/PMMA | Feed temperature of 50–70 °C. Feed flow rate of 0.4–0.8 L/min. Coolant temperature of 20 °C. Coolant flow rate: 0.6 L/min. | 35 g/L | 26.04 | 0.653 | [68] |
| Plate–Frame AGMD, WGMD/Stainless steel | SMM and PEI composite | Feed temperature of 35 to 80 °C | 12 g/L and 30 g/L | 16 | NA | [43] |
| AGMD and WGMD/polymeric film | PTFE with PP support | Feed temperature of 80 °C. 17–20 °C coolant temperature. | 35 g/L | 12 | <1 to 3.3 | [69] |
| Plate–Frame WGMD/Copper, Aluminum, Brass, Stainless steel, HDPE, and Acrylic | PTFE with PP support and PVDF with PET substrate | Feed temperature of 50–70 °C. Feed flow rate of 0.6–1.2 L/min. Coolant temperature of 15 °C. Coolant flow rate: 2.0 L/min. | Untreated real seawater of 48.2 g/L | 33.01 | 0.429 | Present Study |
Disclaimer/Publisher’s Note: The statements, opinions and data contained in all publications are solely those of the individual author(s) and contributor(s) and not of MDPI and/or the editor(s). MDPI and/or the editor(s) disclaim responsibility for any injury to people or property resulting from any ideas, methods, instructions or products referred to in the content. |
© 2023 by the authors. Licensee MDPI, Basel, Switzerland. This article is an open access article distributed under the terms and conditions of the Creative Commons Attribution (CC BY) license (https://creativecommons.org/licenses/by/4.0/).
Share and Cite
Lawal, D.U.; Abdulazeez, I.; Alsalhy, Q.F.; Usman, J.; Abba, S.I.; Mansir, I.B.; Sathyamurthy, R.; Kaleekkal, N.J.; Imteyaz, B. Experimental Investigation of a Plate–Frame Water Gap Membrane Distillation System for Seawater Desalination. Membranes 2023, 13, 804. https://doi.org/10.3390/membranes13090804
Lawal DU, Abdulazeez I, Alsalhy QF, Usman J, Abba SI, Mansir IB, Sathyamurthy R, Kaleekkal NJ, Imteyaz B. Experimental Investigation of a Plate–Frame Water Gap Membrane Distillation System for Seawater Desalination. Membranes. 2023; 13(9):804. https://doi.org/10.3390/membranes13090804
Chicago/Turabian StyleLawal, Dahiru U., Ismail Abdulazeez, Qusay F. Alsalhy, Jamilu Usman, Sani. I. Abba, Ibrahim B. Mansir, Ravishankar Sathyamurthy, Noel Jacob Kaleekkal, and Binash Imteyaz. 2023. "Experimental Investigation of a Plate–Frame Water Gap Membrane Distillation System for Seawater Desalination" Membranes 13, no. 9: 804. https://doi.org/10.3390/membranes13090804
APA StyleLawal, D. U., Abdulazeez, I., Alsalhy, Q. F., Usman, J., Abba, S. I., Mansir, I. B., Sathyamurthy, R., Kaleekkal, N. J., & Imteyaz, B. (2023). Experimental Investigation of a Plate–Frame Water Gap Membrane Distillation System for Seawater Desalination. Membranes, 13(9), 804. https://doi.org/10.3390/membranes13090804