


Conformational State of Fenamates at the Membrane Interface: A MAS NOESY Study


Abstract
1. Introduction
2. Materials and Methods
3. Results
4. Discussion
5. Conclusions
Author Contributions
Funding
Institutional Review Board Statement
Data Availability Statement
Conflicts of Interest
Appendix A


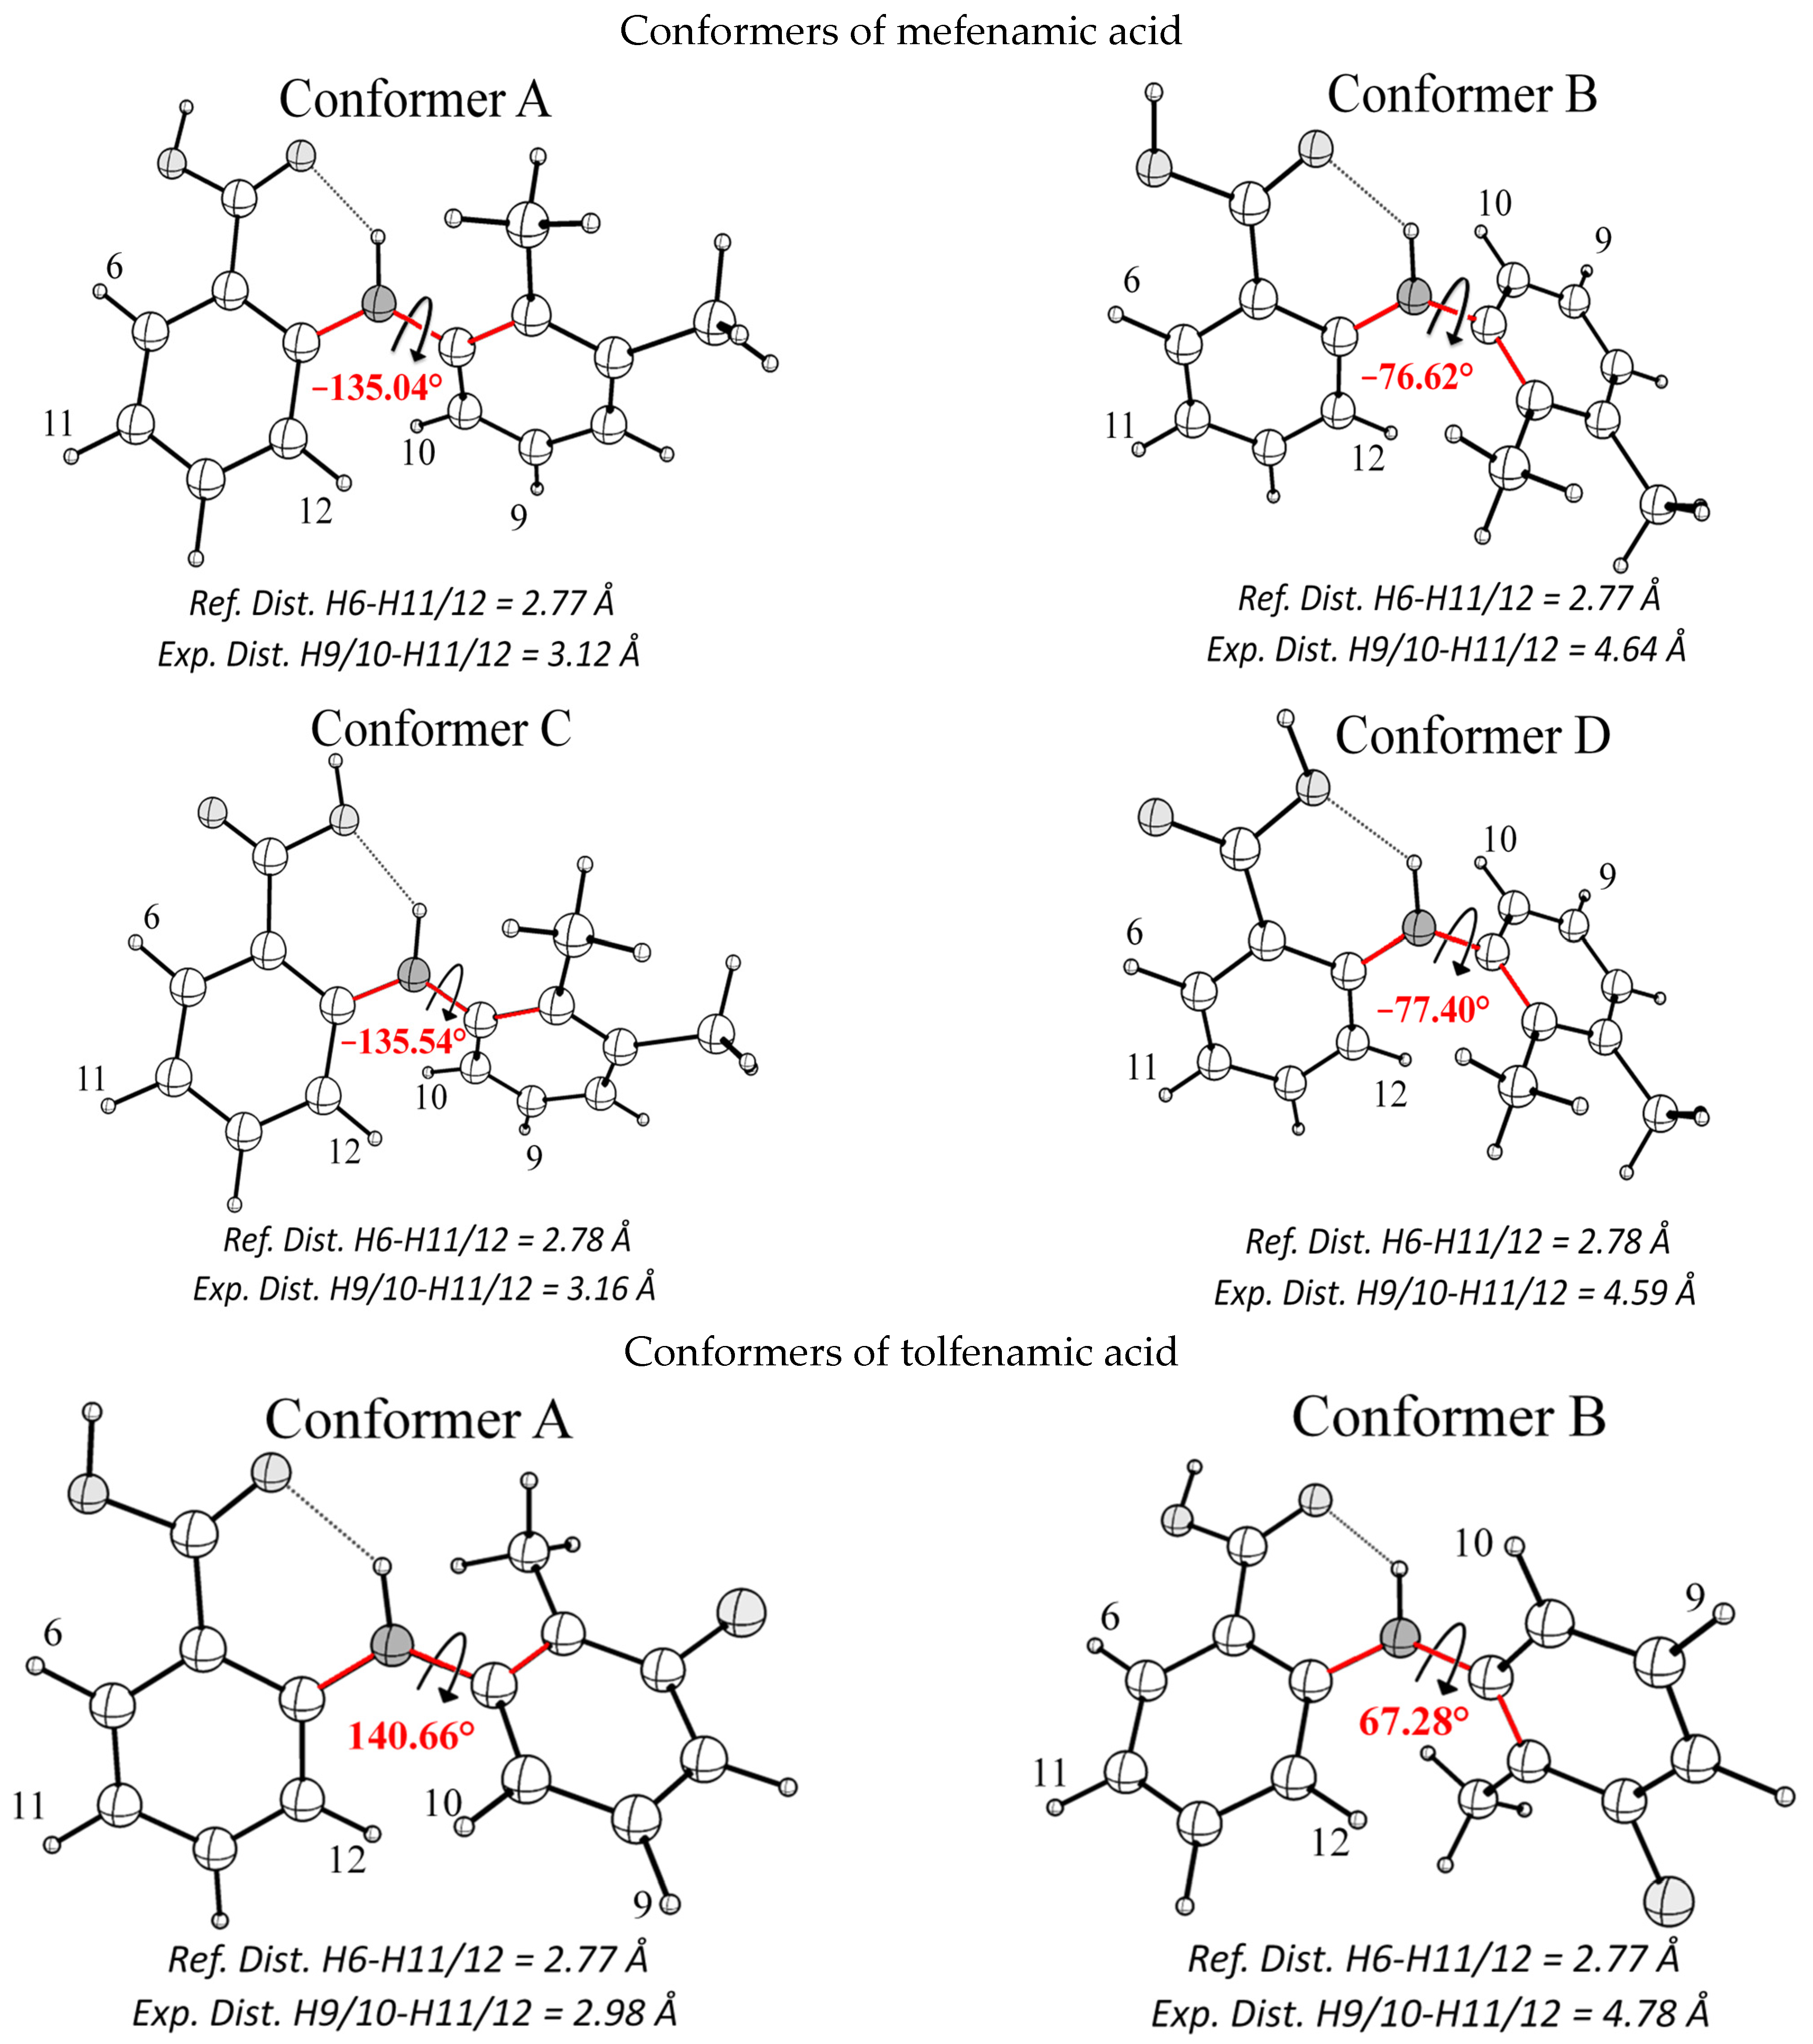
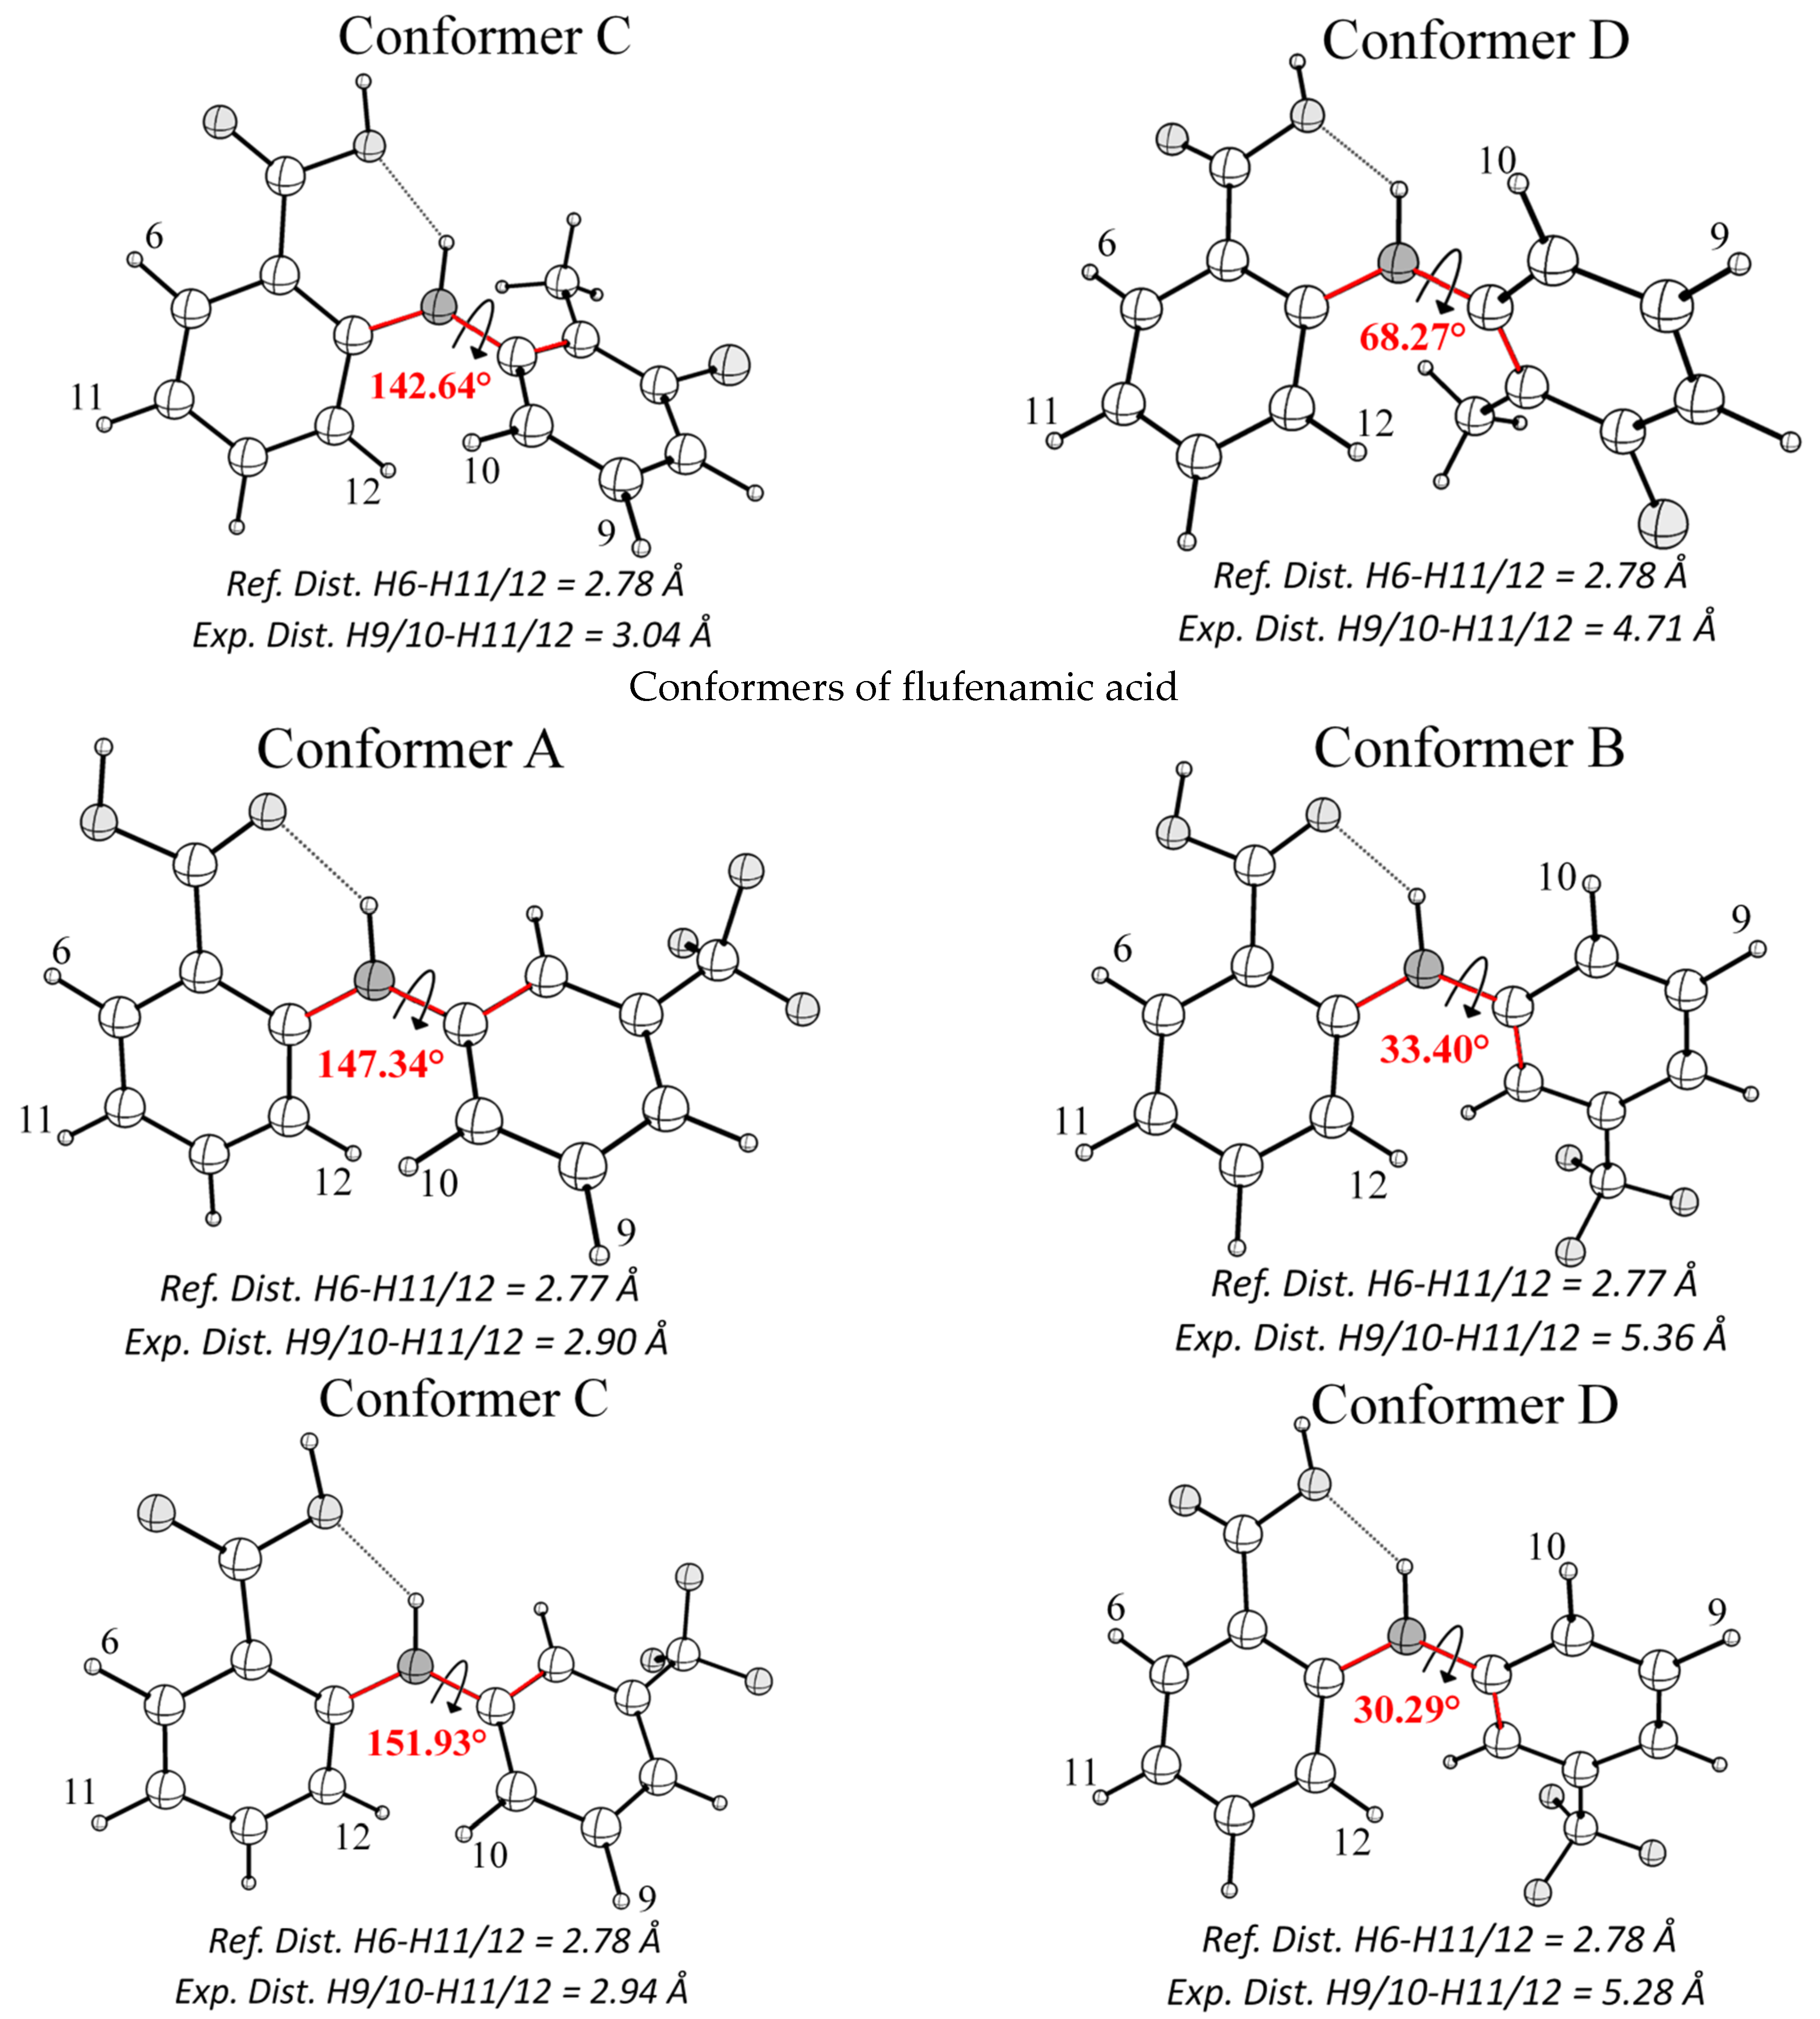
| Conformers Fenamates | A | B | C | D |
|---|---|---|---|---|
| MFA | 3.12 | 4.64 | 3.16 | 4.59 |
| TFA | 2.98 | 4.78 | 3.04 | 4.71 |
| FFA | 2.77 | 5.36 | 2.94 | 5.28 |


 | |||||
| Mefenamic Acid | Tolfenamic Acid | Flufenamic Acid | |||
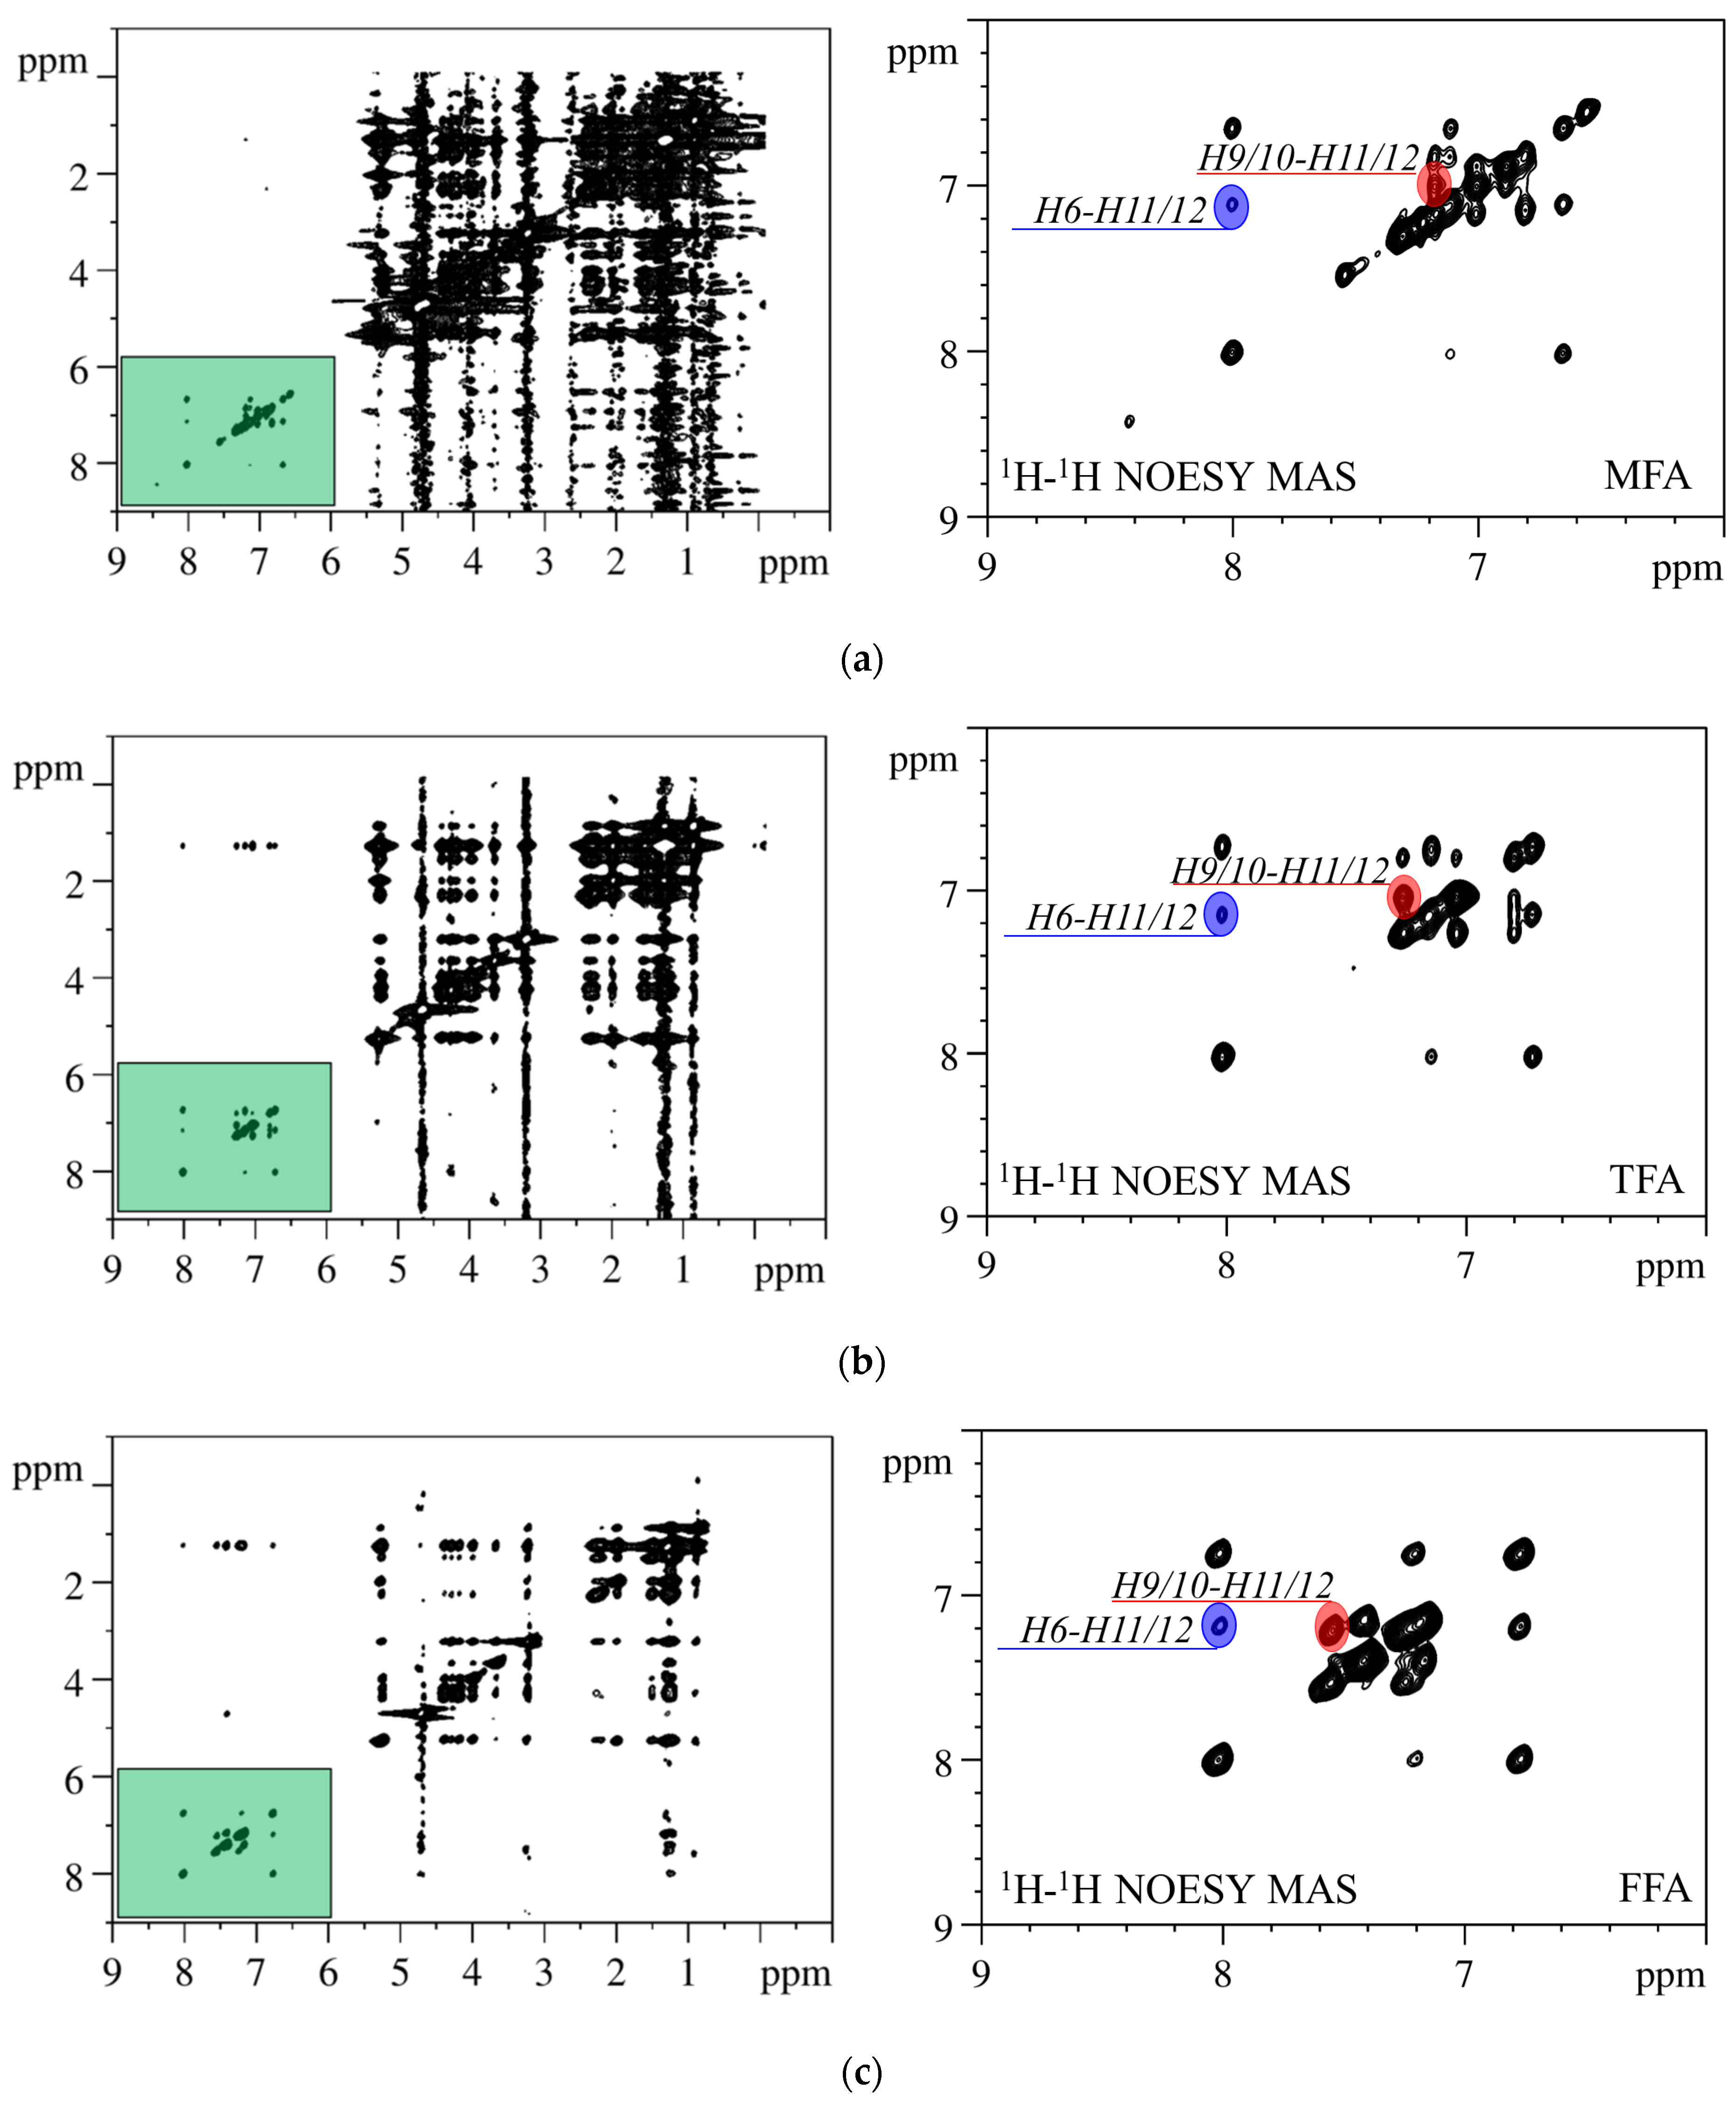
| 1H, assigned | δ, 1H (ppm) | 1H, assigned | δ, 1H (ppm) | 1H, assigned | δ, 1H (ppm) |
| H6 * | 8.02 | H6 | 8.03 | H6 | 8.01 |
| H11 * | 7.01 | H11 | 7.04 | H11 | 7.21 |
| H12 * | H12 | H12 | |||
| H10 * | 7.18 | H10 | 7.26 | H10 | 7.55 |
| H9 * | H9 | H9 | |||
| H8 | 7.13 | H8 | 7.15 | H8 | 7.42 |
| H5 | 6.76 | H5 | 6.76 | H5 | 6.79 |
References
- Busschaert, N.; Gale, P.A. Small-Molecule Lipid-Bilayer Anion Transporters for Biological Applications. Angew. Chem. Int. Ed. 2013, 52, 1374–1382. [Google Scholar] [CrossRef] [PubMed]
- Huang, D.; Zhao, T.; Xu, W.; Yang, T.; Cremer, P.S. Sensing Small Molecule Interactions with Lipid Membranes by Local pH Modulation. Anal. Chem. 2013, 85, 10240–10248. [Google Scholar] [CrossRef] [PubMed]
- Karimzadeh, S.; Safaei, B.; Jen, T.C. Prediction Effect of Ethanol Molecules on Doxorubicin Drug Delivery Using Single-Walled Carbon Nanotube Carrier through POPC Cell Membrane. J. Mol. Liq. 2021, 330, 115698. [Google Scholar] [CrossRef]
- Parry, M.J.; Alakoskela, J.M.I.; Khandelia, H.; Kumar, S.A.; Jäättelä, M.; Mahalka, A.K.; Kinnunen, P.K.J. High-Affinity Small Molecule-Phospholipid Complex Formation: Binding of Siramesine to Phosphatidic Acid. J. Am. Chem. Soc. 2008, 130, 12953–12960. [Google Scholar] [CrossRef] [PubMed]
- Peyret, A.; Ibarboure, E.; Le Meins, J.-F.; Lecommandoux, S.; Peyret, A.; Ibarboure, E.; Le Meins, J.; Lecommandoux, S. Asymmetric Hybrid Polymer–Lipid Giant Vesicles as Cell Membrane Mimics. Adv. Sci. 2018, 5, 1700453. [Google Scholar] [CrossRef]
- Smith, A.A.; Vogel, A.; Engberg, O.; Hildebrand, P.W.; Huster, D. A Method to Construct the Dynamic Landscape of a Bio-Membrane with Experiment and Simulation. Nat. Commun. 2022, 13, 108. [Google Scholar] [CrossRef]
- Mayne, C.G.; Arcario, M.J.; Mahinthichaichan, P.; Baylon, J.L.; Vermaas, J.V.; Navidpour, L.; Wen, P.C.; Thangapandian, S.; Tajkhorshid, E. The Cellular Membrane as a Mediator for Small Molecule Interaction with Membrane Proteins. Biochim. Biophys. Acta-Biomembr. 2016, 1858, 2290–2304. [Google Scholar] [CrossRef]
- Huster, D.; Arnold, K.; Gawrisch, K. Investigation of Lipid Organization in Biological Membranes by Two-Dimensional Nuclear Overhauser Enhancement Spectroscopy. J. Phys. Chem. B 1999, 103, 243–251. [Google Scholar] [CrossRef]
- Galván-Hernández, A.; Kobayashi, N.; Hernández-Cobos, J.; Antillón, A.; Nakabayashi, S.; Ortega-Blake, I. Morphology and Dynamics of Domains in Ergosterol or Cholesterol Containing Membranes. Biochim. Biophys. Acta-Biomembr. 2020, 1862, 183101. [Google Scholar] [CrossRef]
- Fonseca-Ornelas, L.; Eisbach, S.E.; Paulat, M.; Giller, K.; Fernández, C.O.; Outeiro, T.F.; Becker, S.; Zweckstetter, M. Small Molecule-Mediated Stabilization of Vesicle-Associated Helical α-Synuclein Inhibits Pathogenic Misfolding and Aggregation. Nat. Commun. 2014, 5, 5857. [Google Scholar] [CrossRef]
- Khodov, I.A.; Musabirova, G.S.; Klochkov, V.V.; Karataeva, F.K.; Huster, D.; Scheidt, H.A. Structural Details on the Interaction of Fenamates with Lipid Membranes. J. Mol. Liq. 2022, 367, 120502. [Google Scholar] [CrossRef]
- Ho Woo, D.; Han, I.S.; Jung, G. Mefenamic Acid-Induced Apoptosis in Human Liver Cancer Cell-Lines through Caspase-3 Pathway. Life Sci. 2004, 75, 2439–2449. [Google Scholar] [CrossRef]
- Zhu, W.; Smith, A.; Young, C.Y.F. A Nonsteroidal Anti-Inflammatory Drug, Flufenamic Acid, Inhibits the Expression of the Androgen Receptor in LNCaP Cells. Endocrinology 1999, 140, 5451–5454. [Google Scholar] [CrossRef]
- Kim, J.H.; Jung, J.Y.; Shim, J.H.; Kim, J.; Choi, K.H.; Shin, J.A.; Choi, E.S.; Lee, S.O.; Chintharlapalli, S.; Kwon, K.H.; et al. Apoptotic Effect of Tolfenamic Acid in KB Human Oral Cancer Cells: Possible Involvement of the p38 MAPK Pathway. J. Clin. Biochem. Nutr. 2010, 47, 74–80. [Google Scholar] [CrossRef]
- Belov, K.V.; Batista de Carvalho, L.A.E.; Dyshin, A.A.; Efimov, S.V.; Khodov, I.A. The Role of Hidden Conformers in Determination of Conformational Preferences of Mefenamic Acid by NOESY Spectroscopy. Pharmaceutics 2022, 14, 2276. [Google Scholar] [CrossRef]
- Belov, K.V.; Dyshin, A.A.; Krestyaninov, M.A.; Efimov, S.V.; Khodov, I.A.; Kiselev, M.G. Conformational Preferences of Tolfenamic Acid in DMSO-CO2 Solvent System by 2D NOESY. J. Mol. Liq. 2022, 367, 120481. [Google Scholar] [CrossRef]
- Khodov, I.A.; Belov, K.V.; Krestyaninov, M.A.; Dyshin, A.A.; Kiselev, M.G.; Krestov, G.A. Investigation of the Spatial Structure of Flufenamic Acid in Supercritical Carbon Dioxide Media via 2D NOESY. Materials 2023, 16, 1524. [Google Scholar] [CrossRef]
- Khodov, I.A.; Belov, K.V.; Krestyaninov, M.A.; Sobornova, V.V.; Dyshin, A.A.; Kiselev, M.G. Does DMSO Affect the Conformational Changes of Drug Molecules in Supercritical CO2 Media? J. Mol. Liq. 2023, in press. [Google Scholar] [CrossRef]
- Khodov, I.; Sobornova, V.; Mulloyarova, V.; Belov, K.; Dyshin, A.; de Carvalho, L.B.; Tolstoy, P.; Kiselev, M.; de Carvalho, L.B.; Tolstoy, P.; et al. Exploring the Conformational Equilibrium of Mefenamic Acid Released from Silica Aerogels via NMR Analysis. Int. J. Mol. Sci. 2023, 24, 6882. [Google Scholar] [CrossRef]
- Kremkow, J.; Luck, M.; Huster, D.; Müller, P.; Scheidt, H.A. Membrane Interaction of Ibuprofen with Cholesterol-Containing Lipid Membranes. Biomolecules 2020, 10, 1384. [Google Scholar] [CrossRef]
- Scheidt, H.A.; Pampel, A.; Nissler, L.; Gebhardt, R.; Huster, D. Investigation of the Membrane Localization and Distribution of Flavonoids by High-Resolution Magic Angle Spinning NMR Spectroscopy. Biochim. Biophys. Acta-Biomembr. 2004, 1663, 97–107. [Google Scholar] [CrossRef] [PubMed]
- Scheidt, H.A.H.A.; Huster, D. The Interaction of Small Molecules with Phospholipid Membranes Studied by 1H NOESY NMR under Magic-Angle Spinning. Acta Pharmacol. Sin. 2008, 29, 35–49. [Google Scholar] [CrossRef] [PubMed]
- Khodov, I.A.; Belov, K.V.; Dyshin, A.A.; Krestyaninov, M.A.; Kiselev, M.G. Pressure Effect on Lidocaine Conformational Equilibria in scCO2: A Study by 2D NOESY. J. Mol. Liq. 2022, 367, 120525. [Google Scholar] [CrossRef]
- Khodov, I.A.; Belov, K.V.; Krestyaninov, M.A.; Kiselev, M.G. Conformational Equilibria of a Thiadiazole Derivative in Solvents of Different Polarities: An NMR Study. Russ. J. Phys. Chem. A 2022, 96, 765–772. [Google Scholar] [CrossRef]
- Vögeli, B. The Nuclear Overhauser Effect from a Quantitative Perspective. Prog. Nucl. Magn. Reson. Spectrosc. 2014, 78, 1–46. [Google Scholar] [CrossRef]
- Gadiev, T.A.; Khairutdinov, B.I.; Shaikhutdinov, R.A.; Karatayeva, F.K.; Aganov, A.V.; Klochkov, V.V. Spatial Structure of Dimeric Capsules of Tetraurea Calix[4]arenes in Solutions According to 2-D NMR (NOESY) Spectroscopy. Appl. Magn. Reson. 2003, 25, 347–352. [Google Scholar] [CrossRef]
- Hu, H.; Krishnamurthy, K. Revisiting the Initial Rate Approximation in Kinetic NOE Measurements. J. Magn. Reson. 2006, 182, 173–177. [Google Scholar] [CrossRef]
- Selivanov, S.I.; Solov’ev, A.I.; Morozkina, S.N.; Shavva, A.G. An NMR Study of the Conformational Mobility of 7alpha,8alpha Analogues of Steroid Estrogens. Bioorg. Khim. 2007, 33, 324–331. [Google Scholar] [CrossRef]
- Butts, C.P.; Jones, C.R.; Towers, E.C.; Flynn, J.L.; Appleby, L.; Barron, N.J.; Barrona, N.J. Interproton Distance Determinations by NOE—Surprising Accuracy and Precision in a Rigid Organic Molecule. Org. Biomol. Chem. 2011, 9, 177–184. [Google Scholar] [CrossRef]
- Jones, C.R.; Butts, C.P.; Harvey, J.N. Accuracy in Determining Interproton Distances Using Nuclear Overhauser Effect Data from a Flexible Molecule. Beilstein J. Org. Chem. 2011, 7, 145–150. [Google Scholar] [CrossRef]
- Bame, J.; Hoeck, C.; Carrington, M.J.; Butts, C.P.; Jäger, C.M.; Croft, A.K. Improved NOE Fitting for Flexible Molecules Based on Molecular Mechanics Data-a Case Study with: S -Adenosylmethionine. Phys. Chem. Chem. Phys. 2018, 20, 7523–7531. [Google Scholar] [CrossRef]
- Graham, G.G. Fenamates. In Compendium of Inflammatory Diseases; Springer: Basel, Switzerland, 2016; pp. 477–482. [Google Scholar] [CrossRef]
- Forbes, J.; Bowers, J.; Shan, X.; Moran, L.; Oldfield, E.; Moscarello, M.A. Some New Developments in Solid-State Nuclear Magnetic Resonance Spectroscopic Studies of Lipids and Biological Membranes, Including the Effects of Cholesterol in Model and Natural Systems. J. Chem. Soc. Faraday Trans. 1 Phys. Chem. Condens. Phases 1988, 84, 3821–3849. [Google Scholar] [CrossRef]
- Smith, R.L.; Oldfield, E. Dynamic Structure of Membranes by Deuterium NMR. Science 1984, 225, 280–288. [Google Scholar] [CrossRef]
- Sargent, D.F.; Schwyzer, R. Membrane Lipid Phase as Catalyst for Peptide-Receptor Interactions. Proc. Natl. Acad. Sci. USA 1986, 83, 5774–5778. [Google Scholar] [CrossRef]
- Gawrisch, K.; Gaede, H.C.; Mihailescu, M.; White, S.H. Hydration of POPC Bilayers Studied by 1H-PFG-MAS-NOESY and Neutron Diffraction. Eur. Biophys. J. 2007, 36, 281–291. [Google Scholar] [CrossRef]
- Hartrampf, N.; Leitao, S.M.; Winter, N.; Toombs-Ruane, H.; Frank, J.A.; Schwille, P.; Trauner, D.; Franquelim, H.G. Structural Diversity of Photoswitchable Sphingolipids for Optodynamic Control of Lipid Microdomains. Biophys. J. 2023, 122, 2325–2341. [Google Scholar] [CrossRef]
- Meredith, S.A.; Kusunoki, Y.; Connell, S.D.; Morigaki, K.; Evans, S.D.; Adams, P.G. Exploring the Self-Quenching of Fluorescent Probes Incorporated into Model Lipid Membranes Using Electrophoresis and Fluorescence Lifetime Imaging Microscopy. Biophys. J. 2023, 122, 222a–223a. [Google Scholar] [CrossRef]
- Mobley, W.C.; Schreier, H. Phase Transition Temperature Reduction and Glass Formation in Dehydroprotected Lyophilized Liposomes. J. Control Release 1994, 31, 73–87. [Google Scholar] [CrossRef]
- Penk, A.; Müller, M.; Scheidt, H.A.; Langosch, D.; Huster, D. Structure and Dynamics of the Lipid Modifications of a Transmembrane α-Helical Peptide Determined by 2H Solid-State NMR Spectroscopy. Biochim. Biophys. Acta-Biomembr. 2011, 1808, 784–791. [Google Scholar] [CrossRef]
- Schwerk, U.; Michel, D. H NOESY NMR on Adsorbed Molecules. J. Phys. Chem. 1996, 100, 352–356. [Google Scholar] [CrossRef]
- Zheng, L.; Herzfeld, J.; Fishbein, K.W.; Griffin, R.G. Two-Dimensional Solid-State 1H-NMR and Proton Exchange. J. Am. Chem. Soc. 1993, 115, 6254–6261. [Google Scholar] [CrossRef]
- Uzoh, O.G.; Galek, P.T.A.; Price, S.L. Analysis of the Conformational Profiles of Fenamates Shows Route towards Novel, Higher Accuracy, Force-Fields for Pharmaceuticals. Phys. Chem. Chem. Phys. 2015, 17, 7936–7948. [Google Scholar] [CrossRef] [PubMed]
- Du, W.; Gong, Y.; Xu, Y.; Zhang, X.; Zhang, L.; Wang, S.; Xiang, J.; Tang, N. Can the Crystal of Conformational Polymorph Nucleate Directly from Its Conformer? The Case of Flufenamic Acid. Cryst. Growth Des. 2021, 21, 3592–3601. [Google Scholar] [CrossRef]
- Liu, Y.; Xu, S.; Zhang, X.; Tang, W.; Gong, J. Unveiling the Critical Roles of Aromatic Interactions in the Crystal Nucleation Pathway of Flufenamic Acid. Cryst. Growth Des. 2019, 19, 7175–7184. [Google Scholar] [CrossRef]
- Abdul Mudalip, S.K.; Adam, F.; Abu Bakar, M.R. Evaluation of the Intermolecular Interactions and Polymorphism of Mefenamic Acid Crystals in N,N-Dimethyl Formamide Solution: A Molecular Dynamics Simulation and Experimental Study. Comptes Rendus Chim. 2019, 22, 771–778. [Google Scholar] [CrossRef]
- Blade, H.; Blundell, C.D.; Brown, S.P.; Carson, J.; Dannatt, H.R.W.; Hughes, L.P.; Menakath, A.K. Conformations in Solution and in Solid-State Polymorphs: Correlating Experimental and Calculated Nuclear Magnetic Resonance Chemical Shifts for Tolfenamic Acid. J. Phys. Chem. A 2020, 124, 8959–8977. [Google Scholar] [CrossRef]
- Macur, S.; Farmer, B.T.; Brown, L.R. An Improved Method for the Determination of Cross-Relaxation Rates from NOE Data. J. Magn. Reson. 1986, 70, 493–499. [Google Scholar] [CrossRef]
- Belov, K.V.; Batista de Carvalho, L.A.E.; Dyshin, A.A.; Kiselev, M.G.; Sobornova, V.V.; Khodov, I.A. Conformational Analysis of Mefenamic Acid in scCO2-DMSO by the 2D NOESY Method. Russ. J. Phys. Chem. B 2023, 16, 1191–1199. [Google Scholar] [CrossRef]
- Na, M.W.; Jeong, S.Y.; Ko, Y.J.; Kang, D.M.; Pang, C.; Ahn, M.J.; Kim, K.H. Chemical Investigation of Tetradium Ruticarpum Fruits and Their Antibacterial Activity against Helicobacter Pylori. ACS Omega 2022, 7, 23736–23743. [Google Scholar] [CrossRef]
- Williamson, M.P.; Neuhaus, D. Symmetry in NOE Spectra. J. Magn. Reson. 1987, 72, 369–375. [Google Scholar] [CrossRef]
- Gadiev, T.A.; Khairutdinov, B.I.; Antipin, I.S.; Klochkov, V.V. Analysis of the Spatial Structure of Calixarenes in Solutions by 2-D NMR (NOESY) Spectroscopy. Appl. Magn. Reson. 2006, 30, 165–173. [Google Scholar] [CrossRef]
- Butts, C.P.; Jones, C.R.; Harvey, J.N. High Precision NOEs as a Probe for Low Level Conformers—A Second Conformation of Strychnine. Chem. Commun. 2011, 47, 1193–1195. [Google Scholar] [CrossRef]
- Kjellberg, A.; Widmalm, G.G. A Conformational Study of the Vicinally Branched Trisaccharide β-D- Glcp-(1 → 2)[β-D-Glcp-(1 → 3)]α-D-Manp-OMe by Nuclear Overhauser Effect Spectroscopy (NOESY) and Transverse Rotating-Frame Overhauser Effect Spectroscopy (TROESY) Experiments: Comparison. Biopolymers 1999, 50, 391–399. [Google Scholar] [CrossRef]
- Macura, S.; Ernst, R.R. Elucidation of Cross Relaxation in Liquids by Two-Dimensional N.M.R. Spectroscopy. Mol. Phys. 1980, 41, 95–117. [Google Scholar] [CrossRef]
- SeethaLekshmi, S.; Row, T.N.G. Conformational Polymorphism in a Non-Steroidal Anti-Inflammatory Drug, Mefenamic Acid. Cryst. Growth Des. 2012, 12, 4283–4289. [Google Scholar] [CrossRef]
- Lozano, J.J.; Pouplana, R.; López, M.; Ruiz, J. Conformational Analysis of the Antiinflammatory Fenamates: A Molecular Mechanics and Semiempirical Molecular Orbital Study. J. Mol. Struct. Theochem. 1995, 335, 215–227. [Google Scholar] [CrossRef]
- López-Mejías, V.; Kampf, J.W.J.W.; Matzger, A.J.A.J. Polymer-Induced Heteronucleation of Tolfenamic Acid: Structural Investigation of a Pentamorph. J. Am. Chem. Soc. 2009, 131, 4554–4555. [Google Scholar] [CrossRef]
- Case, D.H.; Srirambhatla, V.K.; Guo, R.; Watson, R.E.; Price, L.S.; Polyzois, H.; Cockcroft, J.K.; Florence, A.J.; Tocher, D.A.; Price, S.L. Successful Computationally Directed Templating of Metastable Pharmaceutical Polymorphs. Cryst. Growth Des. 2018, 18, 5322–5331. [Google Scholar] [CrossRef]
- Ranjan, S.; Devarapalli, R.; Kundu, S.; Saha, S.; Deolka, S.; Vangala, V.R.; Reddy, C.M. Isomorphism: “Molecular Similarity to Crystal Structure Similarity” in Multicomponent Forms of Analgesic Drugs Tolfenamic and Mefenamic Acid. IUCrJ 2020, 7, 173–183. [Google Scholar] [CrossRef]
- Sacchi, P.; Reutzel-Edens, S.M.; Cruz-Cabeza, A.J. The Unexpected Discovery of the Ninth Polymorph of Tolfenamic Acid. CrystEngComm 2021, 23, 3636–3647. [Google Scholar] [CrossRef]
- Quiñones, R.; Brown, R.T.; Searls, N.; Richards-Waugh, L. Study of Polymorphism Using Patterned Self-Assembled Monolayers Approach on Metal Substrates. Appl. Surf. Sci. 2018, 427, 97–105. [Google Scholar] [CrossRef]
- Mattei, A.; Li, T. Polymorph Formation and Nucleation Mechanism of Tolfenamic Acid in Solution: An Investigation of Pre-Nucleation Solute Association. Pharm. Res. 2012, 29, 460–470. [Google Scholar] [CrossRef] [PubMed]
- Delaney, S.P.; Smith, T.M.; Korter, T.M. Conformational Origins of Polymorphism in Two Forms of Flufenamic Acid. J. Mol. Struct. 2014, 1078, 83–89. [Google Scholar] [CrossRef]
- López-Mejías, V.; Kampf, J.W.; Matzger, A.J. Nonamorphism in Flufenamic Acid and a New Record for a Polymorphic Compound with Solved Structures. J. Am. Chem. Soc. 2012, 134, 9872–9875. [Google Scholar] [CrossRef]
- Liu, Y.; Yang, P.; Zhang, K.; Xu, J.; Wu, S.; Gong, J. Bendable and Twistable Crystals of Flufenamic Acid Form III with Bending Mechanofluorochromism Behavior. Cryst. Growth Des. 2021, 22, 1312–1318. [Google Scholar] [CrossRef]
- Tyler, A.R.; Ragbirsingh, R.; McMonagle, C.J.; Waddell, P.G.; Heaps, S.E.; Steed, J.W.; Thaw, P.; Hall, M.J.; Probert, M.R. Encapsulated Nanodroplet Crystallization of Organic-Soluble Small Molecules. Chem 2020, 6, 1755–1765. [Google Scholar] [CrossRef]
- Belov, K.V.; Dyshin, A.A.; Kiselev, M.G.; Krestyaninov, M.A.; Sobornova, V.V.; Khodov, I.A. Determination of the Spatial Structure of Lidocaine in SC-CO2 by the 2D NOESY Method. Russ. J. Phys. Chem. B 2021, 15, 1303–1309. [Google Scholar] [CrossRef]
- Wang, Z.; Felstead, H.R.; Troup, R.I.; Linclau, B.; Williamson, P.T.F. Lipophilicity Modulations by Fluorination Correlate with Membrane Partitioning. Angew. Chemie Int. Ed. 2023, 62, e202301077. [Google Scholar] [CrossRef]


Disclaimer/Publisher’s Note: The statements, opinions and data contained in all publications are solely those of the individual author(s) and contributor(s) and not of MDPI and/or the editor(s). MDPI and/or the editor(s) disclaim responsibility for any injury to people or property resulting from any ideas, methods, instructions or products referred to in the content. |
© 2023 by the authors. Licensee MDPI, Basel, Switzerland. This article is an open access article distributed under the terms and conditions of the Creative Commons Attribution (CC BY) license (https://creativecommons.org/licenses/by/4.0/).
Share and Cite
Khodov, I.A.; Belov, K.V.; Huster, D.; Scheidt, H.A. Conformational State of Fenamates at the Membrane Interface: A MAS NOESY Study. Membranes 2023, 13, 607. https://doi.org/10.3390/membranes13060607
Khodov IA, Belov KV, Huster D, Scheidt HA. Conformational State of Fenamates at the Membrane Interface: A MAS NOESY Study. Membranes. 2023; 13(6):607. https://doi.org/10.3390/membranes13060607
Chicago/Turabian StyleKhodov, Ilya A., Konstantin V. Belov, Daniel Huster, and Holger A. Scheidt. 2023. "Conformational State of Fenamates at the Membrane Interface: A MAS NOESY Study" Membranes 13, no. 6: 607. https://doi.org/10.3390/membranes13060607
APA StyleKhodov, I. A., Belov, K. V., Huster, D., & Scheidt, H. A. (2023). Conformational State of Fenamates at the Membrane Interface: A MAS NOESY Study. Membranes, 13(6), 607. https://doi.org/10.3390/membranes13060607