3.1. Morphology and Physical Characterization
In order to investigate the effect of the modification process on the morphology of the membrane as well as on the change in the physical properties of the membranes, SEM images were taken and compared.
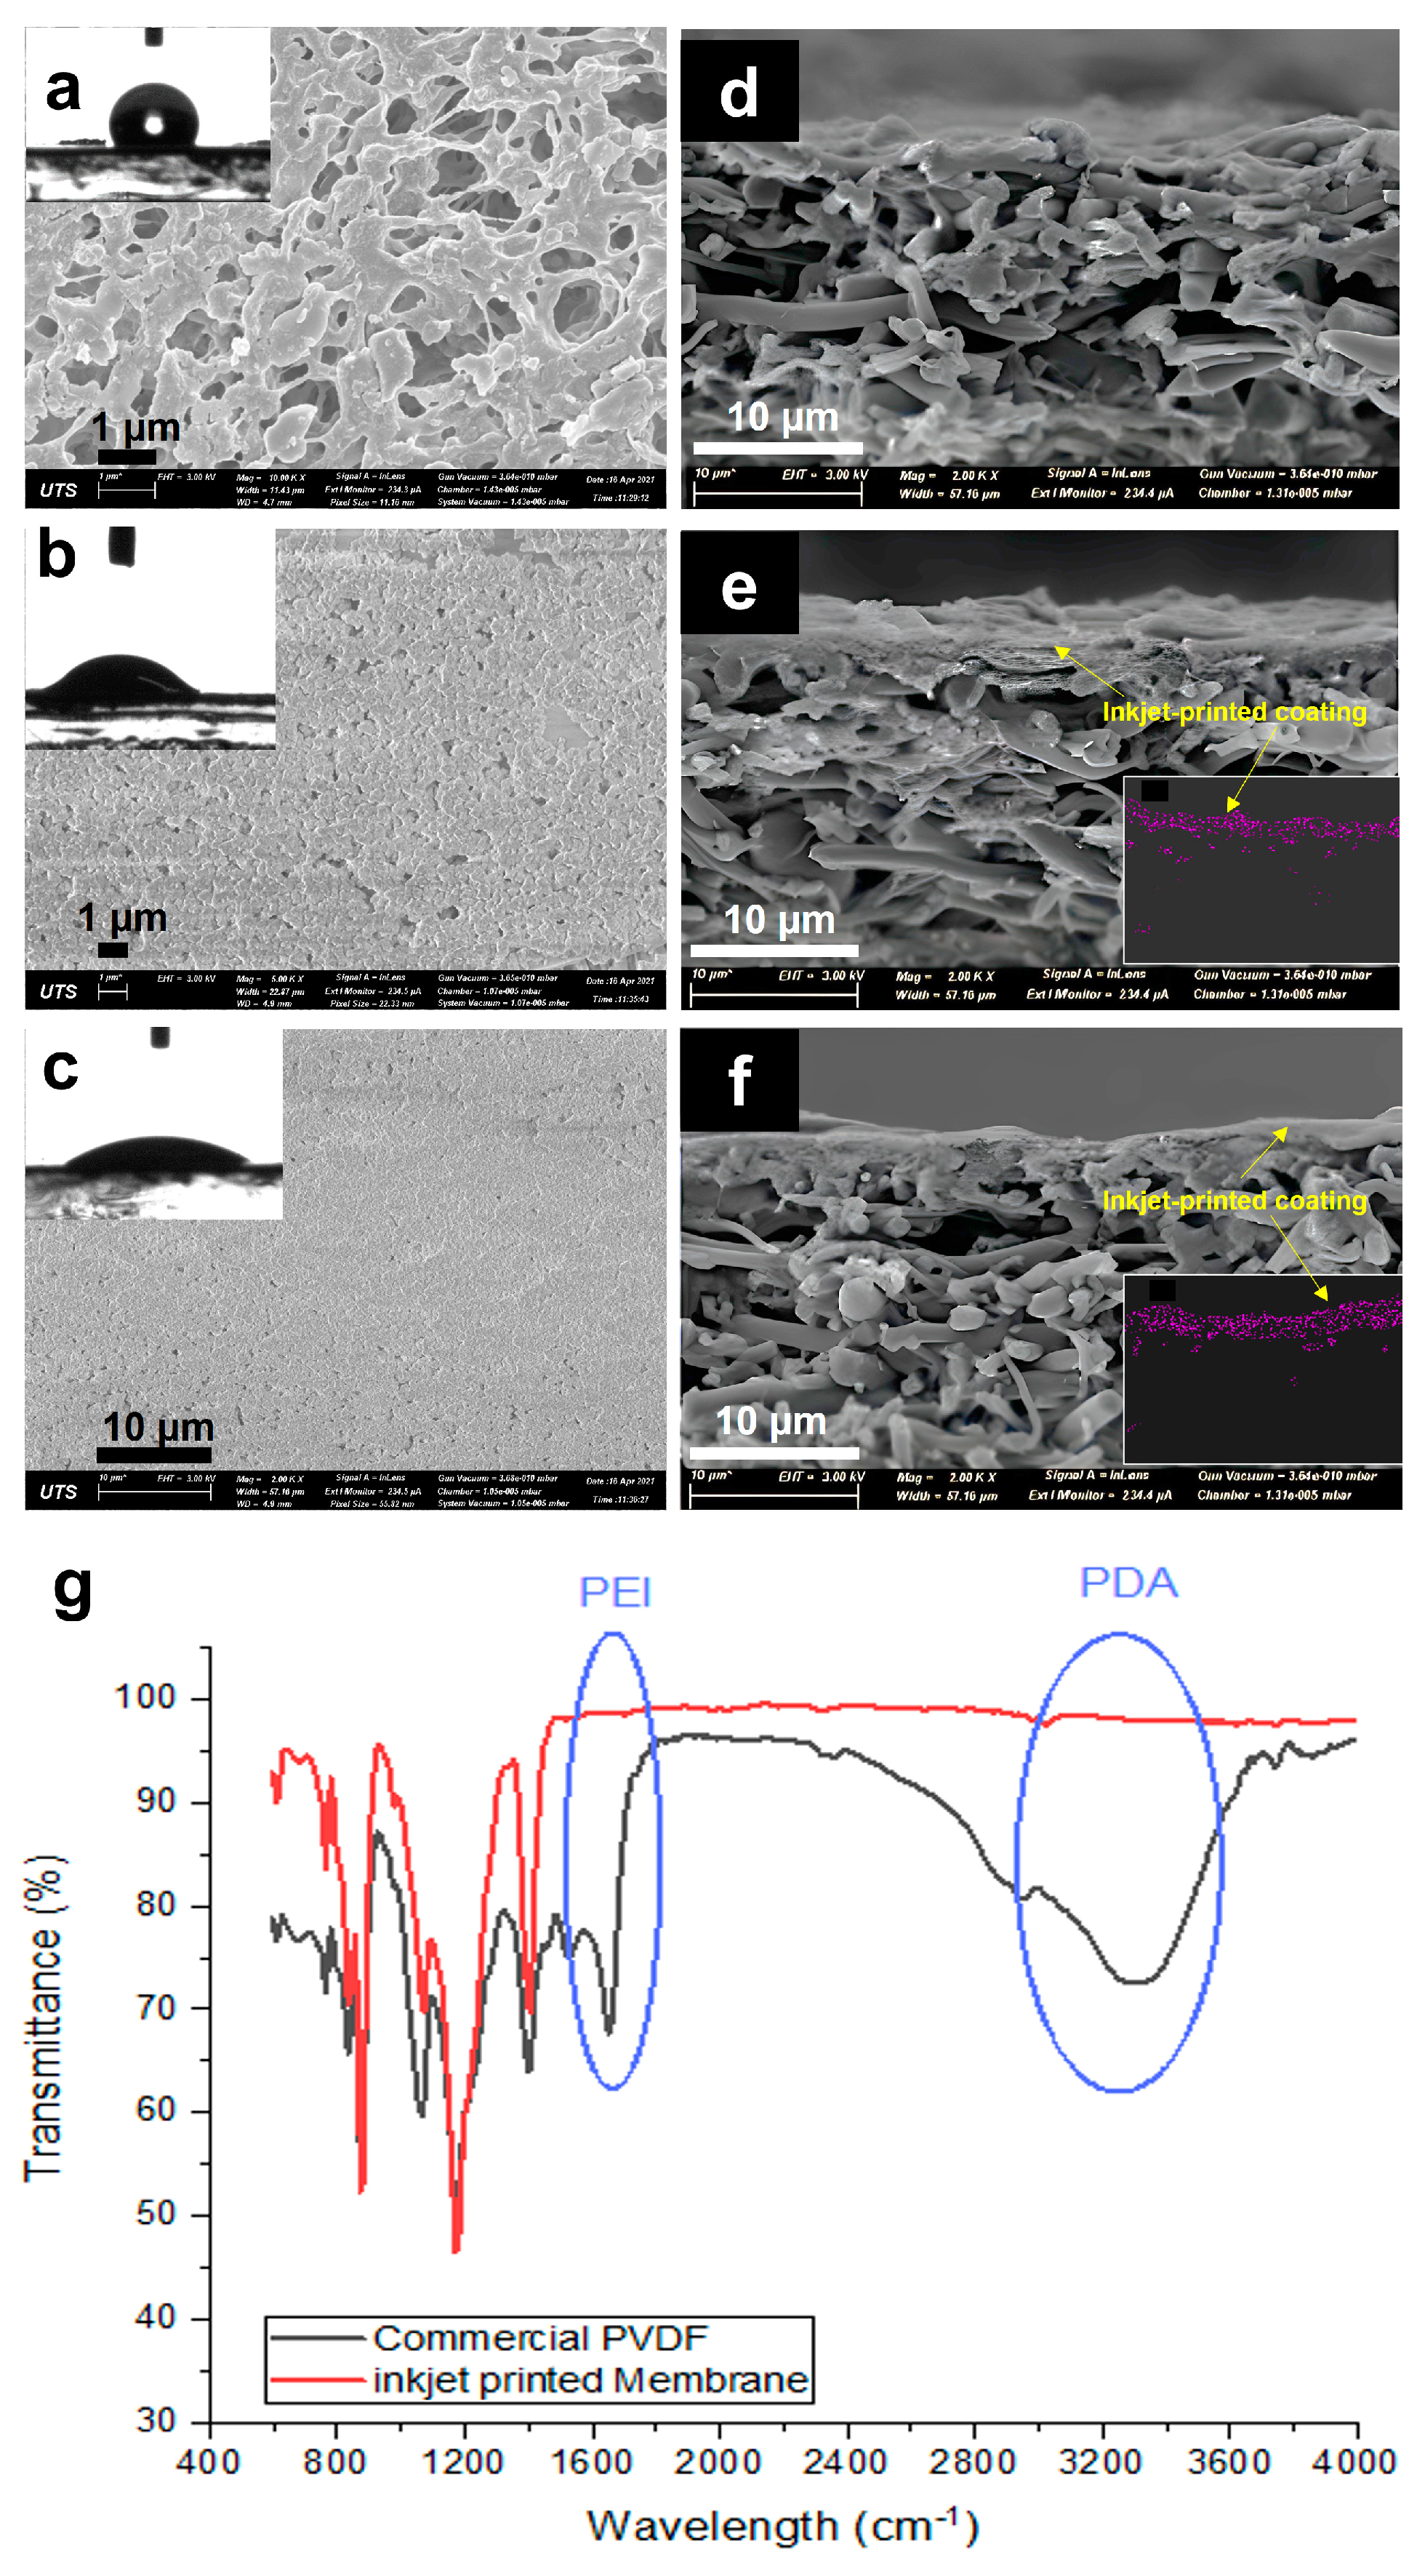
Figure 3 shows the SEM images of the top surface and cross-section of the commercial and modified membranes and the corresponding FTIR spectra. The commercial membrane (
Figure 3a) showed a highly microporous surface with interconnected pores. The cross-sectional image (
Figure 3b) proves the symmetric structure of the membrane, which provides homogenous distribution of the porosity through the depth of the membrane. After inkjet modification, a homogenous layer was seen to cover the membrane surface and did not affect much of the bulk PVDF substrate. At the one-layer coating, the surface pores of the commercial membrane started to diminish, with only small pores left visible. It is indicated that the one-layer coating was insufficient for homogeneous coverage of the pristine membrane surface, with some parts showing defects. The cross-section showed an asymmetric structure that was composed of a thin hydrophilic coating and a thick hydrophobic pristine PVDF membrane. While the three-layer printing showed a much more uniform and homogenous coating over the surface of the membrane, with much fewer visible pores left. This indicates a better coating at a higher number of printing layers. The cross-sectional images (
Figure 3e,f) confirm the presence of the printed layers on top of the membrane surface, with the three layers showing a bit of a thicker coating (~4 µm compared to 2 µm for one-layer). There is also a partial penetration of the top layer coating to the pristine base membrane, which provides a good anchor to the base membrane [
19]. To further confirm the successful deposition of the printed coating layers on the membrane surface and to help estimate the layer thickness, the membranes used for the NaCl test were dried. EDS mapping was then taken to measure the amount of sodium on the membrane surface. Insets in
Figure 3e,f show the presence of Na on the top hydrophilic layer, indicating that salt only stayed at the top hydrated layer and did not penetrate the bottom hydrophobic layer. This EDS map also gives an estimate of the thickness of the hydrophilic inkjet-printed layer.
Further confirming the successful printing of the hydrophilic layer is through the ATR-FTIR analyses of the membranes.
Figure 3g shows new peaks for the inkjet-printed membrane (3-layers) in comparison to the unmodified commercial PVDF membrane at around 3300 cm
−1, which is attributed to the presence of PDA relating to N−H and O−H stretching vibrations [
20], verifying the polymerization of DA on the surface of the membrane. Furthermore, the peak at around 1648 cm
−1 that corresponds to the stretching vibration of the C=N bonds [
21] indicates the presence of PEI, which provides amine functional groups for hydrogen bonding and added hydrophilic property.
Table 1 shows the various physical characteristics of the commercial and modified membranes. As shown in the table, the overall porosity of the membrane showed only a slight decrease with the addition of very thin hydrophilic coating layers. The thickness of the hydrophilic layer is too thin that when compared to the bulk membrane thickness, it is just too small, as seen in the thickness measurement results. This result indicates that the negligible PDA-PEI hydrophilic thickness did not alter much of the membrane porosity.
3.2. Contact Angle (CA)
The water and oil wettability of the surface of commercial and modified membranes was analyzed by a sessile drop method to measure the contact angles. The insets of
Figure 3 present the corresponding in-air water contact angles (WCA). The pristine PVDF membrane showed a WCA of 117°, indicating a hydrophobic surface. However, after the inkjet printing modification, the WCA of the 1-P membrane decreased to 34°, while for the 3-P membrane, it further reduced to 26°. Both printed membranes indicated hydrophilic surface modification, which confirms the presence of the successful coating of the hydrophilic layers. The better hydrophilicity of 3-P membrane could be due to a more uniform and homogenous coating along the surface of the membrane. This change in wettability enables the membrane to resist hydrophobic interaction with hydrophobic foulants such as oil [
19].
We further tested the membrane for its in-air oil wettability, using a similar procedure for WCA measurement but using mineral oil. The commercial membrane showed quite in-air oleophilic behavior, continuously decreasing the CA of oil droplets to less than 10°, while the 1-P membrane showed an in-air OCA of 51° and revealed a higher repulsion than the commercial membrane. The in-air OCA for the 3-P membrane was even higher, almost reaching hydrophobic behavior (85°). However, for the membrane to have an anti-oil fouling effect, the membrane needs to have underwater oleophobicity. Thus, we tested our modified membranes for their oil contact angle underwater (last column in
Table 1). The underwater OCA was measured by the immersion of membranes in DI water and the placement of oil drops on the membrane. The underwater OCA results showed that the oil droplet directly spread on the commercial membrane, showing high oleophilicity of the membrane in underwater condition. However, the inkjet-modified membranes showed a different behavior, with the underwater OCA for the 1-P and 3-P membranes reaching 93° and 152°, respectively. This result shows an acceptable oleophobicity of the modified membrane. This result is attributed to the formation of a hydration layer due to the presence of the thin hydrophilic layer. In other words, the hydrophilic characteristic of a coated layer increases the interaction of water and membrane and can prevent the attachment of oil droplets onto the membrane surface [
22]. This interaction was derived due to the presence of hydrophilic functional groups such as amine, which provides strong hydrogen bonding with water droplets, which forms an interfacial hydration layer [
23] and increases the oleophobicity of the modified surface, especially at an increasing thickness of the printed layer. The hydrogen bonding is strong and needs a high energy demand to destruct, whereas oil cannot afford this value of energy to adsorb on the surface and foul the membrane.
3.3. Liquid Entry Pressure (LEP)
LEP, which is the minimum transmembrane pressure needed for a liquid to penetrate the largest pore of the membrane, is an important parameter for the long-term performance of MD [
24]. LEP is measured based on the Young–Laplace equation, which is a function of the geometric pore coefficient, the surface tension of the liquid, the wettability of the surface, and is inversely proportional to the maximum pore size. The LEP results (see
Table 1) indicated that the commercial membrane had the highest LEP at 225 kPa, while the inkjet-modified membranes had slightly lower LEPs. This is interesting, as even though there was an addition of a hydrophilic layer, there was not much reduction in the LEP of the modified membrane in the range of 205–215 kPa. The LEP values for the 1-P and 3-P membranes were approximately similar. Other studies have also observed similar results where the addition of a thin hydrophilic layer barely influenced the LEP of the membrane [
22]. The small reduction in LEP may be due to minimal penetration of the hydrophilic coating layer into the membrane, wherein the total length of the hydrophobic membrane base is slightly changed. However, for D-P, wherein the two sides have been inkjet print-coated, there must be an added penetration at the other side of the membrane where there is a bigger pore size; thus, this penetration has resulted in the lowering of the effective thickness of the pristine hydrophobic base membrane. In other words, the inkjet printing provided a homogenous and thin-thickness layer that prevented the high intrusion of the coating solution into the membrane’s pores and limited the decrease in the membrane’s LEP. As the inkjet printing did not really affect the pore size and porosity much (as presented in
Table 1), the membranes still maintained their intrinsic characteristics, making them attractive for MD application.
3.4. DCMD and Anti-Oil Fouling Test
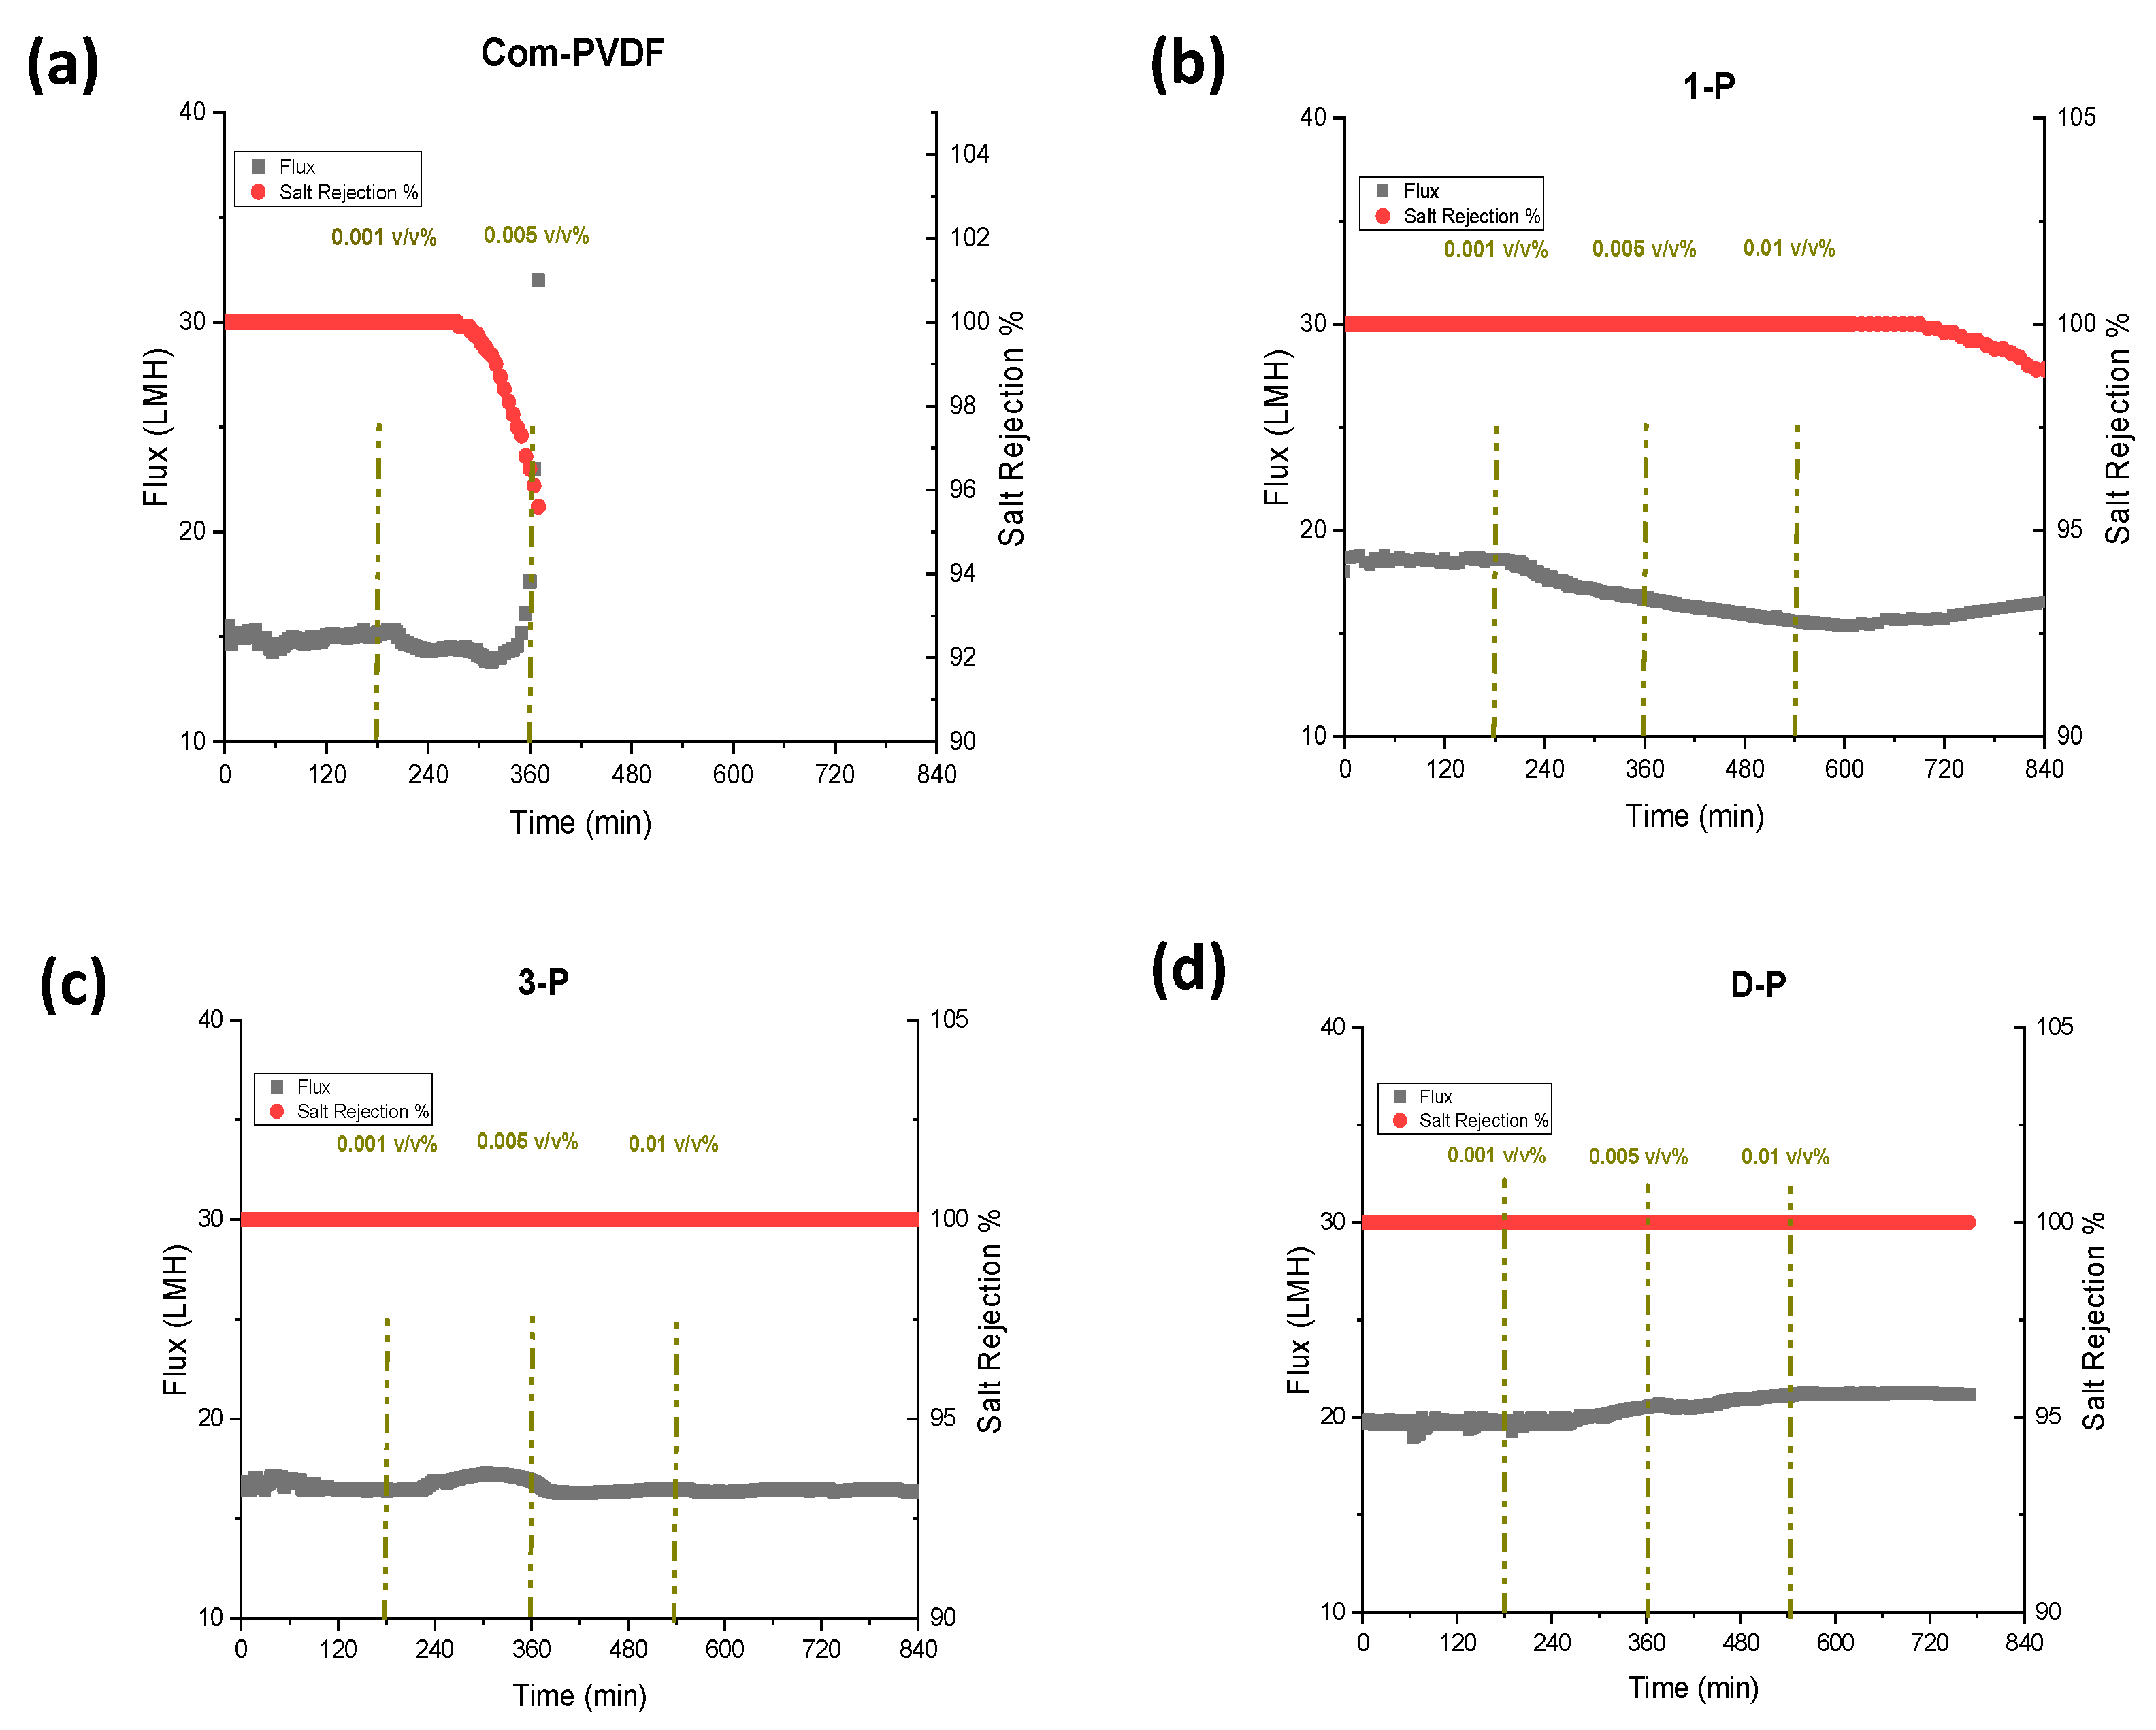
Figure 4 presents the results for DCMD tests at a feed solution of 35 g/L NaCl and at feed and permeate inlet temperatures of 60 °C and 20 °C, respectively. During the tests, the first three hours were only the 35 g/L NaCl solution without the oil addition was used, after which various oil emulsion concentrations (0.001, 0.005, and 0.01 v/v% of oil) were added to the feed solution at 3 h intervals. The oil emulsion was prepared by first dispersing oil in water, and a small amount of Tween 80 as a surfactant was added and stirred using a high-speed mechanical mixer. From
Figure 4a, the commercial membrane showed a constant flux of 15 LMH for the first 3 h, and then after adding 0.001 v/v% of mineral oil, the flux started to decrease, but the salt rejection remained stable and constant (100%). This indicated that the mineral oil has a high tendency to adhere to a hydrophobic membrane and gradually fouled the membrane covering the pores because of the long-range hydrophobic–hydrophobic interaction [
25,
26], thus declining the flux. However, the rejection still remained high for quite some time, and started to decrease after more than 2 h of additional operation. However, at a point where 0.005 v/v% was added, the flux started to increase, indicating that wetting had slowly occurred and that the rejection was further reduced. This could be attributed to the bridging effect, when some salts penetrate with the oil filling the pores, resulting in some water molecules bridging to the other side of the membrane to start wetting. This result shows a very weak performance of commercial membranes in oil-containing feedwater.
On the other hand, the test using the 1-P membrane showed a slightly higher flux at 18 LMH in the first few hours, which showed a small enhancement compared to a commercial PVDF membrane. This slight increase can be attributed to the potentially decreased thickness of the hydrophobic layer due to the small penetration of the hydrophilic coated layer that improved the mass transfer coefficient. The addition of 0.001 and 0.005 v/v% led to a gradual decrease in flux, indicating a partial fouling formation. The salt rejection in the first steps remained constant. Afterwards, at a 0.01 v/v% oil addition, the flux started to increase along with the decrease in salt rejection, indicating that the wetting of the membrane started to occur at this high oil concentration.
The 3-P membrane (
Figure 4c) showed a lower flux than the 1-P membrane but was still higher than the commercial membrane. This could be due to the way the inkjet printing process for the second and third printing was conducted. In printing the first layer, the solution tends to intrude into the top part of the membrane and slightly decreases the bulk hydrophobic layer thickness, which could have caused an increase in the flux. After the completion of the polymerization step, the first layer plays as a barrier against the intrusion of the second- and third-layer’s printed solution onto the membrane. Therefore, further printing just makes a barrier against water transmission to the hydrophobic layer that can slightly decrease the flux. Even when the oil concentration was increased in the feed, the flux and salt rejection remained constant throughout the test, which indicated that there was no fouling or wetting that occurred during the test. This could be due to the interaction between the water molecules and the hydrophilic layer that maintains a hydration layer that prevents oil from attaching to the surface [
27]. This makes the 3-P membrane an attractive membrane with oil-fouling resistivity in MD. With this positive enhancement of oil resistivity, we also prepared a membrane with 3-layer printing, but this time, at both sides of the membrane (D-P membrane). It is interesting to see from
Figure 4d that the D-P membrane obtained the highest flux among the prepared membranes, at 20 LMH, which is 30% higher than the commercial membrane. This enhancement in the flux is attributed to the decrease in the hydrophobic membranes bulk’s thickness due to the slight penetration of the hydrophilic inkjet coating on both sides of the membrane, which reduces the mass transfer resistance and accelerates the condensation process. The presence of a hydrophilic layer on the permeate side does not have an influence on the anti-oil fouling performance of the membrane but can accelerate the condensation of the water vapor as well as help the mechanical stability of the hydrophobic membranes with lower thicknesses. The combination of an oil-barrier layer on the feed side and a hydrophilic layer on the permeate side enhanced the flux without sacrificing the salt rejection performance of the membrane. The membrane showed an approximately stable performance throughout the test with a complete salt rejection. This result implies that the use of inkjet printing as a coating technique is a good approach for uniform and homogenous coating of the hydrophilic layer to the membrane surface only, without compromising the hydrophobicity of the pristine PVDF base membrane material that maintains high rejection, and therefore improved the MD performance. This approach of providing both hydrophilicity and oleophobicity on the membrane, rather than just hydrophilicity for fouling control, has also been reported in the literature [
22,
28].
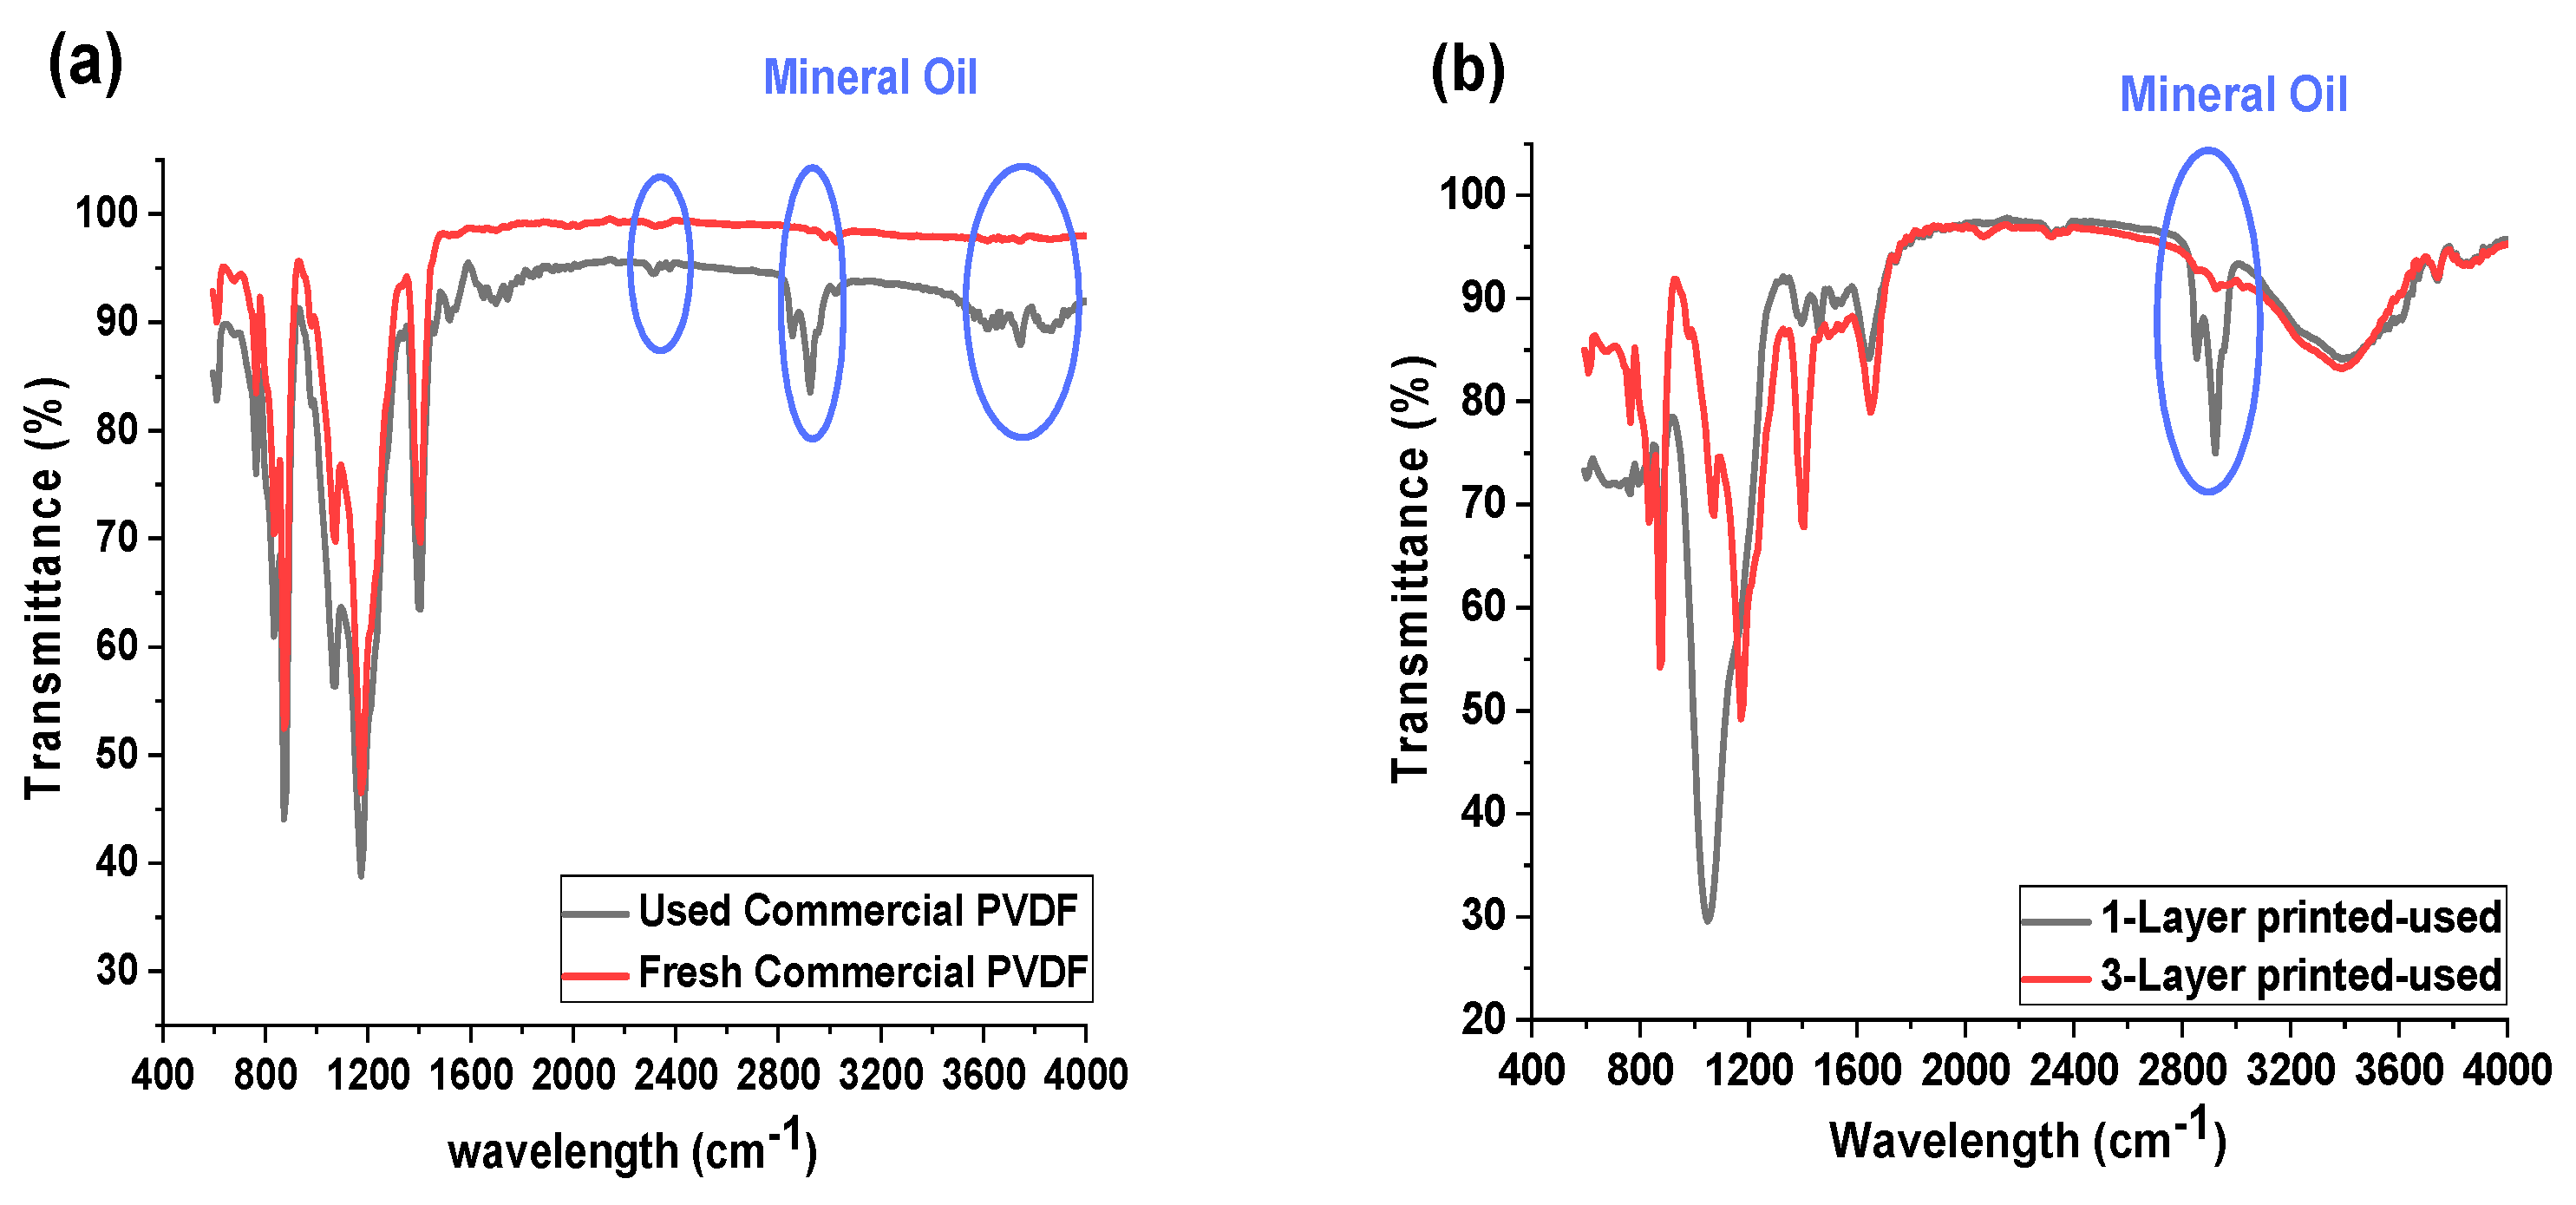
Figure 5 shows the ATR-FTIR spectra of the commercial and inkjet-printed membranes before and after the oil-fouling test. FTIR analysis can be used for the determination of the attachment of fouling agents onto the membranes [
18]. The FTIR results obtained several new peaks, which are representative for the mineral oil for the commercial membrane (
Figure 5a) after the test. This confirms that oil has adhered to the commercial membrane surface. Similarly, for the 1-P membrane, the same peaks for mineral oil appeared on its FTIR data (
Figure 5b), which also corroborates the result for the flux performance, with the decrease in the flux data for the 1-P membrane due to the oil fouling layer formation on the membrane. However, the membrane coated with a three-layer hydrophilic material (3-P) showed no mineral oil peaks and revealed a high membrane resistivity against fouling. This result proves the lower interaction between mineral oil and a hydrophobic membrane in a higher thickness of the hydrophilic layer that directed no fouling to the membrane, while the 1-P membrane still retains the mineral oil-hydrophobic interaction, which in the long term, caused fouling of the membrane.
Furthermore, we also investigated the effect of salinity, with and without oil contaminant, on the DCMD performance of the unmodified commercial PVDF and the inkjet-modified Janus membranes. As shown in
Figure 6a, the flux of all the membranes decreased with an increase in salinity. In general, the flux in the MD systems depends on the driving force provided by the difference in vapor pressure of the liquids on both sides of the membrane. According to the thermodynamic correlations, the vapor pressure of the liquids directly depends on the temperature. Therefore, the temperature difference between the two sides of the membrane makes a vapor pressure gradient and is the main source of the driving force of MD. However, the temperature difference is not the only influential parameter, and the driving force also depends on other factors, such as salinity. In fact, the vapor pressure of the feedwater is affected by the activity of the water on the surface, which is measured according to the molality of the feedwater [
19]. The results prove that the flux of the membrane decreased by about 20% with an increment of the salinity from 0 to 75 g/L. The experiments took 4 hours for each step. The pristine membrane dealt with wetting in the last step (salinity of 75 g/L), mainly caused by the clogging of the pores and changes in the wettability of the membrane surface that caused the formation of the water channels on the membrane. However, the modified membrane showed better resistivity during the test and could retain its salt rejection throughout the DCMD test. The flux for D-P was higher than other membranes in different salinity ranges, but it dealt with the decrease in flux with the increase in salinity. In general, the salinity affected the vapor pressure of the feedwater and decreased the derived flux of the membranes.
We then tested the membranes at various feedwater salinities containing 0.01 v/v% of mineral oil (
Figure 6b). Similar to the previous observation, the increase in salinity also led to a decrease in the driving force, resulting in a lower flux. In some cases, the presence of oil in the feedwater accelerated the pore blocking of the membranes. The commercial membrane had its pores blocked with oil, leading to a low flux. The 1-P membrane also was partially blocked after 8 h of the test, which was caused by mineral oil fouling. Although the 1-P membrane showed less than a 5% decrease in flux in the feedwater with no oil, the oily saline water dramatically decreased the flux of the 1-P membrane. In this case, the flux showed a 40% decline compared to the initial flux. Afterwards, the membrane started to sharply decrease in flux and was blocked. However, one-layer coating caused more tolerability compared to the commercial membrane. The 3-P and D-P membranes could retain their complete salt rejection performance even in an oily and high salinity feedwater, but their flux was stepwise decreased by an average of a 30% flux decline compared to their initial fluxes. The results show that the decline in flux for oily feedwater is higher than for the no-oil feedwater. The average flux decline in each step for the membranes was less than 7%, with a total flux decrease of less than 20% for the DCMD test for feedwater containing no oil. These values for the treatment of feedwater containing 0.01 v/v% (or equivalent to 80 mg/L) mineral oil were more than 10% for each step and were about 30% for the total period of the test. The higher decrease in flux for oily feedwater can be attributed to the changes in the vapor pressure of the feedwater. The presence of any impurity can affect the vapor pressure of the water. The boiling point of mineral oil is higher than 300 °C, and the dispersed oil can decrease the evaporation rate of water and consequently, decrease the vapor pressure and the driving force of the MD process [
21,
22].
