
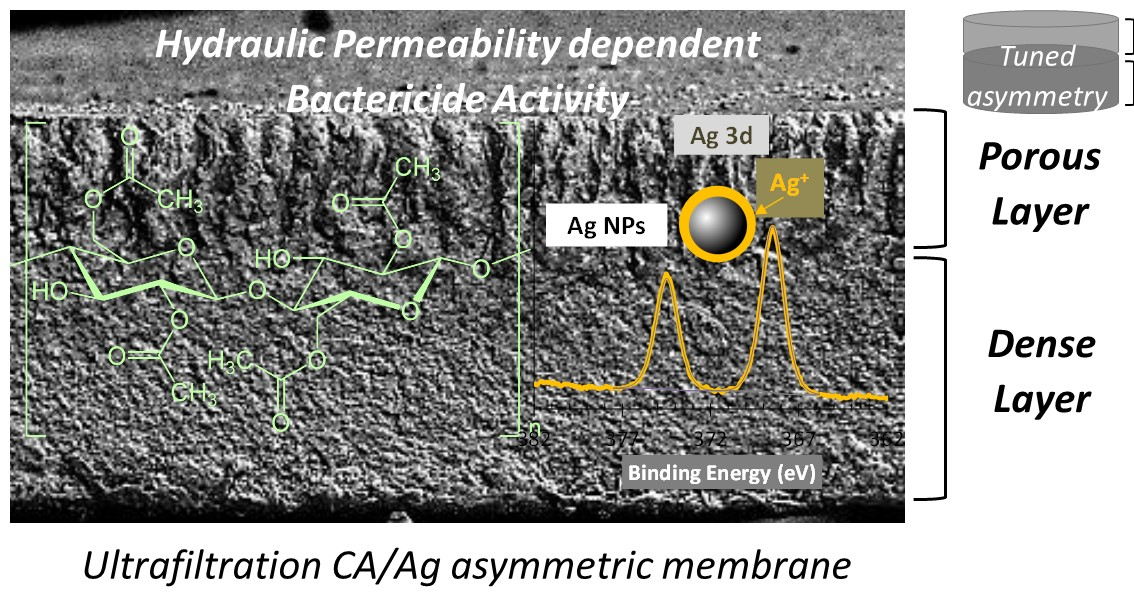
Bactericide Activity of Cellulose Acetate/Silver Nanoparticles Asymmetric Membranes: Surfaces and Porous Structures Role

 ,
,  ,
,  ,
,  ,
,  ,
, 
Abstract

1. Introduction
2. Materials and Methods
2.1. Materials and Chemicals
2.2. Synthesis of Silver Nanoparticles
2.3. Membranes Preparation
2.4. Permeation Experiments
2.4.1. Pure Water Permeation Experiments
2.4.2. Molecular Weight Cut-Off Experiments
2.5. X-ray Diffraction Analysis
2.6. X-ray Photoelectron Spectroscopy
2.7. Membranes Bactericide Properties
2.7.1. Surface Test
2.7.2. Suspension Test
2.7.3. Cell Death Test
2.7.4. Growth Inhibition of Bacteria in the Water
3. Results and Discussion
3.1. Membrane Synthesis and Permeation Experiments
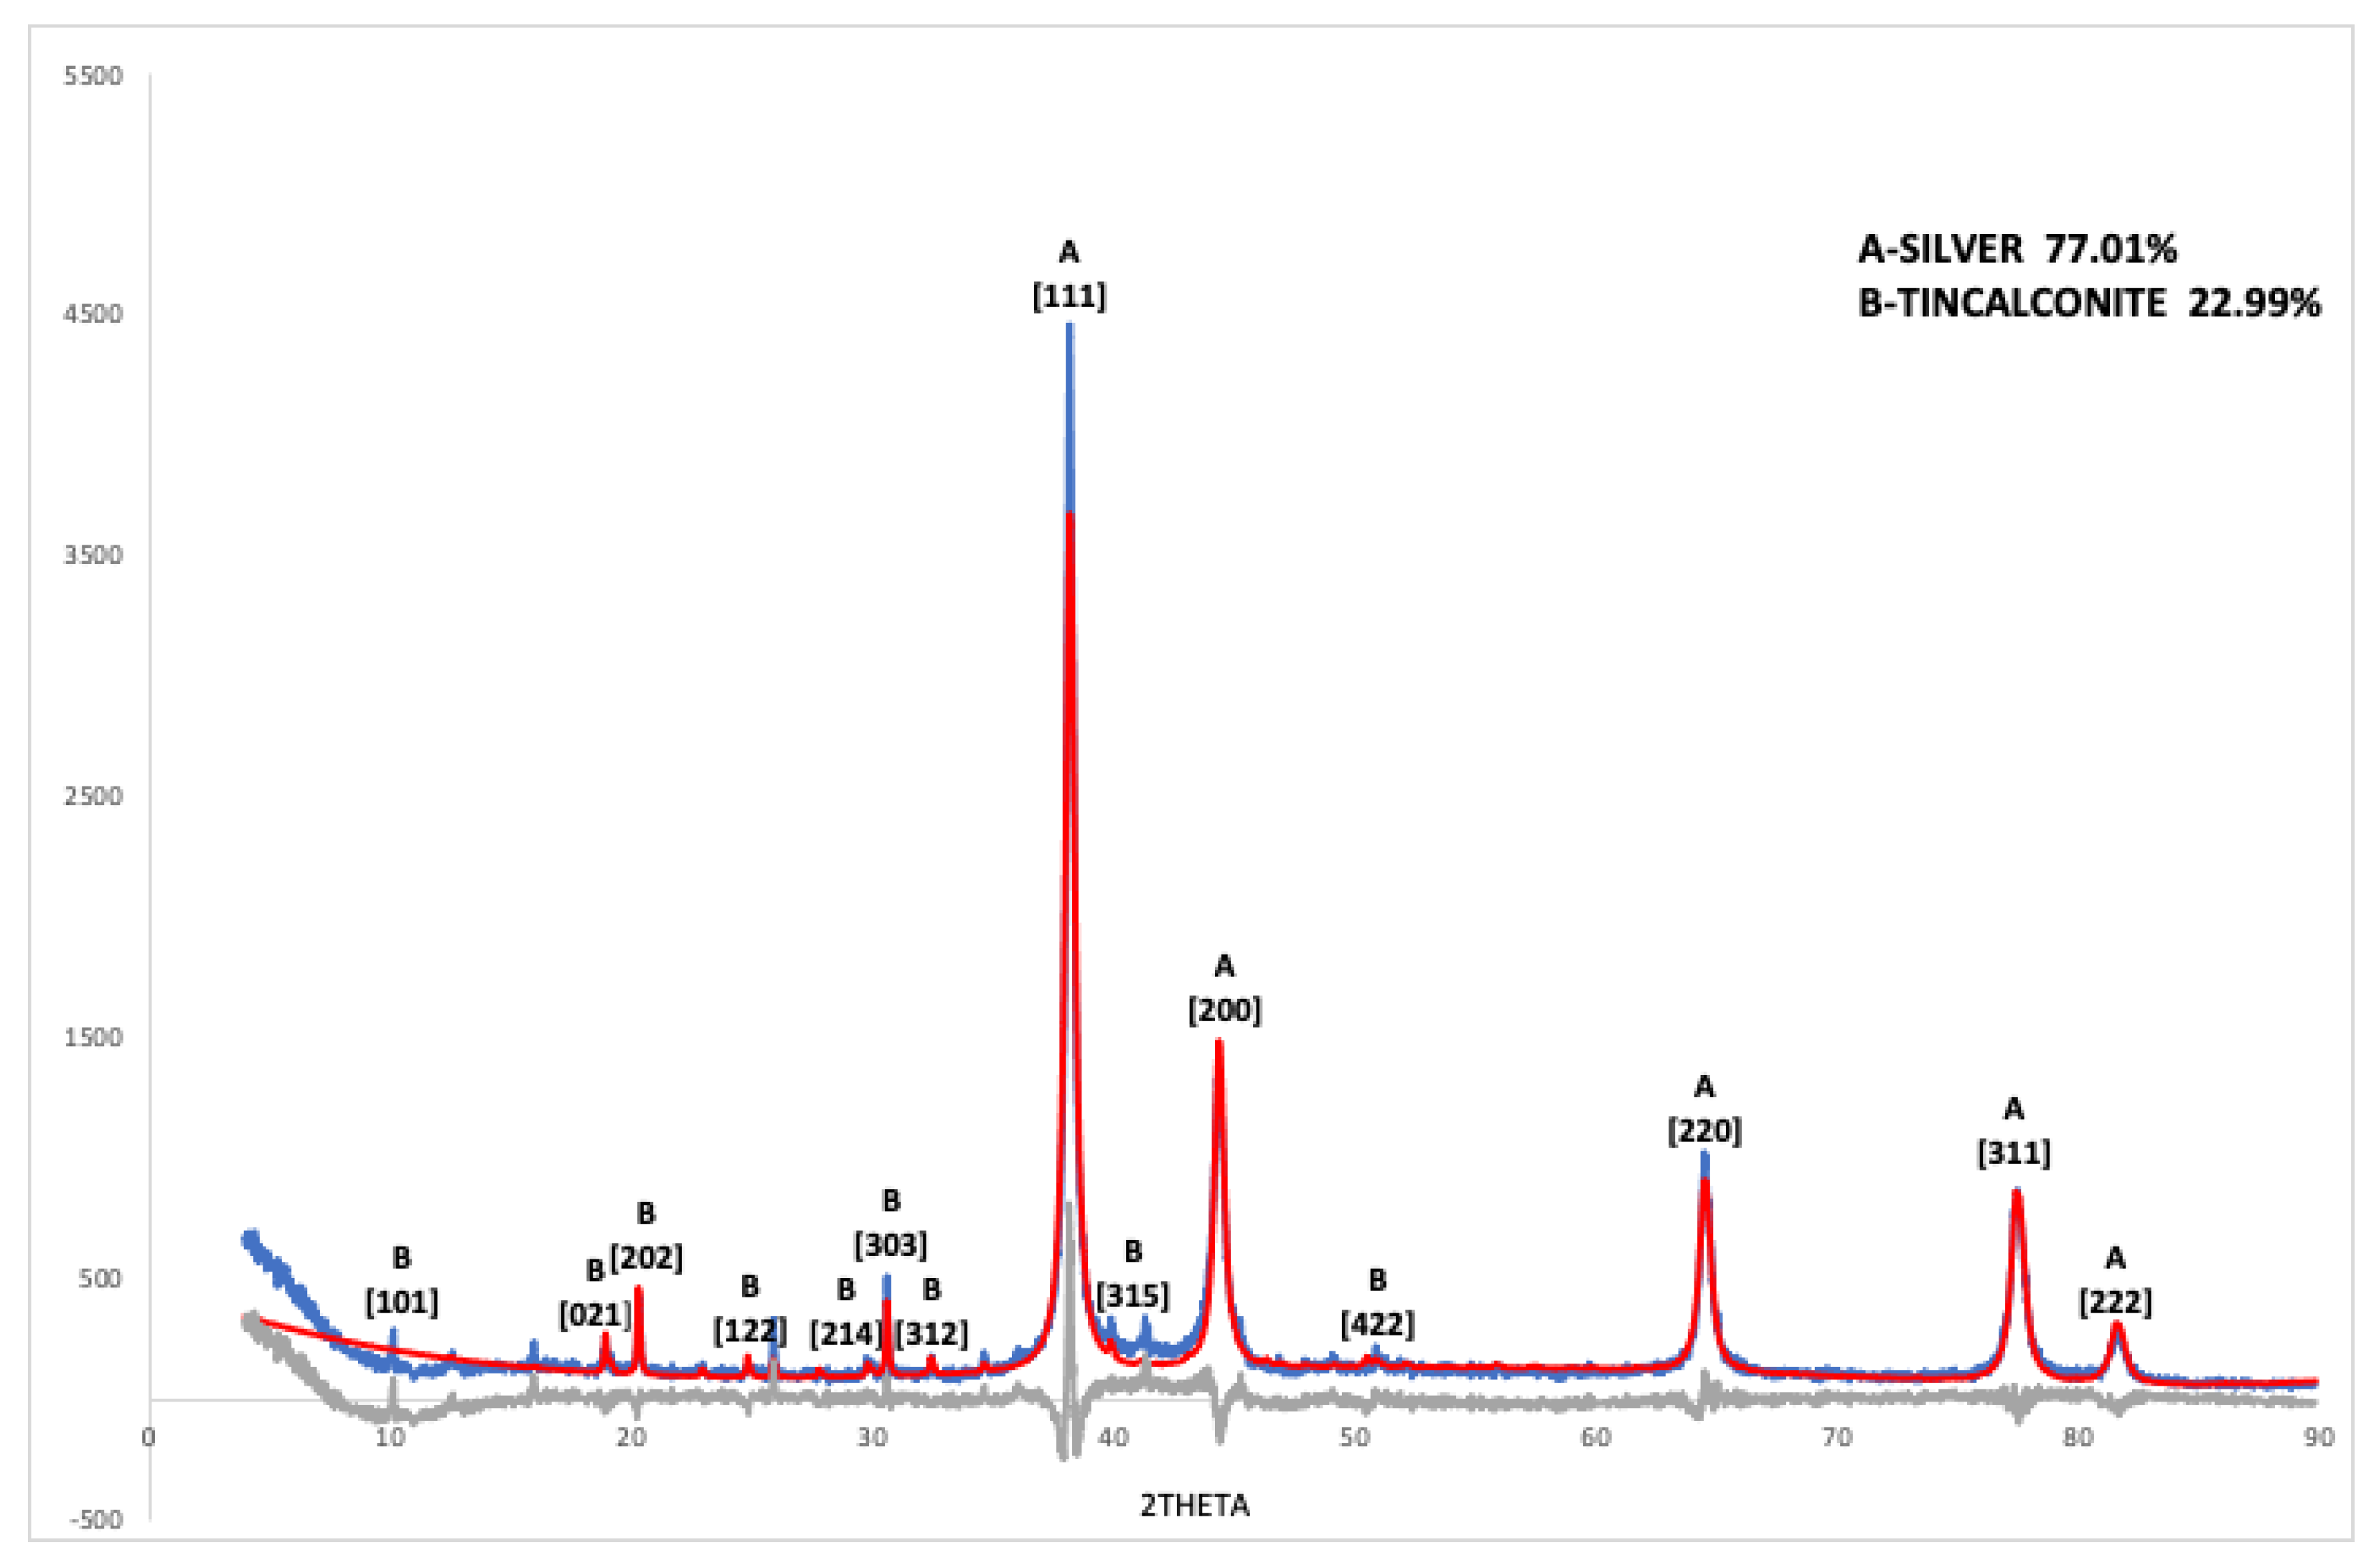
3.2. XRD Results
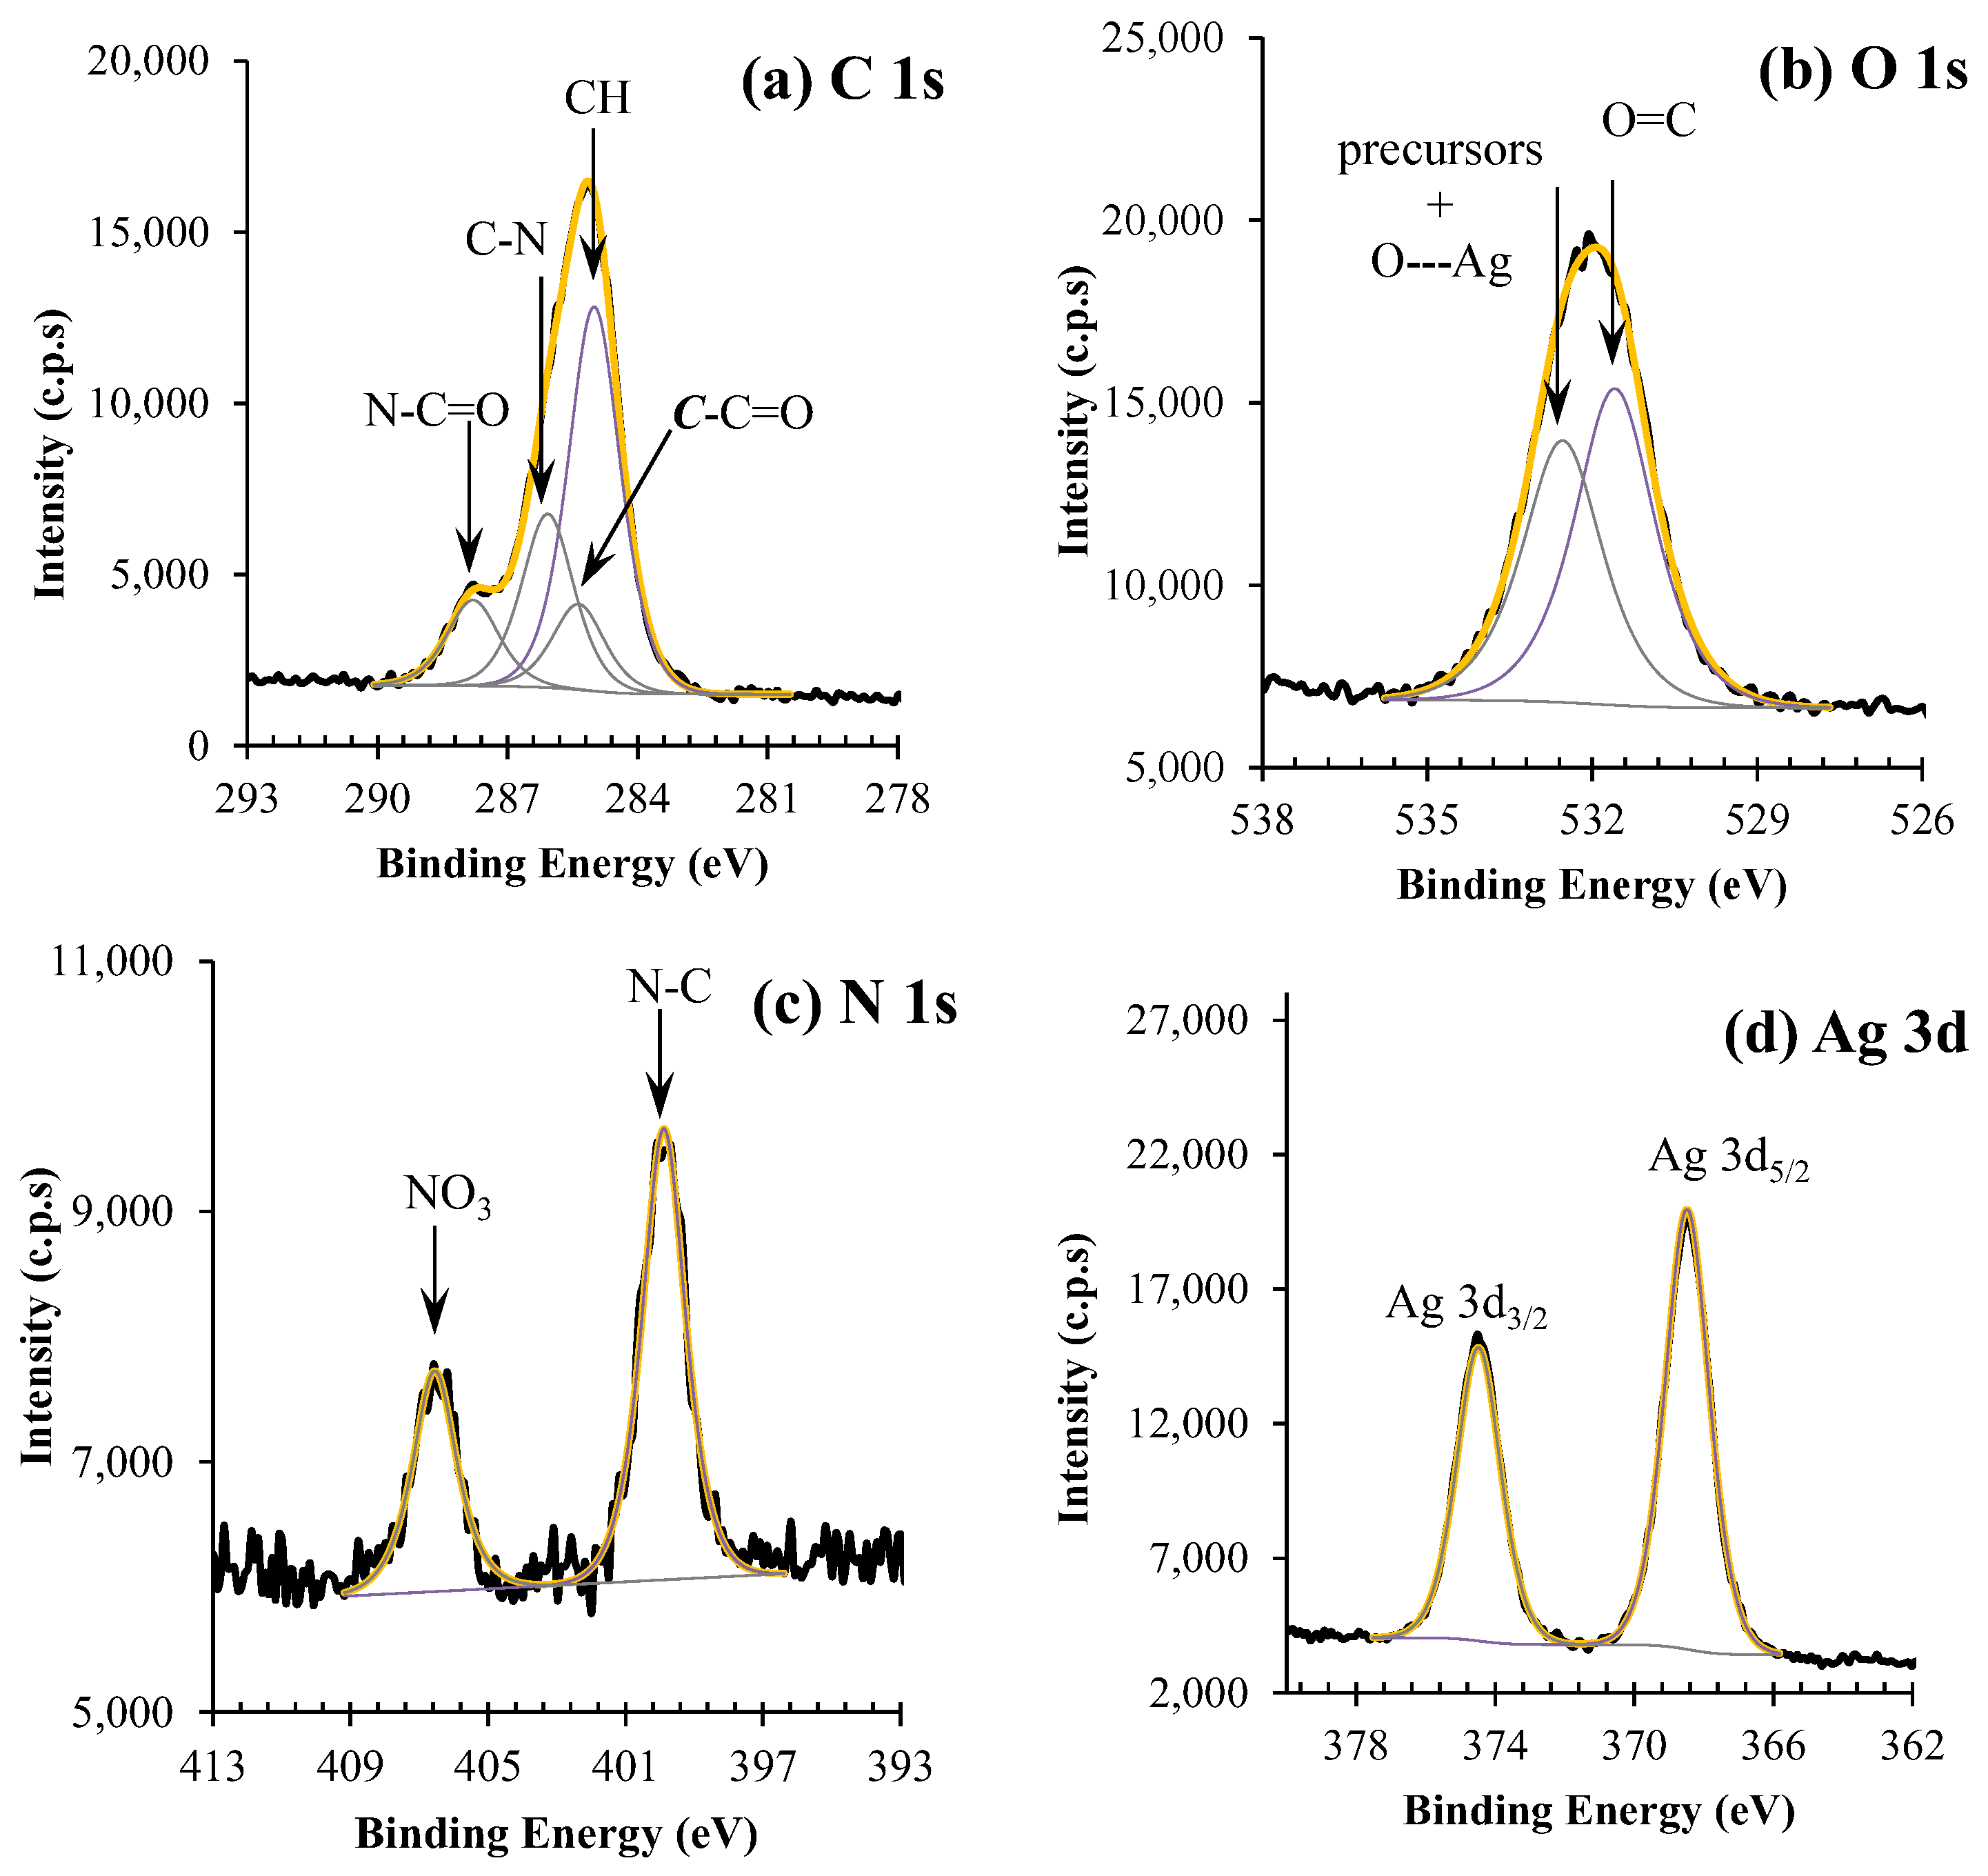
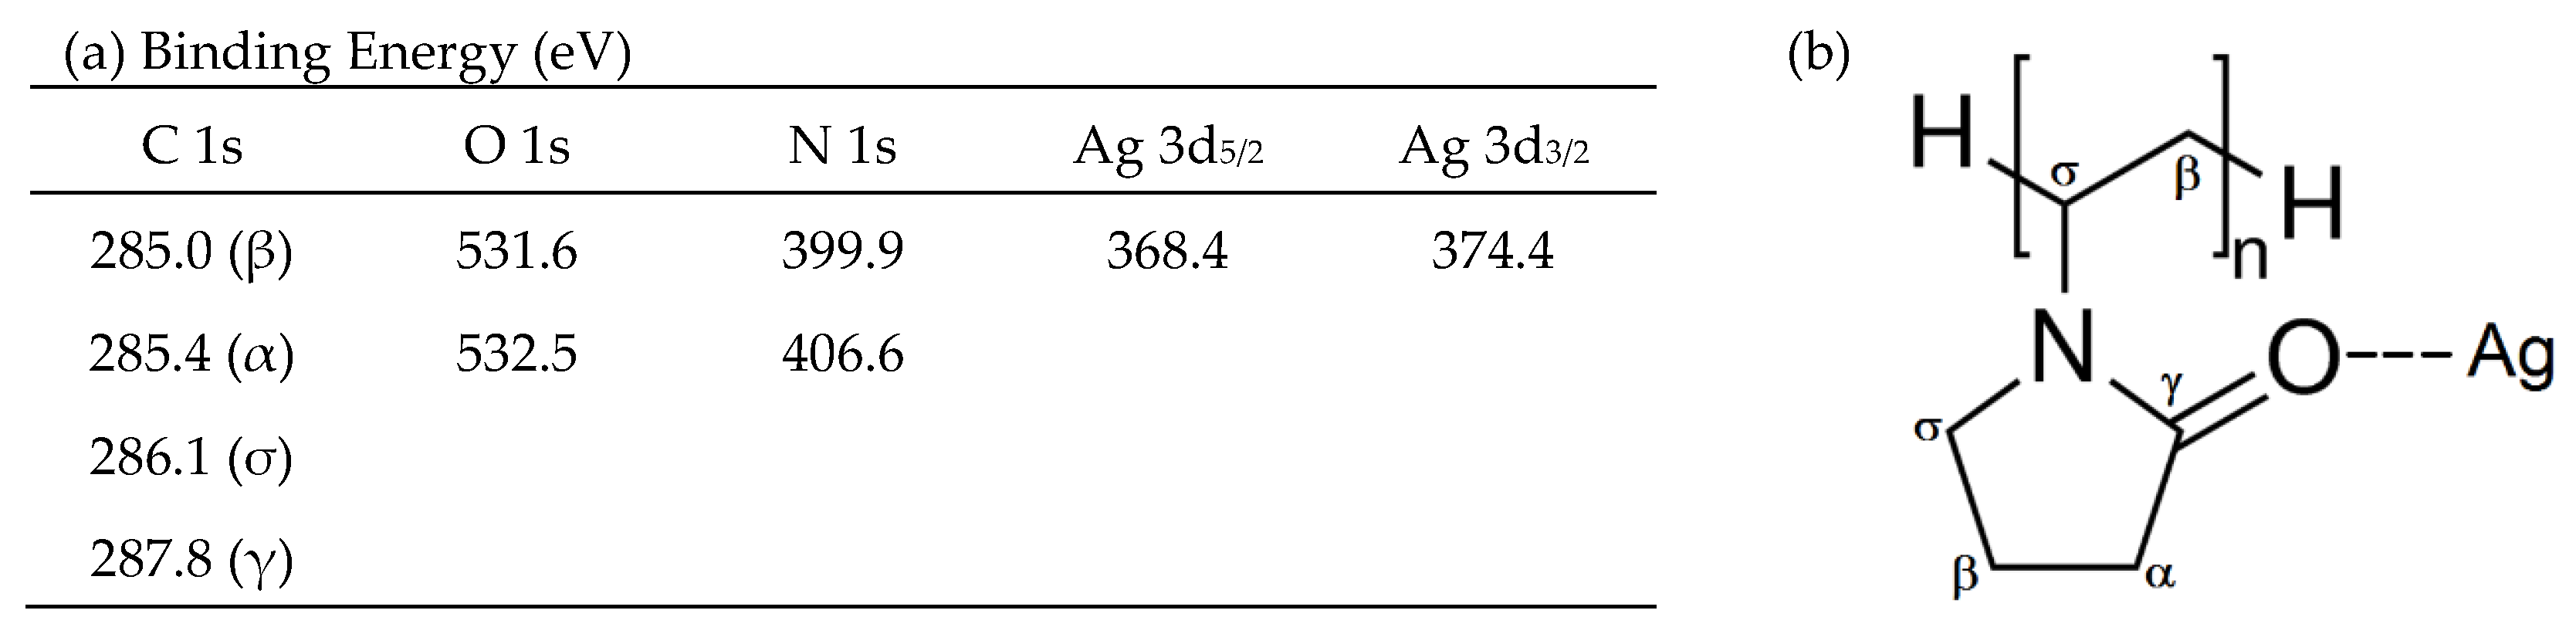
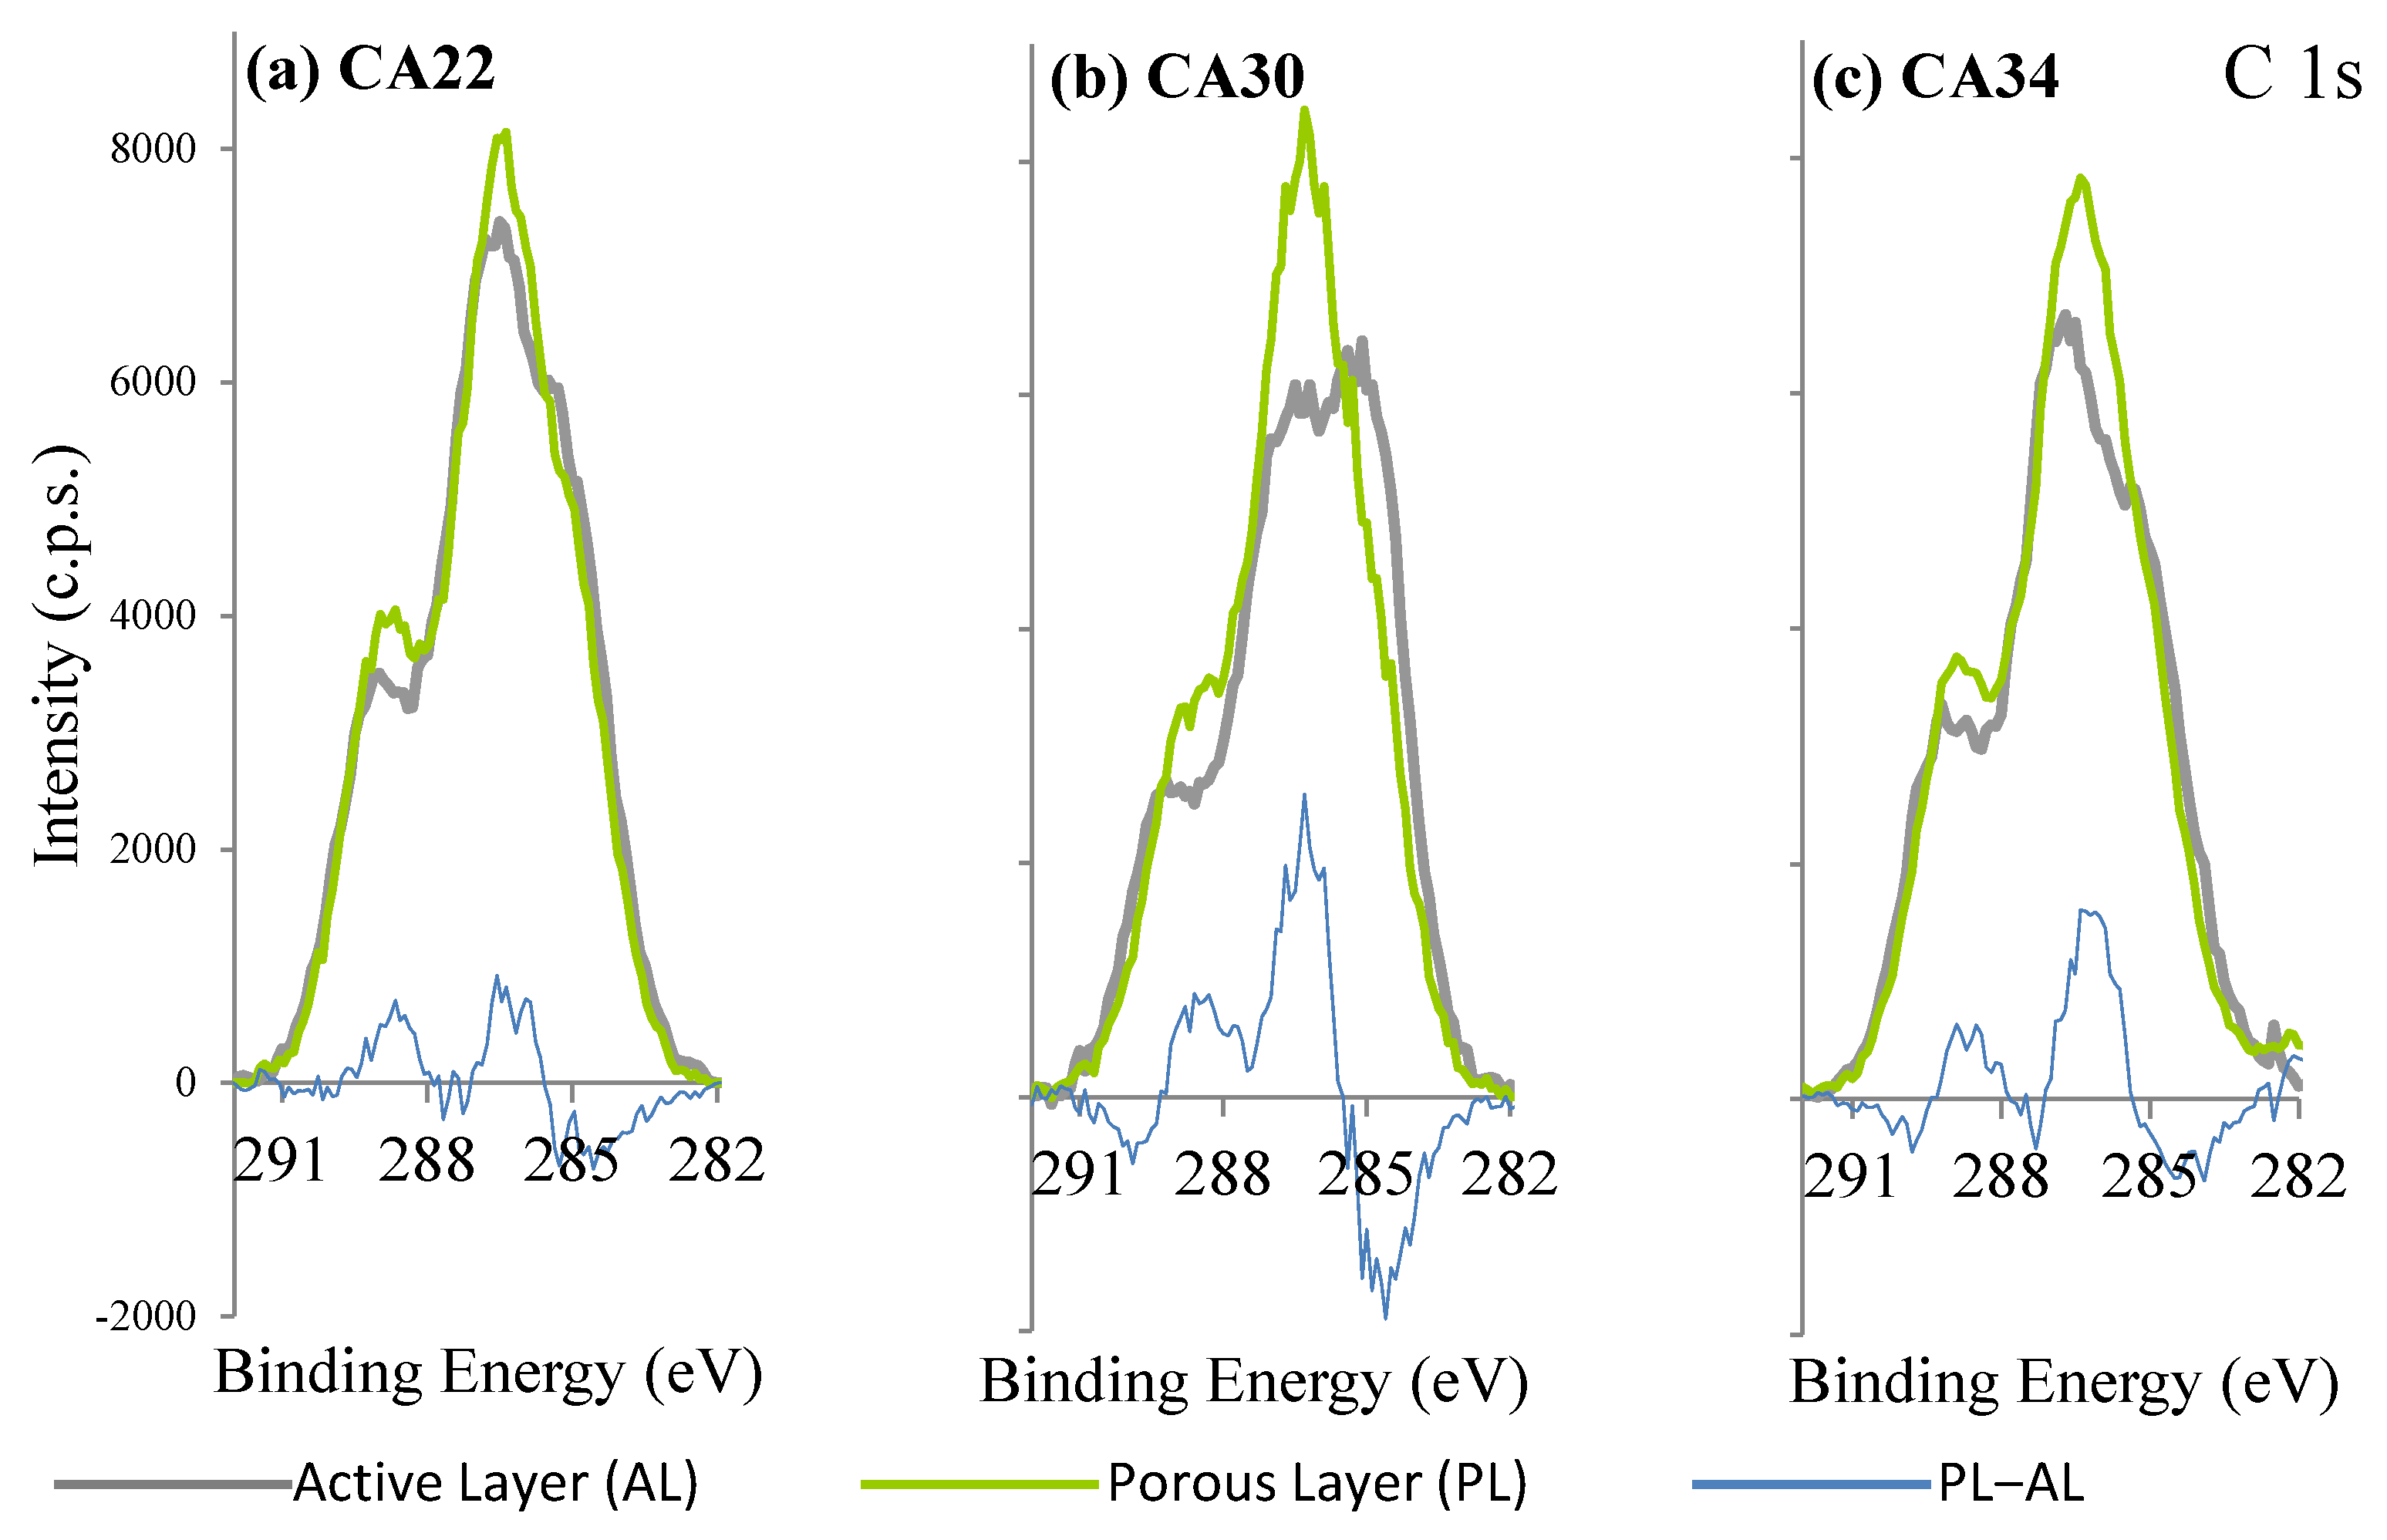
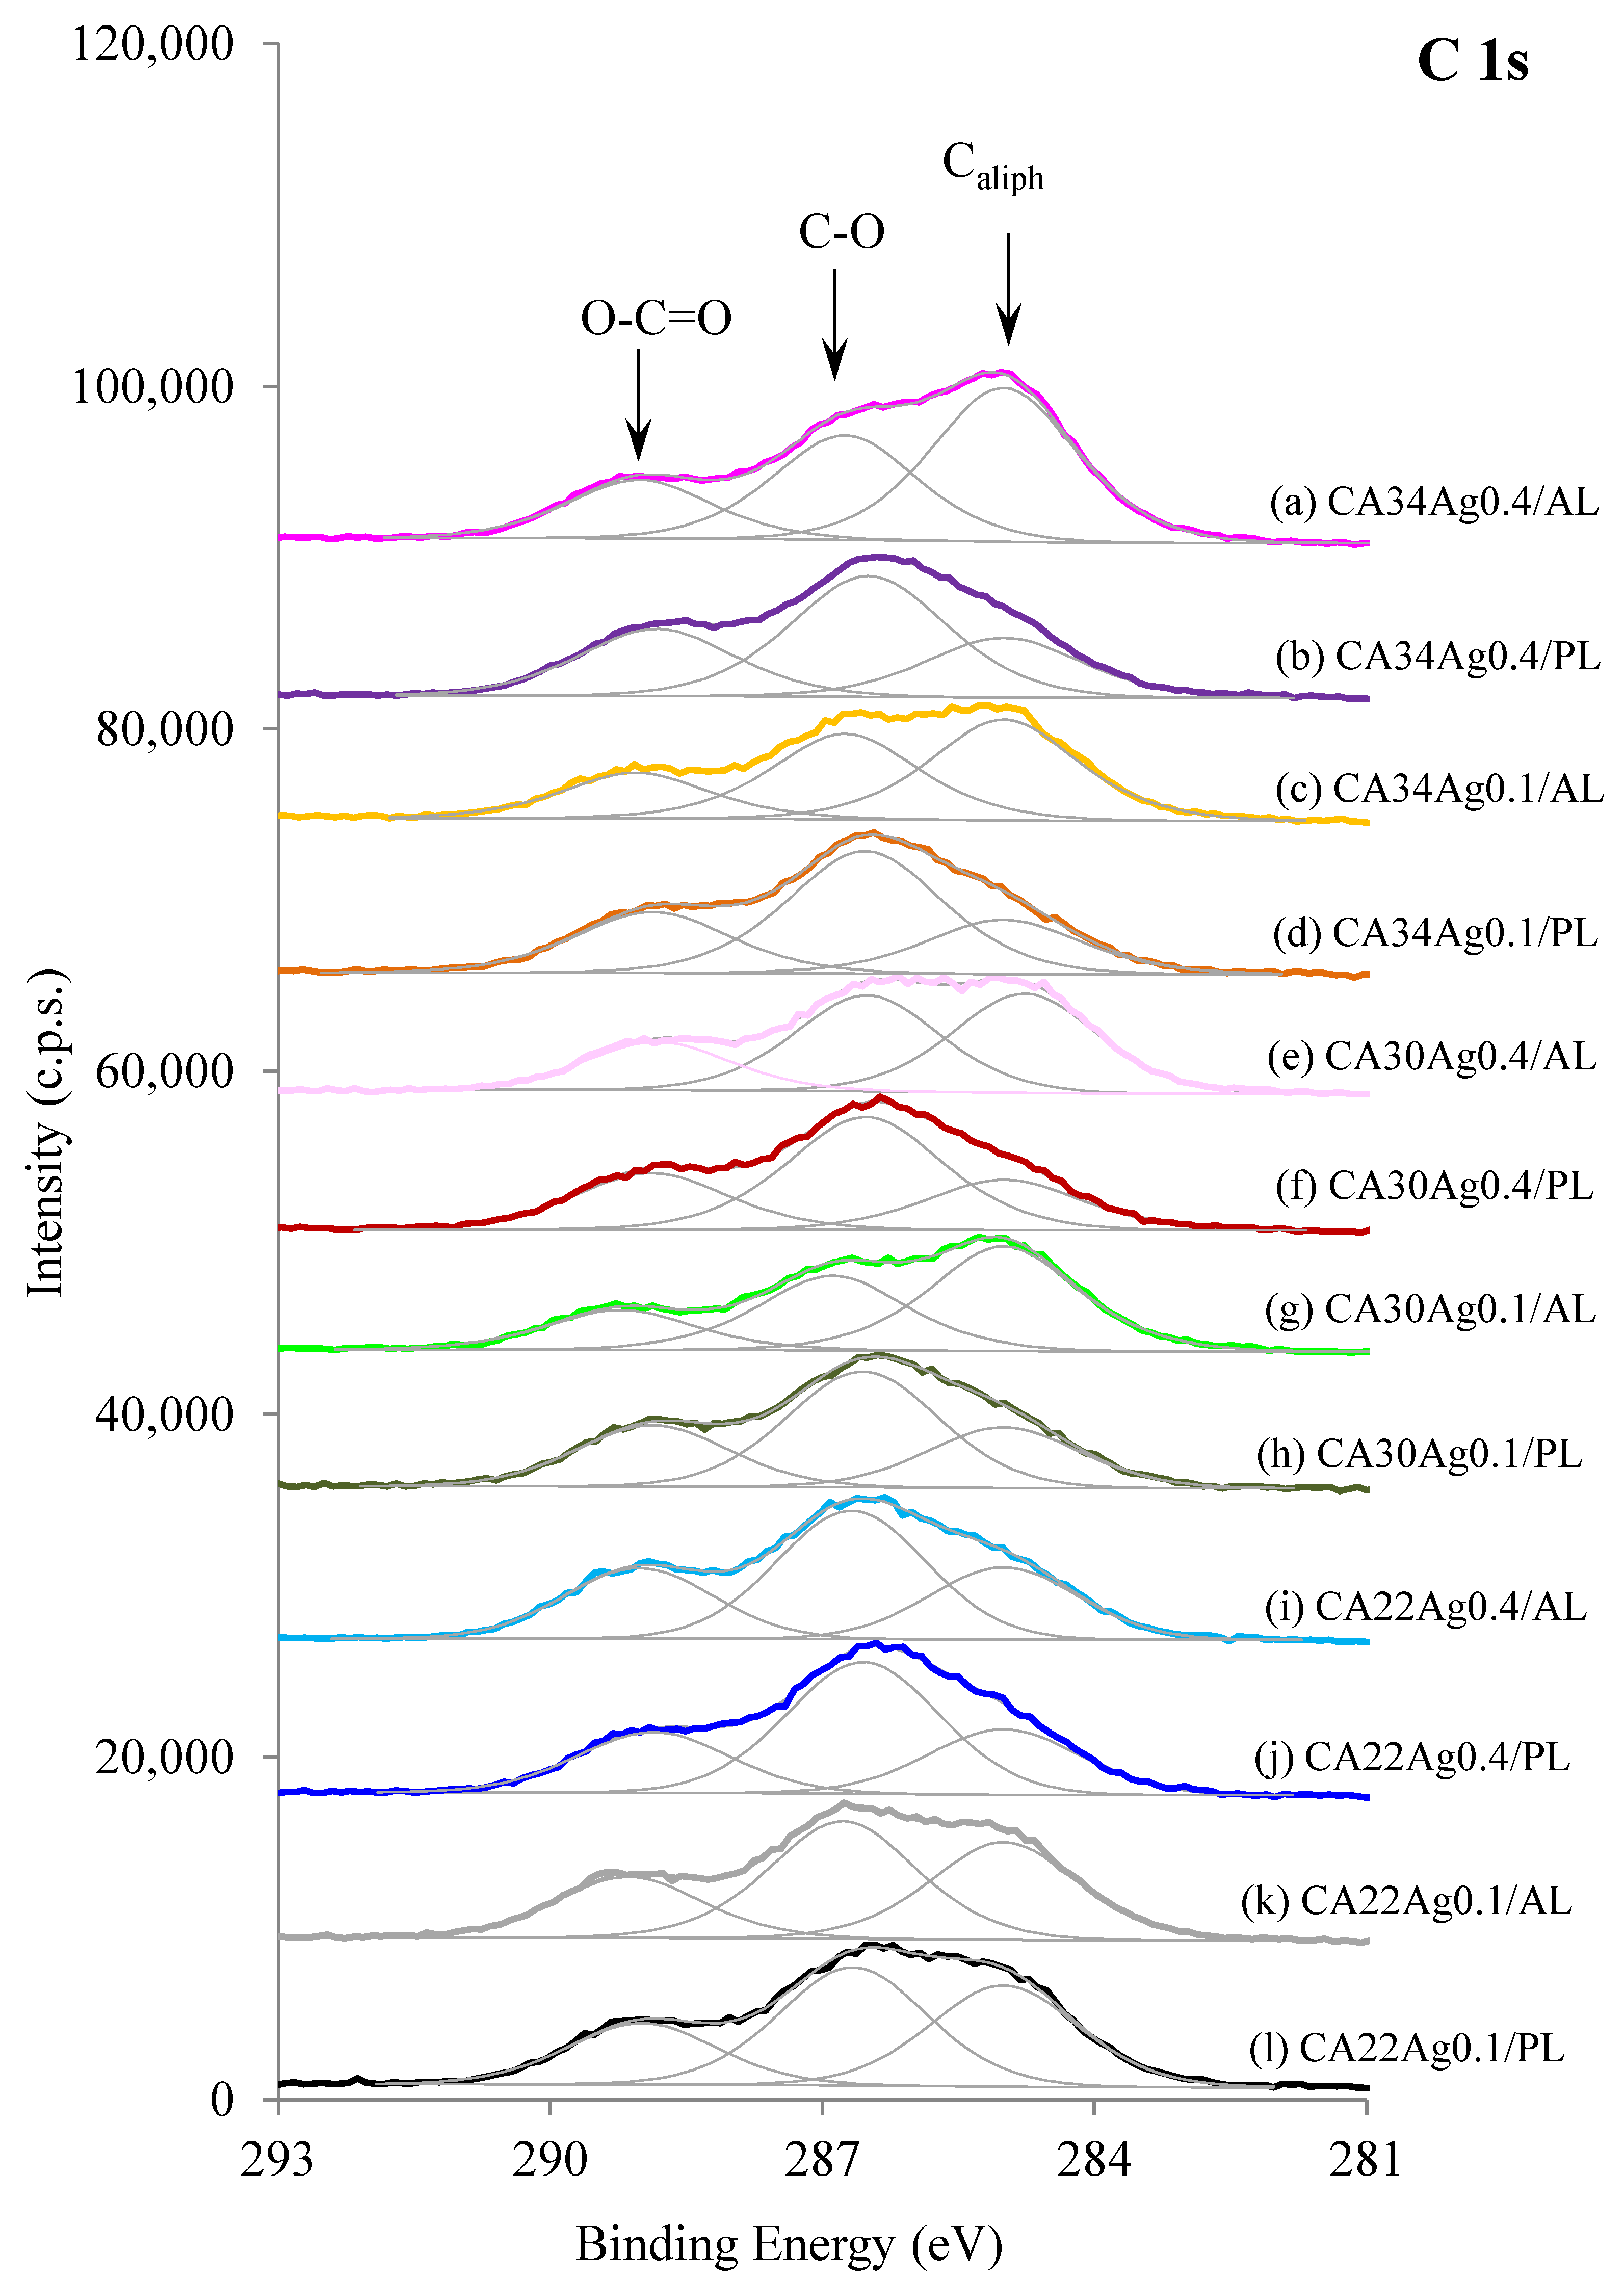
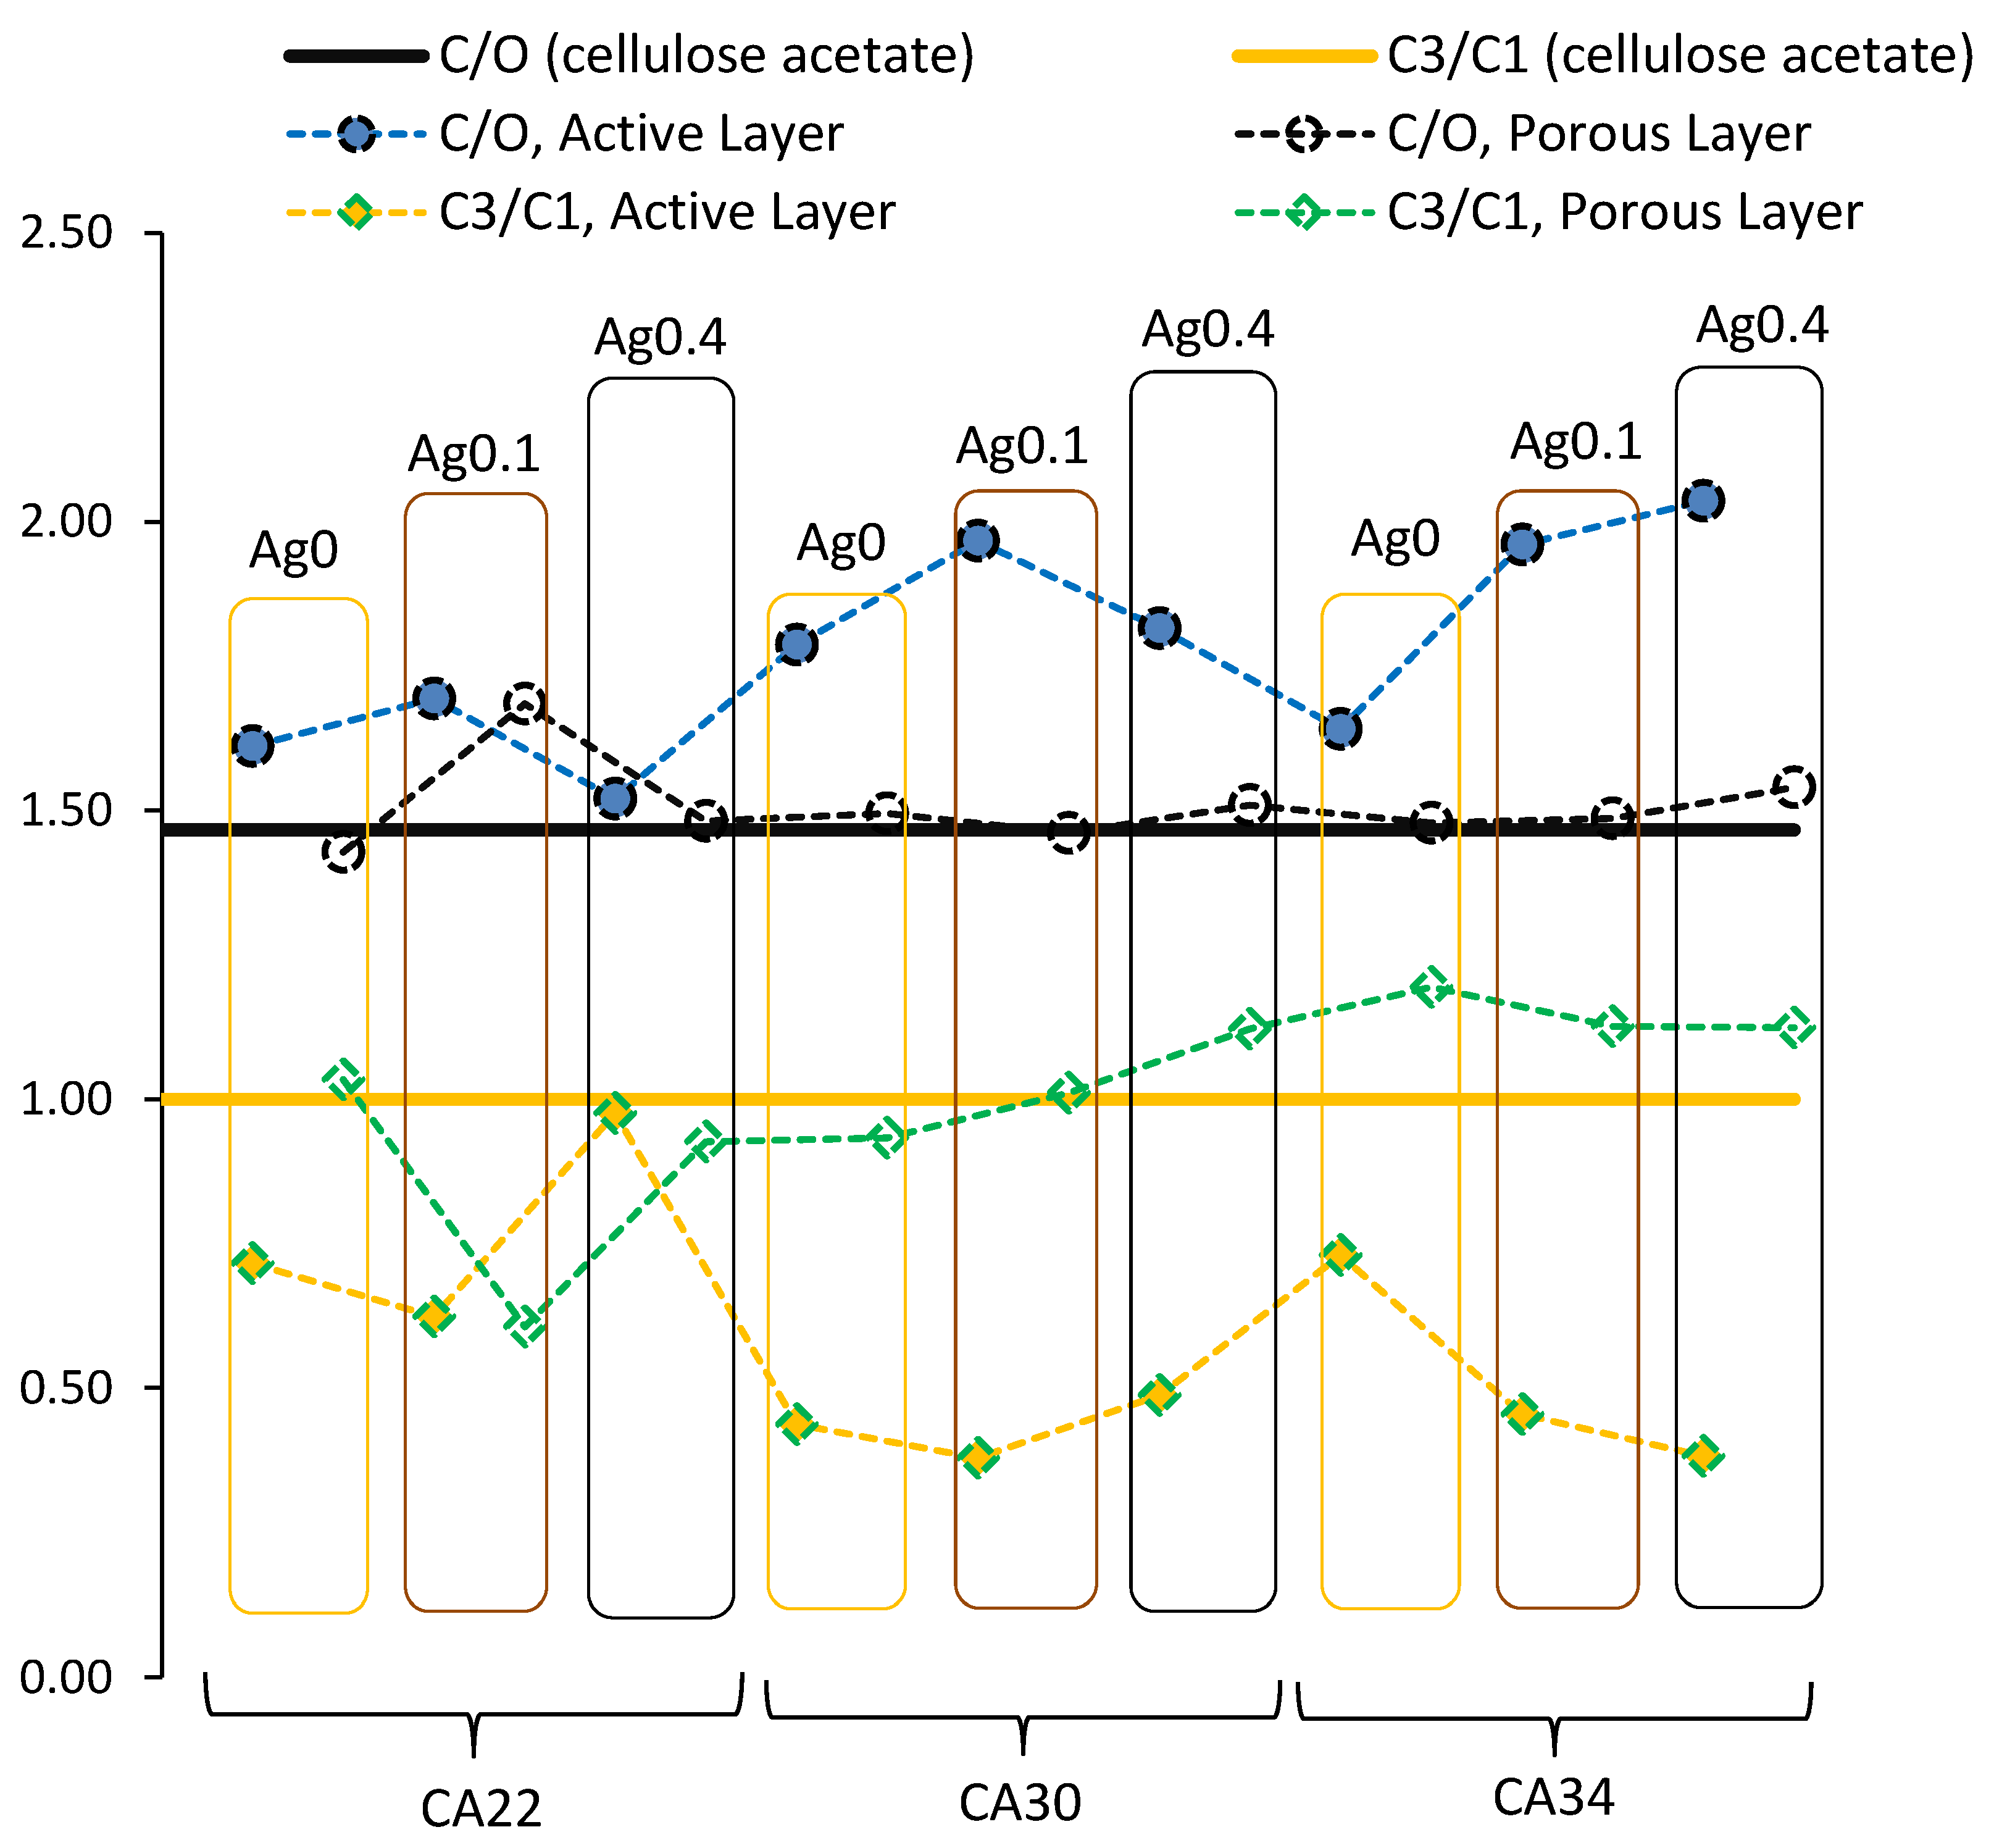
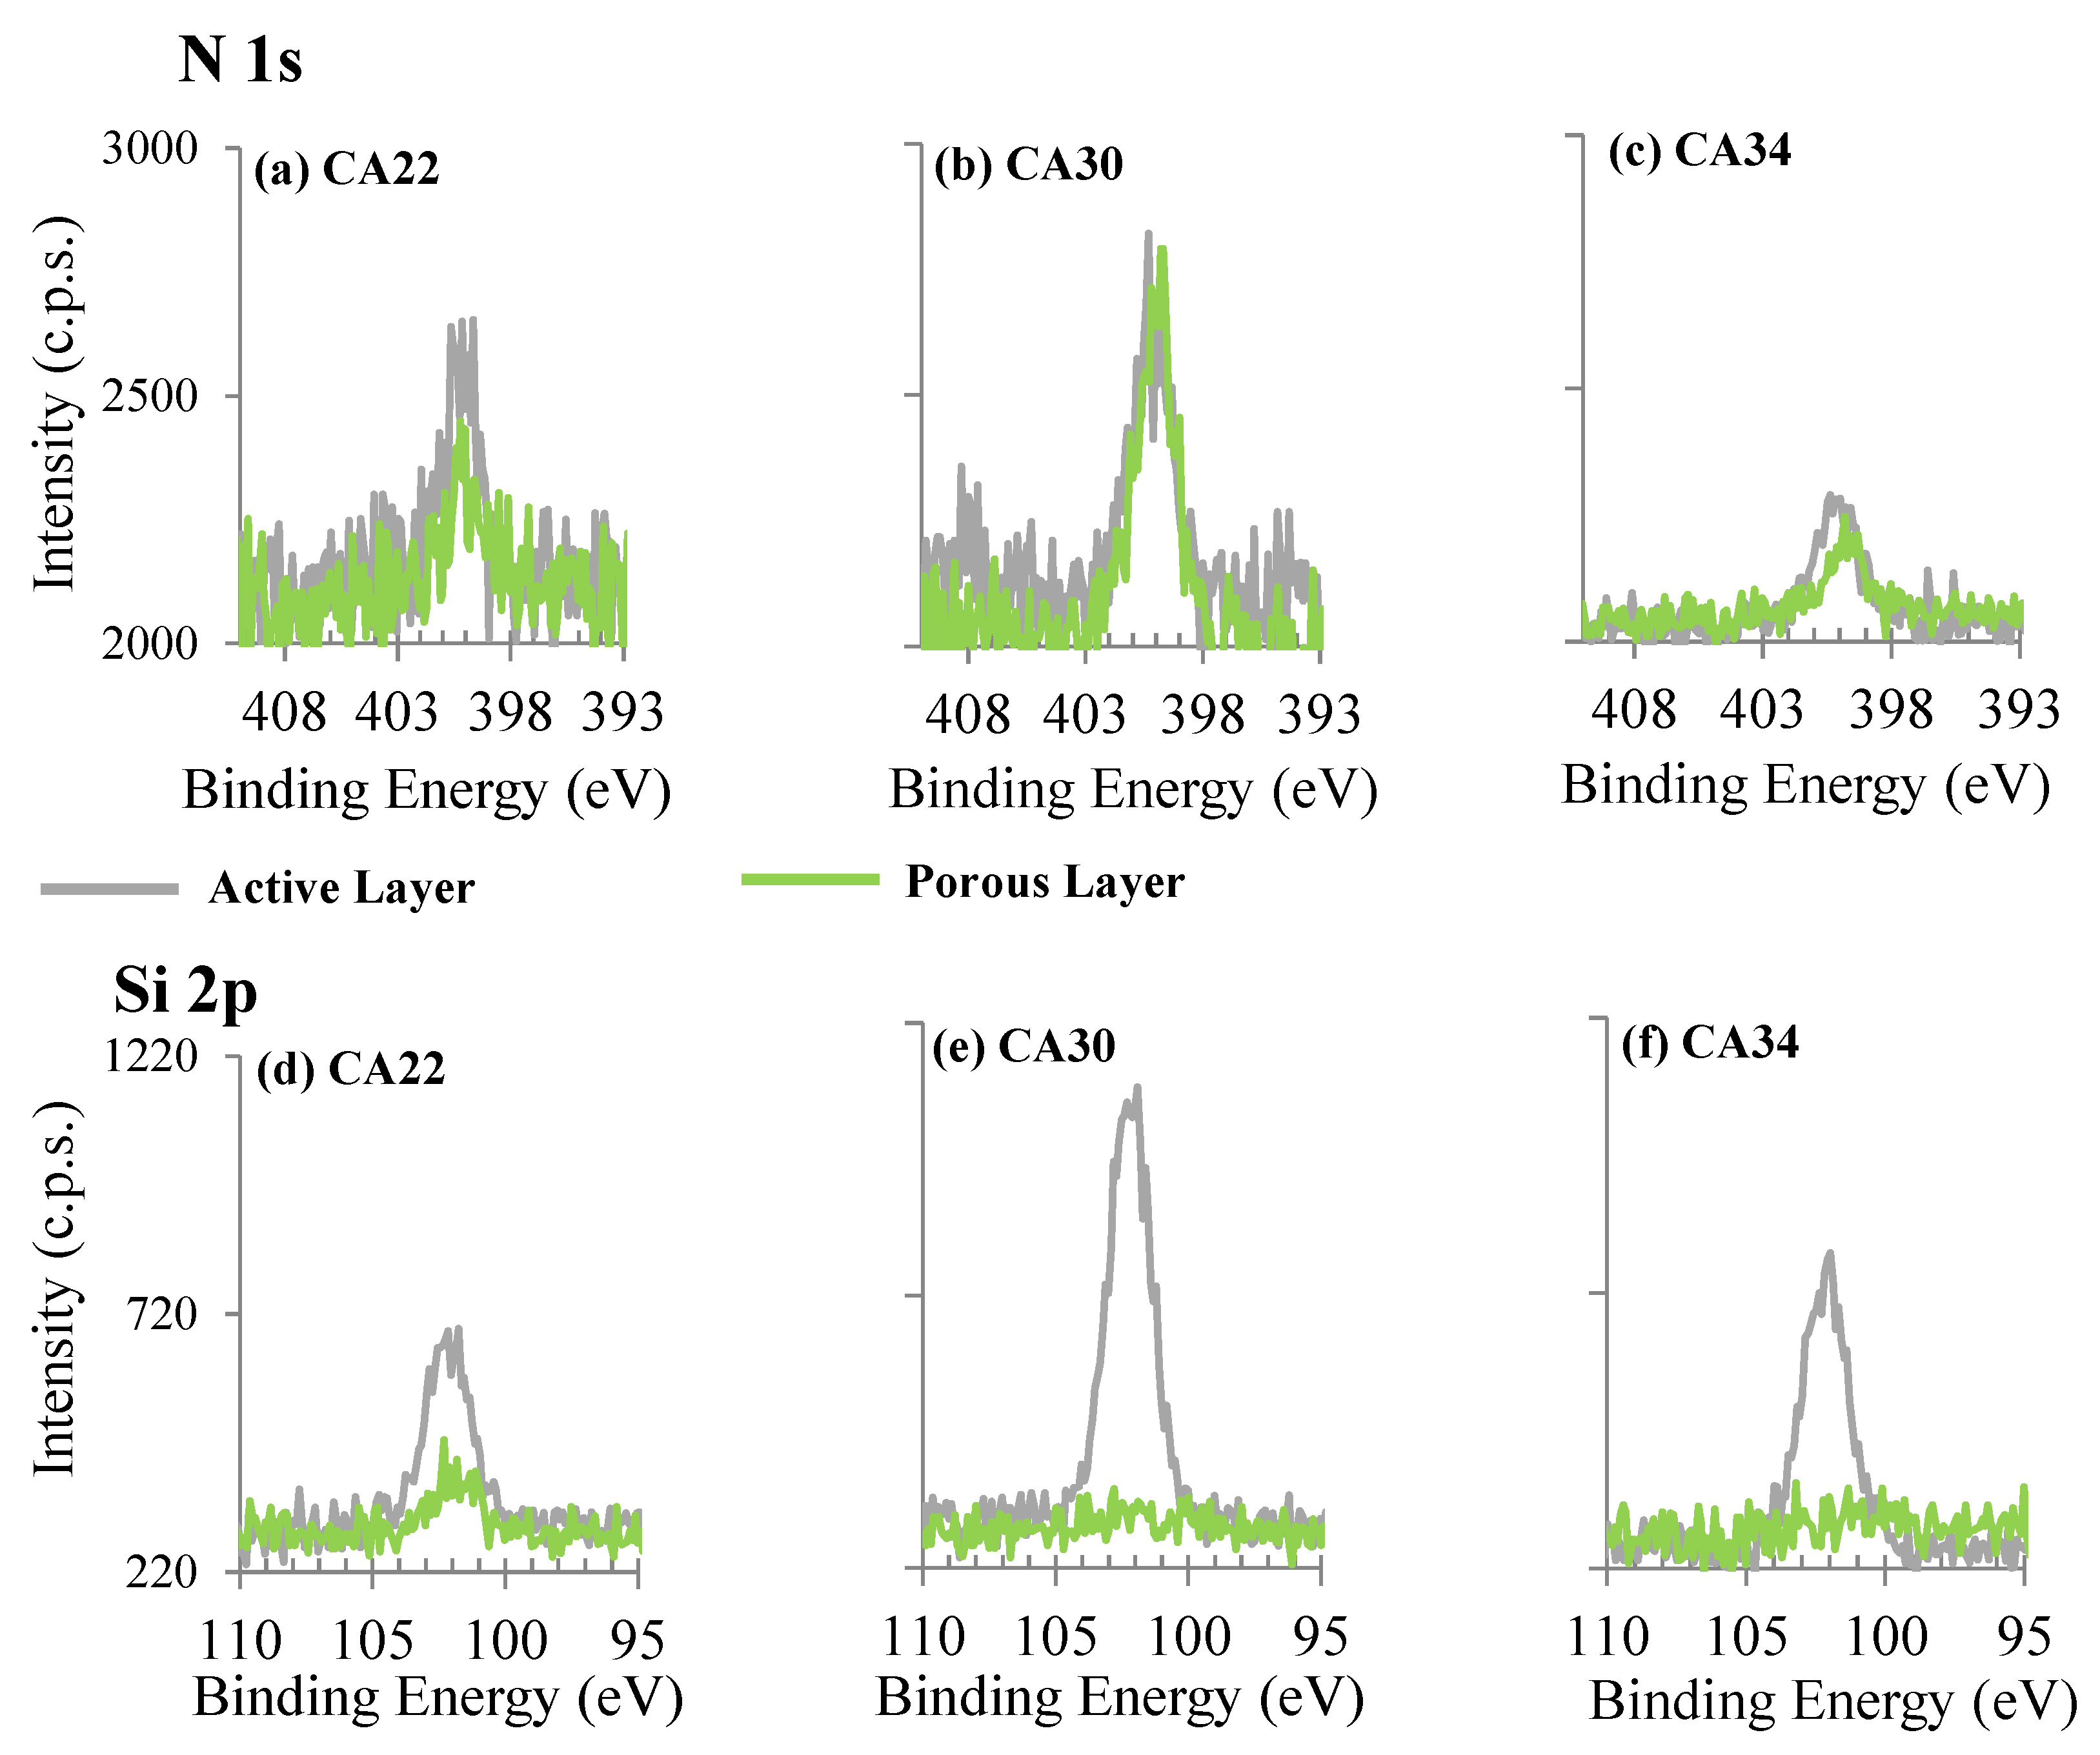
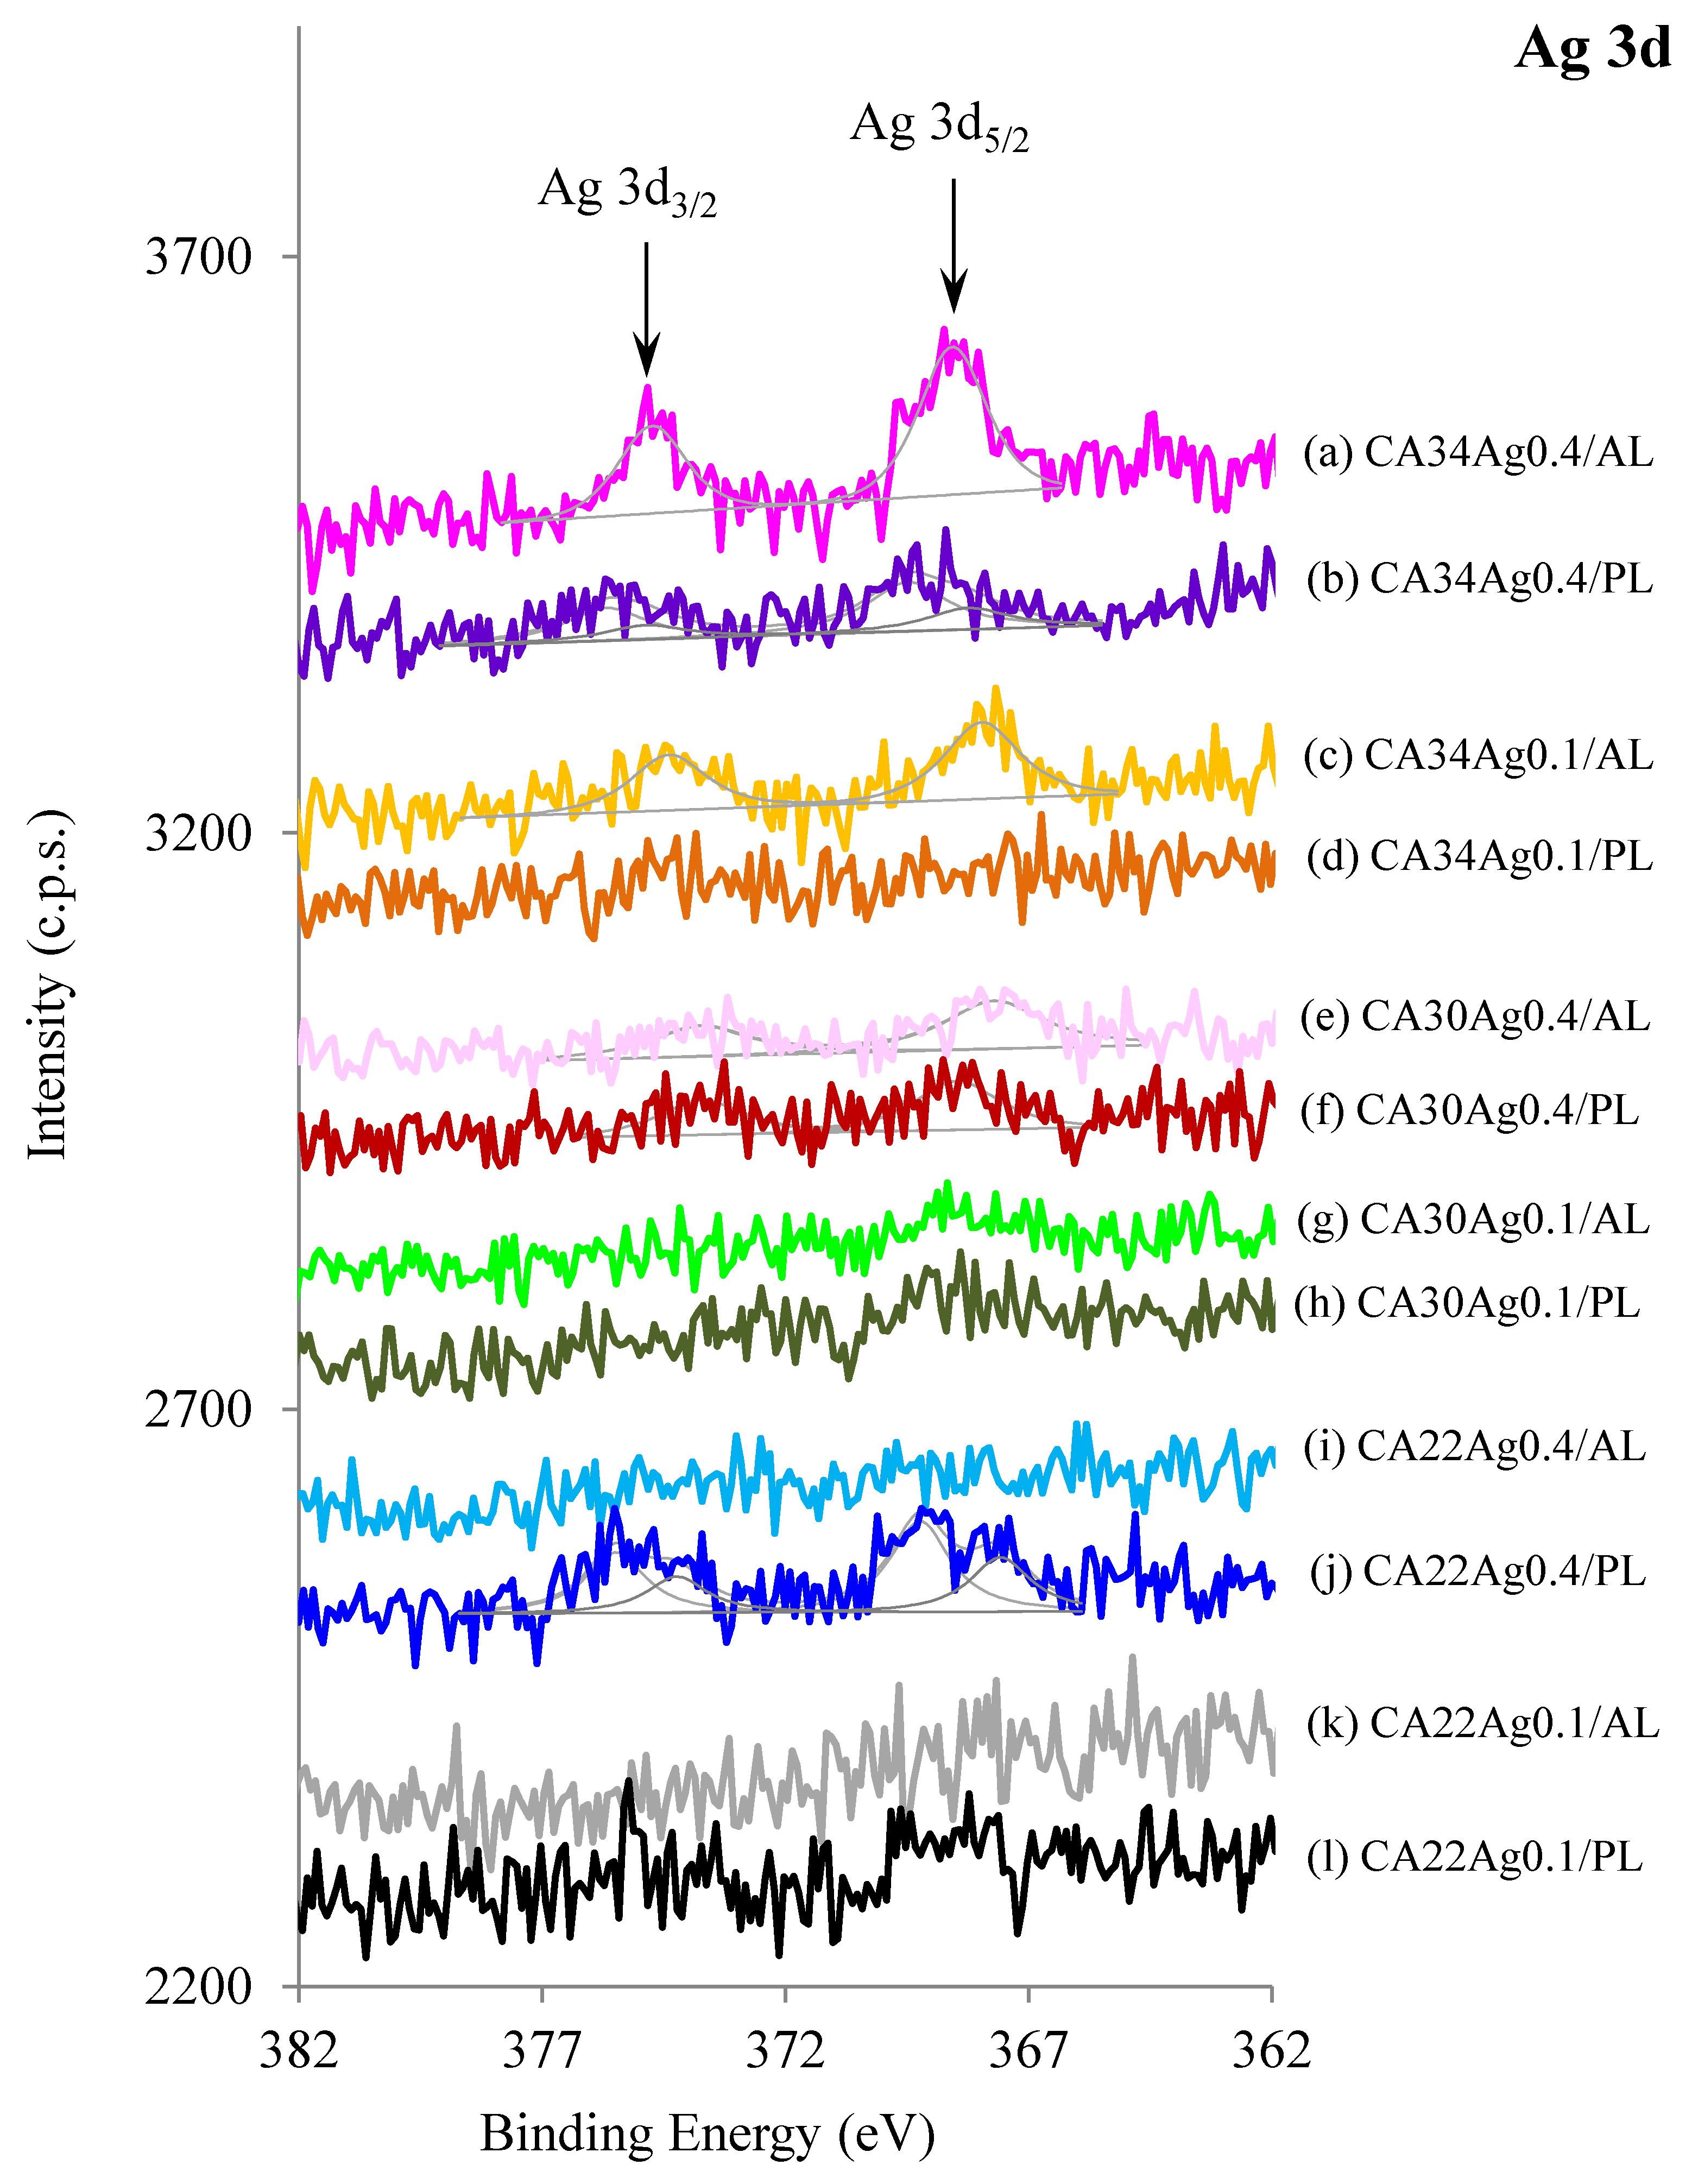
3.3. XPS Results
3.3.1. Silver Nanoparticles Dispersion
3.3.2. CA and CA/Ag Membranes
3.4. Membranes Bactericide Properties
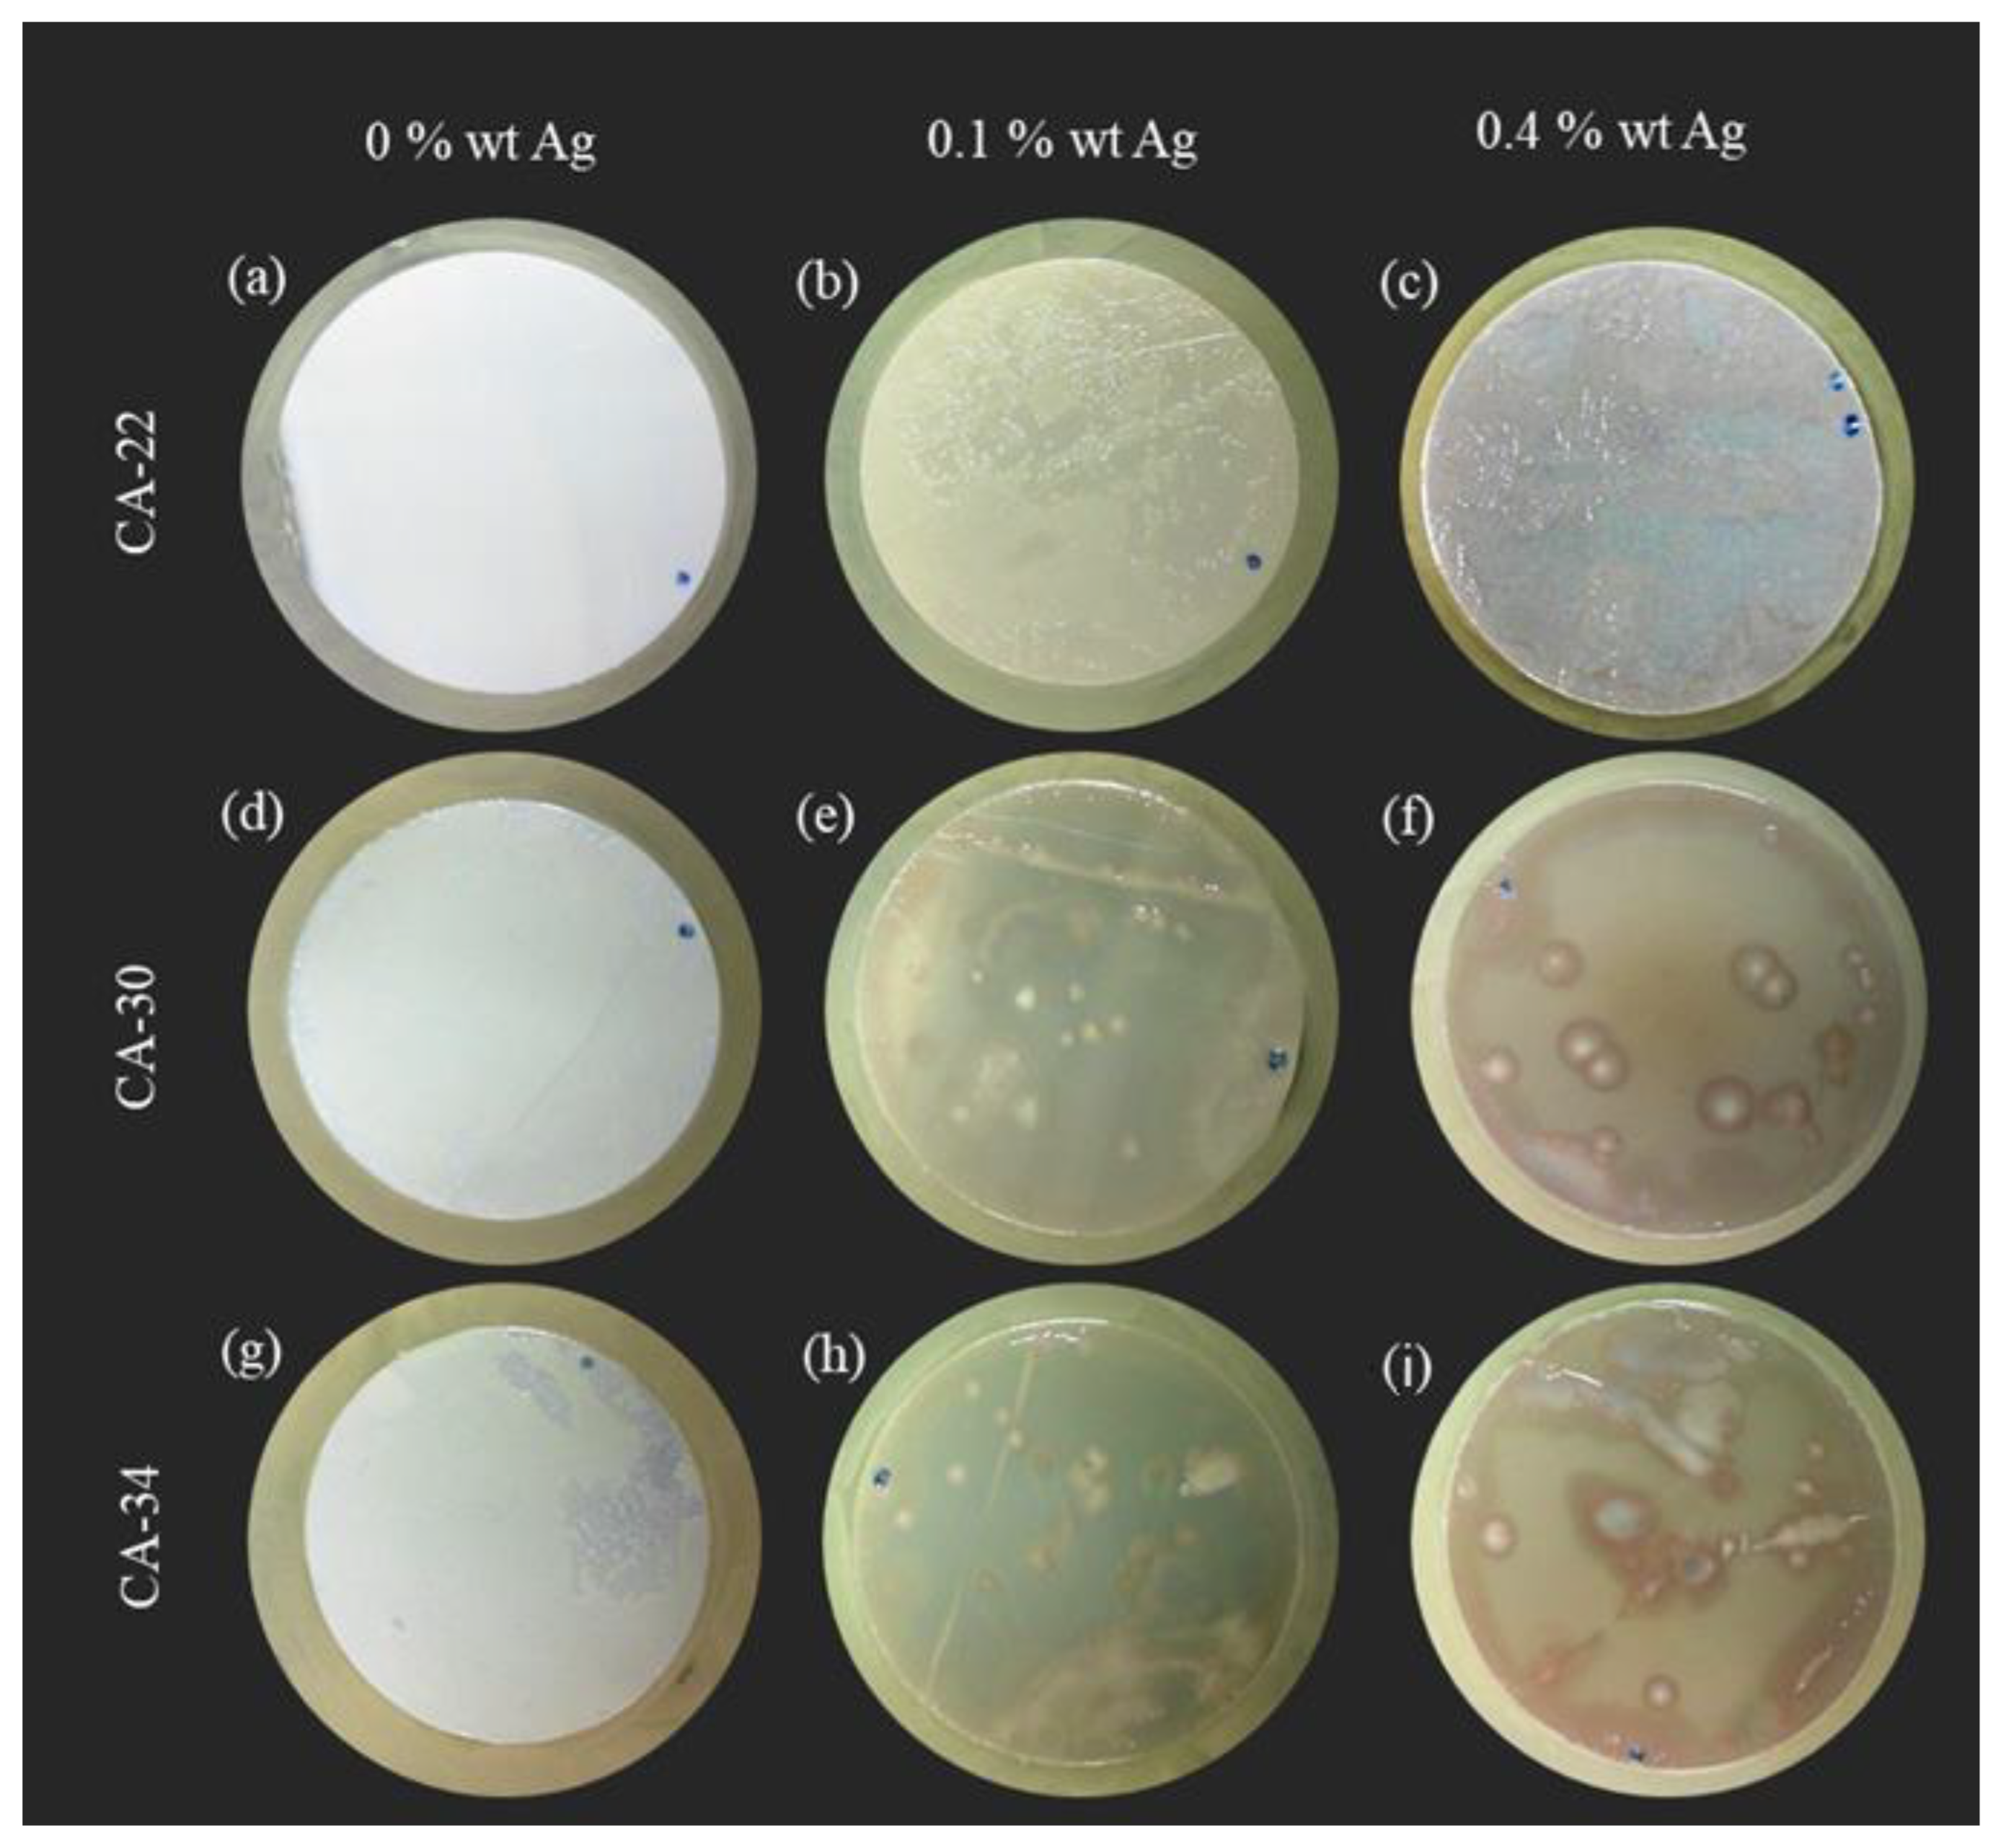
3.4.1. Surface Test
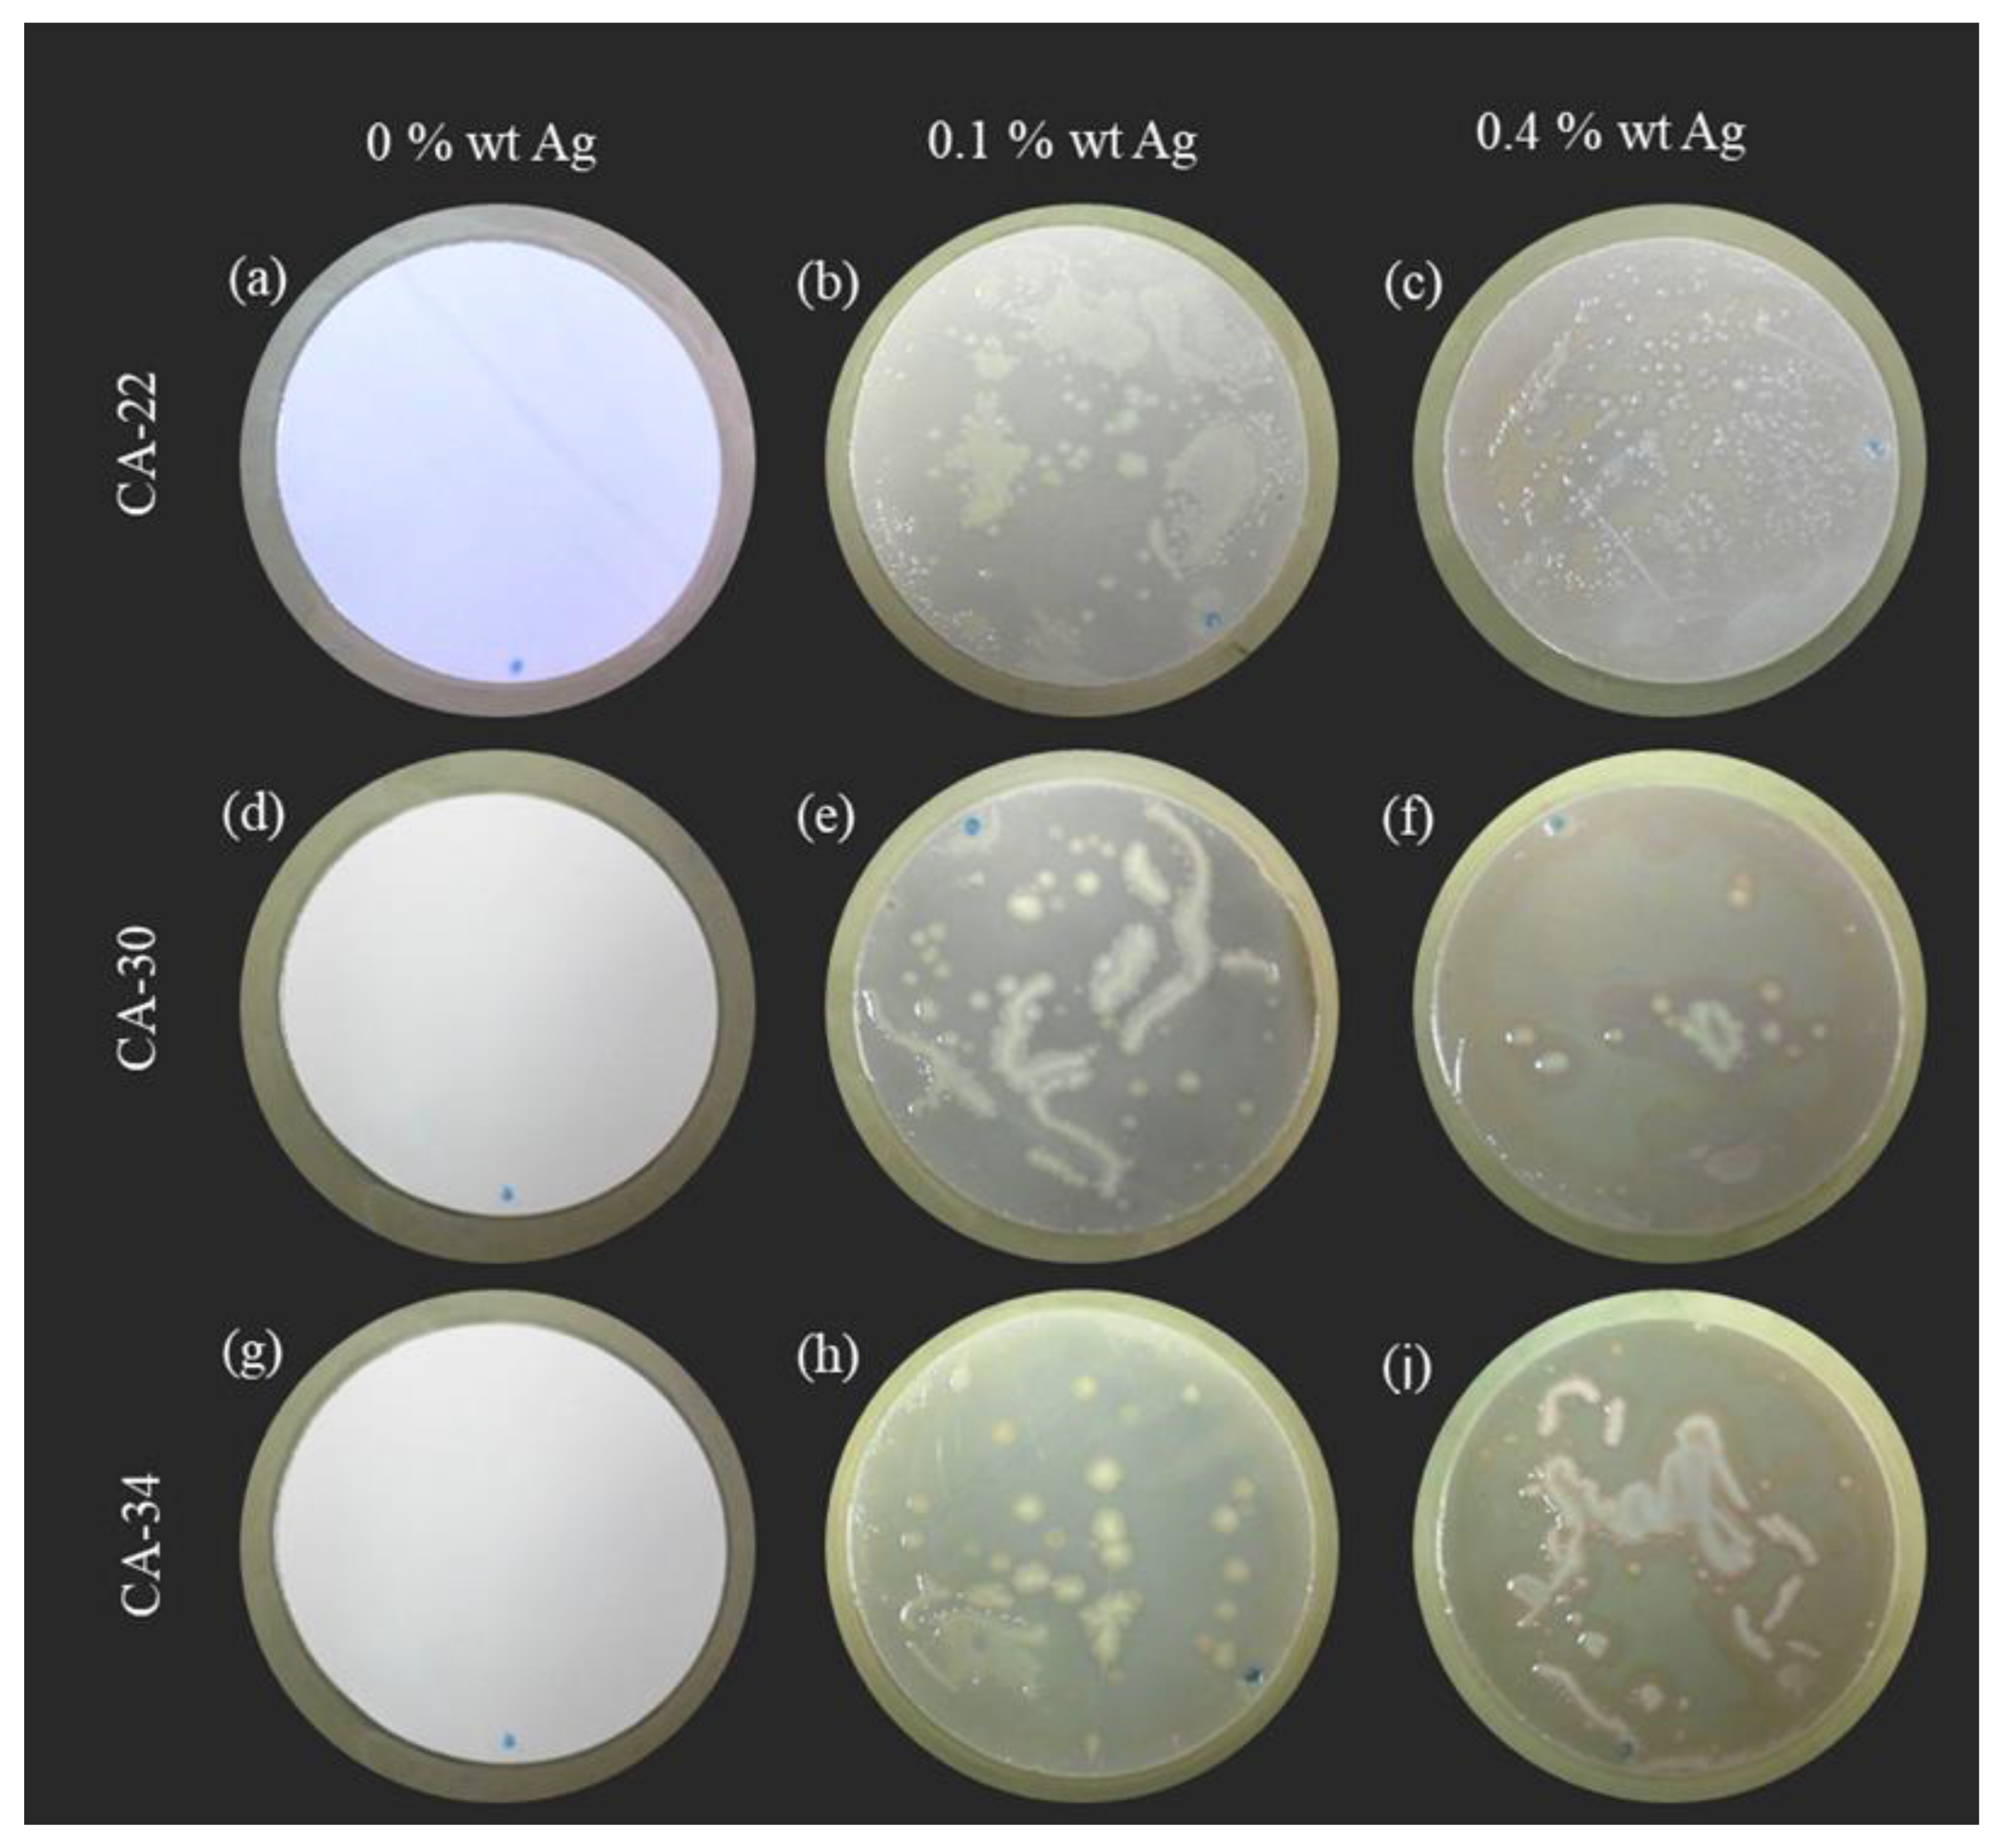
3.4.2. Suspension Test
3.4.3. Cell Death Test
3.4.4. Growth Inhibition of Bacteria in the Water
4. Conclusions
Author Contributions
Funding
Institutional Review Board Statement
Informed Consent Statement
Data Availability Statement
Conflicts of Interest
References
- Jhaveri, J.H.; Murthy, Z.V.P. A comprehensive review on anti-fouling nanocomposite membranes for pressure driven membrane separation processes. Desalination 2016, 379, 137–154. [Google Scholar] [CrossRef]
- Nguyen, T.; Roddick, F.A.; Fan, L. Biofouling of water treatment membranes: A review of the underlying causes, monitoring techniques and control measures. Membranes 2012, 2, 804–840. [Google Scholar] [CrossRef] [PubMed]
- Makvandi, P.; Wang, C.Y.; Zare, E.N.; Borzacchiello, A.; Niu, L.N.; Tay, F.R. Metal-based nanomaterials in biomedical applications: Antimicrobial activity and cytotoxicity aspects. Adv. Funct. Mater. 2020, 30, 191002. [Google Scholar] [CrossRef]
- Qi, L.; Liu, Z.; Wang, N.; Hu, Y. Facile and efficient in situ synthesis of silver nanoparticles on diverse filtration membrane surfaces for antimicrobial performance. Appl. Surf. Sci. 2018, 456, 95–103. [Google Scholar] [CrossRef]
- Khaydarov, R.; Gapurova, O.; Abdukhakimov, M.; Sadikov, I.; Garipov, I.; Krishnamurthy, P.T.; Zharkov, S.M.; Zeer, G.M.; Abolentseva, P.A.; Prudnikova, S.V.; et al. Antimicrobial properties of nanofiltration membranes modified with silver nanoparticles. Emergent Mater. 2022, 5, 1477–1483. [Google Scholar] [CrossRef]
- Peng, K.; Huang, Y.; Peng, N.; Chang, C. Antibacterial nanocellulose membranes coated with silver nanoparticles for oil/water emulsions separation. Carbohydr. Polym. 2022, 278, 118929. [Google Scholar] [CrossRef]
- Beisl, S.; Monteiro, S.; Santos, R.; Figueiredo, A.S.; Sánchez-Loredo, M.G.; Lemos, M.A.; Lemos, F.; Minhalma, M.; de Pinho, M.N. Synthesis and bactericide activity of nanofiltration composite membranes—Cellulose acetate/silver nanoparticles and cellulose acetate/silver ion exchanged zeolites. Water Res. 2019, 149, 225–231. [Google Scholar] [CrossRef]
- Figueiredo, A.S.; Sánchez-Loredo, M.G.; Maurício, A.; Pereira, M.F.C.; Minhalma, M.; De Pinho, M.N. Tailoring of structures and permeation properties of asymmetric nanocomposite cellulose acetate/silver membranes. J. Appl. Polym. Sci. 2015, 132, 41796. [Google Scholar] [CrossRef]
- Tashdjian, A.; Sánchez Loredo, M.G.; González, G.A. Preparation of Silver Nanoparticles-Based Sensors for the Electrochemical Detection of Thiourea in Leaching Solutions of Waste Electrical and Electronic Equipment. Electroanalysis 2013, 25, 2124–2129. [Google Scholar] [CrossRef]
- Kunst, B.; Sourirajan, S. An approach to the development of cellulose acetate ultrafiltration membranes. J. Appl. Polym. Sci. 1974, 18, 3423–3434. [Google Scholar] [CrossRef]
- Kesting, R.E. Synthetic Polymeric Membranes—A Structural Perspective; Wiley-Interscience: New York, NY, USA, 1985. [Google Scholar]
- Abid, M.; Bouattour, S.; Ferraria, A.M.; Conceição, D.S.; Carapeto, A.P.; Vieira Ferreira, L.F.; Botelho do Rego, A.M.; Chehimi, M.M.; Rei Vilar, M.; Boufi, S. Facile functionalization of cotton with nanostructured silver/titania for visible-light plasmonic photocatalysis. J. Colloid. Interf. Sci. 2017, 507, 83–94. [Google Scholar] [CrossRef] [PubMed]
- Taurozzi, J.S.; Arul, H.; Bosak, V.Z.; Burban, A.F.; Voice, T.C.; Bruening, M.L.; Tarabara, V.V. Effect of filler incorporation route on the properties of polysulfone–silver nanocomposite membranes of different porosities. J. Membr. Sci. 2008, 325, 58–68. [Google Scholar] [CrossRef]
- Maheswari, P.; Prasannadevi, D.; Mohan, D. Preparation and performance of silver nanoparticle incorporated polyetherethersulfone nanofiltration membranes. High Perform. Polym. 2012, 25, 174–187. [Google Scholar] [CrossRef]
- Beamson, G.; Briggs, D. High Resolution XPS of Organic Polymers, The Scienta ESCA300 Database, 1st ed.; John Wiley & Sons Ltd.: West Sussex, UK, 1992. [Google Scholar]
- Ferraria, A.M.; Carapeto, A.P.; Botelho do Rego, A.M. X-ray photoelectron spectroscopy: Silver salts revisited. Vacuum 2012, 86, 1988–1991. [Google Scholar] [CrossRef]
- Boufi, S.; Ferraria, A.M.; Botelho Do Rego, A.M.; Battaglini, N.; Herbst, F.; Rei, M. Vilar Surface functionalisation of cellulose with noble metals nanoparticles through a selective nucleation. Carbohyd. Polym. 2011, 86, 1586–1594. [Google Scholar] [CrossRef]
- Pedre, I.; Battaglini, F.; Delgado, G.J.L.; Sánchez-Loredo, M.G.; González, G.A. Detection of thiourea from electrorefining baths using silver nanoparticles-based sensors. Sensor. Actuat. B-Chem. 2015, 211, 515–522. [Google Scholar] [CrossRef]
- Pedre, I.; Méndez DeLeo, L.P.; Sánchez-Loredo, M.G.; Battaglini, F.; González, G.A. Electrochemical sensor for thiourea focused on metallurgical applications of copper. Sensor. Actuat. B-Chem. 2016, 232, 383–389. [Google Scholar] [CrossRef]
- Choi, O.; Deng, K.K.; Kim, N.-J.; Ross, L.; Surampalli, R.Y.; Hu, Z.; Ross Louis, J.; Surampalli, Y.; Hu, Z. The inhibitory effects of silver nanoparticles, silver ions, and silver chloride colloids on microbial growth. Water Res. 2008, 42, 3066–3074. [Google Scholar] [CrossRef]
- World Health Organization; Fewtrell, L. Silver: Water Disinfection and Toxicity. 2014. Available online: http://www.who.int/water_sanitation_health/dwq/chemicals/Silver_water_disinfection_toxicity_2014V2.pdf?ua=1 (accessed on 19 April 2018).
- Kim, K.J.; Sung, W.S.; Suh, B.K.; Moon, S.K.; Choi, J.S.; Kim, J.G.; Lee, D.G. Antifungal activity and mode of action of silver nano-particles on Candida albicans. Biometals 2009, 22, 235–242. [Google Scholar] [CrossRef]
- Xiu, Z.-M.; Ma, J.; Alvarez, P.J.J. Differential Effect of Common Ligands and Molecular Oxygen on Antimicrobial Activity of Silver Nanoparticles versus Silver Ions. Environ. Sci. Technol. 2011, 45, 9003–9008. [Google Scholar] [CrossRef]
- Xiu, Z.-M.; Zhang, Q.-B.; Puppala, H.L.; Colvin, V.L.; Alvarez, P.J.J. Negligible Particle-Specific Antibacterial Activity of Silver Nanoparticles. Nano Lett. 2012, 12, 4271–4275. [Google Scholar] [CrossRef] [PubMed]


| Casting Solution (wt%) | |||||||||
|---|---|---|---|---|---|---|---|---|---|
| Membrane | CA22 | CA22Ag0.1 | CA22Ag0.4 | CA30 | CA30Ag0.1 | CA30Ag0.4 | CA34 | CA34Ag0.1 | CA34Ag0.4 |
| Cellulose acetate | 17.0 | 16.4 | 15.3 | 17.0 | 16.4 | 15.3 | 17.0 | 16.4 | 15.3 |
| Formamide | 22.0 | 21.2 | 19.8 | 30.0 | 29.0 | 27.0 | 34.0 | 32.8 | 30.6 |
| Acetone | 61.0 | 58.9 | 54.9 | 53.0 | 51.1 | 47.7 | 49.0 | 47.3 | 44.1 |
| AgNPs | |||||||||
| Dispersion | - | 3.32 | 9.59 | - | 3.32 | 9.59 | - | 3.32 | 9.59 |
| Silver | - | 0.14 | 0.41 | - | 0.14 | 0.42 | - | 0.14 | 0.41 |
| Casting Conditions | |||||||||
| Temperature of solution (°C) | 20–25 | ||||||||
| Temperature of atmosphere (°C) | 20–25 | ||||||||
| Solvent evaporation time (min) | 0.5 | ||||||||
| Gelation medium | Water at temperature of 0–3 °C during 1–2 h | ||||||||
| Membrane | Jp (kg m−2 h−1) | Lp (kg m−2 h−1 bar−1) | MWCO (kDa) | ||
|---|---|---|---|---|---|
| 1 bar | 2 bar | 3 bar | |||
| CA22 | 2.62 | 6.62 | 11.03 | 3.50 | 4.17 |
| CA22Ag0.1 | 5.31 | 13.90 | 21.87 | 7.05 | 6.86 |
| CA22Ag0.4 | 9.75 | 22.40 | 33.89 | 11.16 | 15.35 |
| CA30 | 24.43 | 62.73 | 99.59 | 32.05 | 8.32 |
| CA30Ag0.1 | 55.06 | 136.59 | 202.57 | 66.85 | 17.58 |
| CA30Ag0.4 | 58.28 | 123.51 | 176.93 | 59.72 | 26.52 |
| CA34 | 68.55 | 176.68 | 236.81 | 80.88 | 31.43 |
| CA34Ag0.1 | 76.44 | 187.99 | 243.42 | 84.48 | 41.05 |
| CA34Ag0.4 | 62.60 | 123.17 | 172.80 | 59.10 | 31.96 |
| Phase Name: | Silver | Scale: | 0.0007801(63) | ||||
|---|---|---|---|---|---|---|---|
| R-Bragg: | 2.028 | Cell Mass: | 431.470 | ||||
| Space Group: | Fm-3m | Cell Volume (Å3): | 68.258(19) | ||||
| Wt%—Rietveld: | 77.0(12) | ||||||
| Crystallite Size | |||||||
| Cryst. Size Lorentzian (nm): | 22.26(28) | ||||||
| Cryst. Linear Absorp. Coeff. (1/cm): | 2247.09(61) | ||||||
| Crystal Density (g/cm3): | 10.4965(29) | ||||||
| Preferred Orientation (Dir 1: 1 1 1): | 0.7610(77) | ||||||
| Lattice parameters | |||||||
| a (≈): | 4.08681(37) | ||||||
| Site | NP | X | Y | Z | Atom | Occ. | Beq |
| Ag | 4 | 0.00000 | 0.00000 | 0.00000 | Ag | 1 | 0 |
Disclaimer/Publisher’s Note: The statements, opinions and data contained in all publications are solely those of the individual author(s) and contributor(s) and not of MDPI and/or the editor(s). MDPI and/or the editor(s) disclaim responsibility for any injury to people or property resulting from any ideas, methods, instructions or products referred to in the content. |
© 2022 by the authors. Licensee MDPI, Basel, Switzerland. This article is an open access article distributed under the terms and conditions of the Creative Commons Attribution (CC BY) license (https://creativecommons.org/licenses/by/4.0/).
Share and Cite
Figueiredo, A.S.; Ferraria, A.M.; Botelho do Rego, A.M.; Monteiro, S.; Santos, R.; Minhalma, M.; Sánchez-Loredo, M.G.; Tovar-Tovar, R.L.; de Pinho, M.N. Bactericide Activity of Cellulose Acetate/Silver Nanoparticles Asymmetric Membranes: Surfaces and Porous Structures Role. Membranes 2023, 13, 4. https://doi.org/10.3390/membranes13010004
Figueiredo AS, Ferraria AM, Botelho do Rego AM, Monteiro S, Santos R, Minhalma M, Sánchez-Loredo MG, Tovar-Tovar RL, de Pinho MN. Bactericide Activity of Cellulose Acetate/Silver Nanoparticles Asymmetric Membranes: Surfaces and Porous Structures Role. Membranes. 2023; 13(1):4. https://doi.org/10.3390/membranes13010004
Chicago/Turabian StyleFigueiredo, Ana Sofia, Ana Maria Ferraria, Ana Maria Botelho do Rego, Silvia Monteiro, Ricardo Santos, Miguel Minhalma, María Guadalupe Sánchez-Loredo, Rosa Lina Tovar-Tovar, and Maria Norberta de Pinho. 2023. "Bactericide Activity of Cellulose Acetate/Silver Nanoparticles Asymmetric Membranes: Surfaces and Porous Structures Role" Membranes 13, no. 1: 4. https://doi.org/10.3390/membranes13010004
APA StyleFigueiredo, A. S., Ferraria, A. M., Botelho do Rego, A. M., Monteiro, S., Santos, R., Minhalma, M., Sánchez-Loredo, M. G., Tovar-Tovar, R. L., & de Pinho, M. N. (2023). Bactericide Activity of Cellulose Acetate/Silver Nanoparticles Asymmetric Membranes: Surfaces and Porous Structures Role. Membranes, 13(1), 4. https://doi.org/10.3390/membranes13010004