
N-Propanol Dehydration with Distillation and Pervaporation: Experiments and Modelling


Abstract
:1. Introduction
2. Materials and Methods
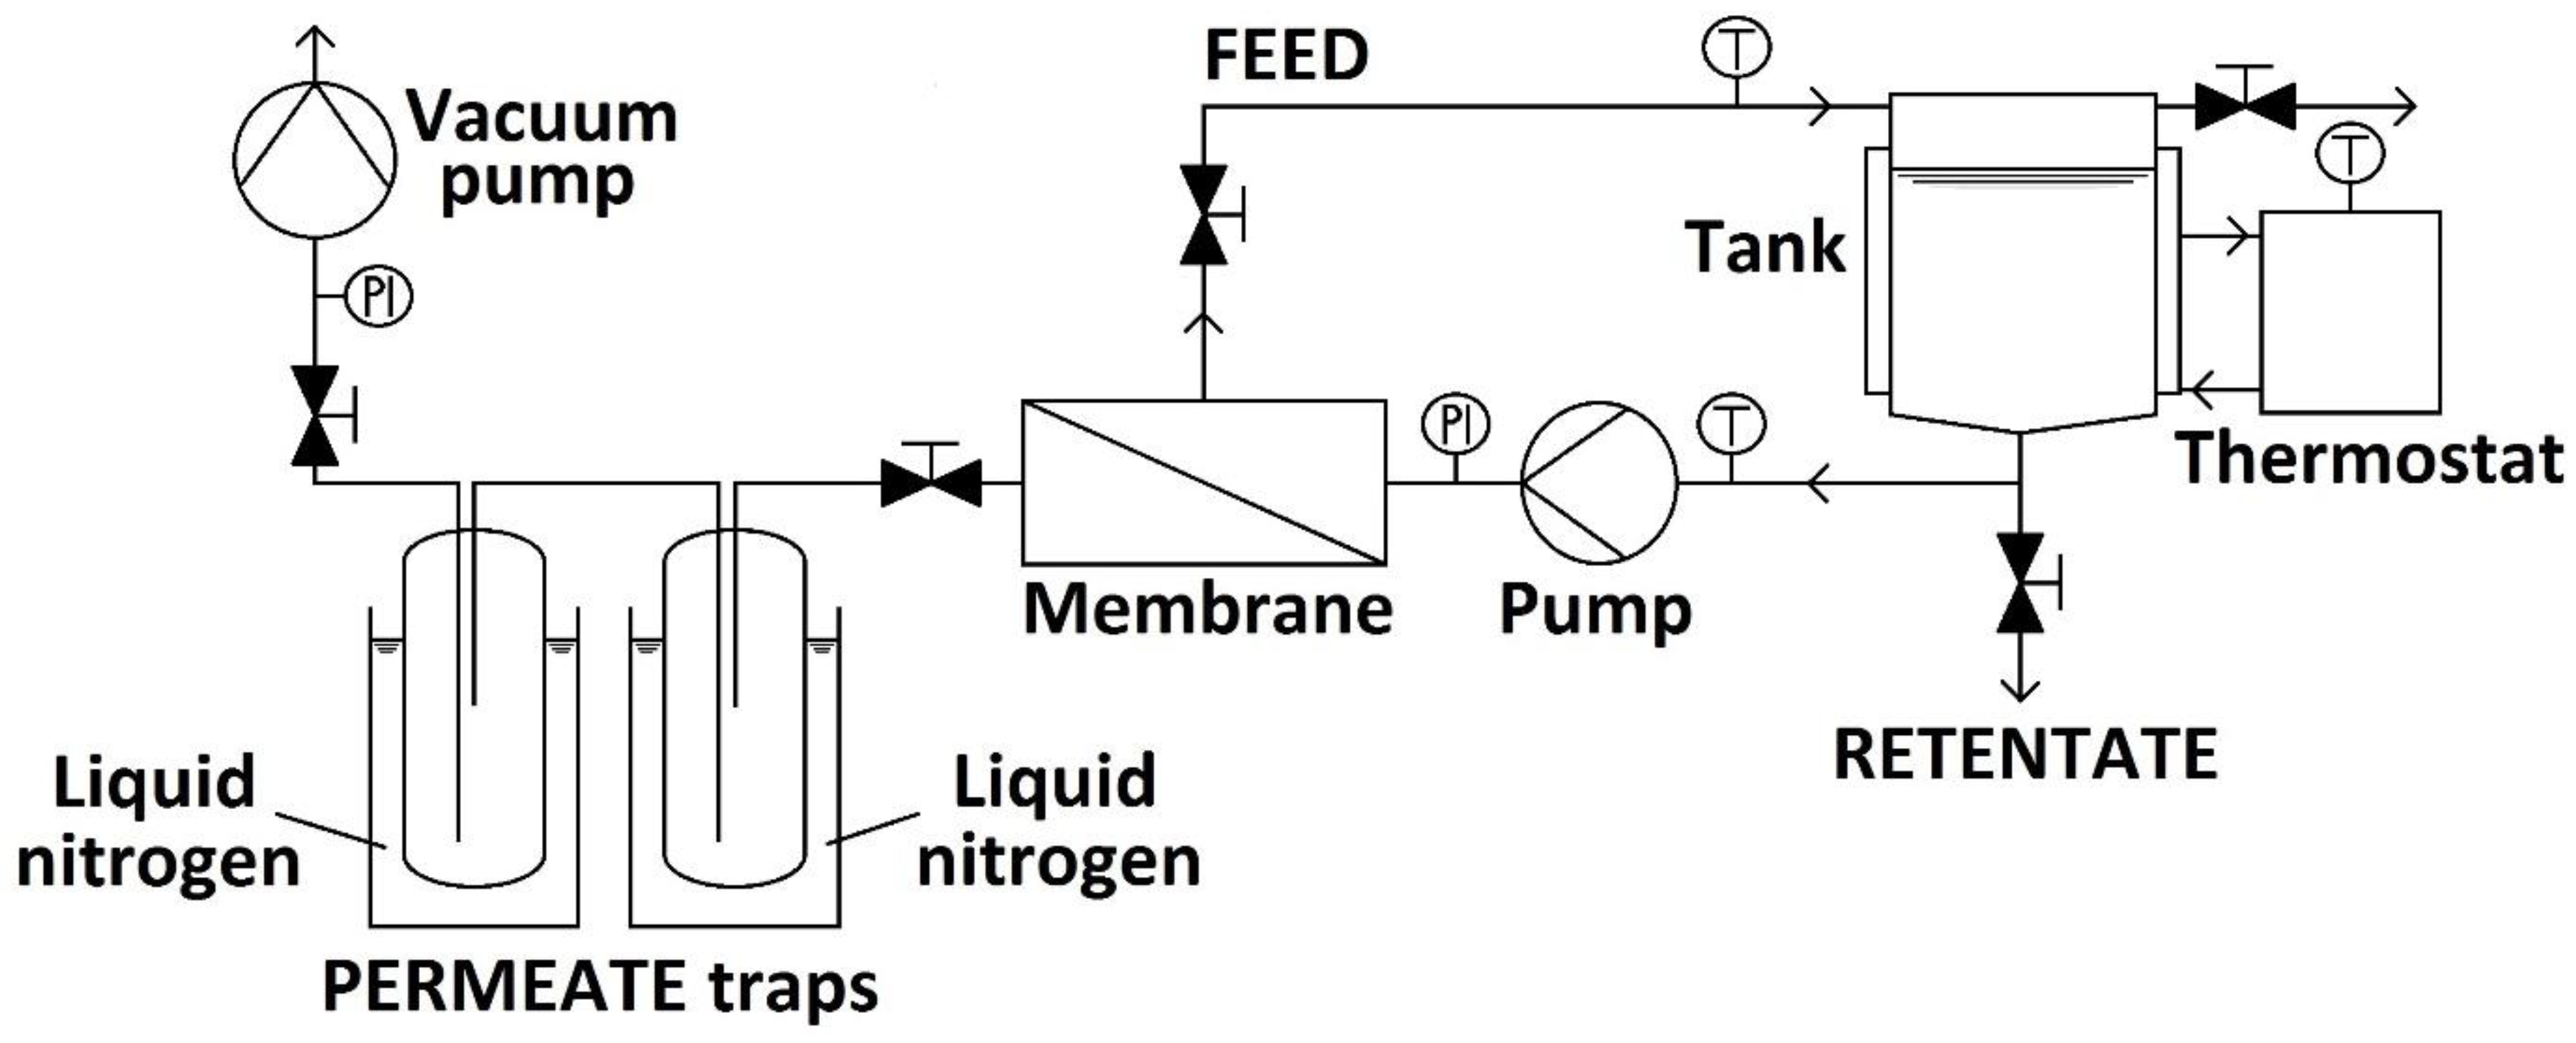
2.1. Hydrophilic Pervaporation Experiments
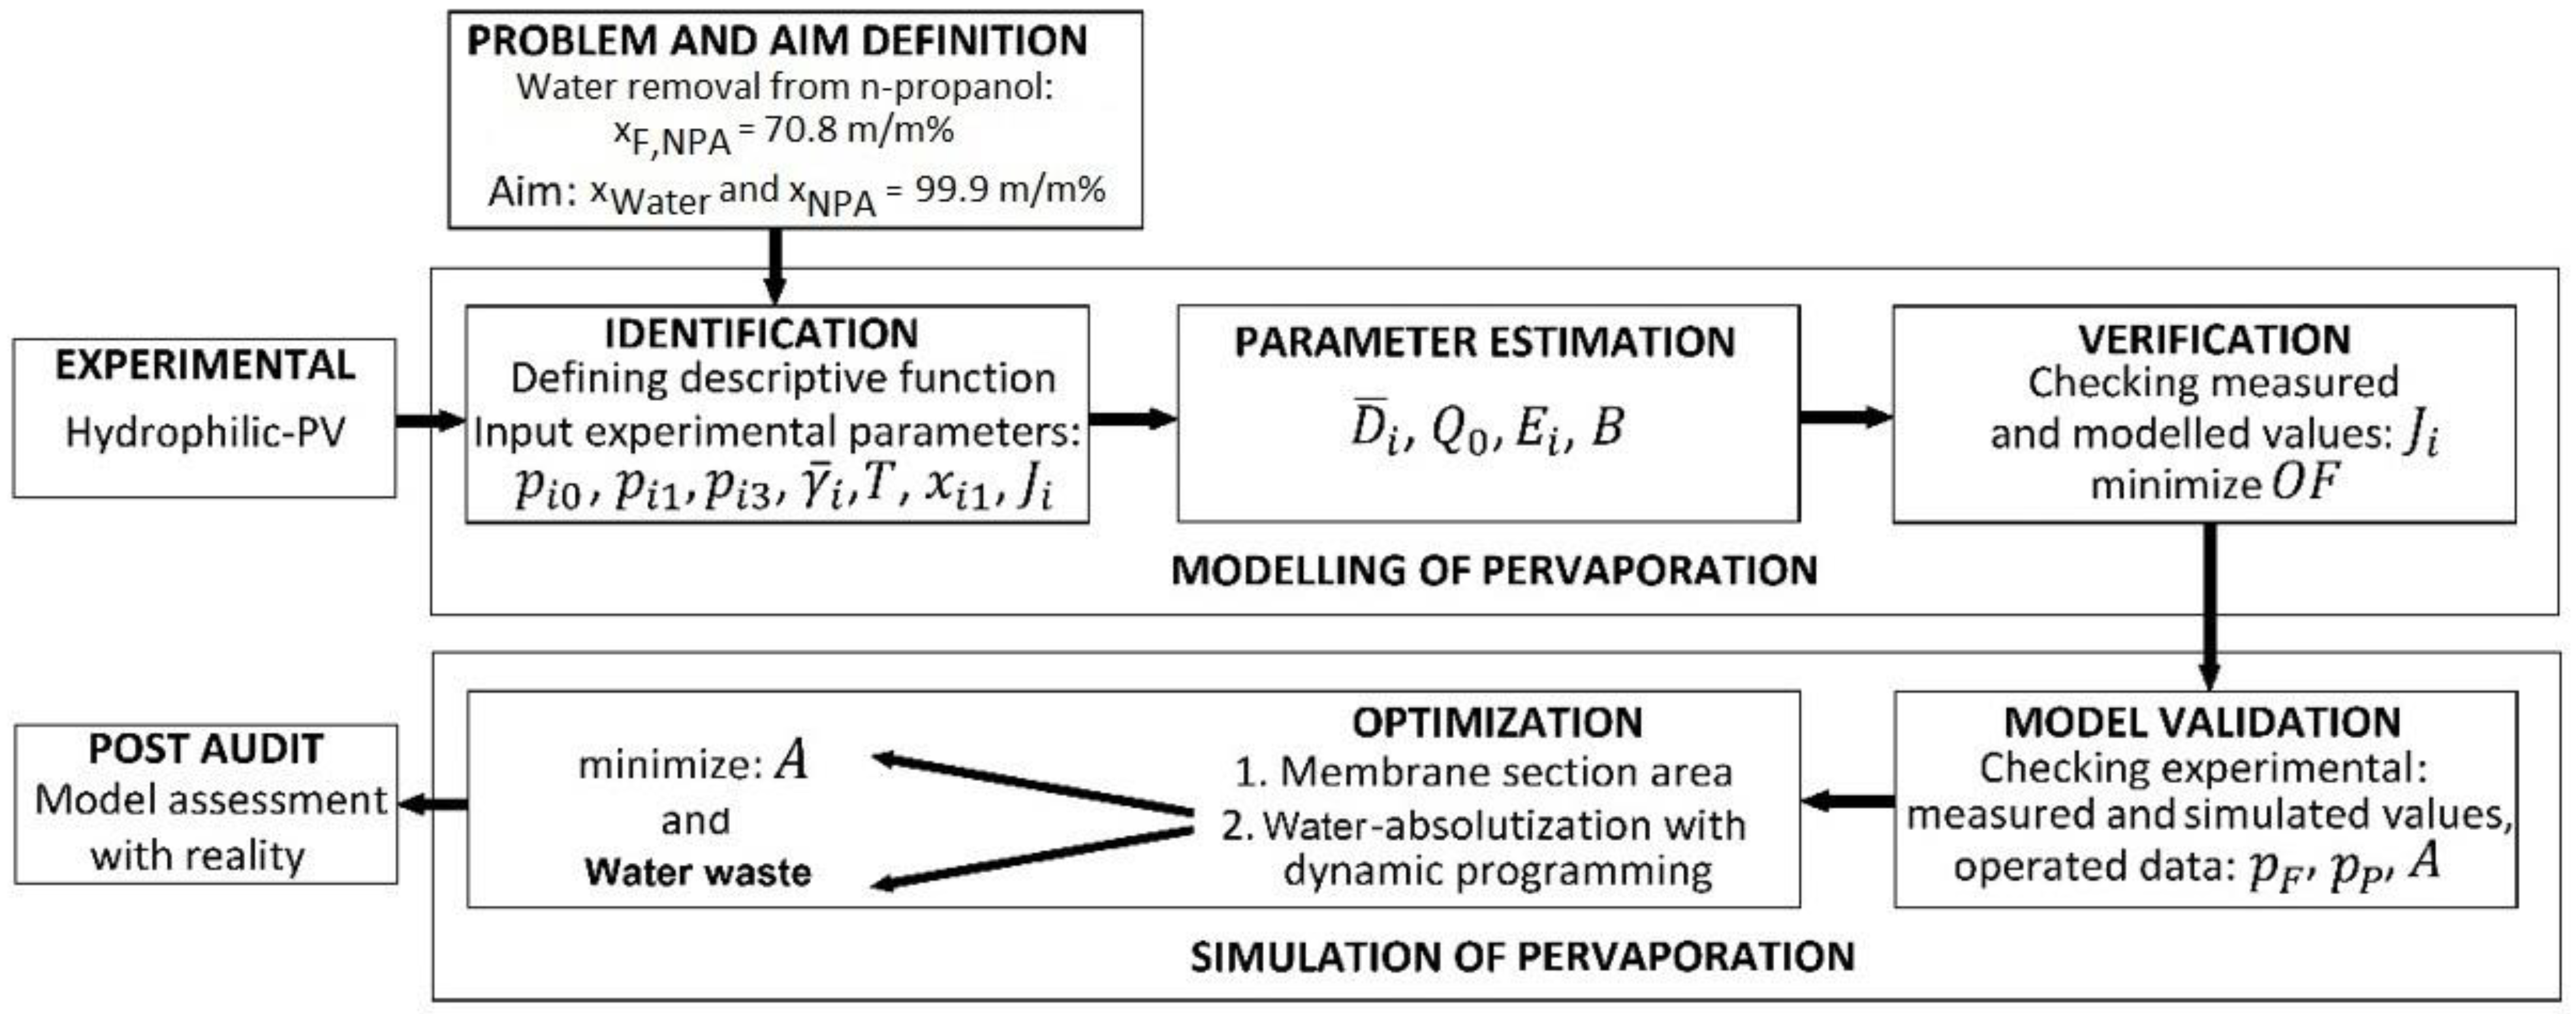
2.2. Modelling of Pervaporation
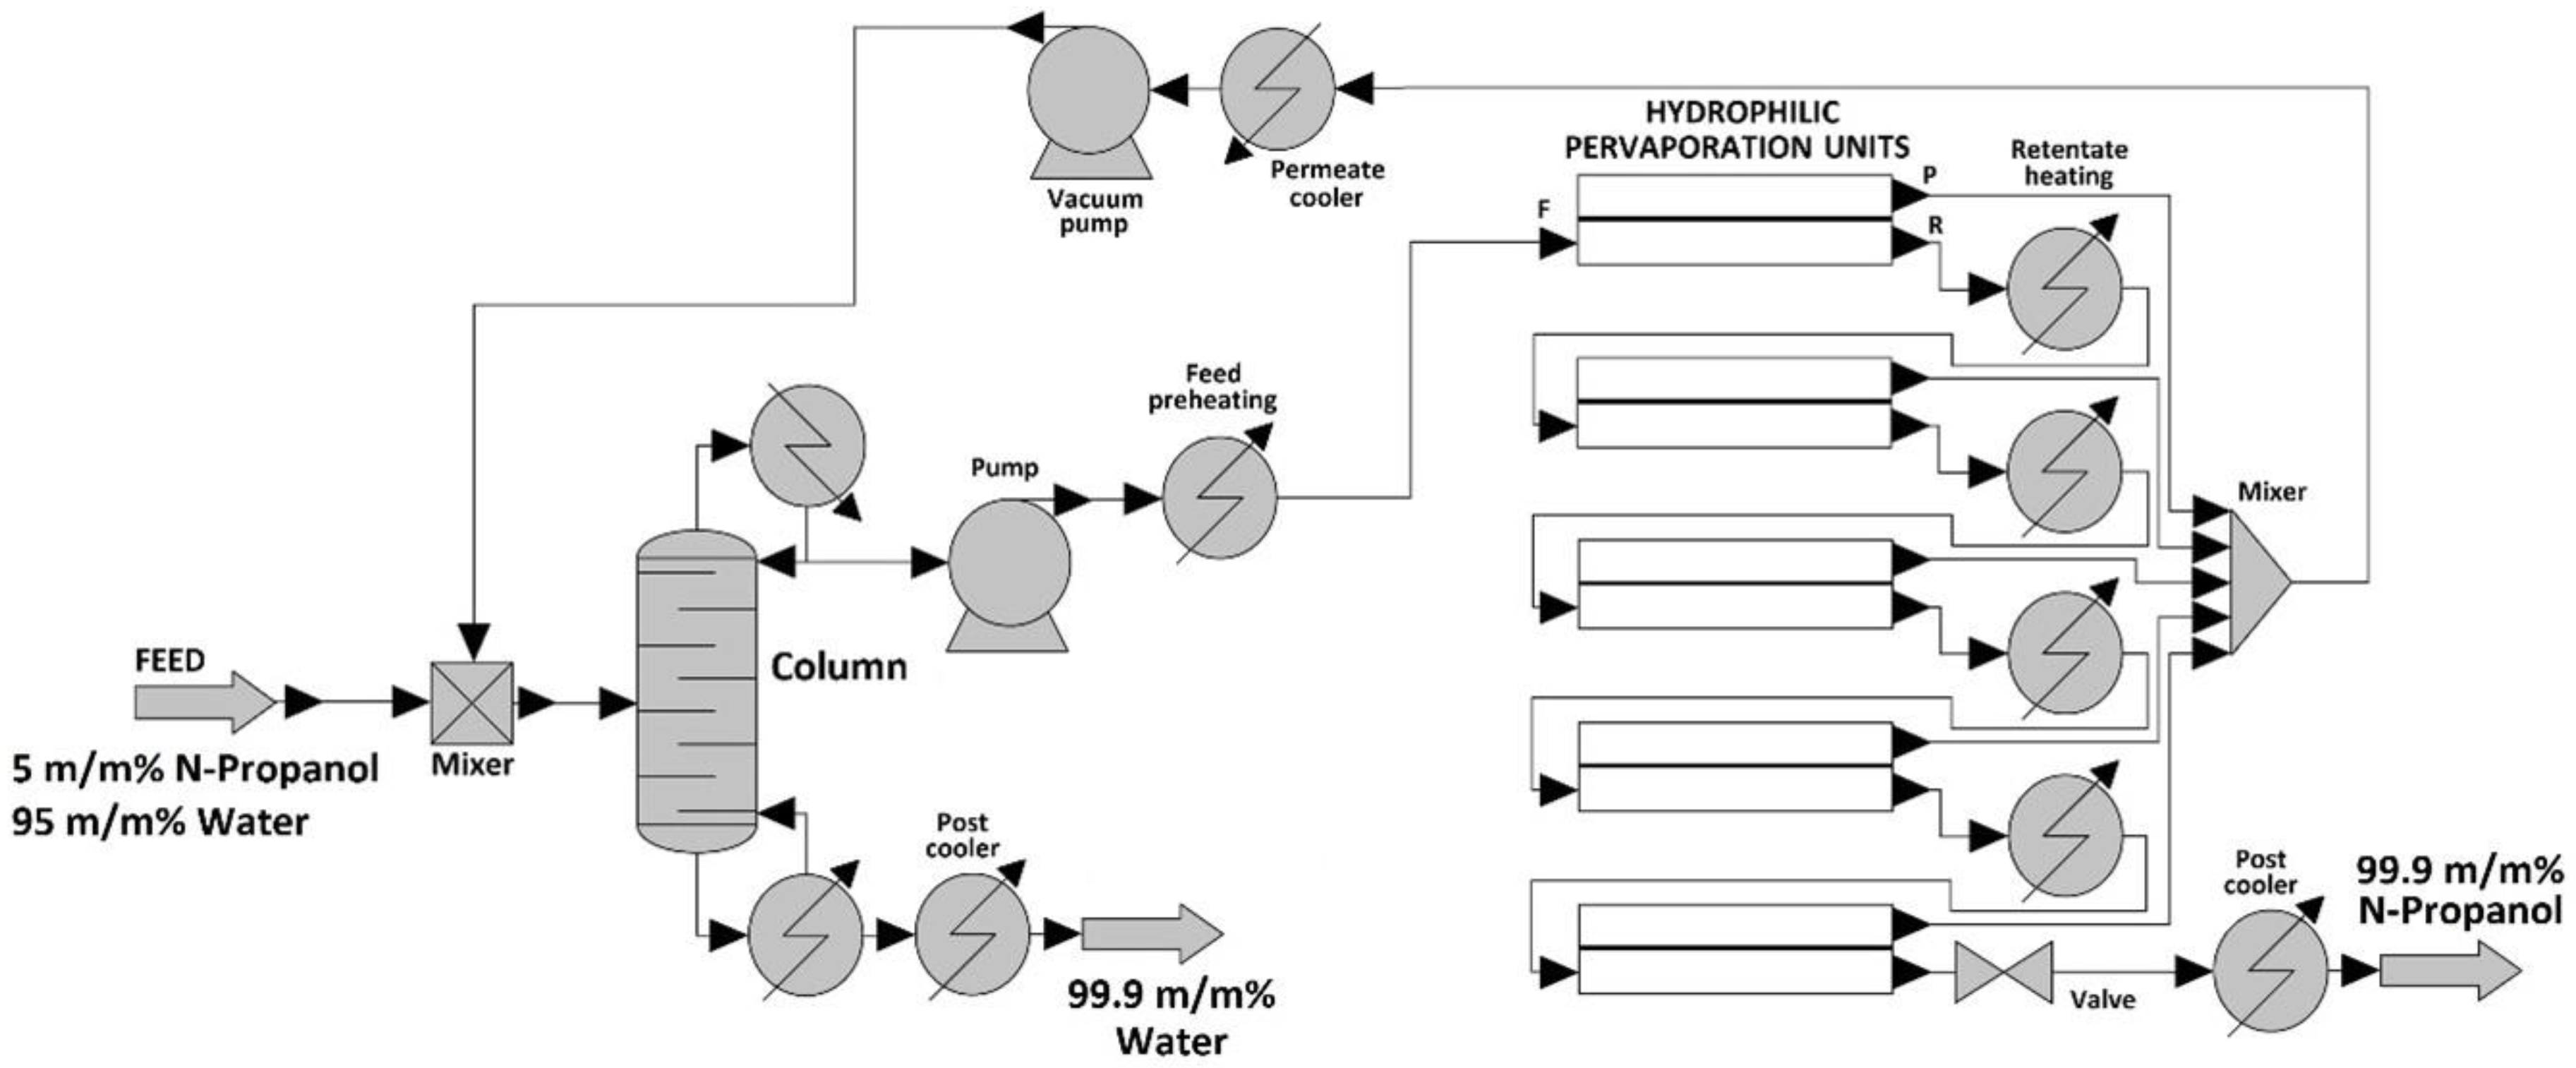
2.3. Simulation of Hybrid Distillation and Pervaporation Method
3. Results and Discussion
4. Conclusions
Funding
Data Availability Statement
Acknowledgments
Conflicts of Interest
Nomenclature
| Membrane transfer area | ||
| Constant in Model II | ||
| Distillate product | ||
| Transport coefficient of component | ||
| Relative transport coefficient of component | ||
| Activation energy of component in Equation (12) for temperature dependence of the transport coefficient | ||
| Feed | ||
| Component number | ||
| Component number | ||
| Total flux | ||
| Partial flux | ||
| N | Number of theoretical stages | [-] |
| Permeate | ||
| Pure i component vapour pressure | ||
| Partial pressure of component on the liquid phase membrane side | ||
| Partial pressure of component on the vapour phase membrane side | ||
| Pressure on the permeate side | ||
| Permeance of component | ||
| Q0 | Permeability of the porous supporting layer of the membrane | [] |
| Retentate | ||
| Ʀ | Gas constant | |
| Temperature | ||
| Reference temperature: 293 | ||
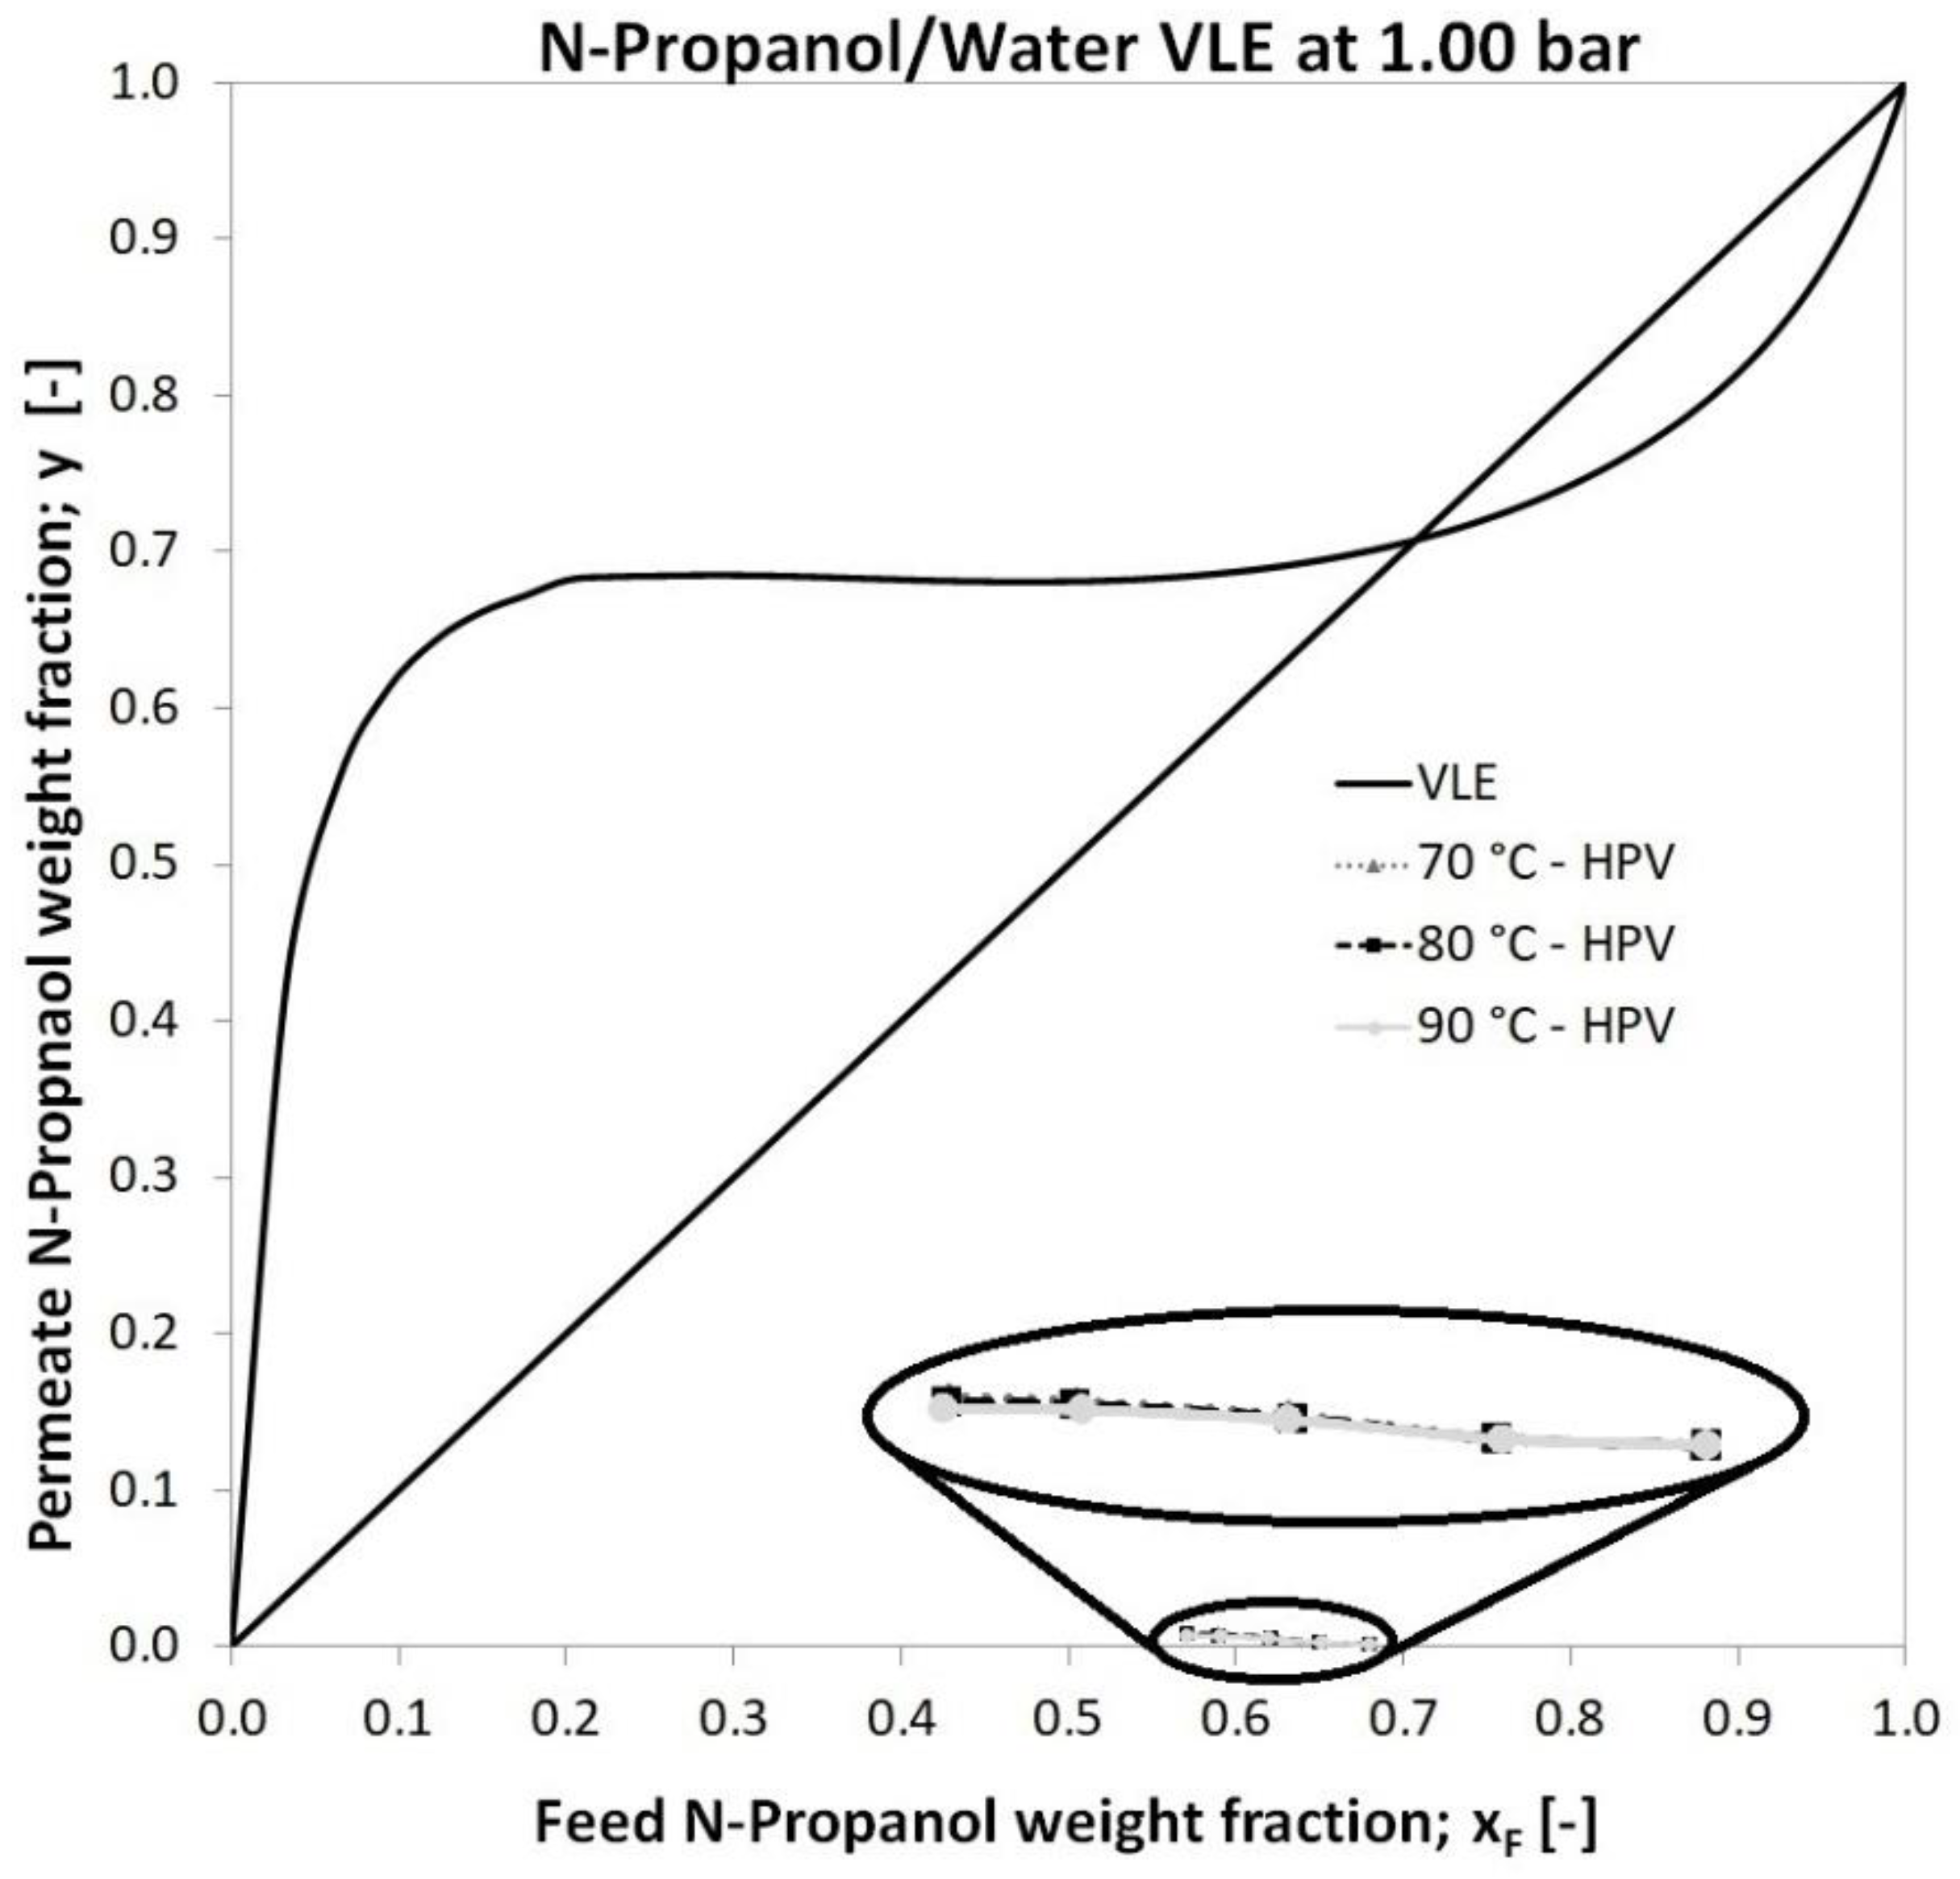
| Feed n-propanol weight fraction in vapour-liquid equilibrium (VLE) diagram (Figure 5) | ||
| Concentration of component in the feed | ||
| Permeate n-propanol and water weight fraction in vapour-liquid equilibrium (VLE) diagram (Figure 5) | ||
| Permeate concentration in Membrane Flash Index (MFLI) | ||
| Equilibrium distillation value in Membrane Flash Index (MFLI) |
Abbreviations
| HPV | Hydrophilic pervaporation | |
| hydr | hydrophilic | |
| MFLI | Membrane Flash Index | |
| NPA | n-propanol | |
| OF | Objective function | |
| PSI | Pervaporation Separation Index | |
| PVA | Polyvinyl alcohol | |
| PV | Pervaporation | |
| VLE | Vapour-Liquid Equilibrium | |
| Greek letters | ||
| Separation factor | ||
| Selectivity | ||
| in the feed | ||
| δ | Membrane thickness | |
References
- Szilagyi, B.; Toth, A.J. Improvement of Component Flux Estimating Model for Pervaporation Processes. Membranes 2020, 10, 418. [Google Scholar] [CrossRef] [PubMed]
- Valentínyi, N.; Cséfalvay, E.; Mizsey, P. Modelling of pervaporation: Parameter estimation and model development. Chem. Eng. Res. Des. 2013, 91, 174–183. [Google Scholar] [CrossRef]
- Valentínyi, N.; Mizsey, P. Comparison of pervaporation models with simulation of hybrid separation processes. Period. Polytech. Chem. Eng. 2014, 58, 7–14. [Google Scholar] [CrossRef]
- Toth, A.J. Liquid Waste Treatment with Physicochemical Tools for Environmental Protection. Ph.D. Thesis, Budapest University of Technology and Economics, Budapest, Hungary, 2015. [Google Scholar]
- Crespo, J.G.; Brazinha, C. 1—Fundamentals of pervaporation. In Pervaporation, Vapour Permeation and Membrane Distillation; Woodhead Publishing: Oxford, UK, 2015; pp. 3–17. [Google Scholar]
- Haaz, E.; Toth, A.J. Methanol dehydration with pervaporation: Experiments and modelling. Sep. Purif. Technol. 2018, 205, 121–129. [Google Scholar] [CrossRef]
- Toth, A.J.; Andre, A.; Haaz, E.; Mizsey, P. New horizon for the membrane separation: Combination of organophilic and hydrophilic pervaporations. Sep. Purif. Technol. 2015, 156, 432–443. [Google Scholar] [CrossRef]
- Baker, R.W.; Wijmans, J.G.; Huang, Y. Permeability, permeance and selectivity: A preferred way of reporting pervaporation performance data. J. Membr. Sci. 2010, 348, 346–352. [Google Scholar] [CrossRef]
- Toth, A.J.; Haaz, E.; Valentinyi, N.; Nagy, T.; Tarjani, A.J.; Fozer, D.; Andre, A.; Khaled Mohamed, S.A.; Solti, S.; Mizsey, P. Selection between Separation Alternatives: Membrane Flash Index (MFLI). Ind. Eng. Chem. Res. 2018, 57, 11366–11373. [Google Scholar] [CrossRef] [Green Version]
- Toth, A.J.; Szilagyi, B.; Fozer, D.; Haaz, E.; Selim, A.K.M.; Szőri, M.; Viskolcz, B.; Mizsey, P. Membrane Flash Index: Powerful and Perspicuous Help for Efficient Separation System Design. ACS Omega 2020, 5, 15136–15145. [Google Scholar] [CrossRef]
- Zhu, T.; Xia, Q.; Zuo, J.; Liu, S.; Yu, X.; Wang, Y. Recent advances of thin film composite membranes for pervaporation applications: A comprehensive review. Adv. Membr. 2021, 1, 100008. [Google Scholar] [CrossRef]
- Ang, M.B.M.Y.; Marquez, J.A.D.; Huang, S.-H.; Lee, K.-R. A recent review of developmental trends in fabricating pervaporation membranes through interfacial polymerization and future prospects. J. Ind. Eng. Chem. 2021, 97, 129–141. [Google Scholar] [CrossRef]
- Liu, G.; Jin, W. Pervaporation membrane materials: Recent trends and perspectives. J. Membr. Sci. 2021, 636, 119557. [Google Scholar] [CrossRef]
- Teleman, D.; Kreis, P.; Lauterbach, S.; Teodosiu, C.; Balasanian, I. Optimal operational conditions for the pervaporation of a binary combination of water/1-propanol and water/1-propanol/propionic acid ternary combination. Period. Mineral. 2022, 91, 30–43. [Google Scholar] [CrossRef]
- Burshe, M.C.; Sawant, S.B.; Joshi, J.B.; Pangarkar, V.G. Sorption and permeation of binary water-alcohol systems through PVA membranes crosslinked with multifunctional crosslinking agents. Sep. Purif. Technol. 1997, 12, 145–156. [Google Scholar] [CrossRef]
- Gesing, D. Experimentelle und theoretische Untersuchungen der Pervaporation mit einem Flachmembranmodul zur Entwässerung von Reaktionsgemischen. Master’s Thesis, Dortmund University, Dortmund, Germany, 2004. [Google Scholar]
- Peters, T.; Benes, N.; Buijs, H.; Vercauteren, F.; Keurentjes, J. Thin high flux ceramic-supported PVA membranes. Desalination 2006, 200, 37–39. [Google Scholar] [CrossRef]
- Sokolova, M.P.; Bugrov, A.N.; Smirnov, M.A.; Smirnov, A.V.; Lahderanta, E.; Svetlichnyi, V.M.; Toikka, A.M. Effect of Domain Structure of Segmented Poly(urethane-imide) Membranes with Polycaprolactone Soft Blocks on Dehydration of n-Propanol via Pervaporation. Polymers 2018, 10, 1222. [Google Scholar] [CrossRef] [Green Version]
- Toutianoush, A.; Krasemann, L.; Tieke, B. Polyelectrolyte multilayer membranes for pervaporation separation of alcohol/water mixtures. Colloids Surf. A Physicochem. Eng. Asp. 2002, 198–200, 881–889. [Google Scholar] [CrossRef]
- Wu, Y.; Meng, D.; Yao, D.; Liu, X.; Xu, Y.; Zhu, Z.; Wang, Y.; Gao, J. Mechanism Analysis, Economic Optimization, and Environmental Assessment of Hybrid Extractive Distillation–Pervaporation Processes for Dehydration of n-Propanol. ACS Sustain. Chem. Eng. 2020, 8, 4561–4571. [Google Scholar] [CrossRef]
- Wang, S.; Dai, Y.; Ma, Z.; Qi, H.; Chen, Z.; Shen, Y.; Yang, J.; Cui, P.; Wang, Y.; Zhu, Z.; et al. Application of energy-saving hybrid distillation-pervaporation process for recycling organics from wastewater based on thermoeconomic and environmental analysis. J. Clean. Prod. 2021, 294, 126297. [Google Scholar] [CrossRef]
- Do Thi, H.T.; Mizsey, P.; Toth, A.J. Separation of Alcohol-Water Mixtures by a Combination of Distillation, Hydrophilic and Organophilic Pervaporation Processes. Membranes 2020, 10, 345. [Google Scholar] [CrossRef]
- Koczka, K.; Mizsey, P.; Fonyo, Z. Rigorous modelling and optimization of hybrid separation processes based on pervaporation. Cent. Eur. J. Chem. 2007, 5, 1124–1147. [Google Scholar] [CrossRef]
- Toth, A.J.; Mizsey, P. Methanol removal from aqueous mixture with organophilic pervaporation: Experiments and modelling. Chem. Eng. Res. Des. 2015, 98, 123–135. [Google Scholar] [CrossRef]
- Toth, A.J.; Haaz, E.; Nagy, T.; Tari, R.; Tarjani, A.J.; Fozer, D.; Szanyi, A.; Koczka, K.-A.; Racz, L.; Ugro, G.; et al. Evaluation of the accuracy of modelling the separation of highly non-ideal mixtures: Extractive heterogeneous-azeotropic distillation. In Computer Aided Chemical Engineering; Espuña, A., Graells, M., Puigjaner, L., Eds.; Elsevier: Amsterdam, The Netherlans, 2017; Volume 40, pp. 241–246. [Google Scholar]
- Schaetzel, P.; Vauclair, C.; Nguyen, Q.T.; Bouzerar, R. A simplified solution-diffusion theory in pervaporation: The total solvent volume fraction model. J. Membr. Sci. 2004, 244, 117–127. [Google Scholar] [CrossRef]
- Marriott, J.; Sørensen, E. A general approach to modelling membrane modules. Chem. Eng. Sci. 2003, 58, 4975–4990. [Google Scholar] [CrossRef]
- Wijmans, J.G.; Baker, R.W. The solution-diffusion model: A review. J. Membr. Sci. 1995, 107, 1–21. [Google Scholar] [CrossRef]
- Luis, P.; van der Bruggen, B. 4—Pervaporation modeling: State of the art and future trends. In Pervaporation, Vapour Permeation and Membrane Distillation; Woodhead Publishing: Oxford, UK, 2015; pp. 87–106. [Google Scholar]
- Rautenbach, R.; Herion, C.; Meyer-Blumentoth, U. Pervaporation membrane separation processes. Membr. Sci. Technol. Ser. 1990, 1, 181–191. [Google Scholar]
- Mizsey, P.; Koczka, K.; Deák, A.; Fonyó, Z. Simulation of pervaporation using the “solution-diffusion” model. J. Hung. Chem. 2005, 7, 239–242. [Google Scholar]
- Edgar, T.F.; Himmelblau, D.M.; Lasdon, L.S. Optimization of Chemical Processes; McGraw-Hill: Detroit, MI, USA, 2001. [Google Scholar]
- Tusel, G.F.; Brüschke, H.E.A. Use of pervaporation systems in the chemical industry. Desalination 1985, 53, 327–338. [Google Scholar] [CrossRef]
- Setnickova, K.; Petrychkovych, R.; Reznickova, J.; Uchytil, P. A novel simple and efficient procedure for the pervaporation transport study of binary mixtures through polymeric membranes: Tested systems propanol isomers–water–polyethylene membrane. J. Taiwan Inst. Chem. Eng. 2016, 58, 49–56. [Google Scholar] [CrossRef]
- Benguergoura, H.; Aouak, T.; Moulay, S. Use of pervaporation technique to monitor the oxidation of primary alcohols: N-propanol and n-butanol. J. Membr. Sci. 2004, 229, 107–116. [Google Scholar] [CrossRef]
- Mohammadi, T.; Aroujalian, A.; Bakhshi, A. Pervaporation of dilute alcoholic mixtures using PDMS membrane. Chem. Eng. Sci. 2005, 60, 1875–1880. [Google Scholar] [CrossRef]
- Bakhshi, A.; Mohammadi, T.; Nik, O.G.; Aroujalian, A. Effect of operating conditions on pervaporation of methanol-water mixtures: Part 2. Membr. Technol. 2006, 2006, 7–11. [Google Scholar] [CrossRef]
- Shelden, R.A.; Thompson, E.V. Dependence of diffusive permeation rates and selectivities on upstream and downstream pressures. IV. Computer simulation of nonideal systems. J. Membr. Sci. 1984, 19, 39–49. [Google Scholar] [CrossRef]
- Bird, R.B.; Stewart, W.E.; Lightfoot, E.N.; Klingenberg, D.J. Introductory Transport Phenomena; Wiley: Hoboken, NJ, USA, 2015. [Google Scholar]
- Toth, A.J.; Haaz, E.; Nagy, T.; Tarjani, A.J.; Fozer, D.; Andre, A.; Valentinyi, N.; Solti, S.; Mizsey, P. Treatment of Pharmaceutical Process Wastewater with Hybrid Separation Method: Distillation and Hydrophilic Pervaporation. Waste Treat. Recovery 2018, 3, 8–13. [Google Scholar] [CrossRef]
- Liu, S.; Li, H.; Kruber, B.; Skiborowski, M.; Gao, X. Process intensification by integration of distillation and vapor permeation or pervaporation—An academic and industrial perspective. Results Eng. 2022, 15, 100527. [Google Scholar] [CrossRef]

 ; 80 °C:
  ; 90 °C:
  ), (A) Total flux, (B) Separation factor, (C) PSI, (D) Selectivity.
; 80 °C: ; 90 °C: ), (A) Total flux, (B) Separation factor, (C) PSI, (D) Selectivity.
), (A) Total flux, (B) Separation factor, (C) PSI, (D) Selectivity.
; 80 °C: ; 90 °C: ), (A) Total flux, (B) Separation factor, (C) PSI, (D) Selectivity.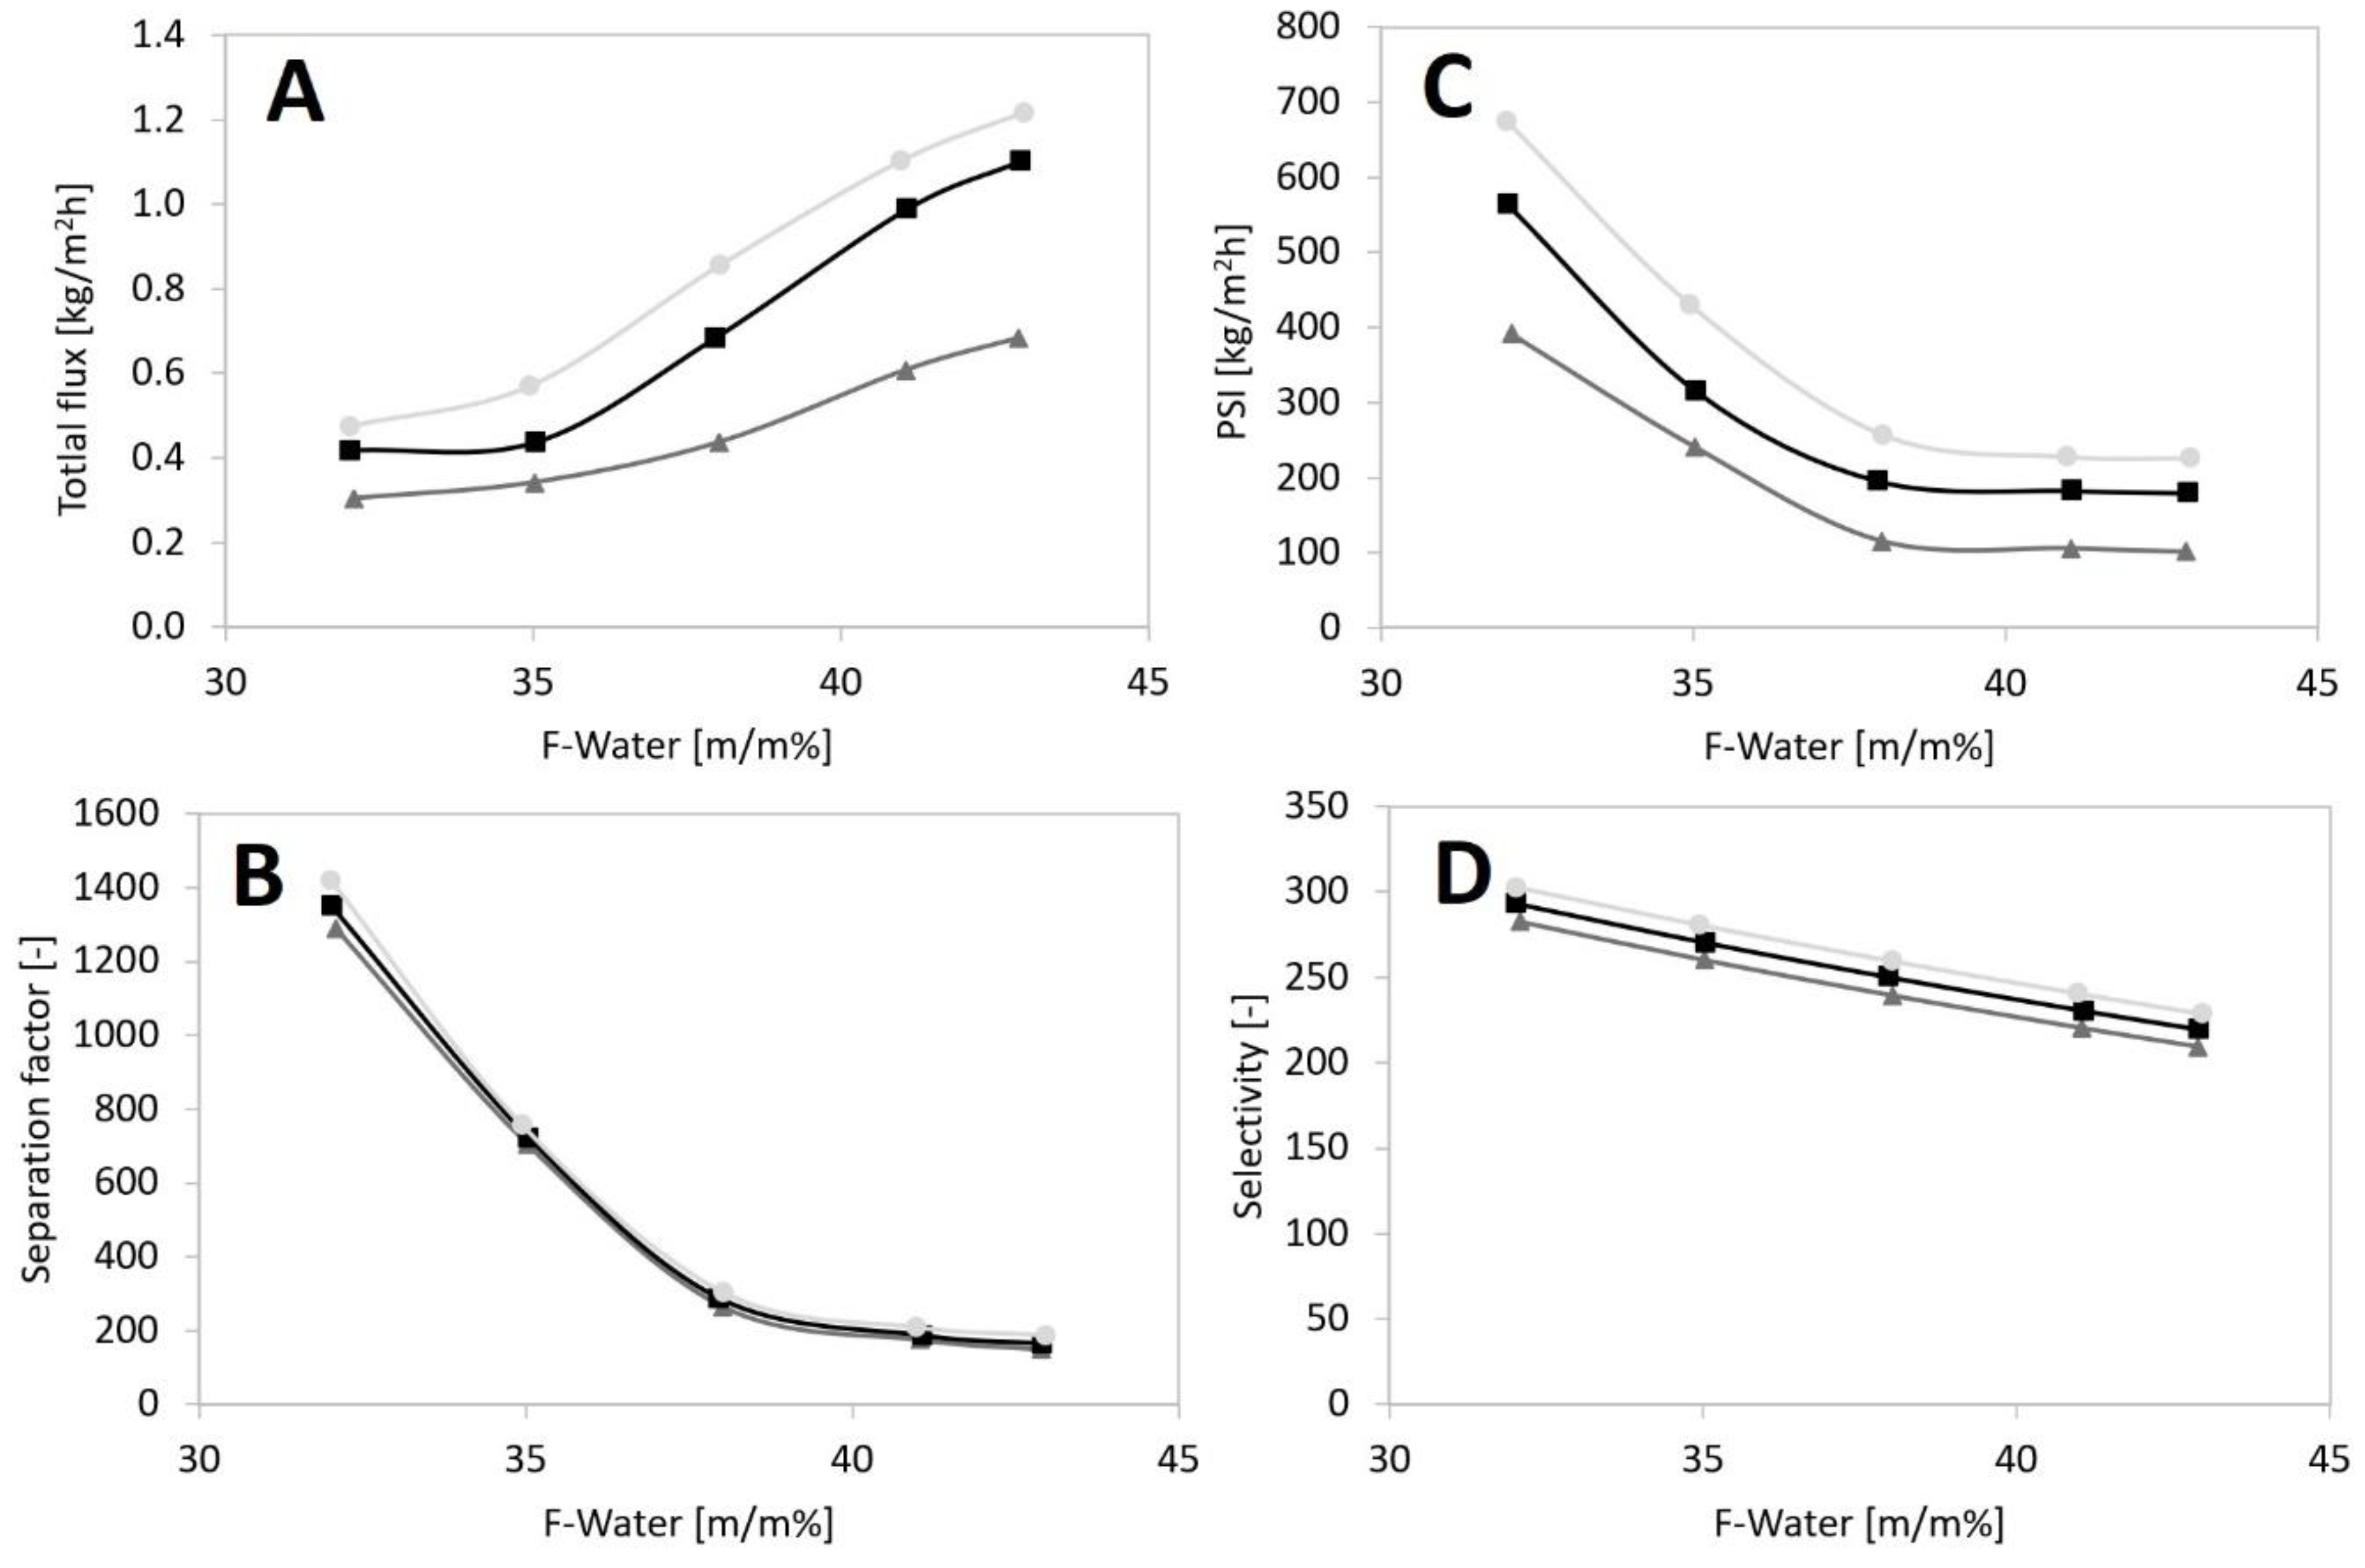

 ) compared to calculated partial fluxes with Model I (
  ) and Model II (
  ) in a function of feed water concentration with PERVAP™ 1201 membrane.
) compared to calculated partial fluxes with Model I ( ) and Model II ( ) in a function of feed water concentration with PERVAP™ 1201 membrane.
) in a function of feed water concentration with PERVAP™ 1201 membrane.
) compared to calculated partial fluxes with Model I ( ) and Model II ( ) in a function of feed water concentration with PERVAP™ 1201 membrane.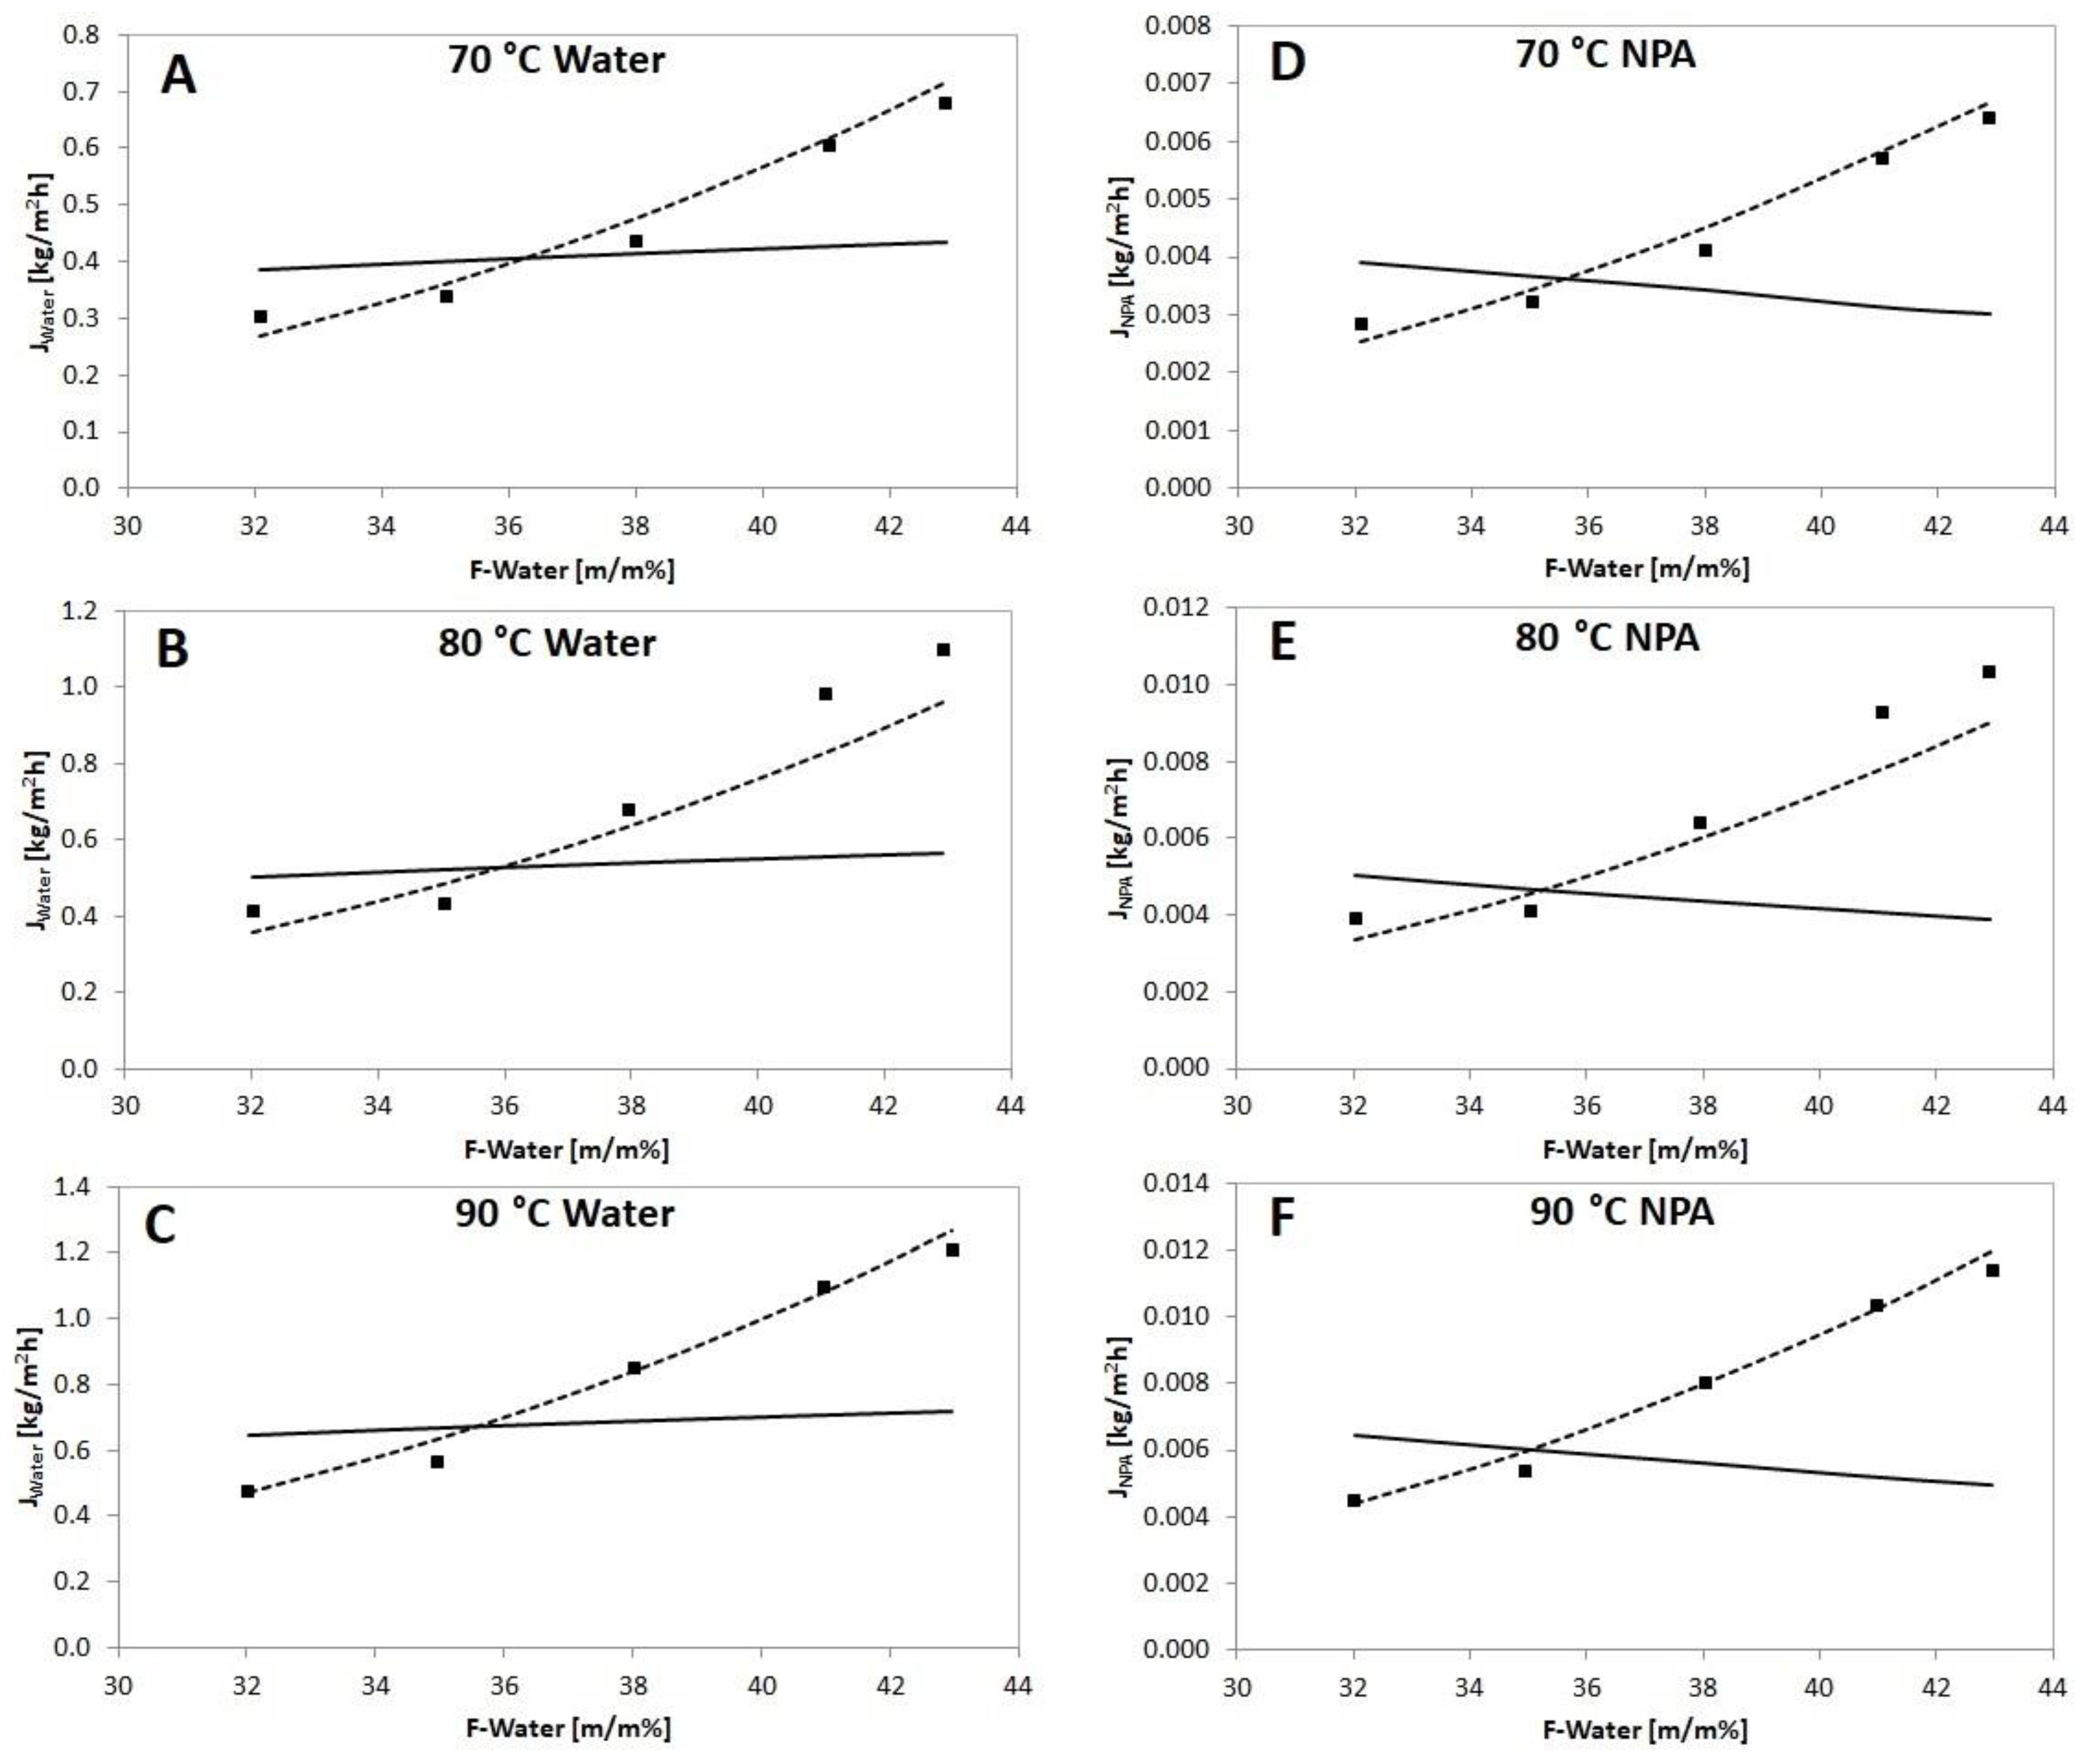

| Membrane Type | T | Fwater | Jtotal | α | PSI | Reference |
|---|---|---|---|---|---|---|
| [°C] | [m/m%] | [kg/m2h] | [–] | [kg/m2h] | ||
| PVA cross-linked with citric acid | 30 | 10 | 0.08 | 141 | 11 | Burshe et al., 1997 [15] |
| PVA/PAN | 60 | 5 | 0.15 | 90 | 13 | Gesing, 2004 [16] |
| αAl2O3/PVA | 70 | 10 | 2.20 | 50 | 108 | Peters et al., 2006 [17] |
| PERVAP™ 2201D (PVA/PAN) | 70 | 10 | 0.52 | 500 | 259 | Teleman et al., 2022 [14] |
| PERVAP™ 2201D (PVA/PAN) | 60 | 10 | 0.26 | 2500 | 650 | Teleman et al., 2022 [14] |
| Poly(urethane-imide)-PUI-2000 | 50 | 20 | 8.80 | 179 | 1566 | Sokolova et al., 2018 [18] |
| Poly(urethane-imide)-PUI-530 | 50 | 20 | 5.10 | 437 | 2224 | Sokolova et al., 2018 [18] |
| polyvinylamine/polyvinylsulphate | 59 | 10 | 1.20 | 6000 | 7199 | Toutianoush et al., 2002 [19] |
| PERVAP™ 1201 | Model I | Model II | ||
|---|---|---|---|---|
| Water | NPA | Water | NPA | |
| [kmol/m2h] | 7.15 × 10⁻³ | 4.20 × 10⁻⁵ | 2.40 × 10⁻⁵ | 2.32 × 10⁻³ |
| [kJ/kmol] | 2.4644 | 2.6053 | 2.7707 | 2.9966 |
| B [−] | 8.38 | −12.08 | ||
| PERVAP™ 1201 | Objective Function-Water | Objective Function-NPA |
|---|---|---|
| Model I | 1.369 | 2.468 |
| Model II | 0.123 | 0.125 |
| Fwater | Jtotal—Measured (Experiment) | Jtotal—Calculated (Model) | Deviation |
|---|---|---|---|
| [m/m%] | [kg/m2h] | [kg/m2h] | [%] |
| 32 | 0.48 | 0.48 | 1.4 |
| 35 | 0.57 | 0.58 | 1.3 |
| 38 | 0.86 | 0.85 | −0.7 |
| 41 | 1.10 | 1.11 | 1.1 |
| 43 | 1.20 | 1.21 | −0.9 |
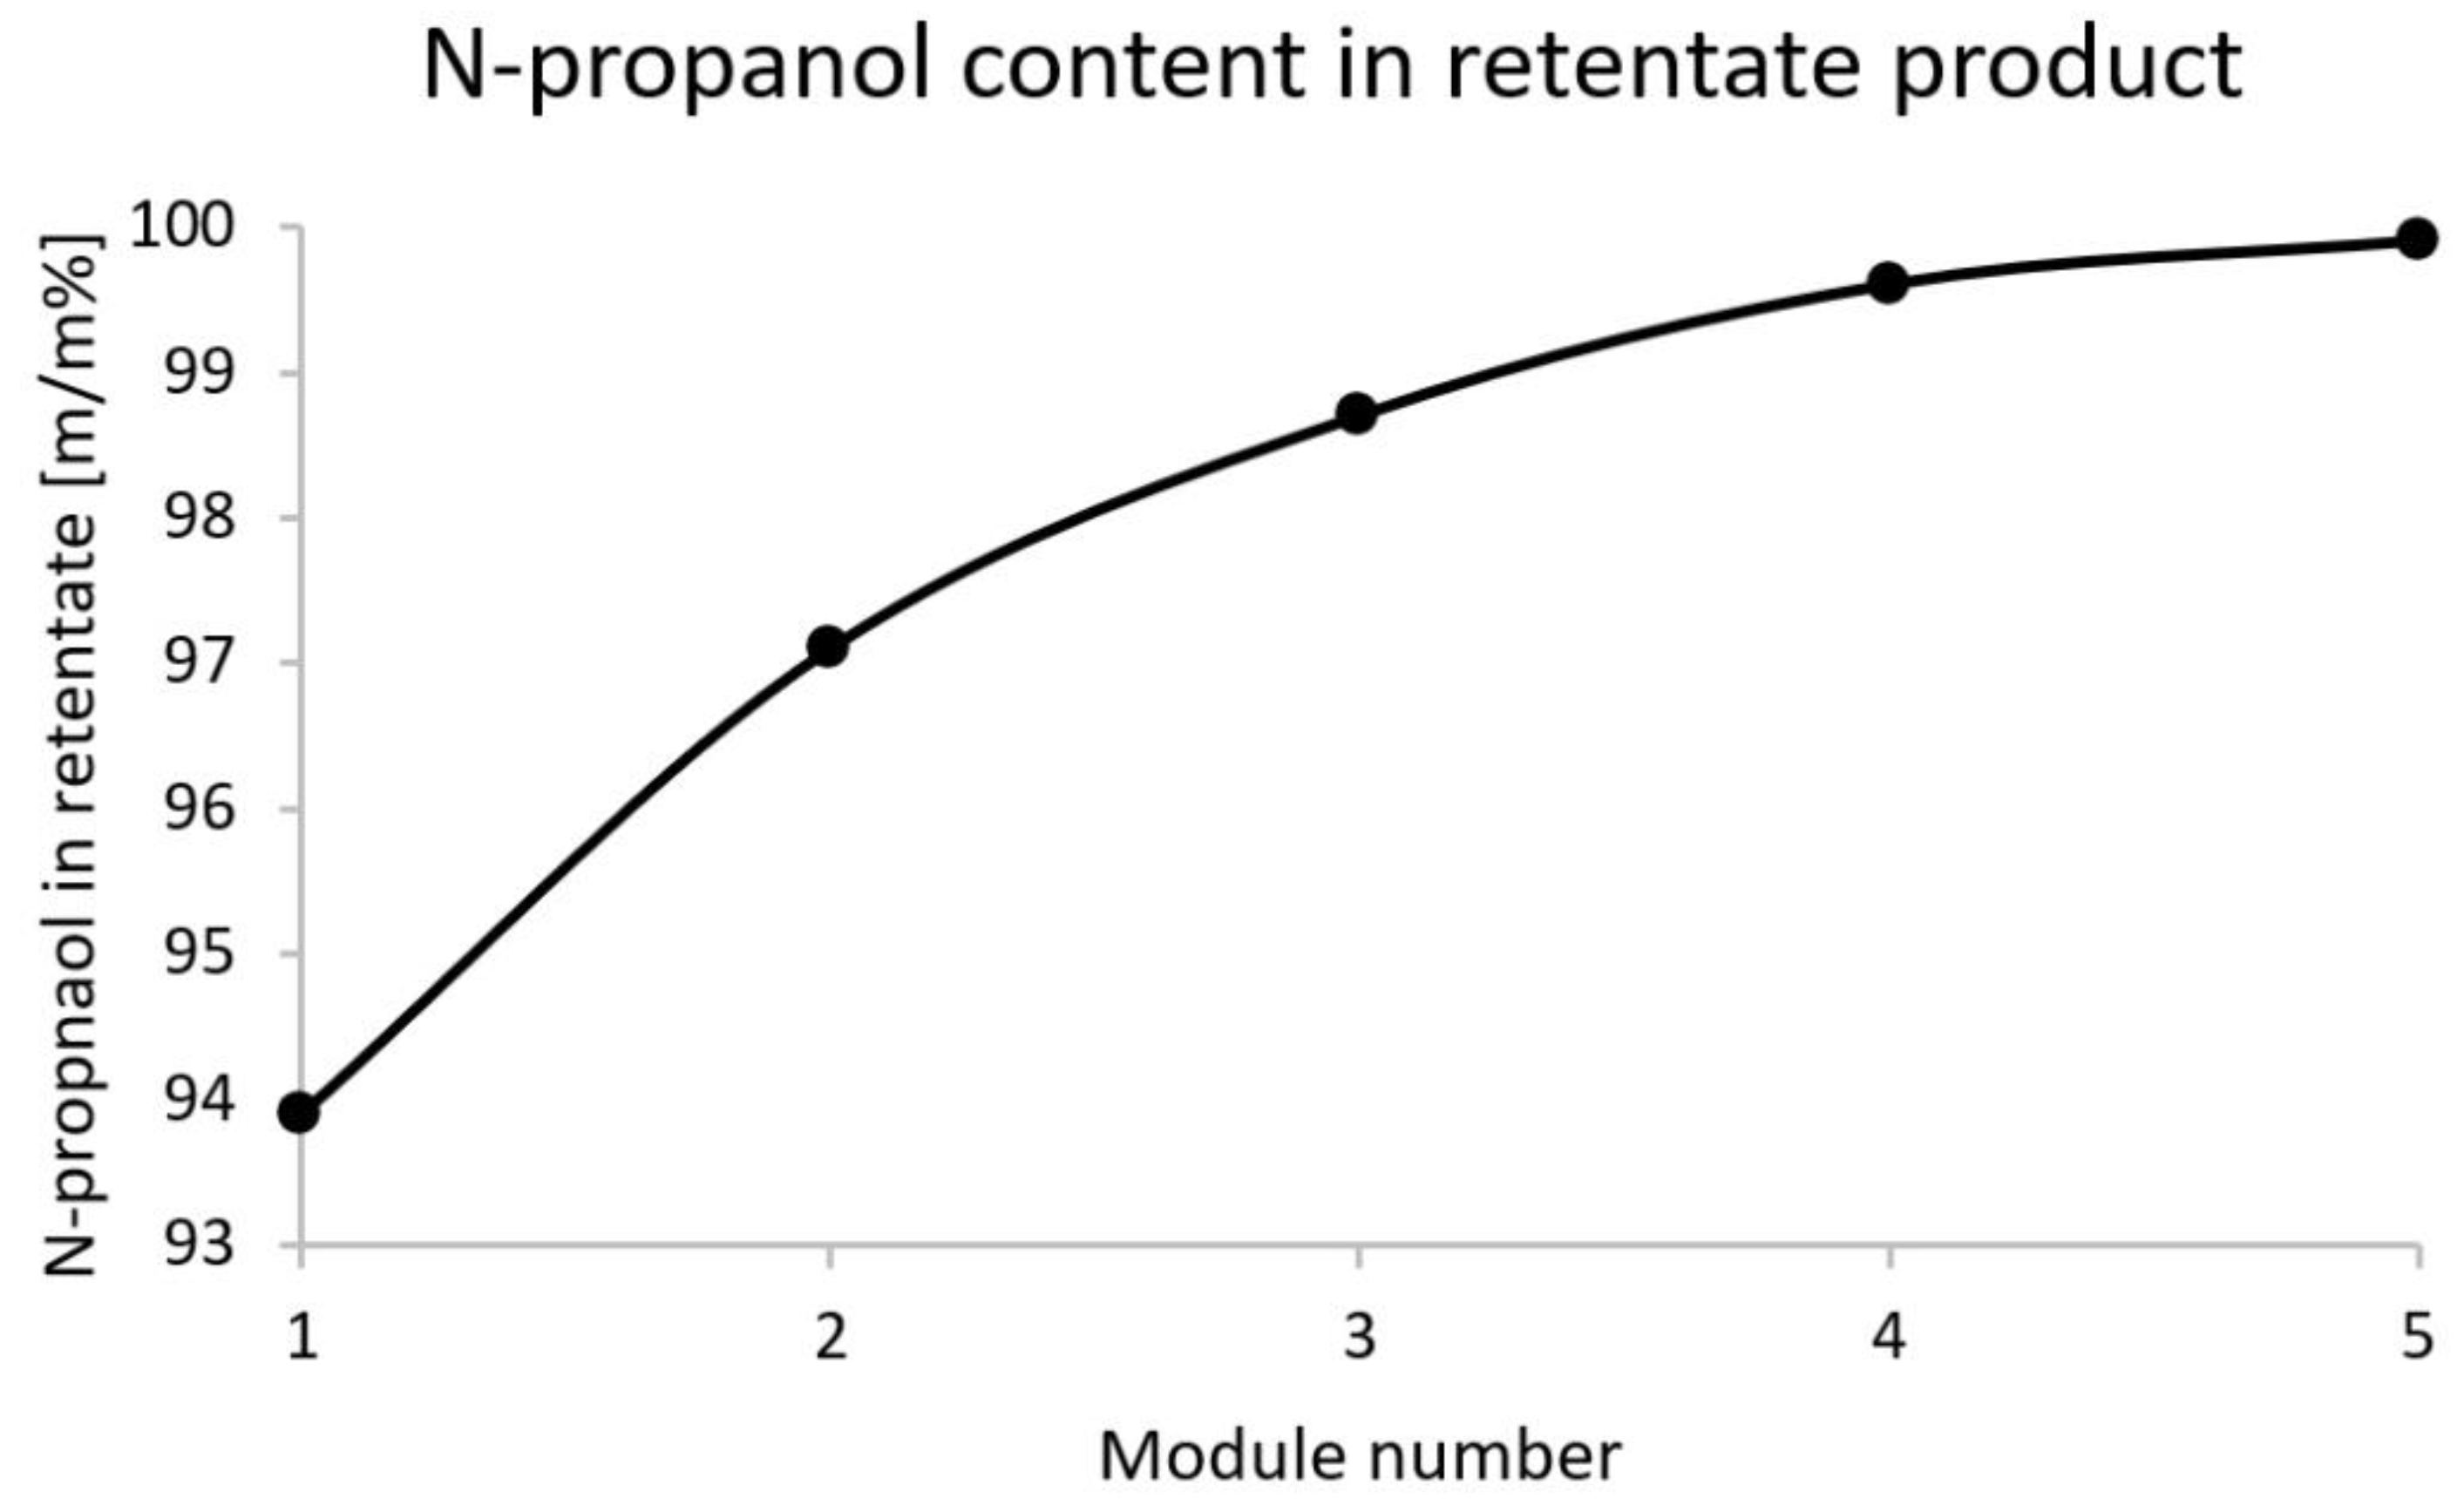
| Membrane | Water Product (Bottom Product) | N-Propanol Product (Retentate) | ||
|---|---|---|---|---|
| Area | Water | N-Propanol | Water | N-Propanol |
| [m2] | [m/m%] | [m/m%] | [m/m%] | [m/m%] |
| 60 | 99.68 | 0.32 | 6.1 | 93.9 |
| 120 | 99.85 | 0.15 | 2.9 | 97.1 |
| 180 | 99.93 | 0.07 | 1.3 | 98.7 |
| 240 | 99.98 | 0.02 | 0.4 | 99.6 |
| 300 | 99.99 | 0.01 | 0.1 | 99.9 |
| Calculated Heat Duties | QHeating [MJ/h] | QCooling [MJ/h] | |
|---|---|---|---|
| Distillation | Reboiler | 501 | |
| Condenser | −166 | ||
| Post cooler | −317 | ||
| Pervaporation | Feed preheating | 1 | |
| Retentate heating | 44 | ||
| Permeate cooler | −53 | ||
| Post cooler | . | −9 | |
Publisher’s Note: MDPI stays neutral with regard to jurisdictional claims in published maps and institutional affiliations. |
© 2022 by the author. Licensee MDPI, Basel, Switzerland. This article is an open access article distributed under the terms and conditions of the Creative Commons Attribution (CC BY) license (https://creativecommons.org/licenses/by/4.0/).
Share and Cite
Toth, A.J. N-Propanol Dehydration with Distillation and Pervaporation: Experiments and Modelling. Membranes 2022, 12, 750. https://doi.org/10.3390/membranes12080750
Toth AJ. N-Propanol Dehydration with Distillation and Pervaporation: Experiments and Modelling. Membranes. 2022; 12(8):750. https://doi.org/10.3390/membranes12080750
Chicago/Turabian StyleToth, Andras Jozsef. 2022. "N-Propanol Dehydration with Distillation and Pervaporation: Experiments and Modelling" Membranes 12, no. 8: 750. https://doi.org/10.3390/membranes12080750
APA StyleToth, A. J. (2022). N-Propanol Dehydration with Distillation and Pervaporation: Experiments and Modelling. Membranes, 12(8), 750. https://doi.org/10.3390/membranes12080750