
Cost Profile of Membranes That Use Polymers of Intrinsic Microporosity (PIMs)

 ,
,  ,
,  ,
,  and
and 
Abstract
:
1. Introduction
2. Materials and Methods
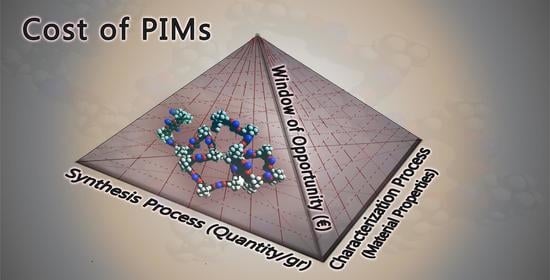
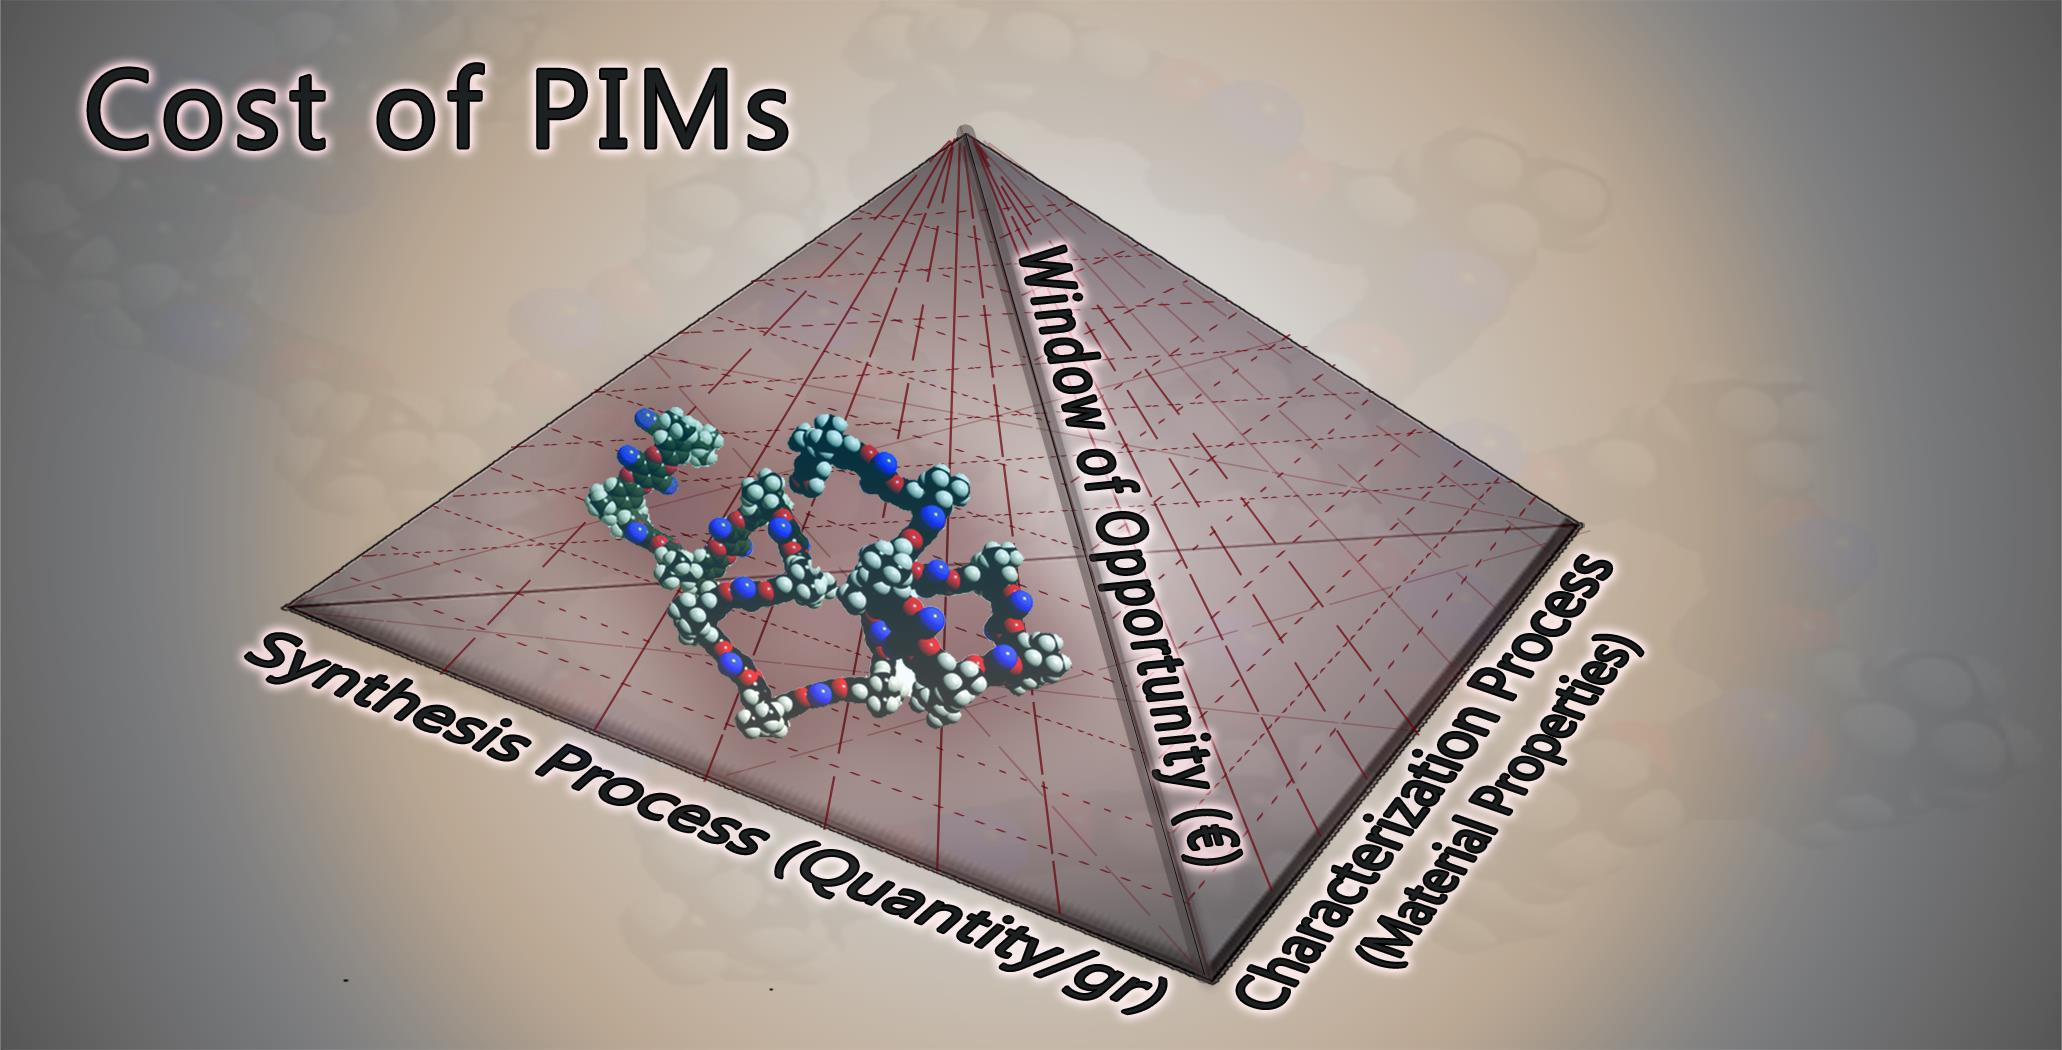
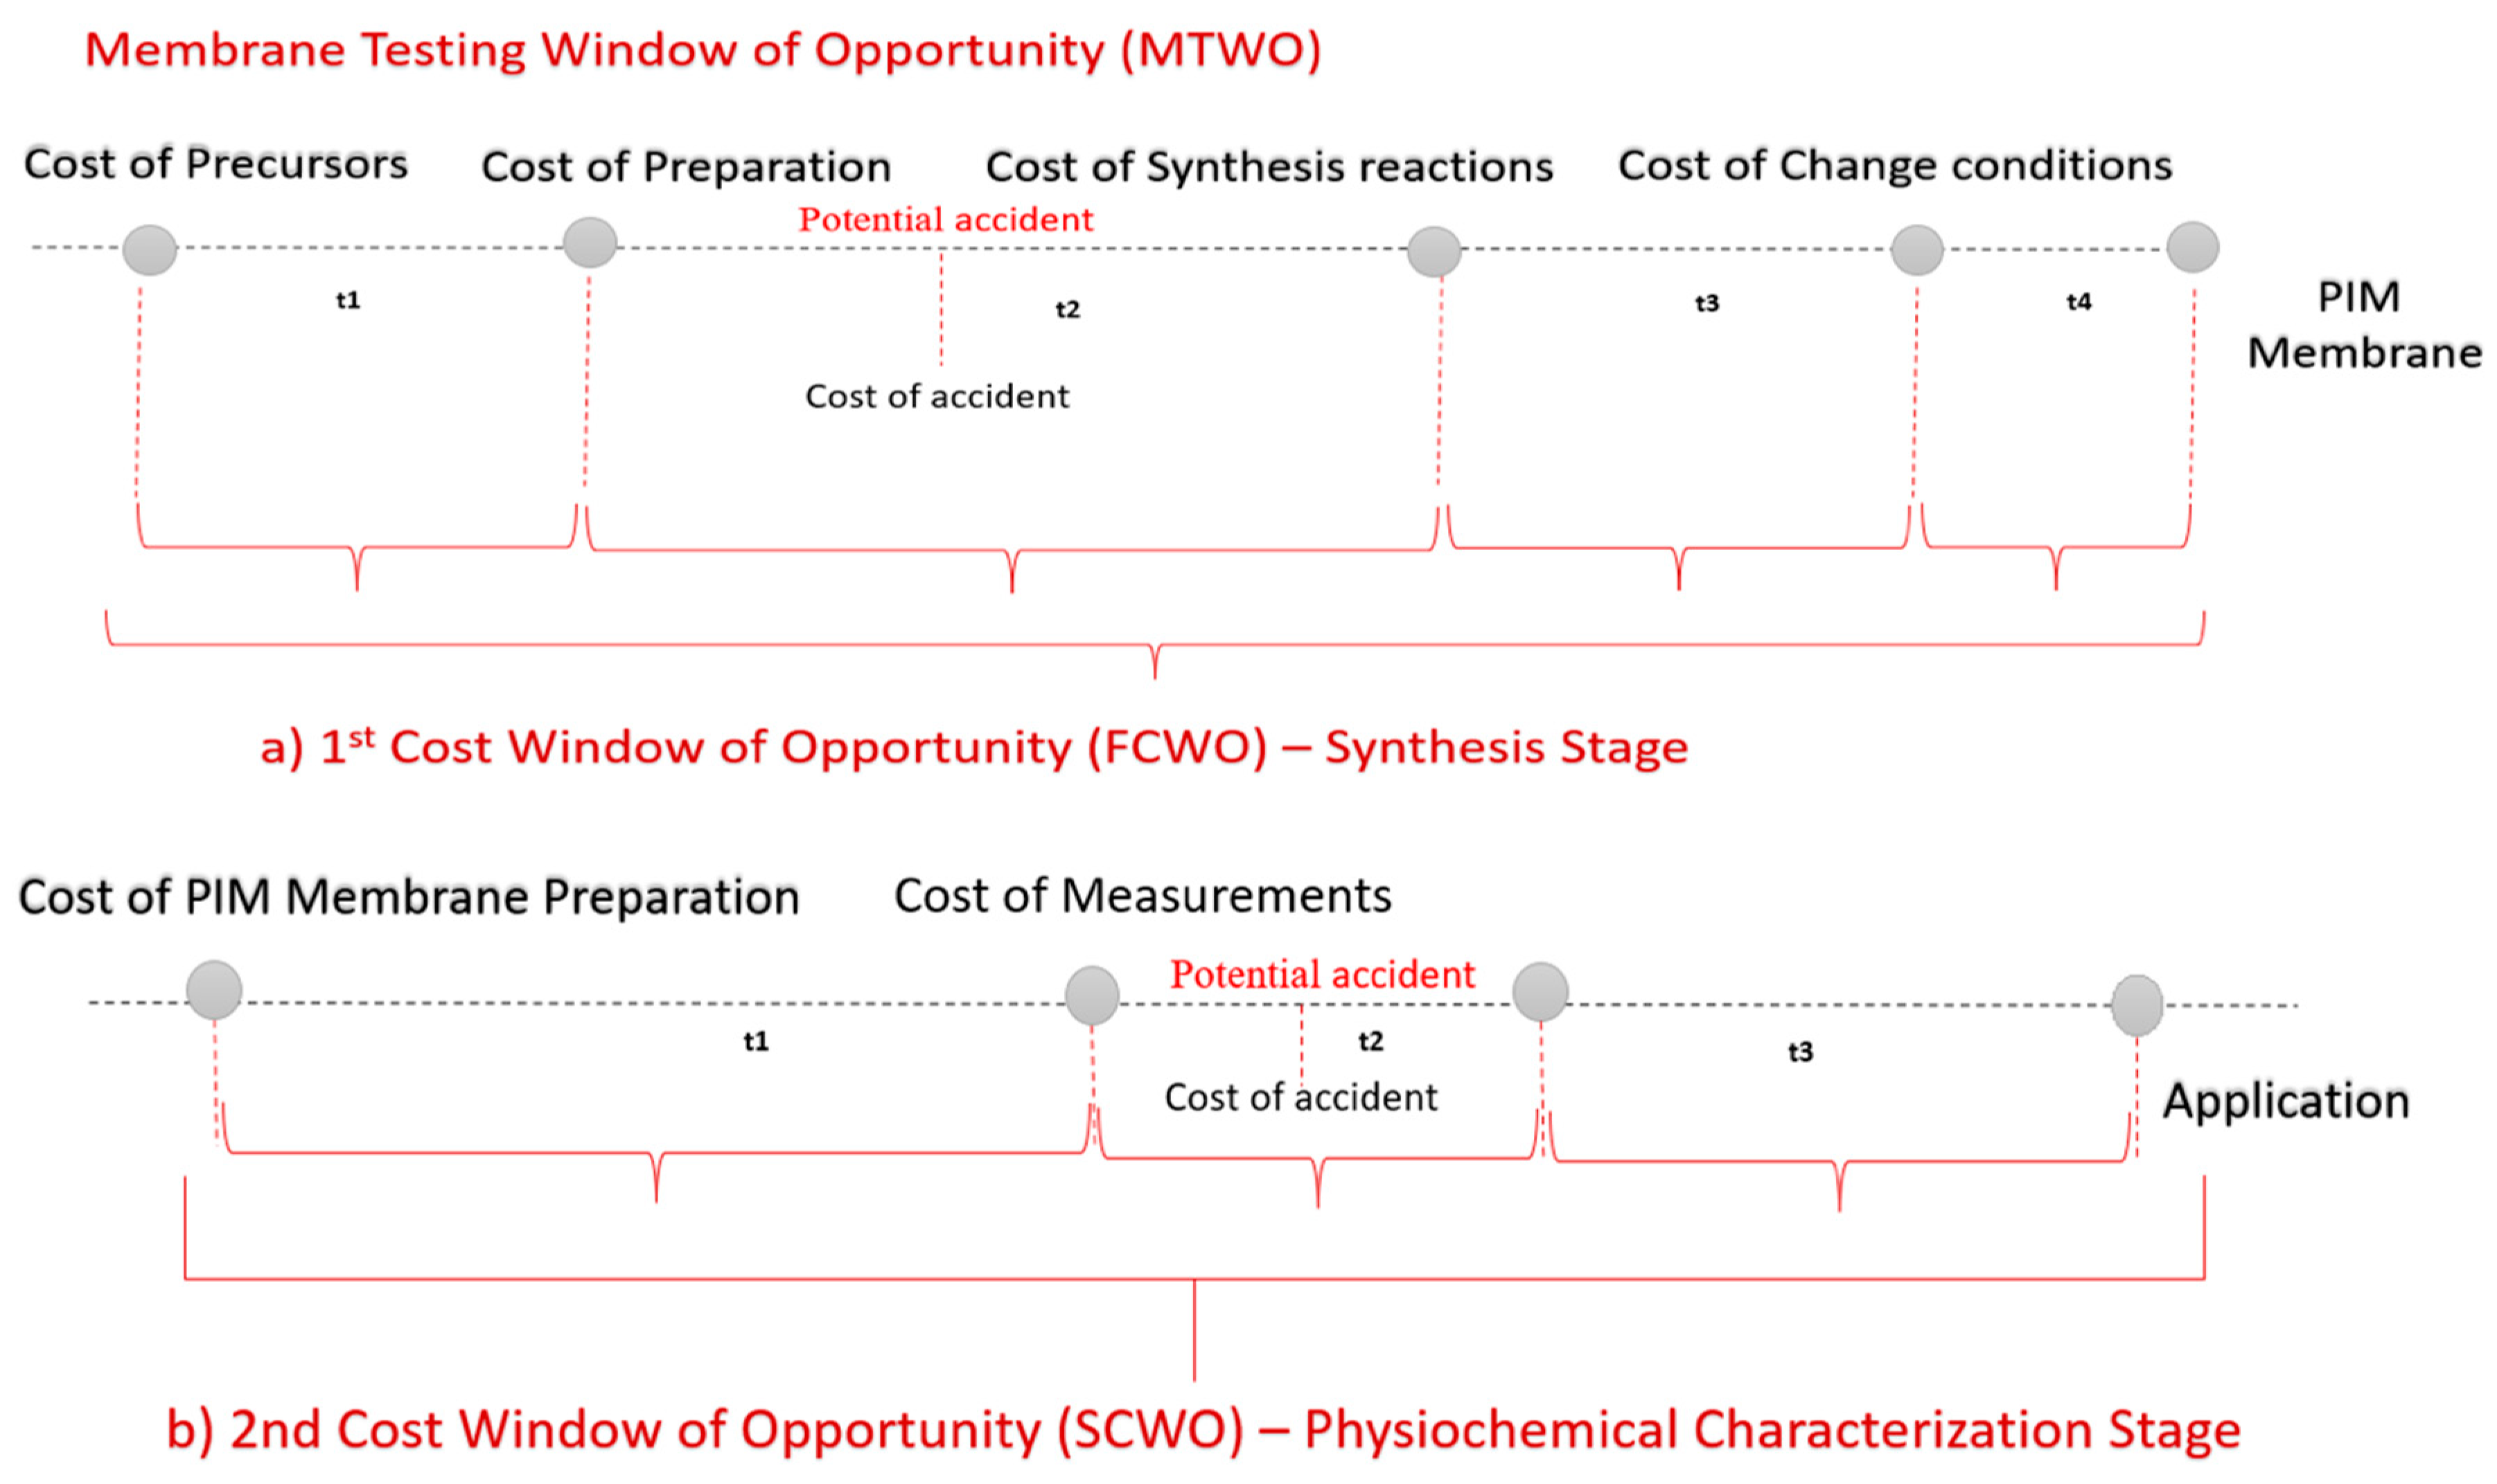
2.1. Window of Opportunity
2.2. The Impact on Synthesis and Characterization
2.3. Experimental Section
- (a)
- Synthesis process of PIMs
- (b)
- Characterization process
2.4. Qualitative Data
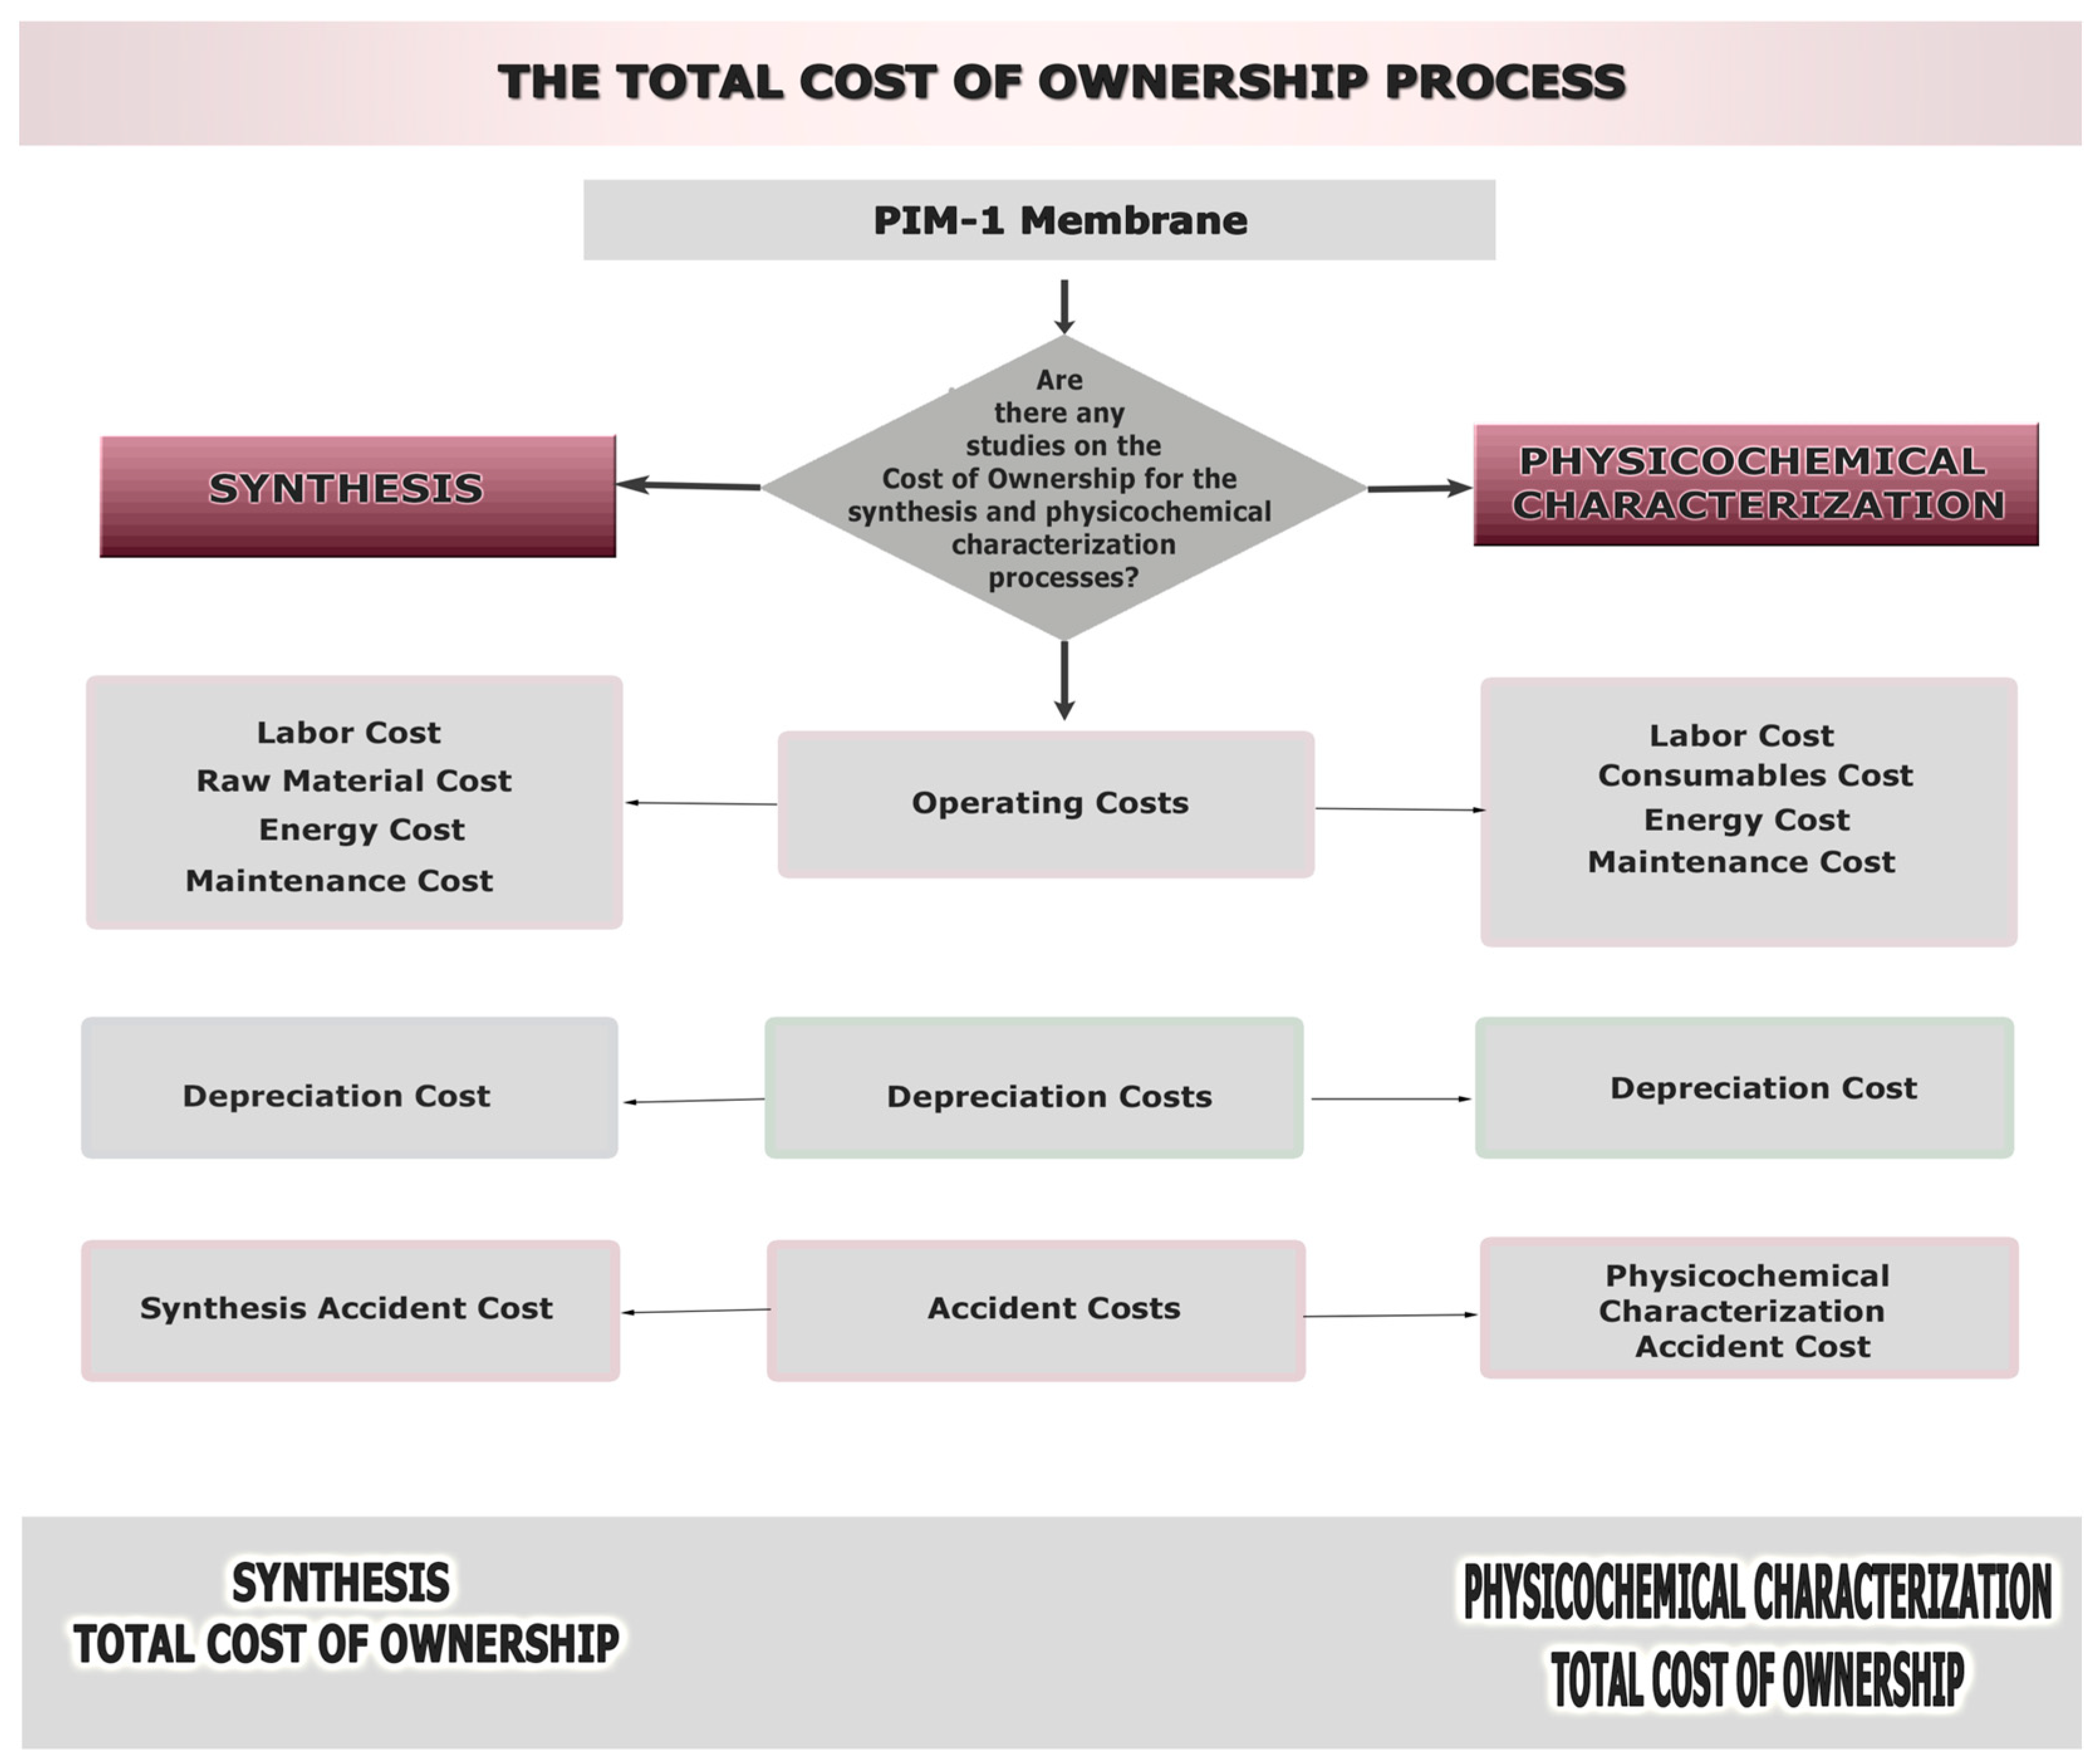
2.5. Costing Method
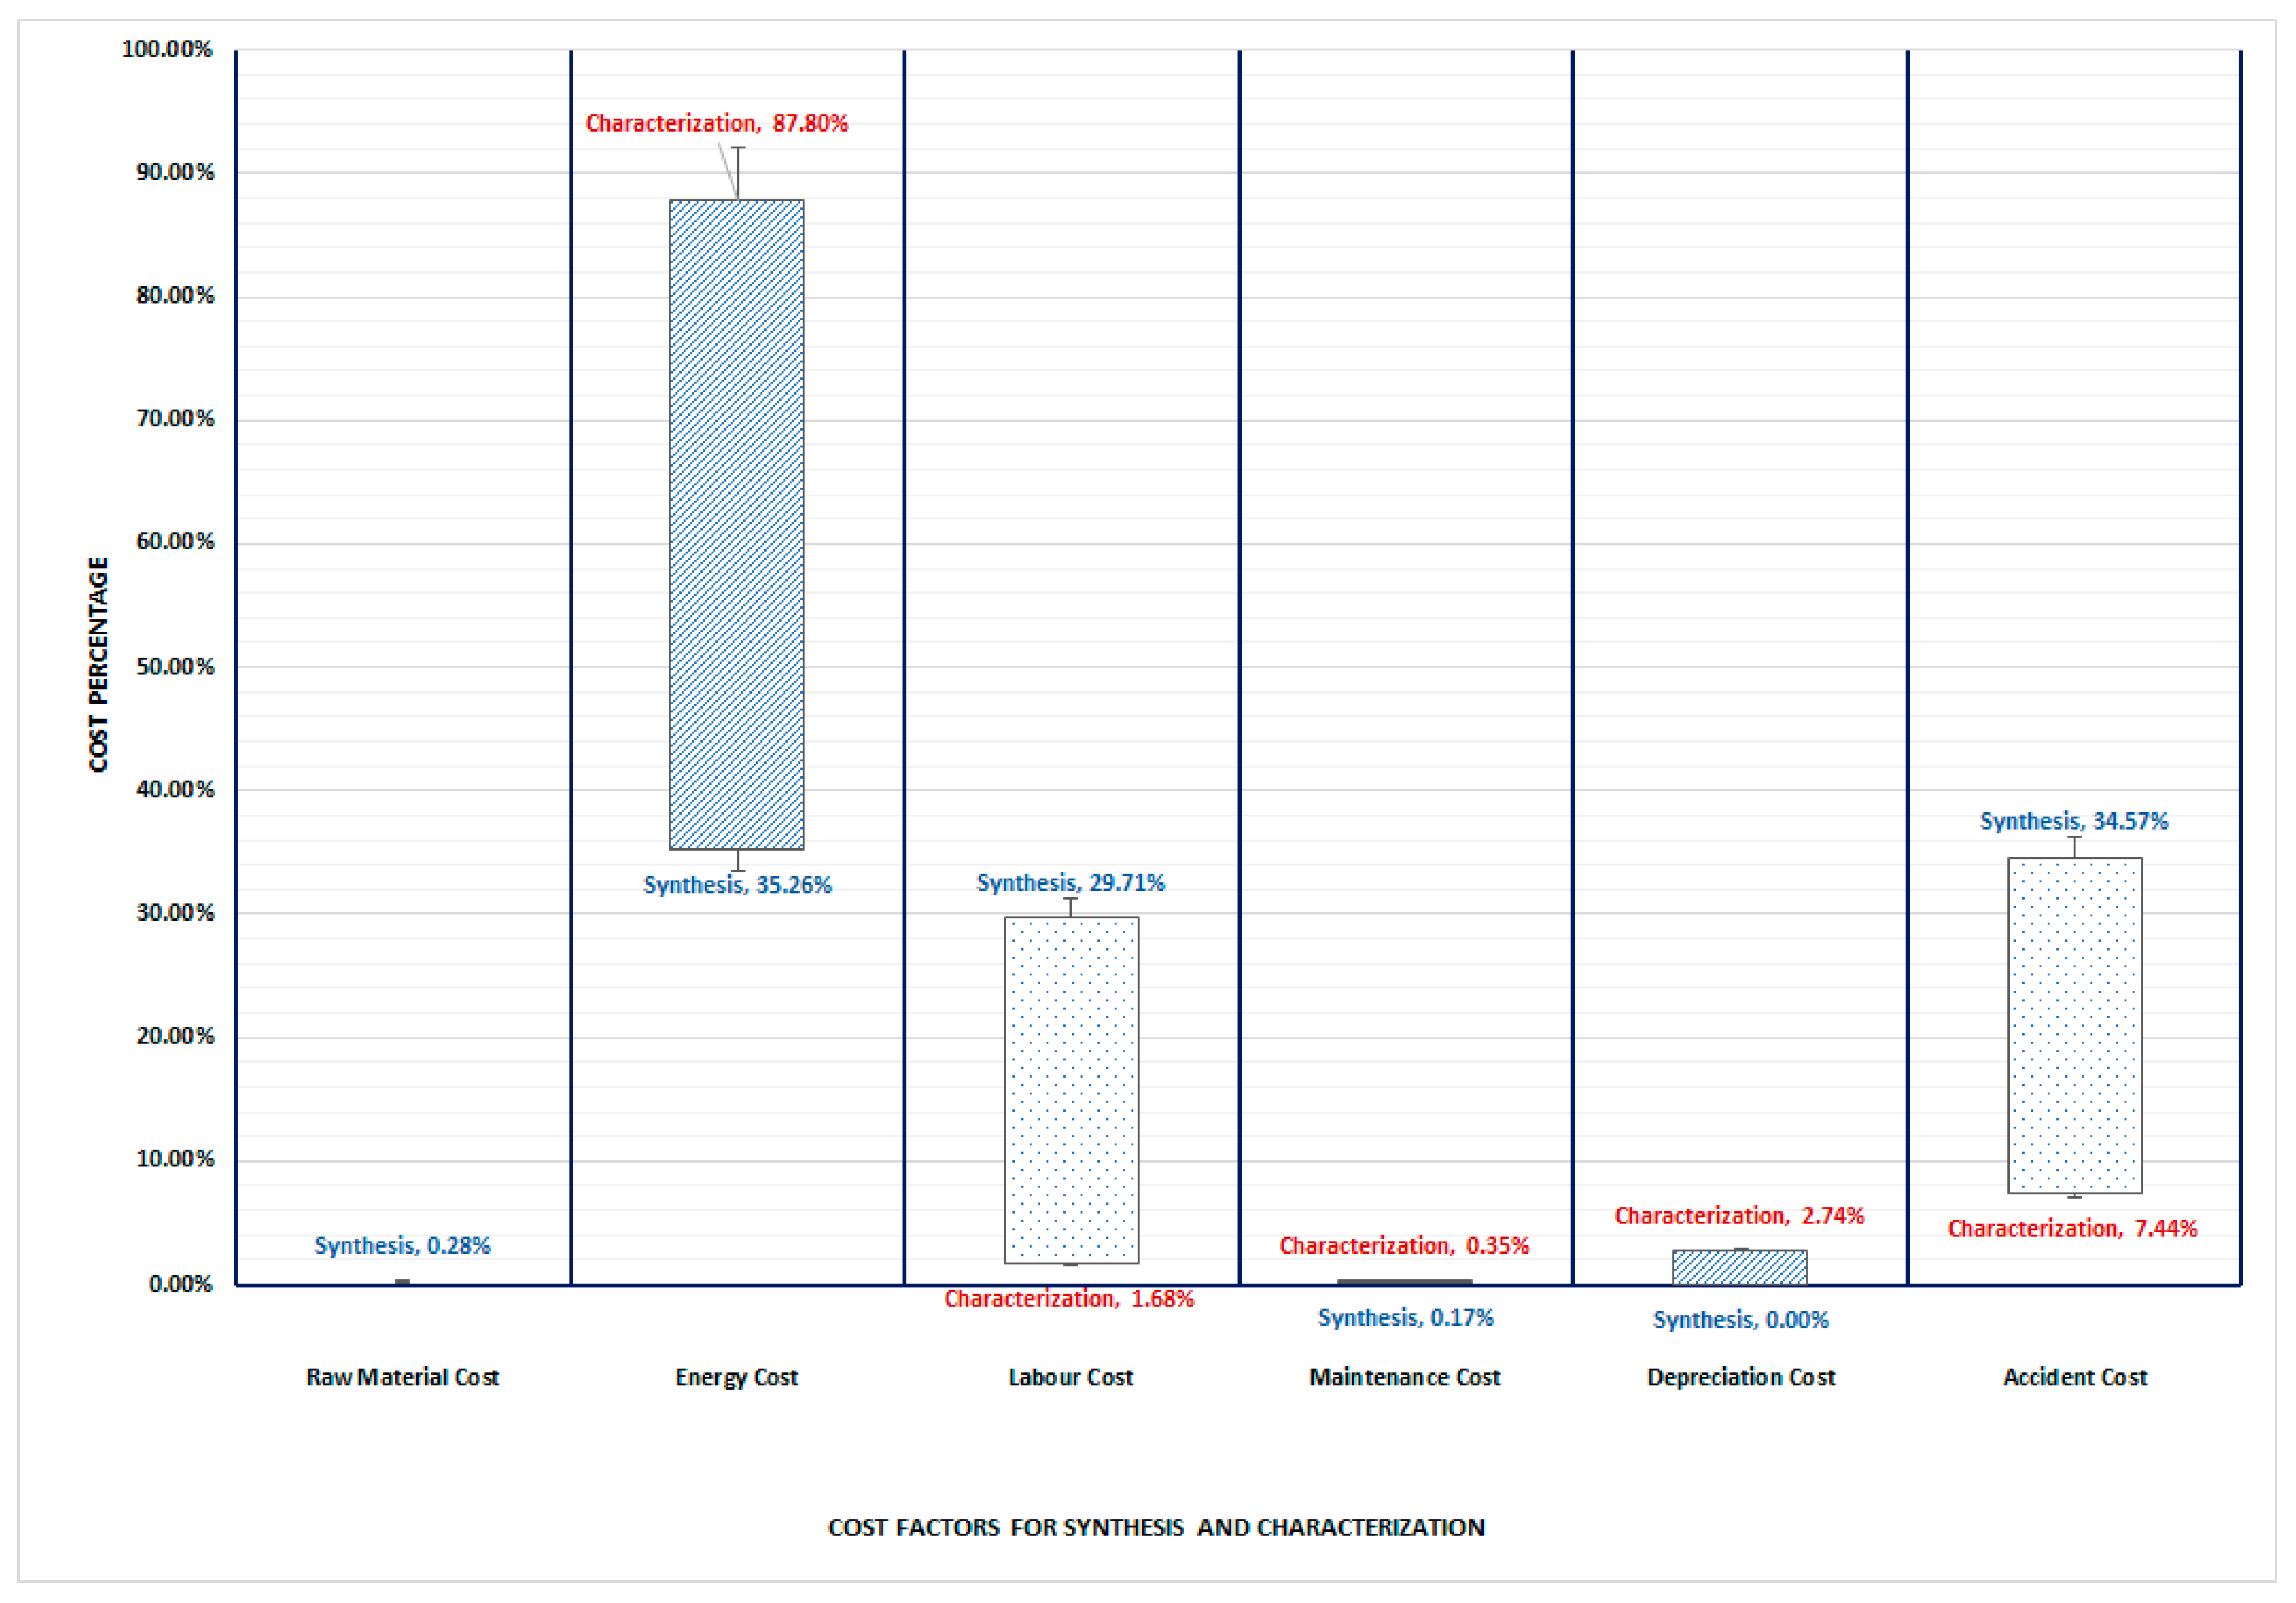
2.6. Cost Profile
3. Results
4. Discussion
4.1. Main Findings
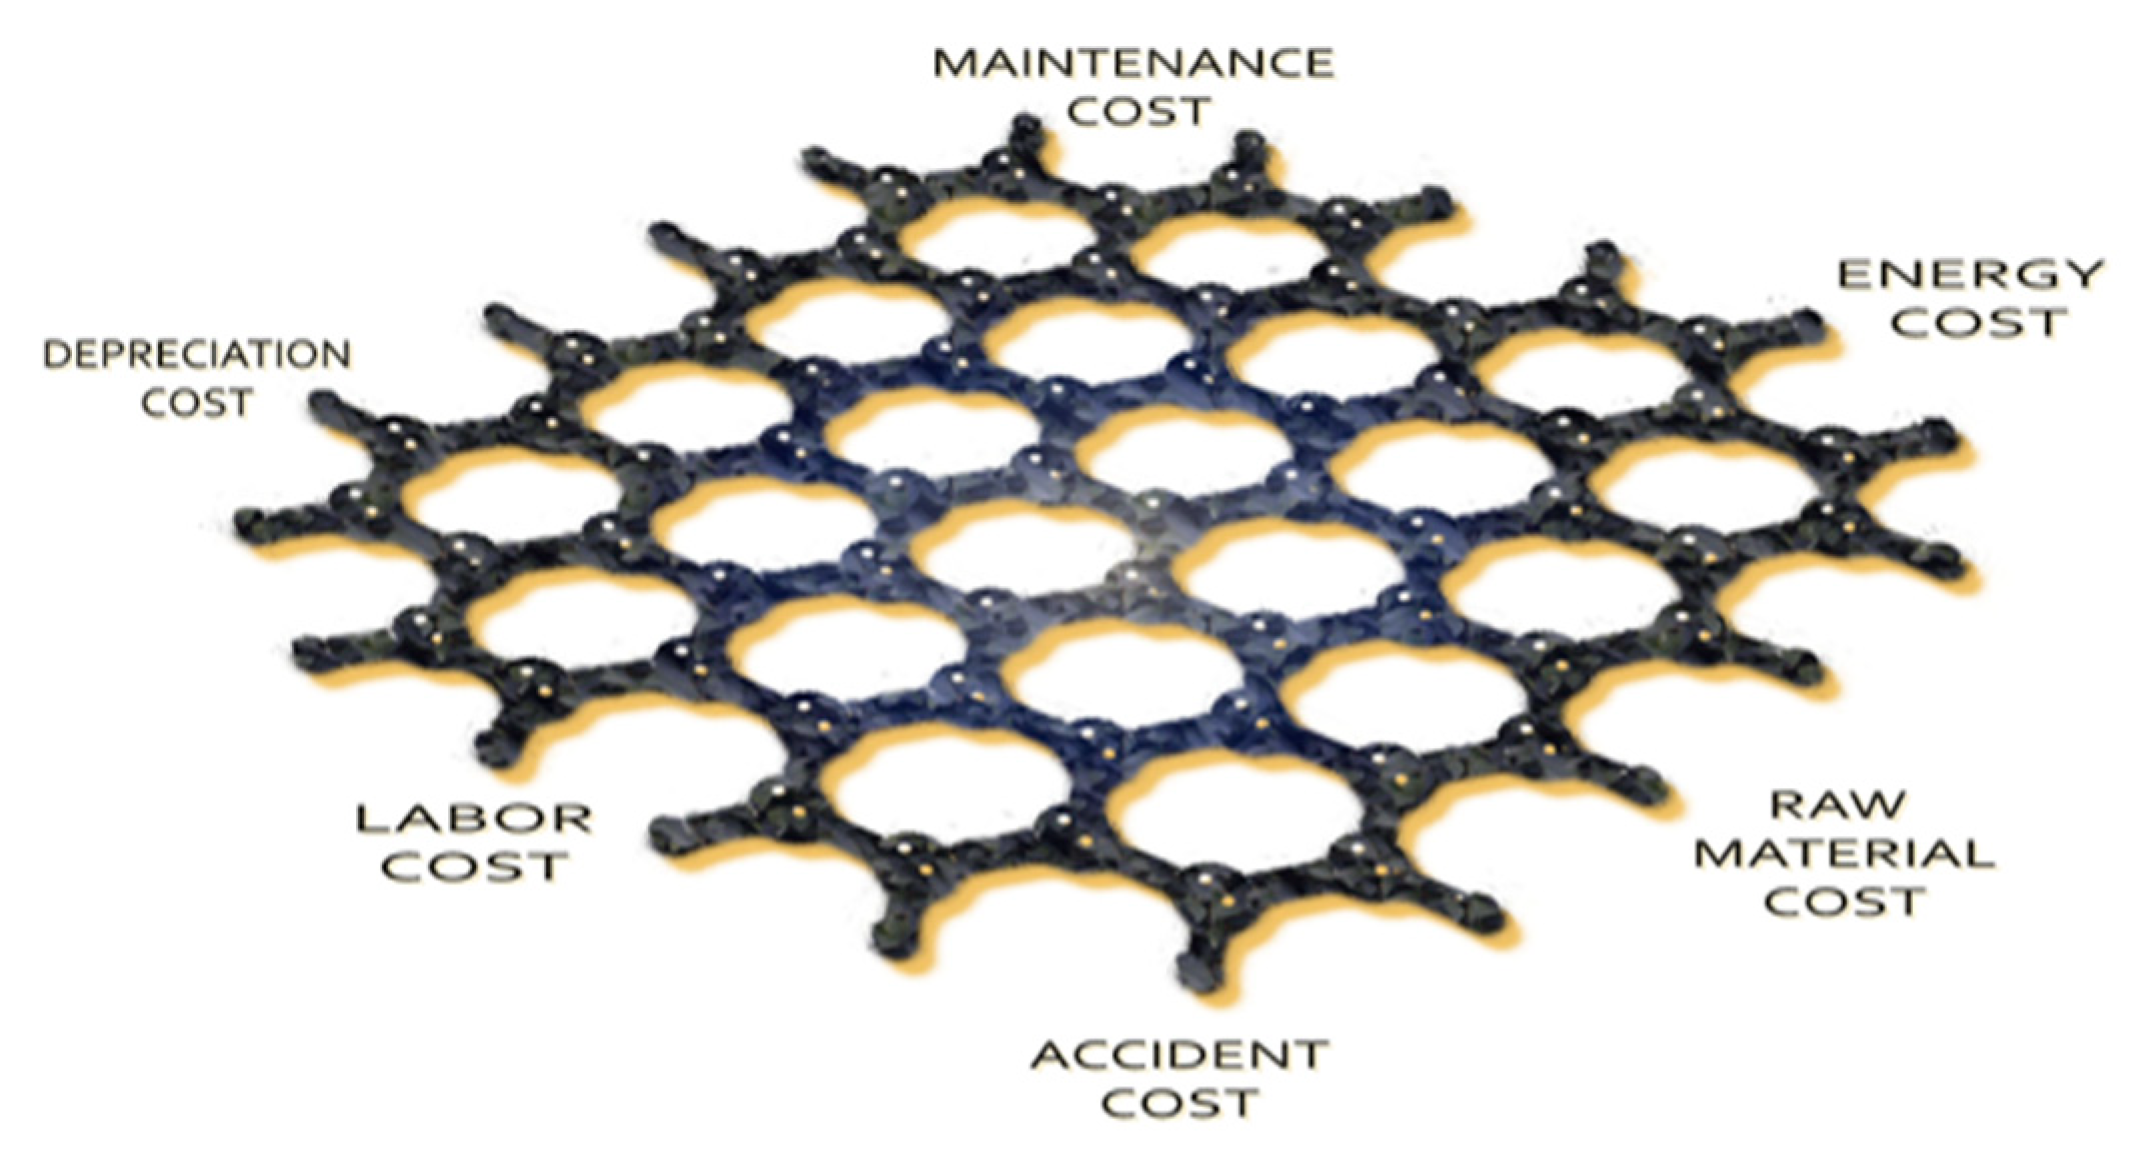
- A new model that demonstrates how to assess the TCO for PIMs, resulting in the identification of the operating, depreciation and accident cost parameters that comprise the TCO.
- A thorough literature research and detailed expert interviews, for the identification and verification of mainly the same qualitative and quantitative factors.
- None of the identified cost factors are specific to PIMs, thus the developed model is re-usable for other types of membranes.
- It is the first time that the accident factor has been incorporated in the evaluation of a membrane’s TCO.
4.2. Critical Assessment
5. Conclusions
Author Contributions
Funding
Acknowledgments
Conflicts of Interest
References
- McKeown, N.B. Polymers of Intrinsic Microporosity. ISRN Mater. Sci. 2012, 2012, 1–16. [Google Scholar] [CrossRef] [Green Version]
- McKeown, N.B.; Budd, P.M. Exploitation of Intrinsic Microporosity in Polymer-Based Materials. Macromolecules 2010, 43, 5163–5176. [Google Scholar] [CrossRef]
- Elsaidi, S.K.; Venna, S.; Sekizkardes, A.K.; Steckel, J.A.; Mohamed, M.H.; Baker, J.; Baltrus, J.; Hopkinson, D. Custom Formulation of Multicomponent Mixed-Matrix Membranes for Efficient Post-Combustion Carbon Capture. Cell Rep. Phys. Sci. 2020, 1, 100113. [Google Scholar] [CrossRef]
- Gemeda, A.E.; De Angelis, M.G.; Du, N.; Li, N.; Guiver, M.D.; Sarti, G.C. Mixed Gas Sorption in Glassy Polymeric Membranes. III. CO2/CH4 Mixtures in a Polymer of Intrinsic Microporosity (PIM-1): Effect of Temperature. J. Membr. Sci. 2017, 524, 746–757. [Google Scholar] [CrossRef]
- Guiver, M.D.; Yahia, M.; Dal-Cin, M.M.; Robertson, G.P.; Saeedi Garakani, S.; Du, N.; Tavajohi, N. Gas Transport in a Polymer of Intrinsic Microporosity (PIM-1) Substituted with Pseudo-Ionic Liquid Tetrazole-Type Structures. Macromolecules 2020, 53, 8951–8959. [Google Scholar] [CrossRef]
- Caliskan, E.; Shishatskiy, S.; Neumann, S.; Abetz, V.; Filiz, V. Investigation of the Side Chain Effect on Gas and Water Vapor Transport Properties of Anthracene-Maleimide Based Polymers of Intrinsic Microporosity. Polymers 2021, 14, 119. [Google Scholar] [CrossRef]
- Del Regno, A.; Gonciaruk, A.; Leay, L.; Carta, M.; Croad, M.; Malpass-Evans, R.; McKeown, N.B.; Siperstein, F.R. Polymers of Intrinsic Microporosity Containing Tröger Base for CO2 Capture. Ind. Eng. Chem. Res. 2013, 52, 16939–16950. [Google Scholar] [CrossRef]
- Wang, Y.; Ghanem, B.S.; Ali, Z.; Hazazi, K.; Han, Y.; Pinnau, I. Recent Progress on Polymers of Intrinsic Microporosity and Thermally Modified Analogue Materials for Membrane-Based Fluid Separations. Small Struct. 2021, 2, 2100049. [Google Scholar] [CrossRef]
- Valle, M.; Martín, L.; Maestro, A.; Andrés, J.M.; Pedrosa, R. Chiral Bifunctional Thioureas and Squaramides Grafted into Old Polymers of Intrinsic Microporosity for Novel Applications. Polymers 2018, 11, 13. [Google Scholar] [CrossRef] [Green Version]
- Low, Z.-X.; Budd, P.M.; McKeown, N.B.; Patterson, D.A. Gas Permeation Properties, Physical Aging, and Its Mitigation in High Free Volume Glassy Polymers. Chem. Rev. 2018, 118, 5871–5911. [Google Scholar] [CrossRef]
- Marchetti, P.; Jimenez Solomon, M.F.; Szekely, G.; Livingston, A.G. Molecular Separation with Organic Solvent Nanofiltration: A Critical Review. Chem. Rev. 2014, 114, 10735–10806. [Google Scholar] [CrossRef] [PubMed]
- Hofs, B.; Ogier, J.; Vries, D.; Beerendonk, E.F.; Cornelissen, E.R. Comparison of Ceramic and Polymeric Membrane Permeability and Fouling Using Surface Water. Sep. Purif. Technol. 2011, 79, 365–374. [Google Scholar] [CrossRef]
- Li, W.; Dong, H.; Yu, H.; Wang, D.; Yu, H. Global Characteristics and Trends of Research on Ceramic Membranes from 1998 to 2016: Based on Bibliometric Analysis Combined with Information Visualization Analysis. Ceram. Int. 2018, 44, 6926–6934. [Google Scholar] [CrossRef]
- El-Dessouky, H.T.; Ettouney, H.M. Economic Analysis of Desalination Processes. In Fundamentals of Salt Water Desalination; Elsevier: Amsterdam, The Netherlands, 2002; pp. 503–524. ISBN 978-0-444-50810-2. [Google Scholar]
- Liang, Y.Y.; Toh, K.Y.; Weihs, G.F. 3D CFD Study of the Effect of Multi-Layer Spacers on Membrane Performance under Steady Flow. J. Membr. Sci. 2019, 580, 256–267. [Google Scholar] [CrossRef]
- Ghaffour, N.; Missimer, T.M.; Amy, G.L. Technical Review and Evaluation of the Economics of Water Desalination: Current and Future Challenges for Better Water Supply Sustainability. Desalination 2013, 309, 197–207. [Google Scholar] [CrossRef] [Green Version]
- Jiang, A.; Wang, H.; Lin, Y.; Cheng, W.; Wang, J. A Study on Optimal Schedule of Membrane Cleaning and Replacement for Spiral-Wound SWRO System. Desalination 2017, 404, 259–269. [Google Scholar] [CrossRef]
- Avlonitis, S.A.; Kouroumbas, K.; Vlachakis, N. Energy Consumption and Membrane Replacement Cost for Seawater RO Desalination Plants. Desalination 2003, 157, 151–158. [Google Scholar] [CrossRef]
- Daniilidis, A.; Herber, R.; Vermaas, D.A. Upscale Potential and Financial Feasibility of a Reverse Electrodialysis Power Plant. Appl. Energy 2014, 119, 257–265. [Google Scholar] [CrossRef]
- Loeb, S. Large-Scale Power Production by Pressure-Retarded Osmosis, Using River Water and Sea Water Passing through Spiral Modules. Desalination 2002, 143, 115–122. [Google Scholar] [CrossRef]
- Sarai Atab, M.; Smallbone, A.J.; Roskilly, A.P. An Operational and Economic Study of a Reverse Osmosis Desalination System for Potable Water and Land Irrigation. Desalination 2016, 397, 174–184. [Google Scholar] [CrossRef] [Green Version]
- Kim, J.E.; Phuntsho, S.; Chekli, L.; Choi, J.Y.; Shon, H.K. Environmental and Economic Assessment of Hybrid FO-RO/NF System with Selected Inorganic Draw Solutes for the Treatment of Mine Impaired Water. Desalination 2018, 429, 96–104. [Google Scholar] [CrossRef] [Green Version]
- Kook, S.; Lee, C.; Nguyen, T.T.; Lee, J.; Shon, H.K.; Kim, I.S. Serially Connected Forward Osmosis Membrane Elements of Pressure-Assisted Forward Osmosis-Reverse Osmosis Hybrid System: Process Performance and Economic Analysis. Desalination 2018, 448, 1–12. [Google Scholar] [CrossRef]
- Im, S.J.; Jeong, S.; Jeong, S.; Jang, A. Techno-Economic Evaluation of an Element-Scale Forward Osmosis-Reverse Osmosis Hybrid Process for Seawater Desalination. Desalination 2020, 476, 114240. [Google Scholar] [CrossRef]
- Kim, E.; Huang, K.; Kononova, O.; Ceder, G.; Olivetti, E. Distilling a Materials Synthesis Ontology. Matter 2019, 1, 8–12. [Google Scholar] [CrossRef] [Green Version]
- Kononova, O.; Huo, H.; He, T.; Rong, Z.; Botari, T.; Sun, W.; Tshitoyan, V.; Ceder, G. Metadata Record for: Text-Mined Dataset of Inorganic Materials Synthesis Recipes. Sci. Data 2019, 6, 1–11. [Google Scholar]
- Junker, M.A.; de Vos, W.M.; Lammertink, R.G.H.; de Grooth, J. Bridging the Gap between Lab-Scale and Commercial Dimensions of Hollow Fiber Nanofiltration Membranes. J. Membr. Sci. 2021, 624, 119100. [Google Scholar] [CrossRef]
- Chen, M.; Wu, Y.; Wang, K.; Guo, H.; Ke, W. An Explosion Accident Analysis of the Laboratory in University. Process Saf. Prog. 2020, 39, e12150. [Google Scholar] [CrossRef]
- Ménard, A.D.; Trant, J.F. A Review and Critique of Academic Lab Safety Research. Nat. Chem. 2020, 12, 17–25. [Google Scholar] [CrossRef]
- Atzeni, E.; Iuliano, L.; Marchiandi, G.; Minetola, P.; Salmi, A.; Bassoli, E.; Denti, L.; Gatto, A. Additive Manufacturing as a Cost-Effective Way to Produce Metal Parts. In High Value Manufacturing: Advanced Research in Virtual and Rapid Prototyping; da Silva Bártolo, P., de Lemos, A., Pereira, A., Mateus, A., Ramos, C., Santos, C., Oliveira, D., Pinto, E., Craveiro, F., da Rocha Terreiro Galha Bártolo, H., et al., Eds.; CRC Press: Boca Raton, FL, USA, 2013; pp. 3–8. ISBN 978-1-138-00137-4. [Google Scholar]
- Schröder, M.; Falk, B.; Schmitt, R. Evaluation of Cost Structures of Additive Manufacturing Processes Using a New Business Model. Procedia CIRP 2015, 30, 311–316. [Google Scholar] [CrossRef] [Green Version]
- Baumers, M.; Tuck, C.; Wildman, R.; Ashcroft, I.; Rosamond, E.; Hague, R. Transparency Built-in: Energy Consumption and Cost Estimation for Additive Manufacturing. J. Ind. Ecol. 2013, 17, 418–431. [Google Scholar] [CrossRef]
- Ellram, L. Total Cost of Ownership: Elements and Implementation. Int. J. Purch. Mater. Manag. 1993, 29, 2–11. [Google Scholar] [CrossRef]
- Leigh, J.P. Economic Burden of Occupational Injury and Illness in the United States: U.S. Economic Burden of Occupational Injury and Illness. Milbank Q. 2011, 89, 728–772. [Google Scholar] [CrossRef] [PubMed] [Green Version]
- Bosetti, R.; Jones, S.L. Cost–Effectiveness of Nanomedicine: Estimating the Real Size of Nano-Costs. Nanomedicine 2019, 14, 1367–1370. [Google Scholar] [CrossRef] [PubMed] [Green Version]
- Andersen, S.L. Trajectories of Brain Development: Point of Vulnerability or Window of Opportunity? Neurosci. Biobehav. Rev. 2003, 27, 3–18. [Google Scholar] [CrossRef] [Green Version]
- Ismail, F.Y.; Fatemi, A.; Johnston, M.V. Cerebral Plasticity: Windows of Opportunity in the Developing Brain. Eur. J. Paediatr. Neurol. 2017, 21, 23–48. [Google Scholar] [CrossRef] [PubMed]
- Yap, X.-S.; Truffer, B. Shaping Selection Environments for Industrial Catch-up and Sustainability Transitions: A Systemic Perspective on Endogenizing Windows of Opportunity. Res. Policy 2019, 48, 1030–1047. [Google Scholar] [CrossRef]
- Kwak, K.; Yoon, H.D. Unpacking Transnational Industry Legitimacy Dynamics, Windows of Opportunity, and Latecomers’ Catch-up in Complex Product Systems. Res. Policy 2020, 49, 103954. [Google Scholar] [CrossRef]
- Gonzalez-Perez, A.; Persson, K.; Lipnizki, F. Functional Channel Membranes for Drinking Water Production. Water 2018, 10, 859. [Google Scholar] [CrossRef] [Green Version]
- Smith, J. An Alternative to Technology Readiness Levels for Non-Developmental Item (NDI) Software. In Proceedings of the 38th Annual Hawaii International Conference on System Sciences, Big Island, HI, USA, 6 January 2005. [Google Scholar] [CrossRef]
- Khan, W.S.; Asmatulu, R. Fundamentals of Safety. In Nanotechnology Safety; Elsevier: Amsterdam, The Netherlands, 2013; pp. 17–30. ISBN 978-0-444-59438-9. [Google Scholar]
- Egle, L.; Rechberger, H.; Krampe, J.; Zessner, M. Phosphorus Recovery from Municipal Wastewater: An Integrated Comparative Technological, Environmental and Economic Assessment of P Recovery Technologies. Sci. Total Environ. 2016, 571, 522–542. [Google Scholar] [CrossRef] [Green Version]
- Yin, R.K. Case Study Research: Design and Methods, 4th ed.; Applied social research methods; Sage Publications: Los Angeles, CA, USA, 2009; ISBN 978-1-4129-6099-1. [Google Scholar]
- Schwarz-Plaschg, C.; Kallhoff, A.; Eisenberger, I. Making Nanomaterials Safer by Design? NanoEthics 2017, 11, 277–281. [Google Scholar] [CrossRef] [Green Version]
- Fritsch, D.; Bengtson, G.; Carta, M.; McKeown, N.B. Synthesis and Gas Permeation Properties of Spirobischromane-Based Polymers of Intrinsic Microporosity. Macromol. Chem. Phys. 2011, 212, 1137–1146. [Google Scholar] [CrossRef]
- Budd, P.M.; Elabas, E.S.; Ghanem, B.S.; Makhseed, S.; McKeown, N.B.; Msayib, K.J.; Tattershall, C.E.; Wang, D. Solution-Processed, Organophilic Membrane Derived from a Polymer of Intrinsic Microporosity. Adv. Mater. 2004, 16, 456–459. [Google Scholar] [CrossRef]
- Yang, Z.; Guo, R.; Malpass-Evans, R.; Carta, M.; McKeown, N.B.; Guiver, M.D.; Wu, L.; Xu, T. Highly Conductive Anion-Exchange Membranes from Microporous Tröger’s Base Polymers. Angew. Chem. 2016, 128, 11671–11674. [Google Scholar] [CrossRef] [Green Version]
- Ghanem, B.S.; McKeown, N.B.; Budd, P.M.; Al-Harbi, N.M.; Fritsch, D.; Heinrich, K.; Starannikova, L.; Tokarev, A.; Yampolskii, Y. Synthesis, Characterization, and Gas Permeation Properties of a Novel Group of Polymers with Intrinsic Microporosity: PIM-Polyimides. Macromolecules 2009, 42, 7881–7888. [Google Scholar] [CrossRef]
- Du, N.; Robertson, G.P.; Pinnau, I.; Thomas, S.; Guiver, M.D. Copolymers of Intrinsic Microporosity Based on 2,2′,3,3′-Tetrahydroxy-1,1′-Dinaphthyl. Macromol. Rapid Commun. 2009, 30, 584–588. [Google Scholar] [CrossRef] [Green Version]
- Ellram, L.M.; Siferd, S.P. Siferd Total Cost of Ownership:A Key Concept in Strategic Cost Management Decisions. J. Bus. Logist. 1998, 19, 55–84. [Google Scholar]
- Špacírová, Z.; Epstein, D.; García-Mochón, L.; Rovira, J.; Olry de Labry Lima, A.; Espín, J. A General Framework for Classifying Costing Methods for Economic Evaluation of Health Care. Eur. J. Health Econ. 2020, 21, 529–542. [Google Scholar] [CrossRef]
- Reniers, G.L.L.; Audenaert, A. Chemical Plant Innovative Safety Investments Decision-Support Methodology. J. Saf. Res. 2009, 40, 411–419. [Google Scholar] [CrossRef]
- Available online: https://www.glassdoor.co.uk/ (accessed on 1 August 2017).
- Thiede, S.; Bogdanski, G.; Herrmann, C. A Systematic Method for Increasing the Energy and Resource Efficiency in Manufacturing Companies. Procedia CIRP 2012, 2, 28–33. [Google Scholar] [CrossRef]
- Dumont, L.B.; Marier, P.; Lehoux, N.; Gosselin, L.; Fortin, H. Integrating Electric Energy Cost in Lumber Production Planning. IFAC-PapersOnLine 2019, 52, 2249–2254. [Google Scholar] [CrossRef]
- European Commission; Directorate-General for Employment, Social Affairs and Inclusion Unit B.3. Socio-Economic Costs of Accidents at Work and Work-Related Ill Health Key Messages and Case Studies; European Commission: Brussels, Belgium, 2011. [Google Scholar]
- Jedliński, M.; Sowa, M. The Impact of Using the Total Cost of Ownership (TCO) Account for a Reusable Wooden Flat Pallet in Its Operational Phase on Respecting the Principles of Sustainable Development. Resources 2021, 10, 116. [Google Scholar] [CrossRef]
- Mengting, Z.; Kurniawan, T.A.; Avtar, R.; Othman, M.H.D.; Ouyang, T.; Yujia, H.; Xueting, Z.; Setiadi, T.; Iswanto, I. Applicability of TiO2(B) Nanosheets@hydrochar Composites for Adsorption of Tetracycline (TC) from Contaminated Water. J. Hazard. Mater. 2021, 405, 123999. [Google Scholar] [CrossRef] [PubMed]
- Galli, F.; Lai, J.-J.; De Tommaso, J.; Pauletto, G.; Patience, G.S. Gas to Liquids Techno-Economics of Associated Natural Gas, Bio Gas, and Landfill Gas. Processes 2021, 9, 1568. [Google Scholar] [CrossRef]
- Anuwattana, R.; Khummongkol, P. Conventional Hydrothermal Synthesis of Na-A Zeolite from Cupola Slag and Aluminum Sludge. J. Hazard. Mater. 2009, 166, 227–232. [Google Scholar] [CrossRef]
- Vichaphund, S.; Wimuktiwan, P.; Soongprasit, C.; Sricharoenchaikul, V.; Atong, D. Aromatic and Aliphatic Production of Catalytic Pyrolysis of Lignin Using ZSM-5/Al-SBA-15 Catalyst Derived from High-Calcium Fly Ash. Energy Rep. 2021, 7, 232–247. [Google Scholar] [CrossRef]
- Kurniawan, T.A.; Lo, W.; Chan, G.Y.S. Radicals-Catalyzed Oxidation Reactions for Degradation of Recalcitrant Compounds from Landfill Leachate. Chem. Eng. J. 2006, 125, 35–57. [Google Scholar] [CrossRef]
- Kurniawan, T.A.; Lo, W.-H.; Chan, G.Y.S. Degradation of Recalcitrant Compounds from Stabilized Landfill Leachate Using a Combination of Ozone-GAC Adsorption Treatment. J. Hazard. Mater. 2006, 137, 443–455. [Google Scholar] [CrossRef]
- Taleb, A.; Maine, E.; Kjeang, E. Technical-Economic Cost Modeling as a Technology Management Tool: A Case Study of Membranes for PEM Fuel Cells. J. Manuf. Technol. Manag. 2014, 25, 279–298. [Google Scholar] [CrossRef]
- El-Gendi, A.; Abdallah, H.; Amin, A. Economic Study for Blend Membrane Production. Bull. Natl. Res. Cent. 2021, 45, 126. [Google Scholar] [CrossRef]
- Viegas, R.M.C.; Mesquita, E.; Campinas, M.; Rosa, M.J. Pilot Studies and Cost Analysis of Hybrid Powdered Activated Carbon/Ceramic Microfiltration for Controlling Pharmaceutical Compounds and Organic Matter in Water Reclamation. Water 2019, 12, 33. [Google Scholar] [CrossRef] [Green Version]
- Pera-Titus, M.; Llorens, J.; Tejero, J.; Cunill, F. Description of the Pervaporation Dehydration Performance of A-Type Zeolite Membranes: A Modeling Approach Based on the Maxwell–Stefan Theory. Catal. Today 2006, 118, 73–84. [Google Scholar] [CrossRef]
- Sekulic, J.; Elshof, J.; Blank, D. Separation Mechanism in Dehydration of Water/Organic Binary Liquids by Pervaporation through Microporous Silica. J. Membr. Sci. 2005, 254, 267–274. [Google Scholar] [CrossRef]
- Sanders, D.F.; Smith, Z.P.; Guo, R.; Robeson, L.M.; McGrath, J.E.; Paul, D.R.; Freeman, B.D. Energy-Efficient Polymeric Gas Separation Membranes for a Sustainable Future: A Review. Polymer 2013, 54, 4729–4761. [Google Scholar] [CrossRef] [Green Version]
- Hinchliffe, A.B.; Porter, K.E. Gas Separation Using Membranes. 1. Optimization of the Separation Process Using New Cost Parameters. Ind. Eng. Chem. Res. 1997, 36, 821–829. [Google Scholar] [CrossRef]
- Hinchliffe, A.B.; Porter, K.E. A Comparison of Membrane Separation and Distillation. Chem. Eng. Res. Des. 2000, 78, 255–268. [Google Scholar] [CrossRef]
- Porter, K.E.; Hinchliffe, A.B.; Tighe, B.J. Gas Separation Using Membranes. 2. Developing a New Membrane for the Separation of Hydrogen and Carbon Monoxide Using the Targeting Approach. Ind. Eng. Chem. Res. 1997, 36, 830–837. [Google Scholar] [CrossRef]
- Nayar, K.G.; Lienhard V, J.H. Brackish Water Desalination for Greenhouse Agriculture: Comparing the Costs of RO, CCRO, EDR, and Monovalent-Selective EDR. Desalination 2020, 475, 114188. [Google Scholar] [CrossRef] [Green Version]
- Zhai, H.; Rubin, E.S. Techno-Economic Assessment of Polymer Membrane Systems for Postcombustion Carbon Capture at Coal-Fired Power Plants. Environ. Sci. Technol. 2013, 47, 3006–3014. [Google Scholar] [CrossRef]
- Sethi, S.; Wiesner, M.R. Cost Modeling and Estimation of Crossflow Membrane Filtration Processes. Environ. Eng. Sci. 2000, 17, 61–79. [Google Scholar] [CrossRef]


Publisher’s Note: MDPI stays neutral with regard to jurisdictional claims in published maps and institutional affiliations. |
© 2022 by the authors. Licensee MDPI, Basel, Switzerland. This article is an open access article distributed under the terms and conditions of the Creative Commons Attribution (CC BY) license (https://creativecommons.org/licenses/by/4.0/).
Share and Cite
Gkika, D.A.; Filiz, V.; Rangou, S.; Kyzas, G.Z.; Mitrοpoulos, A.C. Cost Profile of Membranes That Use Polymers of Intrinsic Microporosity (PIMs). Membranes 2022, 12, 433. https://doi.org/10.3390/membranes12040433
Gkika DA, Filiz V, Rangou S, Kyzas GZ, Mitrοpoulos AC. Cost Profile of Membranes That Use Polymers of Intrinsic Microporosity (PIMs). Membranes. 2022; 12(4):433. https://doi.org/10.3390/membranes12040433
Chicago/Turabian StyleGkika, Despina A., Volkan Filiz, Sofia Rangou, George Z. Kyzas, and Athanasios C. Mitrοpoulos. 2022. "Cost Profile of Membranes That Use Polymers of Intrinsic Microporosity (PIMs)" Membranes 12, no. 4: 433. https://doi.org/10.3390/membranes12040433
APA StyleGkika, D. A., Filiz, V., Rangou, S., Kyzas, G. Z., & Mitrοpoulos, A. C. (2022). Cost Profile of Membranes That Use Polymers of Intrinsic Microporosity (PIMs). Membranes, 12(4), 433. https://doi.org/10.3390/membranes12040433